Embed Size (px)
Citation preview
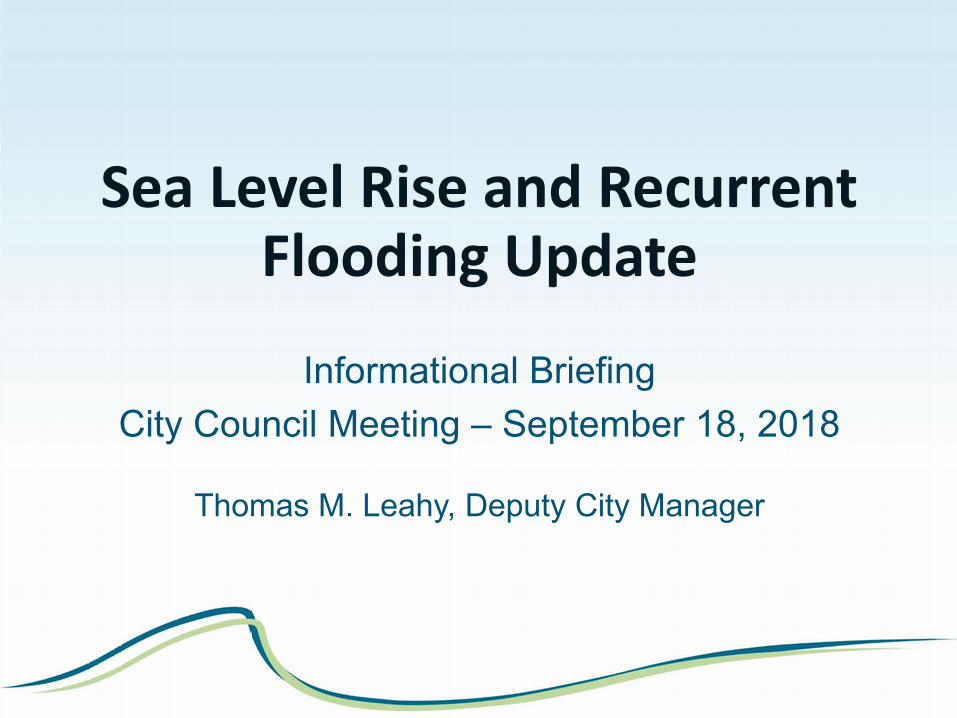
Sea Level Rise and Recurrent Flooding Update
Informational BriefingCity Council Meeting – September 18, 2018
Thomas M. Leahy, Deputy City Manager
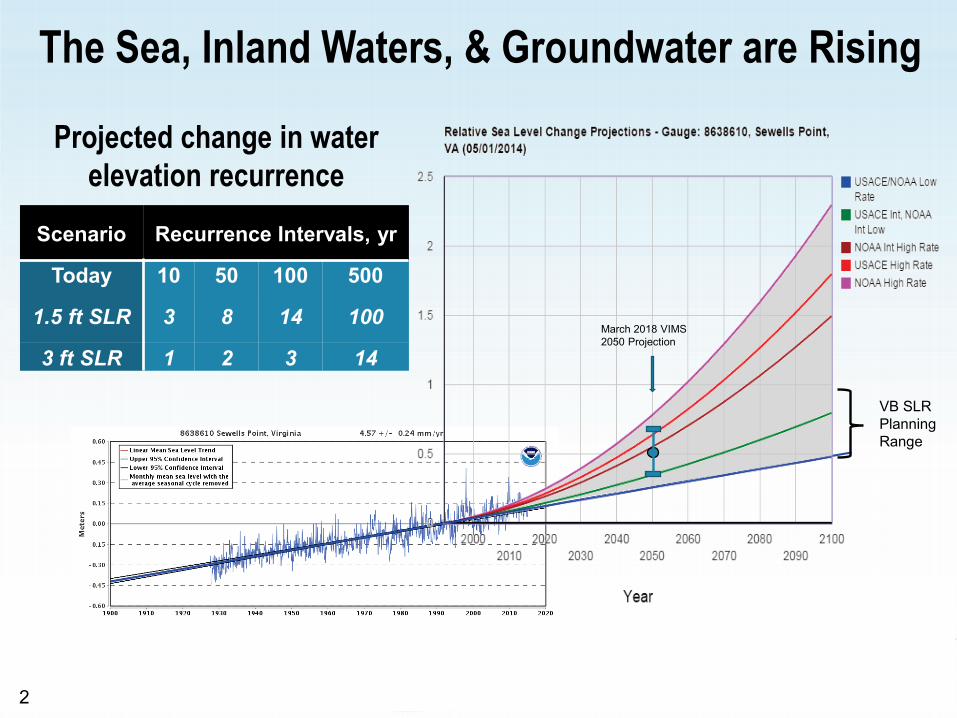
The Sea, Inland Waters, & Groundwater are Rising
VB SLR Planning Range
Projected change in water elevation recurrence
Scenario Recurrence Intervals, yr
Today 10 50 100 500
1.5 ft SLR 3 8 14 100
3 ft SLR 1 2 3 14March 2018 VIMS 2050 Projection
2
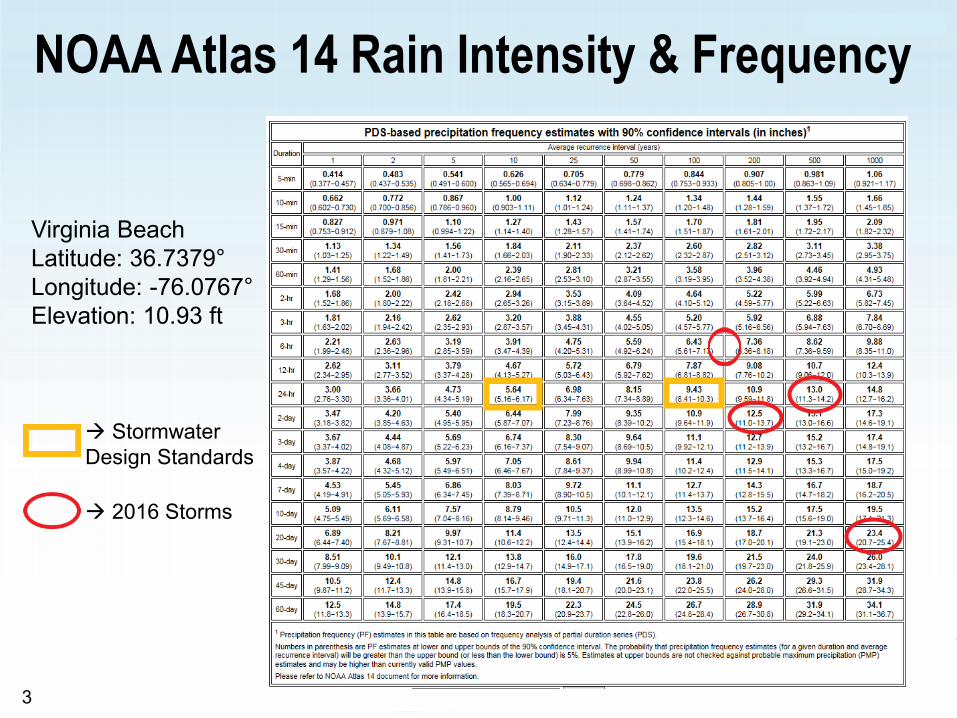
NOAA Atlas 14 Rain Intensity & Frequency
Virginia Beach Latitude: 36.7379°Longitude: -76.0767°Elevation: 10.93 ft
Stormwater Design Standards
2016 Storms
3
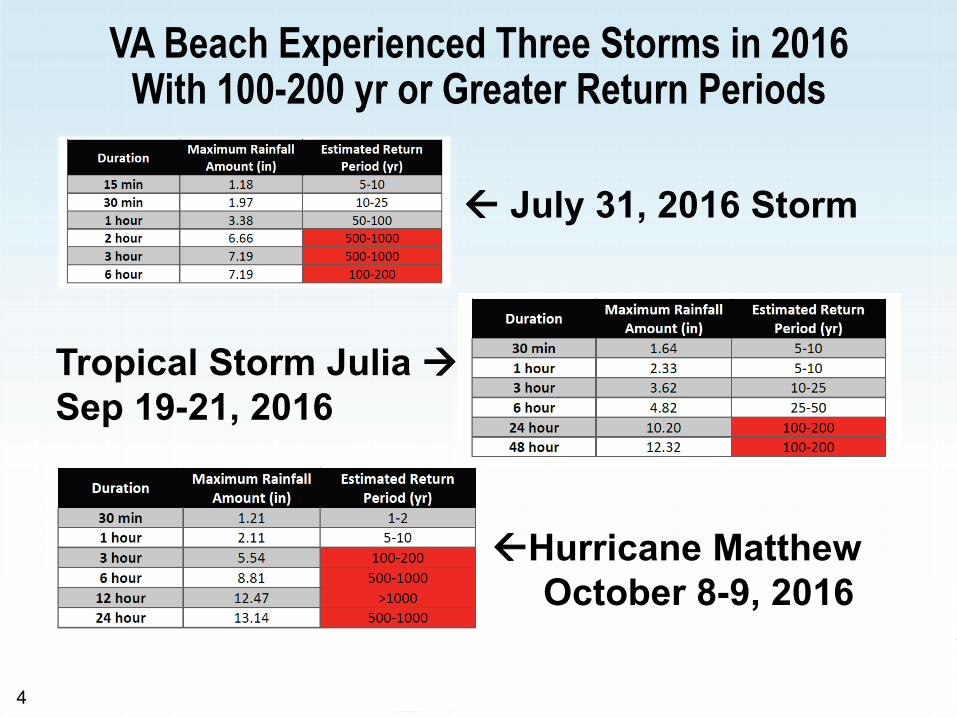
July 31, 2016 Storm
Tropical Storm Julia Sep 19-21, 2016
Hurricane MatthewOctober 8-9, 2016
VA Beach Experienced Three Storms in 2016 With 100-200 yr or Greater Return Periods
4
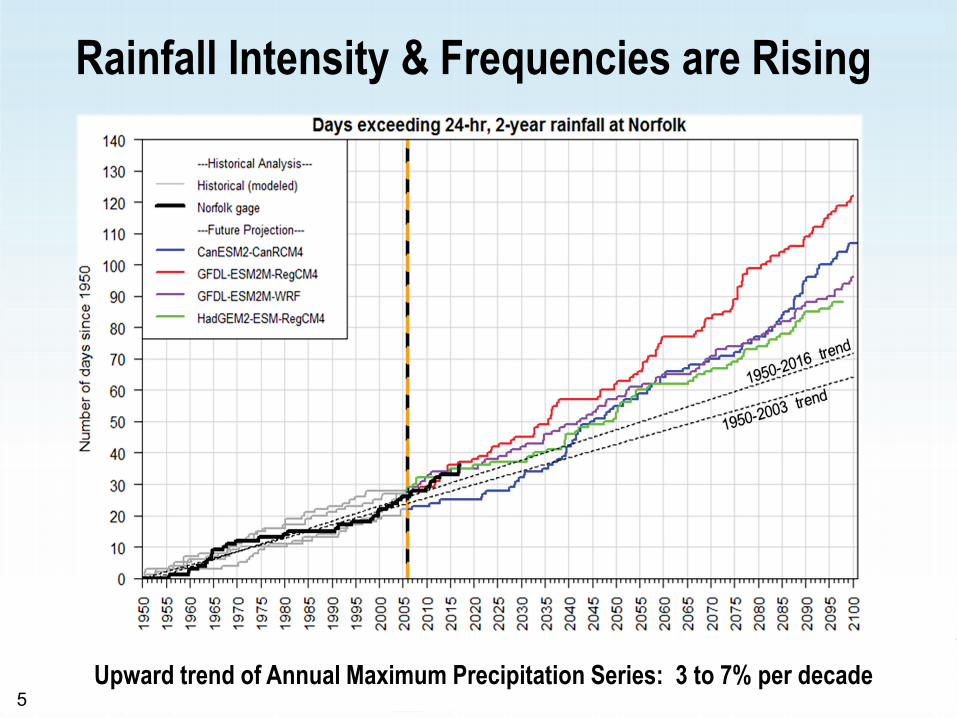
Rainfall Intensity & Frequencies are Rising
Upward trend of Annual Maximum Precipitation Series: 3 to 7% per decade5
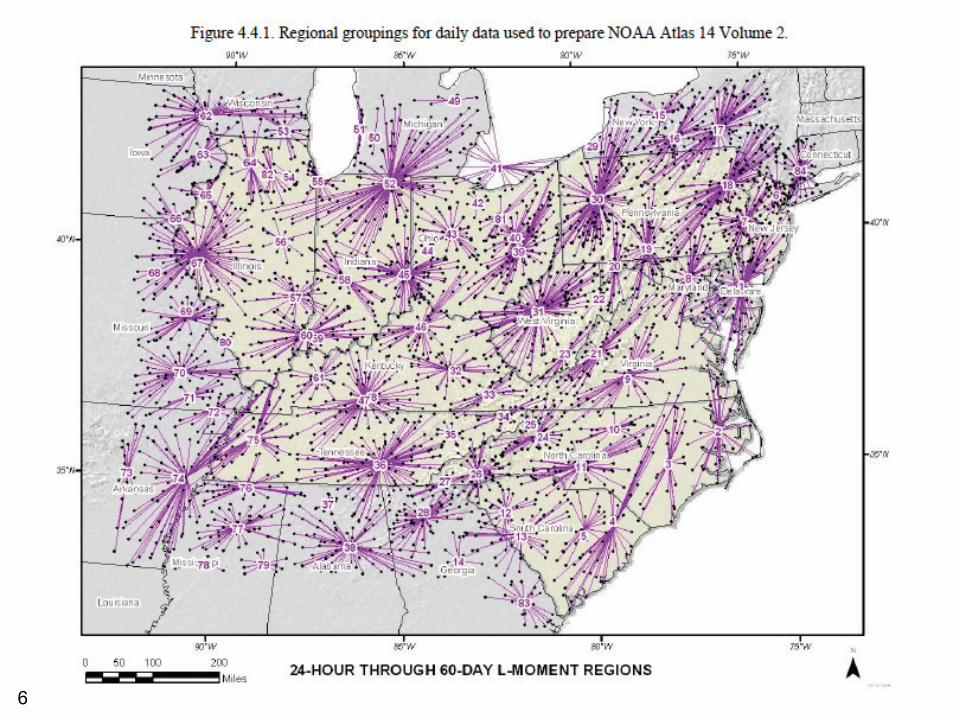
6
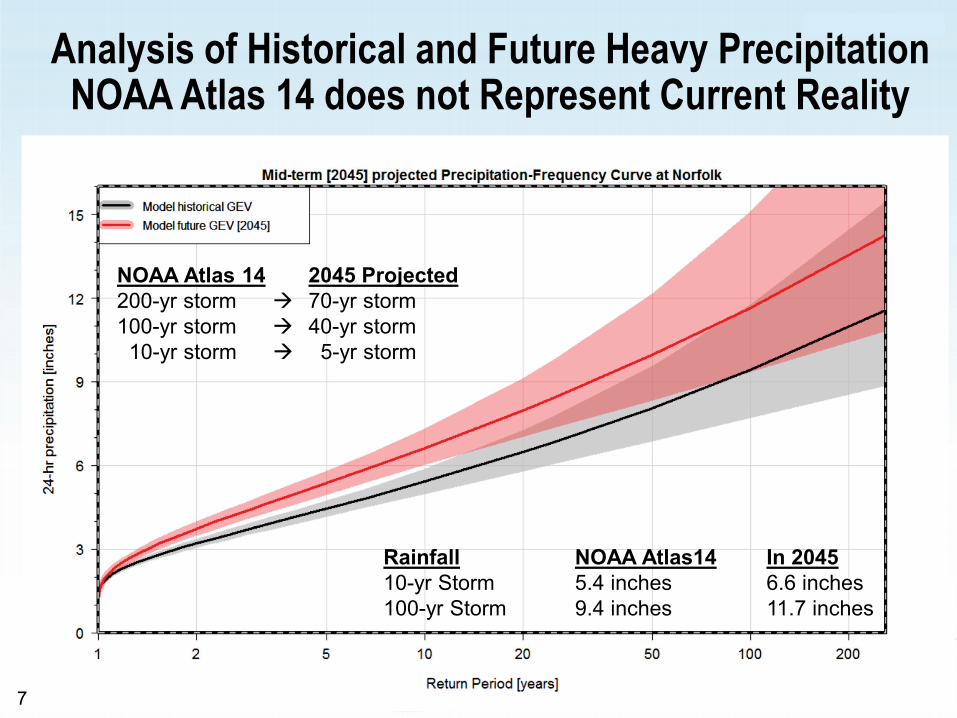
Analysis of Historical and Future Heavy PrecipitationNOAA Atlas 14 does not Represent Current Reality
Rainfall NOAA Atlas14 In 204510-yr Storm 5.4 inches 6.6 inches100-yr Storm 9.4 inches 11.7 inches
NOAA Atlas 14 2045 Projected200-yr storm 70-yr storm100-yr storm 40-yr storm
10-yr storm 5-yr storm
7
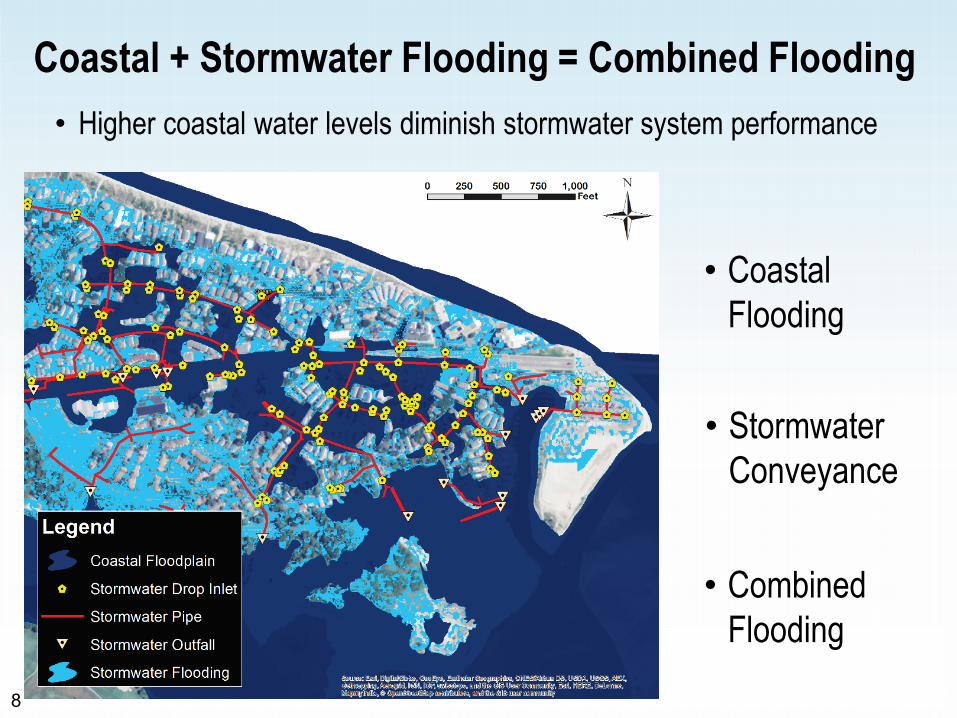
Coastal + Stormwater Flooding = Combined Flooding
• Stormwater Conveyance
• Combined Flooding
• Coastal Flooding
• Higher coastal water levels diminish stormwater system performance
8
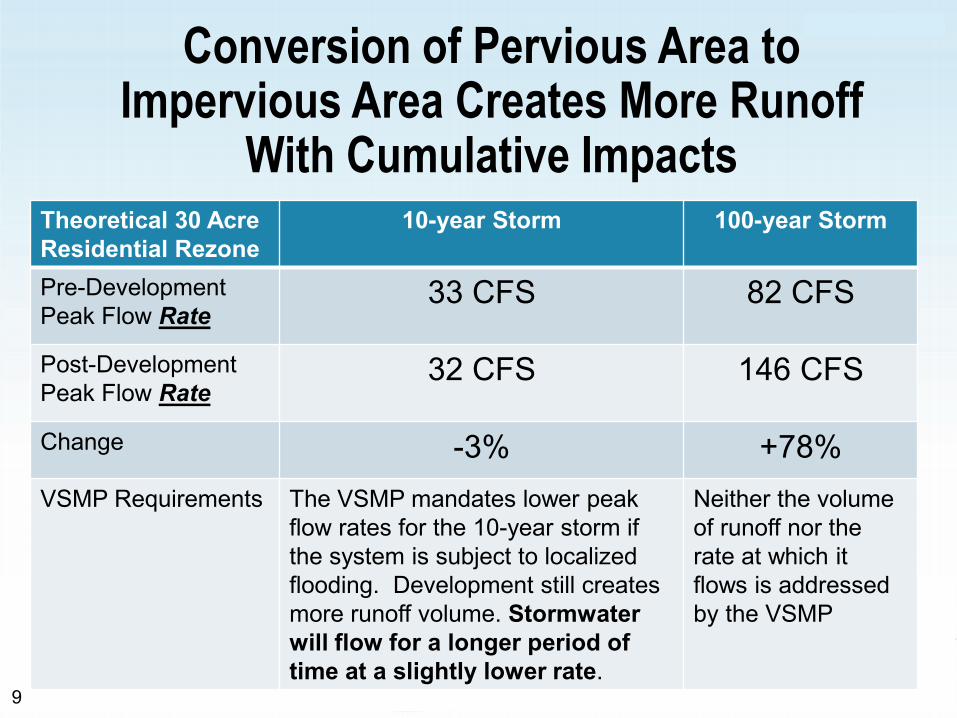
Conversion of Pervious Area to Impervious Area Creates More Runoff
With Cumulative Impacts Theoretical 30 Acre Residential Rezone
10-year Storm 100-year Storm
Pre-DevelopmentPeak Flow Rate
33 CFS 82 CFS
Post-DevelopmentPeak Flow Rate
32 CFS 146 CFS
Change -3% +78%VSMP Requirements The VSMP mandates lower peak
flow rates for the 10-year storm if the system is subject to localized flooding. Development still creates more runoff volume. Stormwater will flow for a longer period of time at a slightly lower rate.
Neither the volume of runoff nor the rate at which it flows is addressed by the VSMP
9
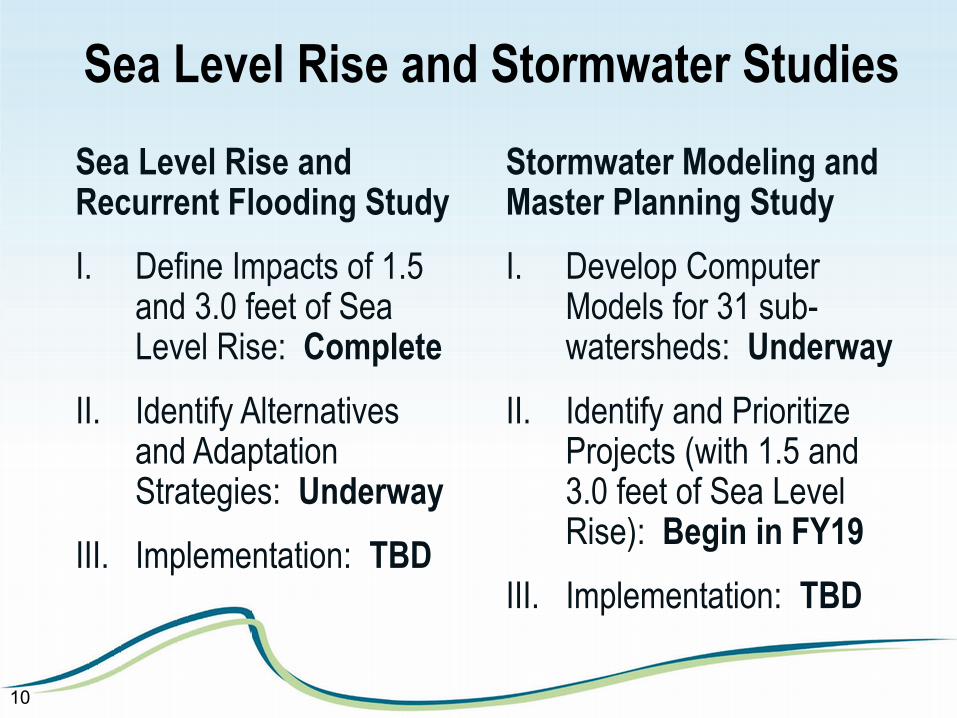
Sea Level Rise and Stormwater StudiesSea Level Rise and Recurrent Flooding StudyI. Define Impacts of 1.5
and 3.0 feet of Sea Level Rise: Complete
II. Identify Alternatives and Adaptation Strategies: Underway
III. Implementation: TBD
Stormwater Modeling and Master Planning StudyI. Develop Computer
Models for 31 sub-watersheds: Underway
II. Identify and Prioritize Projects (with 1.5 and 3.0 feet of Sea Level Rise): Begin in FY19
III. Implementation: TBD
10
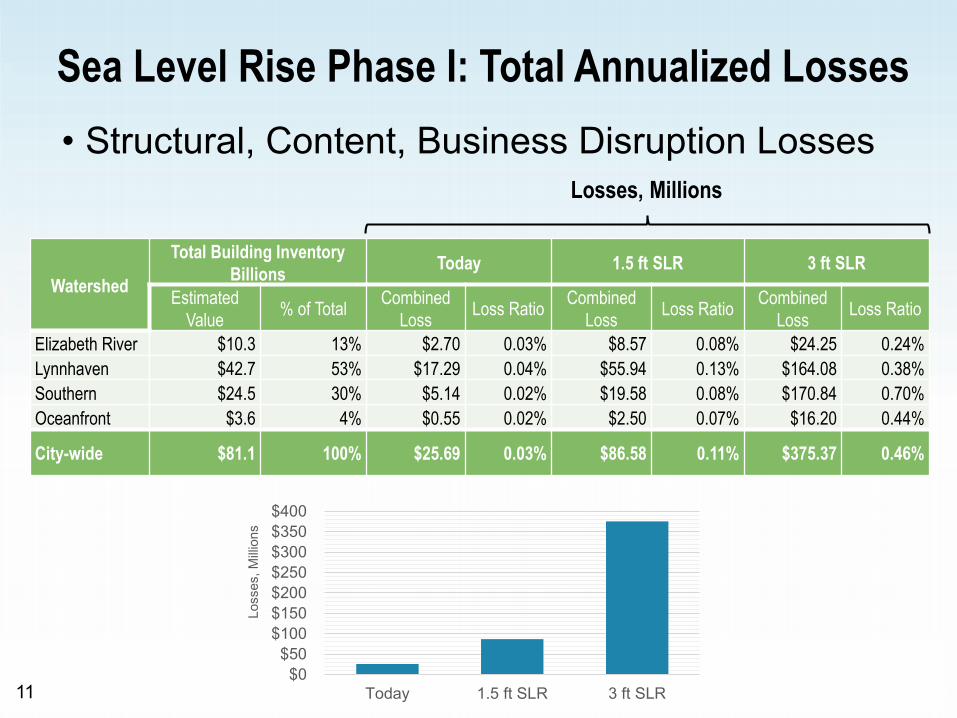
Sea Level Rise Phase I: Total Annualized Losses
Watershed
Total Building InventoryBillions Today 1.5 ft SLR 3 ft SLR
Estimated Value % of Total Combined
Loss Loss Ratio Combined Loss Loss Ratio Combined
Loss Loss Ratio
Elizabeth River $10.3 13% $2.70 0.03% $8.57 0.08% $24.25 0.24%Lynnhaven $42.7 53% $17.29 0.04% $55.94 0.13% $164.08 0.38%Southern $24.5 30% $5.14 0.02% $19.58 0.08% $170.84 0.70%Oceanfront $3.6 4% $0.55 0.02% $2.50 0.07% $16.20 0.44%
City-wide $81.1 100% $25.69 0.03% $86.58 0.11% $375.37 0.46%
• Structural, Content, Business Disruption LossesLosses, Millions
$0$50
$100$150$200$250$300$350$400
Today 1.5 ft SLR 3 ft SLR
Loss
es, M
illion
s
11
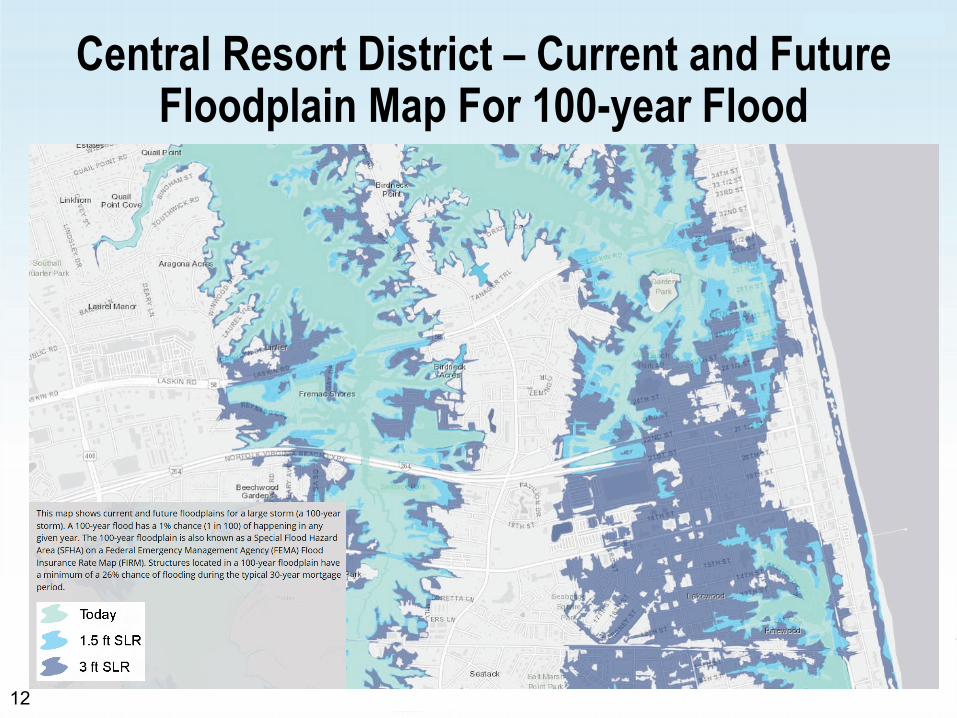
Central Resort District – Current and Future Floodplain Map For 100-year Flood
12
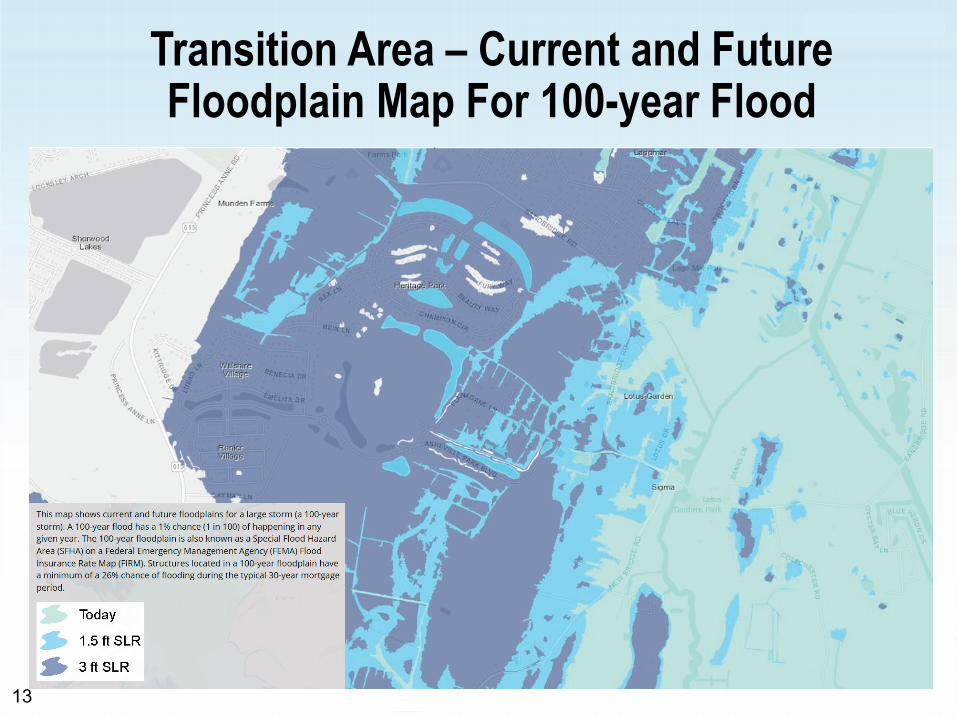
Transition Area – Current and Future Floodplain Map For 100-year Flood
13
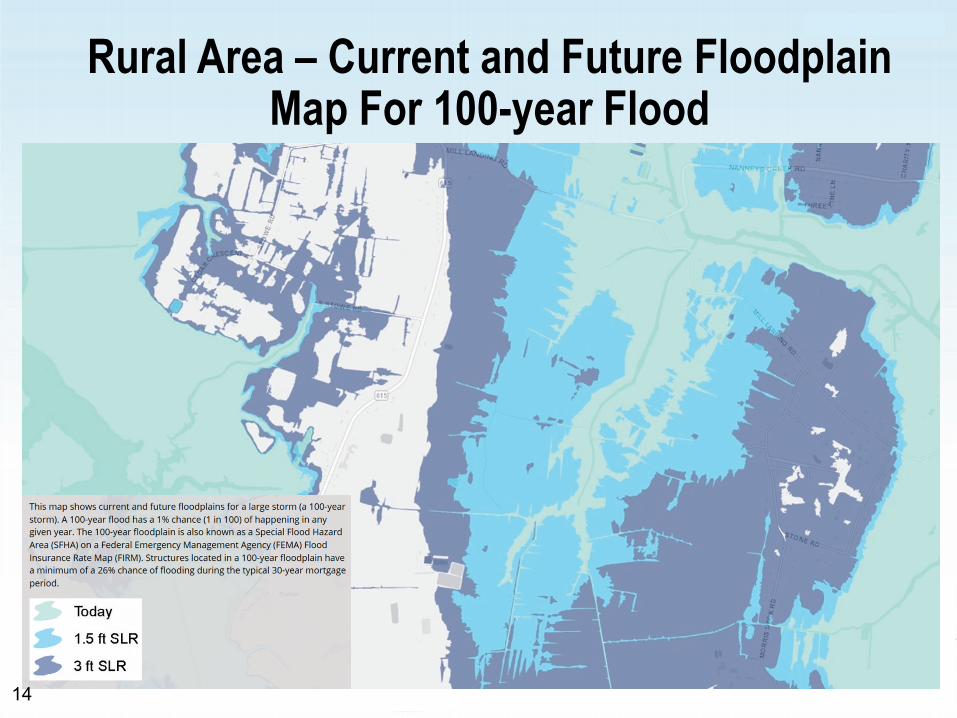
Rural Area – Current and Future Floodplain Map For 100-year Flood
14
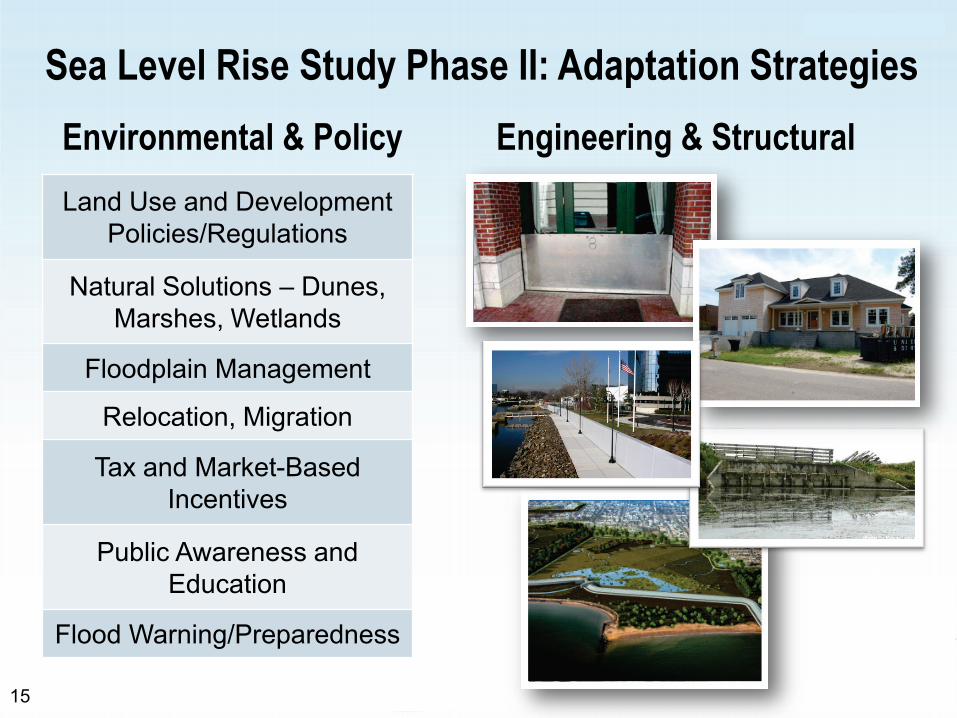
Sea Level Rise Study Phase II: Adaptation StrategiesEnvironmental & Policy Engineering & StructuralLand Use and Development
Policies/Regulations
Natural Solutions – Dunes,Marshes, Wetlands
Floodplain Management
Relocation, Migration
Tax and Market-Based Incentives
Public Awareness and Education
Flood Warning/Preparedness
15
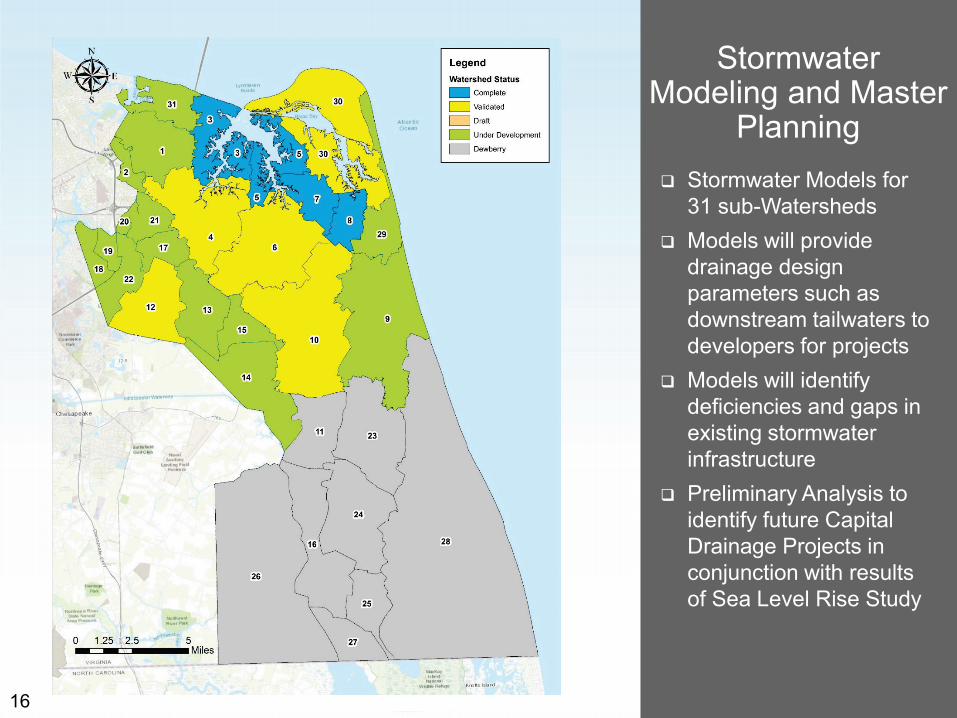
Stormwater Modeling and Master
Planning Stormwater Models for
31 sub-Watersheds Models will provide
drainage design parameters such as downstream tailwaters to developers for projects
Models will identify deficiencies and gaps in existing stormwater infrastructure
Preliminary Analysis to identify future Capital Drainage Projects in conjunction with results of Sea Level Rise Study
16
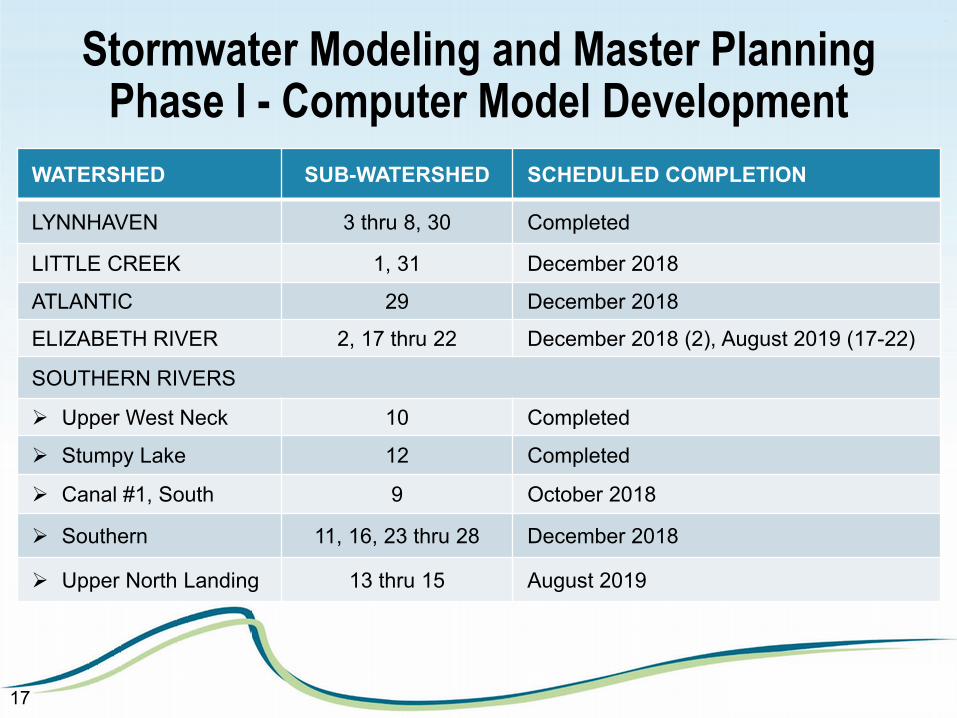
Stormwater Modeling and Master PlanningPhase I - Computer Model Development
WATERSHED SUB-WATERSHED SCHEDULED COMPLETION
LYNNHAVEN 3 thru 8, 30 Completed
LITTLE CREEK 1, 31 December 2018
ATLANTIC 29 December 2018
ELIZABETH RIVER 2, 17 thru 22 December 2018 (2), August 2019 (17-22)
SOUTHERN RIVERS
Upper West Neck 10 Completed
Stumpy Lake 12 Completed
Canal #1, South 9 October 2018
Southern 11, 16, 23 thru 28 December 2018
Upper North Landing 13 thru 15 August 2019
17
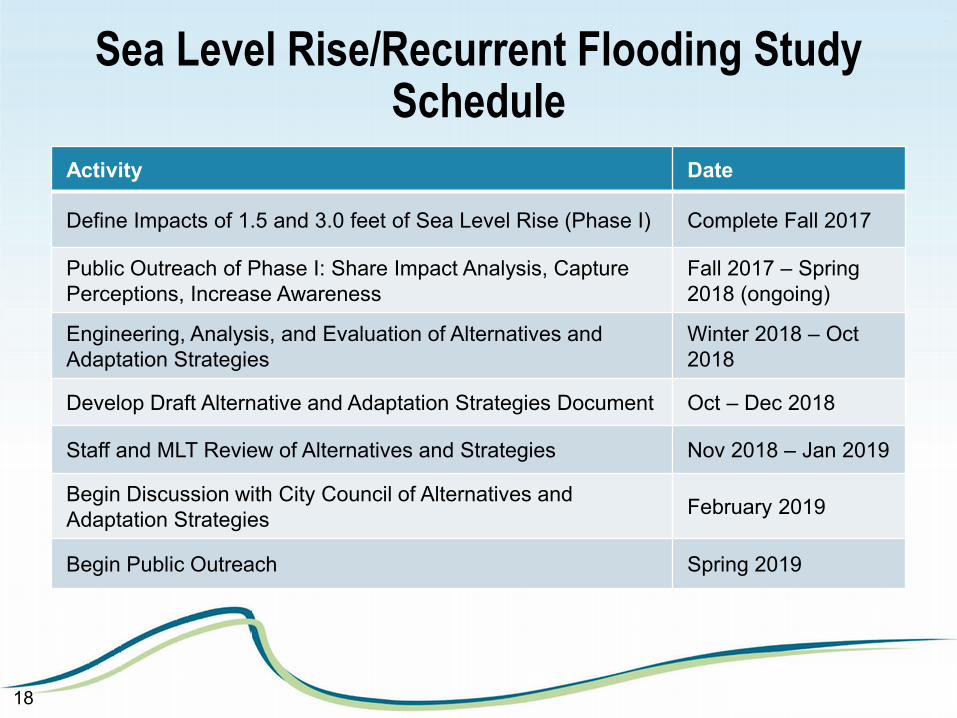
Sea Level Rise/Recurrent Flooding Study Schedule
Activity Date
Define Impacts of 1.5 and 3.0 feet of Sea Level Rise (Phase I) Complete Fall 2017
Public Outreach of Phase I: Share Impact Analysis, Capture Perceptions, Increase Awareness
Fall 2017 – Spring 2018 (ongoing)
Engineering, Analysis, and Evaluation of Alternatives and Adaptation Strategies
Winter 2018 – Oct2018
Develop Draft Alternative and Adaptation Strategies Document Oct – Dec 2018
Staff and MLT Review of Alternatives and Strategies Nov 2018 – Jan 2019
Begin Discussion with City Council of Alternatives and Adaptation Strategies February 2019
Begin Public Outreach Spring 2019
18
Questions?
19