Embed Size (px)
Citation preview
Searching for the Profit in PollutionPrevention: Case Studies in theCorporate Evaluation of EnvironmentalOpportunities
James Boyd
Discussion Paper 98-30
May 1998
1616 P Street, NWWashington, DC 20036Telephone 202-328-5000Fax 202-939-3460
© 1998 Resources for the Future. All rights reserved.No portion of this paper may be reproduced withoutpermission of the author.
Discussion papers are research materials circulated by theirauthors for purposes of information and discussion. Theyhave not undergone formal peer review or the editorialtreatment accorded RFF books and other publications.
ii
Searching for the Profit in Pollution Prevention: Case Studies in theCorporate Evaluation of Environmental Opportunities
James Boyd
Abstract
The concept of pollution prevention, or "P2," signifies a new, proactive environmentalmindset that targets the causes, rather than the consequences, of polluting activity. Whileanecdotal evidence suggests that P2 opportunities exist and that many have been pursued,there is also the perception that the pace of P2 is far too slow. To explore that claim--and toshed light on barriers to P2 innovation--this paper presents case studies of industrial P2projects that were in some way unsuccessful. While based on a very limited sample, theevidence contradicts the view that firms suffer from organizational weaknesses that makethem unable to appreciate the financial benefits of P2 investments. Instead, the projectsfoundered because of significant unresolved technical difficulties, marketing challenges, andregulatory barriers. Based on evidence from the cases, the paper concludes with a discussionof environmental policy reforms likely to promote P2 innovation.
Key Words: pollution prevention, financial evaluation, environmental accounting
JEL Classification Nos.: Q2, L65, O33
iii
Table of Contents
1. Introduction .............................................................................................................................. 12. Design of the Study .................................................................................................................. 43. The Cases ................................................................................................................................. 5
Dow ......................................................................................................................................... 6The Facility ....................................................................................................................... 6The Pollution Prevention Opportunity ............................................................................... 6Process Changes Associated with TOX Elimination .......................................................... 6The Preliminary Financial Analysis ................................................................................... 7Why Has the TOX Elimination Project Not Been Pursued? ............................................... 8
Technical Uncertainties .............................................................................................. 8Regulatory Uncertainties .......................................................................................... 11The Option Value of Continued TOX Operation ...................................................... 12
Other Organizational and Strategic Issues ....................................................................... 14Monsanto ............................................................................................................................... 16
The Product .................................................................................................................... 16The Pollution Prevention Opportunity ............................................................................. 16ADPA Today .................................................................................................................. 17Changing Markets and the Corporations' Strategic Goals ................................................. 17Capital Rationing and ADPA's Impact on the Business Unit ............................................ 19What's Wrong With a 10 percent Return on Capital? ....................................................... 19Disentangling ADPA from the Rubber Chemicals Business ............................................. 21ADPA's Commercial Development ................................................................................. 24Environmental Accounting .............................................................................................. 24
DuPont ................................................................................................................................... 26The Product .................................................................................................................... 26The Pollution Prevention Opportunity ............................................................................. 26DuCare Today ................................................................................................................. 28Why Has Demand for the DuCare System Been Relatively Weak? .................................. 28
A non-environmental cost comparison ..................................................................... 29The environmental comparison ................................................................................ 30
Regulatory Pressure and the Market for P2 ...................................................................... 31A Regulatory Barrier ....................................................................................................... 32
4. Information and the Financial Evaluation of Pollution Prevention Opportunities ..................... 34Are Environment-related Financial Benefits Being Captured Appropriately by theDecision-making Process? ...................................................................................................... 34
The Quantification of Environment-related Financial Benefits ......................................... 34The Effect of Uncertain Financial Benefits on Decision-making ...................................... 36
Are Firms Missing Win-Win Pollution Prevention Opportunities ............................................ 36Information Barriers and the Search for Clear Financial Benchmarks of P2 Profitability ......... 37
The Rate of Return .......................................................................................................... 38Risk and the Cost of Capital ............................................................................................ 39Capital Rationing ............................................................................................................ 40
5. Conclusion: Pollution Prevention and Public Policy ................................................................ 42References ...................................................................................................................................... 45Table 1. Summary of the Characteristics of DuCare ........................................................................ 30
1
SEARCHING FOR THE PROFIT IN POLLUTION PREVENTION:CASE STUDIES IN THE CORPORATE EVALUATION OF
ENVIRONMENTAL OPPORTUNITIES
James Boyd*
1. INTRODUCTION
For the last 25 years environmental regulation and private sector environmentalmanagement have focused on end-of-pipe emission reductions and remediation of existingsoil, air, and water pollution problems. This "compliance-driven" approach to regulation waslargely dictated by the scope of environmental problems left by decades of relativelyunhindered industrial production and the urgency of legal and institutional reforms needed tofoster improvements. With significant environmental improvements, however, has come agreater emphasis on more forward-looking and flexible environmental strategies. Instead ofreacting to pollution that is about to be (or already is) released to the environment, regulatorsand the private sector are turning to environmental strategies that target the causes, rather thanthe consequences, of polluting activity. "Pollution prevention" (P2) is at the heart of this newprospective mindset. Pollution prevention seeks the most direct resolution of environmentalproblems--the elimination of pollutants via source reduction or recycling before treatment ordisposal become issues.
Pollution prevention is a challenge for the private sector because it requires diverseforms of innovation. Pollution prevention can require the redesign of products, thereconfiguration of manufacturing processes, and the realignment of supplier and customerrelationships. Because innovation is difficult, often costly, and inherently uncertain, firmsmust also find new ways of integrating environmental concerns into the corporate planningprocess. This paper seeks to illuminate the way in which firms are confronting thesechallenges. Through the use of case studies, the paper provides a window into the corporateevaluation of opportunities for P2 innovation.
The way in which the private sector approaches pollution prevention is pertinent to alarge set of ongoing environmental policy debates. Calls for pollution prevention are at thecenter of a broad regulatory and corporate movement. Information-based programs such asthe Toxics Release Inventory and experiments with flexible regulation, such as thoseassociated with the Common Sense Initiative and Project XL, are united by their ultimate goal
* Fellow, Energy and Natural Resources Division, Resources for the Future. This research was funded by theOffice of Pollution Prevention and Toxics, United States Environmental Protection Agency. Special thanks aredue Susan McLaughlin (EPA), Bill Bilkovich, Ric Olson (Dow), Max McCombs (Solutia), Larry McCune(Flexsys), and Daniel Juers (DuPont) for their invaluable assistance in providing information and defining theissues addressed by this study.
James Boyd RFF 98-30
2
of pollution prevention.1 Within the private sector, there is talk of "sustainable corporateenvironmental management," which inevitably centers on firms' ability to prevent, rather thantreat or dispose of waste.2 A commonly expressed belief within this movement is thatpollution prevention is a "win-win" corporate strategy. In this view, innovation and new waysof thinking will lead to waste reduction, and at the same time, make firms money by reducingcosts or stimulating new products.3
Pollution prevention, cast as both a corporate and an environmental benefit, hasignited hope in less adversarial environmental regulation. It has also created optimism in theprivate sector's ability to come up with low-cost solutions to their environmental problems.Unfortunately, the vision of pollution prevention as a set of win-win opportunities issomewhat at odds with perceptions of actual corporate behavior. While anecdotal evidencesuggests that win-win opportunities exist, and have been pursued by many firms, there issome frustration that the pace of change is inadequate.
The idea that pollution prevention can save firms money, but that they neverthelessneglect these opportunities, colors debate over regulatory reforms geared toward pollutionprevention. For some, it calls into question the desirability of regulatory reforms oftenassociated with pollution prevention, such as regulatory flexibility. If firms cannot be countedon to make environmental improvements that save them money, the argument goes, then onlythe blunt instrument of command and control regulation can be counted on to get the jobdone.4 Others undoubtedly consider failures to invest in profit-making pollution prevention afurther example of corporate environmental intransigence.
Another line of thinking holds that "organizational barriers" account for firms' failure tobe aware of and pursue win-win investments. Organizational barriers may arise, for example,
1 The Pollution Prevention Act of 1990 was the first federal legislation geared toward fostering this new way ofthinking. It has been accompanied by state-led legislation and programs and calls for further federal legislation.These statutory approaches are diverse, but they all attempt to motivate pollution prevention via a combinationof information disclosure, mandatory prevention planning, and voluntary commitments. For an overview of thehistory and current status of the pollution prevention movement, see EPA (1997). Another good summarydocument is Freeman, et al. (1992).2 DuPont claims that over the last 10 years the company has shifted its environmental technology effort from 85percent investment in pollution control to 60-70 percent investment in "green" products and pollution prevention(Pelley, 1997, 138).3 Barry Commoner expresses the view as follows: "The strategy of prevention cures the conflict betweenenvironmental quality and economic development that is inherent in the control strategy ... Properly designed,the productive investments engendered by the strategy of prevention could trigger a much-needed economicrenaissance" (Commoner, 1994, 217).4 One analysis of waste reduction at chemical plants concluded that waste reduction was brought about in somecases only when required by regulation to do so, but that the plants found the measure to be "cost-effective oncein practice" (Sarokin et al., 1985). This type of result suggests that command and control regulations, in somecases, lead to both lower private sector costs and improved environmental quality and that private sectormanagers were unable to identify the opportunity themselves. For a recent study with a similar overall perspective , see the NRDC study referred to in section 3 of this paper(Greer and van Loben Sels, 1997).
James Boyd RFF 98-30
3
due to information barriers, accounting-based distortions, or inappropriate managerial incentiveschemes.5 The policy implications of this perspective point toward regulatory assistance orrequirements focused on internal management and accounting processes.
For their part, corporate environmental managers tend to be more skeptical of pollutionprevention's profitability.6 They point to regulatory barriers that reduce the financial incentiveto change production processes or introduce new products with uncertain regulatory mandates.
Much of this debate hinges on whether pollution prevention can actually be countedon to save firms money. Consider the implications of evidence that companies fail to pursuepollution prevention opportunities that would profit them. First, this evidence would lendcredence to the argument that regulations should mandate pollution prevention.7 Second, itwould point toward the need to reform private sector capital budgeting, accounting, andenvironmental management techniques to overcome organizational barriers to P2. If, on theother hand, pollution prevention's economic benefits are overstated, a different set of issuesarises for regulators and firms. If firms do not pursue pollution prevention because it issimply not profitable to do so, attention should be focused on factors that contribute to thedifficulty, cost, and benefit of implementing P2 innovations. Perhaps environmental costs arenot being adequately imposed on the firms creating them. Perhaps technical assistance andgovernment R&D could be used to lower technical barriers. Or perhaps regulatory reformsshould be used to lower regulatory barriers to P2 product and process changes.
These issues are of central importance to the future of environmental regulation.Unfortunately, very little is known about why--in the real world--firms pursue or do notpursue pollution prevention opportunities. The case studies presented in this paper seek to fillthat void by analyzing real-life pollution prevention investment decisions. The first two casesdeal with investments that did not survive their firms' capital budgeting process. The thirdinvolves difficulties associated with a pollution prevention product being marketed to a largegroup of commercial customers (who themselves are deciding whether to invest in pollutionprevention). With the cases, the study hopes to shed light on private sector environmentaldecision-making. In turn, this will shed light on the ways in which public policy can bestpromote pollution prevention.
5 As an example, Porter (1995, 131) suggests that assignment of environmental issues to corporate departmentswithout full profit responsibility leads to excessively narrow and incremental decisions. He also suggests thatfirms use inappropriately high hurdle rates to screen environmental investments.6 Evidence on the profitability of P2 opportunities is decidedly mixed. For instance, an EnvironmentalProtection Agency study (EPA, 1992) evaluated a broad set of source reduction options at a large-scalepetroleum refinery. Most of the options were found to have negative rates of return and only one had a rate ofreturn higher than the historical rate of return for projects at the refinery. This type of evidence runs counter tothe hope that there are plentiful, undiscovered, win-win P2 opportunities. However, the EPA also has been ableto develop an extensive of set case studies depicting P2 successes. For examples see the EnvironmentalAccounting Project's web site (www.epa.gov/opptintr/acctg).7 The state of New Jersey has pioneered mandatory P2 planning. A study of New Jersey's experience suggeststhat mandatory planning leads to more ambitious corporate P2 goals and can help reveal opportunities for costsavings (Natan, et al., 1996).
James Boyd RFF 98-30
4
2. DESIGN OF THE STUDY
The study centers on pollution prevention initiatives at three different firms, all globalchemical manufacturers headquartered in the United States. A particular type of businessactivity was sought for analysis.
First, the investment or product marketing effort had to involve a pollution preventionopportunity. Pollution prevention was defined as a new product or process that allowed forpollutant source reductions or that involved in-process recycling. Environmental benefits hadto come from these types of innovations, not from new disposal or treatment methods.
Second, the investment or marketing opportunity had to be promising enough to beevaluated by the firms themselves. More specifically, the opportunity had to involve not onlytechnical, but also financial, analysis. The financial analysis is critical. Even if a pollutionprevention technology passes muster in engineering labs or environmental health and safetymeetings, it will not succeed in a practical sense unless it survives a firm's strategic analysisand capital budgeting process. Strategic and financial analysis is the key corporate decision-making nexus. It is the decision-making activity during which the widest variety of internalcorporate expertise is brought to bear to evaluate costs, rewards, and risks. What types ofinformation are collected? How is the information used? Since investment analysis is theprincipal information-processing function of a corporation, firms' investment analyses are thebest place to look for answers.
Third, the investments or product had to be in some way "unsuccessful." That is, thefirms chose to not invest in the product or process changes, or investment was significantlydelayed, pending the resolution of market, technical, or regulatory uncertainties. For thepurposes of this project, unsuccessful P2 opportunities are of greatest interest because theyallow us to focus on the corporate rationale for not making P2 investments.
Fourth, the study sought projects with a capital, technical, or marketing "scale"sufficient to ensure a certain degree of complexity to the decision. P2 opportunities on asmaller scale (e.g., equipment purchases, certain chemical substitutions, general shop-floorhousekeeping) are important, and may be easier to achieve, but lack the complex range offactors that impact large-scale business decisions.
Finally, the analysis required the participating firms to provide detailed, oftenproprietary, data on the investments considered. Only with this level of detail was a fullportrayal of the decisions possible.
The cases open a window onto business decision-making generally, and environmentaldecision-making specifically. They allow for a deeper understanding of the relationshipbetween pollution prevention and corporate profitability. It should be noted, of course, thatthree, non-randomly selected cases cannot be used to draw broad policy or empiricalconclusions. Instead, they should be viewed as a lesson on the practical challenges facingprivate sector managers. Regulators, policymakers, and other corporate managers canpresumably benefit from a better practical understanding of corporate P2 decision-making.The cases shed light on the following types of questions. Are firms really passing upopportunities that save them money? Do firms' current financial and accounting practices
James Boyd RFF 98-30
5
treat environmental investments differently from other investments? What hurdles must P2investments clear? Do firms evaluate P2 opportunities in a defensible manner, or are therepersistent organizational biases against P2, perhaps due to inappropriate accountingprocedures or incentive schemes? The cases reveal the kinds of technical, regulatory, andinformational issues that are likely to face any firm contemplating P2 innovations.
The paper is organized as follows. The next section presents the three case studies.Section 4 draws more general lessons from the cases, and in particular focuses on the effect ofinformation constraints on P2 decision-making. Section 5 concludes and addresses thequestion of how regulation and public policy can best promote private sector pollutionprevention.
3. THE CASES
This section presents three case studies of pollution prevention decision-making. Thethree firms whose P2 initiatives were analyzed are, in order of presentation, Dow Chemical,Monsanto, and DuPont.
James Boyd RFF 98-30
6
DOW
The Facility
The Dow facility, part of its polyurethane business, is a chemicals manufacturing plantlocated in La Porte, Texas, with annual revenues that exceed $350 million per year. The facilitymanufactures methylene diamine diisocyanate (MDI), the primary input to polyurethane foamand thermoplastic products. Based on TRI reporting data, the plant's emissions are primarily tothe air, with smaller amounts being released to water.
The plant releases roughly 300,000 pounds of waste and incinerates, in a thermaloxydizing unit (TOX), roughly 2.5 million pounds of TRI-reported waste annually. Theprincipal constituents of the incinerated waste stream are phosgene, methanol, andmonochlorobenzene (MCB).
The Pollution Prevention Opportunity
In 1995 and 1996 Dow participated in a collaborative study with the NaturalResources Defense Council to identify pollution prevention opportunities at the La Porteplant. Assisted by an expert in the identification of P2 opportunities, the Dow-NRDC projectidentified an opportunity for in-process recycling of MCB. MCB recycling isenvironmentally beneficial since the incineration of MCB creates "products of incompletecombustion." Recycling would eliminate these emissions. The quantity of emissions avoidedwas not quantified by the study, but was assumed to be environmentally significant.
This environmental "win" is accompanied by a potential economic "win" for Dow.The ability to recycle--rather than incinerate--MCB creates the possibility that the facility'sincinerator can either be shut down or removed from its status as a RCRA-regulated boiler.8
Retirement of the incinerator would eliminate some operating costs. However, the primarybenefit derives from avoidance of incinerator retrofitting costs associated with new MACTand particulate standards expected to be issued in 1999 or 2000. Shut-down, or theincinerator's conversion to a non-RCRA unit, would allow Dow to avoid millions inincinerator upgrade costs associated with these new, tougher standards.
Process Changes Associated with TOX Elimination
The recycling of MCB is a necessary, but not sufficient, condition for the eliminationof the La Porte incinerator. A complicating factor is that a variety of waste streams areincinerated in the TOX.9 TOX shutdown requires new forms of disposal for the non-MCBwastes otherwise sent to the TOX. In other words, the economic benefit of recycled MCB--
8 Note that there is an "extreme" TOX option--total shutdown--and an "intermediate" option--conversion to non-RCRA status. The intermediate option creates a broader set of technical options for the firm. Specifically, theTOX could remain a viable disposal alternative for wastes that do not have a RCRA designation.9 In addition to MCB, the TOX incinerates, in measurable quantities, methanol, phenyl isocyanate, phosgene,carbon monoxide, carbon tetrachloride, and chloroform.
James Boyd RFF 98-30
7
TOX retirement--is contingent on the technical feasibility and cost of a host of other processchanges. As an example, consider the phosgene waste stream. If not incinerated in the TOX,phosgene must be source-reduced, treated via scrubber, or recycled. Each of these optionspresents unique technical challenges, has uncertain costs, and may create regulatory issues.All of these must be evaluated in order to determine the costs and feasibility of diverting thatsingle waste stream from the TOX.
The Dow-NRDC group realized that TOX elimination was the primary, but not theonly, potential source of financial benefit.10 While recycled MCB was the pollutionprevention opportunity, TOX elimination was the economic driver. The study group thereforetargeted a "TOX elimination project" for analysis. This project was mirrored by a BusinessOpportunity Plan (BOP) initiated by Dow to evaluate the project's technical, economic, andregulatory feasibility.
From a business standpoint, recycled MCB alone is not a win-win opportunity. Awin-win investment is possible only if MCB is recycled and the other TOX waste streams aresource-reduced, recycled, or diverted to other modes of disposal. It is this "bundle" of processchanges that Dow must evaluate financially. The MCB recycling option cannot be analyzedfinancially without a technical, financial, and regulatory analysis of the other waste streamsdiverted from the TOX. This may seem obvious, but it is a point worth emphasizing.
In complex manufacturing operations, even a relatively small pollution preventionprocess change may require changes in a whole set of interrelated processes. If so,the pollution prevention option cannot be analyzed financially without a technical,financial, and regulatory analysis of these other required process changes.
Financial analysis of the TOX elimination project requires estimation of the aggregate costs ofall waste stream process changes.
The Preliminary Financial Analysis
In 1996 Dow's polyurethane business was presented with a financial analysisassociated with the P2 project. Cash flows were estimated for several options, includingcontinued use of the TOX for all existing waste streams, continued use of the TOX but withremoval of RCRA waste streams, and total TOX elimination.11 Sound managerial accountingtechniques were employed: The accounting exercise featured standard discounting methods, a10-year time horizon, an estimated dollar benefit associated with avoided repermitting costs,
10 Note the following terminological convention used in this analysis. "Environmental benefits" denotebeneficial changes in environmental quality brought about by a process or product change, or other decision."Financial benefits" relate to the dollar value of those changes to the firm itself. For example, environmentalbenefits can create financial benefits by reducing a firm's expected liability costs.11 These cash flow estimates were derived using the expertise of engineers at La Porte, as well as regulatory andengineering personnel at Dow headquarters.
James Boyd RFF 98-30
8
and the inclusion of a relatively rich set of capital items associated with processreconfiguration.
The results of the financial analysis were encouraging in at least one respect.Depending on assumptions, rates of return for the MCB-recycle and TOX elimination optionwere estimated to be as high as 70 percent. Even more encouraging from a financialstandpoint was the RCRA declassification option. This option had an estimated 135 percentrate of return, though keeping the TOX in non-RCRA operation was acknowledged as anenvironmental negative. While the recommendation of the La Porte site's management teamwas to pursue RCRA declassification, headquarters management never considered this to be aserious option due to its questionable environmental implications.
When presented with the options, more senior management opted to delay a decisionon the project. The reasoning behind this decision is explored in greater depth below. Beforedoing so, however, it deserves emphasis that the cash flow estimates in the existing financialanalysis are very preliminary. While sound accounting techniques were employed, the costestimates are highly speculative. Thus, the principal value of the firm's preliminary financialanalysis is that it identifies technical and regulatory issues that the firm must still resolve. Itsvalue as an accurate prediction of the project's expected value is much smaller.
Why Has the TOX Elimination Project Not Been Pursued?
Dow's polyurethane business group has considered and rejected the investmentproposal twice. Why? Given the strongly positive rate of return estimate from Dow's internalfinancial analysis, the decision to not move forward is initially puzzling. It is less puzzlingwhen the speculative nature of the analysis is considered. The economic and technical dataavailable to Dow suggests that the project's profitability remains highly uncertain. Given itsunderlying technical and financial characteristics, the project's delay is not particularlysurprising. The case highlights a relatively prosaic reason for the investment's lack ofsuccess: P2 innovation can be costly and create a set of complex technical challenges.
To explore the project's profitability, it is natural to organize the analysis on the basisof the project's costs and its financial benefits. Costs arise from the need to divert wastestreams from the TOX. Benefits arise from the ability to retire the TOX itself, at least as aRCRA-permitted unit. Analysis of the case indicates that technical and regulatory challengespresent uncertain and potentially significant capital and human resource costs. At the sametime, the project's financial benefit is uncertain.
Technical Uncertainties
This section provides a more detailed description of the non-MCB waste streams thatwould have to be diverted, were the TOX retired. For each waste stream there is typically aset of options for reduction, disposal, recycling, or sale. While somewhat technical, thediscussion should also give a flavor for the technical and economic complexity of the project'sevaluation.
James Boyd RFF 98-30
9
Methanol. Methanol at the La Porte facility, due to its ignitability characteristics, is aRCRA-regulated waste stream. Options for this stream include (1) out-of-process recycling(i.e., sale to another plant or firm); (2) burning off-site; or (3) in a different 'clean fuel' boileron-site.12
The recycling option has attractive economic and environmental characteristics.However, the La Porte manufacturing process contaminates the methanol with impurities thatrender it unsuitable for most other commercial uses. This creates an as-yet unresolvedtechnical problem. How and at what cost can the methanol be decontaminated? Also, acustomer for the methanol must be found. The off-site burn options require the identificationof an alternative incinerator and, like the recycling option, require transportation off-site.Also, off-site incineration is typically much more expensive than on-site incineration.13 Theuse of methanol as a fuel in an on-site boiler was not evaluated extensively enough to resolvewhether or not this was a viable option.
Liquids collected from absorption units. Much of the MCB to be recycled at La Porteis originally collected in "pressure swing adsorption units" (PSAs). For the MCB to berecycled, however, it must first be decontaminated. Decontamination creates a host oftechnical issues relating to how and when the stream becomes contaminated. The MCB iscontaminated with water and chlorinated impurities in undetermined concentration.
Resolution of these issues has important consequences for the process' redesign. If thechlorinated impurities are present in low enough concentration, then the water can beremoved and the MCB reused. This is the most desirable outcome financially, since it simplyrequires the installation of a molecular sieve for water removal. If chlorinated impurities arepresent in sufficient quantity, however, they must be removed since their buildup significantlyaffects the efficiency of the production process.
If removal of chlorinated impurities is required there are three basic options. At a costof $1million a new distillation column, dedicated to impurity removal, can be constructed. Itis clearly desirable to avoid this cost. There are two possible ways to do so, but each withtheir own technical uncertainties. If contamination arises during one particular stage of theprocess, then an existing column could be used for decontamination. Process analysis isrequired for this issue to be resolved. If contamination is introduced elsewhere, a differentcolumn could possibly be used. The technical question in this case is whether that columncould be used to do "double-duty" distillation.
Phenyl isocyanate. Phenyl isocyanate (phenco) is a stream with some sourcereduction potential (an option currently being pursued at LaPorte). However, totalelimination via source reduction is not expected to be possible. Recycling has also been
12 The team also considered the possibility that methanol could be eliminated from the process entirely. Thiswas ultimately determined to be technically infeasible.13 Off-site incineration costs can exceed on-site costs by a factor of ten. See "Combustors Said to FaceUncertain Future with MACT Standards, Market Overcapacity," Environment Reporter, Vol. 28, no. 7, June 13,1997, p. 307-308.
James Boyd RFF 98-30
10
considered, though the nature and removability of contaminants in the phenco stream is anunresolved issue. The most viable option is transport off-site for sale or incineration. Theprimary technical issue in this case is how to lower transportation risks. Phenco has"reactive" properties that make it unstable for transportation. A possible, but untestedtechnical fix is to react the phenco with waste polyols, to form an inert foam. If successful,this technique would render phenco safer for transport.
Carbon tetrachloride and chloroform. Carbon tetrachloride and chloroform arecontaminants in the MCB stream. In order for MCB to be recycled, they must be distilled andburned off-site. (As contaminants in the MCB stream they are currently incinerated in theTOX). Removal via distillation column is the only alternative. Treatment of this stream isnot problematic technically, though investment in a distillation column is an expense. Andoff-site incineration creates transportation risks and increases disposal costs.
Products from an organic recovery system. La Porte has an organic compoundsrecovery system (ORS) to treat groundwater contamination caused by a previous owner of thesite. MCB is a prime constituent of this waste stream. Recycling requires this MCB to becaptured via a PSA unit. There are three possible PSA solutions. First, there is an existingPSA unit used to backup the TOX. This unit is relatively old, however, and its remaining lifeis uncertain. Second, there is another existing PSA on-site that could possibly be used. Useof this unit is uncertain because of questions regarding whether or not it can handle the airvolume created by the ORS. Also, there is a significant capital cost associated withconnecting this PSA to the organic recovery system. Third, a new, dedicated PSA for ORSvapors could be constructed. There is also a non-PSA solution. ORS vapors could potentiallybe burned in the TOX if it were converted to non-RCRA status (though see discussion ofregulatory issues below).
Phosgene. Phosgene is produced on-site and used as a reactant in the productionprocess. There are two removal options. First, use of an existing scrubber unit, currentlyused as a safety backup. Technical upgrade of this unit to a primary mitigation device wouldbe required. Second, phosgene could be incinerated in the TOX if it is converted to non-RCRA status (phosgene is not a RCRA waste stream). Also, the possibility that phosgenecould be recycled was considered. The technology for doing so is largely undefined.
Waste water treatment plant salinity. La Porte has a waste water treatment plant(WWTP) that relies partially on the TOX as a source of water. If the TOX is eliminated, theTOX water stream may no longer be available to the WWTP, an issue discussed below.Without this water, the salinity of the WWTP increases. This is problematic since the plant'sbiological treatment system is calibrated to a particular level of salinity. Without that balance,its effectiveness as an organic removal system is reduced, which creates a possible complianceproblem. Thus, a technical solution would be required that allows for salt reduction.Alternatively, the plant would require increased freshwater use, which creates regulatory issuesof its own (see below).
James Boyd RFF 98-30
11
Regulatory Uncertainties
Regulation raises often complex technical and financial questions, questions that mustbe resolved before the financial implications of a process change can be clear. Several of theprocess changes required for TOX elimination raised regulatory issues.
The capture of MCB. MCB vapor from the ORS system is currently being burned inthe TOX. Because it is introduced to the TOX as a vapor, it is not RCRA-regulated.However, if MCB from the ORS is to be recycled, it would be captured as a liquid. If thisMCB contained any impurities subject to RCRA regulation, these impurities in liquid formcould prohibit their incineration in a non-RCRA TOX.
Phenco stabilization. Regulatory approval may have to be sought if phenco is to becombined with waste polyols. The rationale for this combination is to increase the stability ofphenco, making it safer for transport. It is not clear, however, that this stabilization approachwould be permissible. Regulatory approval is not guaranteed, and in any case would have tobe requested. The combination of two different forms of hazardous waste creates a regulatoryissue that would have to be resolved.
Phosgene treatment. For phosgene, the TOX has a higher "treatment efficiency" thanwould the phosgene scrubber alternative. Because Texas has an "anti-backsliding" rule, TOXshutdown would require testing, monitoring, and re-permitting of a scrubber-based phosgenetreatment system.
Waste water treatment plant salinity. The TOX's regulatory permit currently requirescombustion gases to be cooled and cleaned by water that is acquired from a freshwater source.This water does double-duty, however, since it is then sent to the facility's wastewatertreatment plant. Plant managers are concerned that if the TOX is eliminated they may not begranted regulatory approval to draw this same freshwater stream. While TOX eliminationrequires no net increase in freshwater use, the WWTP alone may not be viewed as ajustifiable use of the water.
Issues arising from transportation. Several of the options associated with TOXelimination involve the transportation off-site of non-MCB waste streams--specificallymethanol and phenco. Taking waste streams off-site for sale or incineration by another firm'sfacilities raises liability concerns. Use or disposal of wastes by other firms can potentially tieDow legally, via liability, to environmental problems caused by those other firms. Firms thatgenerate waste can be liable for damages due to use or disposal at other firms' sites. This istrue even if the primary generator takes all possible precautions in transportation and has nocontrol over the care taken by the firm to whom the waste is transported. Transportationtherefore exposes Dow to a set of risks over which it has relatively less control.
The pollution prevention opportunity at La Porte presents numerous technical andregulatory challenges.14 This has a number of implications for the project's financial analysis.What should be clear is that the firm must bear costs to estimate costs. Specifically, the firmmust devote human resources to the solution of technical, market and regulatory issues. 14 The challenge was described by one participant as "managing 50 speculations at once."
James Boyd RFF 98-30
12
Before financial analysis of the TOX elimination project can occur, the firm must be able toidentify the new technologies and processes that will be required by the project. In order tocome to that specification, however, numerous questions must be answered. Can existingpurification systems be used to treat different waste streams? Is there another firm in closegeographic proximity that is willing to purchase (or be given) waste methanol? Willregulators allow the use of freshwater for a wastewater treatment plant in the absence of theTOX, or must the firm "innovate around the problem." These and other questions must beanswered in order to define the technical specifications of the TOX elimination project.
Formal financial analysis may in some cases be moot, if technical uncertaintiesassociated with the project cannot themselves be resolved at reasonable cost.
These uncertainties have not all been resolved at the La Porte facility. One explanation forthe project's lack of success is that it involved a set of process changes that presentedsignificant technical and regulatory challenges.
The Option Value of Continued TOX Operation
Consider now the potential benefits of the TOX elimination project. The recycling ofMCB would allow for some raw materials reductions (thus reducing certain input costs).TOX shutdown would also eliminate certain energy and labor costs associated with itsoperation.15 The principal benefit, however, arises from the ability to avoid re-engineering,testing, and capital costs associated with new RCRA permit requirements. The La Porte TOXwill be subject to new RCRA rules that promise more stringent particulate and new"maximum available control technology" (MACT) standards.
Dow estimated a $4 million cost for the upgrades necessary to remain in compliance.Thus, the economic benefit of TOX elimination is the avoidance of a potentially significantupgrade bill. Several uncertainties cloud this estimate, however.
First, the date at which compliance will be required is uncertain. Currently, theEnvironmental Protection Agency has until November, 2000 to promulgate the newregulations. Following the rules announcement, an unspecified amount of time is allowed fortesting and upgrade. From a financial analysis standpoint, the timing of the requirements issignificant. The further in the future the requirements are put in effect, the less motivationDow has to eliminate the TOX today.16 This is due to the effects of discounting. As isexplained elsewhere in this report, discounting implies a reduction in the value of benefits (orcosts) that arise in the future. Specifically, a $4 million benefit in 3 or 4 years is worthsubstantially less than a $4 million benefit today. Delayed regulatory rulemaking thus
15 Of course, as noted above, there will be potentially off-setting labor, energy, materials, and technical costsassociated with the diversion from the TOX of non-MCB waste streams.16 Complicating the issue of timing, is EPA Region 6's "combustion initiative," which may allow for acceleratedpermitting. This is currently only a possibility for the La Porte facility, however.
James Boyd RFF 98-30
13
reduces the value of TOX elimination. Due to the effects of discounting, regulatory delay inthe case acts as a disincentive to invest in process change.
More importantly, the technical requirements are not known as of yet. This meansthat, until the new standards are announced, the $4 million estimate is subject to upward ordownward revision. This uncertainty creates an economic incentive to delay action on theTOX elimination proposal. In economic parlance, there is an "option value" to delayedinvestment. When investment decisions are not easily reversed there is an incentive to avoidcommitting resources until uncertainties are resolved.
As noted earlier, there are numerous technical and capital costs associated with thediversion of the non-MCB waste streams. Many, if not most, of these costs are irreversible inthe sense that they could not be recovered if Dow decided in the future to re-open theincinerator.17 Another way of putting this is that the commitment to TOX eliminationimposes "sunk" costs. When an investment has uncertain benefits and involves irreversibleinvestments, the use of conventional investment rules such as Net Present Value (NPV) canbe inappropriate. In these situations, NPV fails to capture the value of delaying the decision(the "option value") until uncertainties can be resolved. The TOX elimination project is anexample of an investment situation in which the option value is likely to be large. It involvessignificant, irreversible costs and its benefits (the avoided upgrade cost) hinge on anuncertainty that will be resolved in the not-too-distant future.
With some investments, there is value in the delay of a project decision. Delay allowsfor resolution of uncertainties and the avoidance of irreversible, and potentiallywasted investments.
Finally, TOX elimination could lead to another lost option with potential value. In thelonger term, the La Porte plant may be used to produce different products with as-yet unseenprocess characteristics. While a wholesale process reinvention is relatively unlikely for theplant, it is worth noting that the TOX could be useful or necessary as part of such a processre-configuration and that de-commissioning now could make re-configuration impractical.
Consider the following example. By deriving the option value of a delayed decision,the example demonstrates that a positive NPV is not sufficient motivation for managers to goahead with a project.18 Assume the following: that for an investment of $2.1 million the firmcould invest in new process technology, human resources, and testing and achieveenvironmental benefits due to recycling. The financial benefit would be due to avoidedretrofitting costs that are currently uncertain. Two outcomes are possible, with equalprobability. Either the avoided costs are $2 million or they are $6 million, depending on
17 Actually, Dow management expresses a concern, based on their perception of current regulatory attitudestoward incineration, that once closed, the TOX could never be re-opened.18 The example is meant to be illustrative, rather than a numerically accurate depiction of the Dow investmentdecision.
James Boyd RFF 98-30
14
regulatory requirements. Assume that the new compliance standard is announced in 3 yearsand must be immediately implemented by the firm.
Assuming the investment is made today, and discounting cash flows at a 10 percentinterest rate, the project's NPV is calculated as follows.19
NPV = ( ) ( )[ ]
( )$904,000.904
.11
6.52.52.1
3==
+
++−
The positive net present value would ordinarily suggest that the firm move forward with theproject. However, we now calculate the present value of waiting to make the investmentdecision until the regulatory standard is announced. By waiting, the firm can avoid makingthe $2.1 million investment if the standard requires retrofitting changes that cost only $2million. (The firm will not invest in this situation since it is clearly not in the firm's financialinterest to spend more to avoid a cost than the cost itself.) Therefore, the firm will moveforward with the investment only if the regulatory standard implies the larger retrofitting cost.The NPV of delaying and making the investment only if avoided upgrade costs are large is
NPV = ( )( ) ( )
$1,464,0001.464.11
6
.11
2.1.5
33==
++
+− .
The value of waiting is greater than the value of investing immediately.20 This is true for tworeasons. First, the firm can avoid the investment if the benefits turn out to be small. Second,the three year delay reduces the present value of the investment's cost. As a result, the optionvalue of the delayed decision is $560,000, or the difference between the two NPVs.
In addition to the unresolved technical issues described earlier, this example illustratesanother reason for the Dow investment's failure to be approved. Given uncertain regulatorystandards and the irreversible nature of the investments necessary to move to alternatives toTOX-based disposal, a delayed decision is likely to be optimal.
Other Organizational and Strategic Issues
Capital and human resource constraints have also played a role in the decision to putoff the TOX project. Resolution of technical issues and regulatory uncertainties and relativeconfidence in positive rate of return estimates is not sufficient to guarantee project success.Typically, firms also prioritize their investment activities, pursuing those that offer the highestrates of return on capital and human resources. As is described elsewhere in this report,capital rationing is a mechanism that helps firms prioritize.
19 The fractional term is the expected, and discounted, benefit of being able to avoid the upgrade cost in 3 years.20 To help understand the equation, note that with probability .5 the firm does not make the investment andtherefore bears no cost and receives no benefit.
James Boyd RFF 98-30
15
Capital rationing has been a concrete issue for the La Porte investment. In 1996Dow's polyurethane business had an 86 percent hurdle rate for new capital projects. This ratecan be explained by (1) a fixed (rationed) amount of new capital made available to thepolyurethane business by senior Dow management and (2) the existence of a competingcapital project within the business that offered a particularly high expected return. Dow has15 global business units, each with a limited amount of capital to be allocated in a given year.The competing project involved a plant in Freeport, LA. The Freeport project was financiallycompetitive relative to La Porte, as well as competitive in terms of the environmental benefitsit promised. The Freeport plant promised to eliminate 50 million pounds of chlorinatedorganics by harnessing a new process chemistry, a P2 investment with environmental benefitsan order of magnitude greater than that proposed at La Porte.21 Given capital rationing, theLa Porte investment was a relatively unappealing investment target.22
The same can be said of investments in human capital. Given the relative merits of theFreeport investment, it is not surprising that human resources, particularly technical expertise,were focused on that investment. This had decidedly negative implications for the La Porteinvestment. Given the complexity of the technical issues that had to be resolved, sustainedproblem-solving activity--which was dependent on the active involvement of scarce personnel--was a prerequisite to moving forward with the TOX elimination project.
21 This figure is speculative. Nevertheless, the magnitude of possible reductions is clearly significant.22 The question of why firms ration capital at all is explored in section 4.
James Boyd RFF 98-30
16
MONSANTO
The Product
The Monsanto case involves a process that, at the time, was associated with its RubberChemicals business unit. The firm was producing aminodiphenylamine (4-ADPA), anintermediate product for the production of anti-oxidants, at plants in the U.S., Belgium, andthe United Kingdom. The final anti-oxidant product has a wide range of uses, but its primarymarket is the world tire industry where anti-oxidants are used to improve tire durability andsafety. The market for this product is large and represented a significant fraction of theRubber Chemical unit's annual revenues.
The existing process chemistry for 4-ADPA production used benzene, nitric acid, andchlorine to produce nitrocholorobenzene (NCB). NCB was then converted to 4-NDPA byreaction with aniline. The 4-NDPA was in turn reacted with hydrogen to get the desired 4-ADPA. The many process steps leading to creation of the 4-ADPA intermediate productrequired the disposal and handling of large quantities of chlorine. In addition, the processcreated carbon monoxide, xylene air releases, and an aqueous waste stream contaminated withinorganic salts. The process was the second-highest generator of waste in Monsanto'sChemical Group. These environmental characteristics made the process a prime target forprocess reinvention.
The Pollution Prevention Opportunity
Beginning in the mid-80s, the Rubber Chemicals unit and Monsanto CorporateResearch began to explore alternatives to the process chemistry. In 1991, chemists andchemical engineers achieved a technical breakthrough with real promise: the possibility of aprocess with virtually zero waste generation. The innovation, dubbed ADPA, is a "directcoupling" technology that eliminates the use of chlorine and several process steps in theproduction of the 4-ADPA intermediate product.
The project was granted a budget in excess of $10 million for development costs,including the construction and operation of a fully-integrated pilot plant. By mid-1993 thepilot plant had demonstrated the technical efficacy, environmental benefits and potentialeconomic value of the new process. The environmental benefits of the new process weresignificant and included
• a 91 percent reduction in organic wastes• the virtual elimination of inorganic wastes, with total elimination of chlorine• waste water generation only 3 percent of its former total• greater chemical stability (significantly reduced risk of "runaway reactions")• the elimination of xylene emissions.23
23 Aggregate reductions were predicted to be significant. For a single plant, the numbers translated into a 56million pounds per year reduction in chemical waste generation and a 1 billion pound per year reduction in wastewater requiring treatment.
James Boyd RFF 98-30
17
Another significant driver for the firm, however, were cost savings associated with theprocess change. The ADPA process required less than 50 percent of the old raw materialinputs and required fewer process steps. For these reasons, ADPA was projected to reduceproduction costs by a magnitude virtually guaranteed to have a positive impact on profits andmarket share. The firm had discovered a true "win-win" investment opportunity.
In fact, the technology's qualities were so obvious that commercial development wasconsidered a "no-brainer" by Rubber Chemicals management. Many of the process' benefitswere never quantified, simply because they were so large. At least on a stand-alone basis,ADPA was predicted to be a sure-fire success. In light of this, it is noteworthy that Monsantodid not choose to develop ADPA as part of its Rubber Chemicals business, due to majorimpacts on integrated business units. While ADPA was ultimately developed, its transitionfrom prototype process to the commercial market was not immediate nor particularly smooth.
ADPA Today
Today, the ADPA technology is owned and used in the production of anti-oxidants byFlexsys, an independent, global rubber chemicals company, formed as a joint venture betweenMonsanto and the Dutch firm Akzo Nobel. The formation of this new company was central toADPA's implementation and hints at the complexities surrounding the technology'scommercial development. As we will see, issues well beyond the technology and product itselfcomplicated its implementation. Changes in Monsanto's strategic goals, interrelationshipsbetween the 4-ADPA product line and other business units, and a set of issues relating todivestiture and ownership of assets ultimately determined when and how the technology wouldbe brought into commercial use. Particularly because ADPA had such clear benefits, the caseunderscores the complex tradeoffs that must be faced by managers responsible for theevaluation and implementation of pollution prevention, or any other, investment opportunities.
Changing Markets and the Corporation's Strategic Goals
The ADPA story illustrates the way in which even a clear win-win process improvementcan be influenced by global market changes and the shifting strategic goals of a multi-nationalfirm. The fate of ADPA was largely determined, not by the financial or environmental benefitsof the project itself, but by the fate of the larger rubber chemicals business in which it wasembedded and the other Monsanto businesses with which it was integrated.
A shift in strategic goals. In the early 1990s, CEO Richard Mahoney was looking fora way to improve Monsanto's stock performance and position the firm to take advantage ofchanges in world chemical markets. One of his strategies was to announce a new corporatefinancial goal: specifically, a 20 percent return on equity (ROE).24 Mahoney's financialadvisors had studied the broader market and determined that firms in the top quartile of stockperformance (measured by the price-earnings ratio) were those which consistently met a
24 Return on equity is defined as the a firm's net income divided by average stockholder's equity.
James Boyd RFF 98-30
18
20 percent ROE.25 In effect, then, a 20 percent ROE was chosen as a proxy for "improvedstock performance." A likely reason is that ROE provides a relatively concrete target formanagerial decision-making. ROE is a standard accounting measure, and thus a convenientyardstick with which to compare business lines and judge capital investments.26 Thus, the 20percent ROE target was designed to motivate a shift in Monsanto's businesses toward marketsand products that offered greater promise for growth.
At the time of Mahoney's announcement in 1992 Monsanto's ROE was 12 percent,well below the target. One broad strategic implication of the new goal was for the firm tostart moving into so-called "specialty" chemicals and out of commodity-type chemicals.Specialty chemicals tend to be innovative and targeted at markets where the product willenjoy a significant competitive advantage. Competitive advantages arise when the productfills a new market niche or when it significantly outperforms existing, competing products.27
In contrast, commodity products tend to be high-volume, established products that are -- bydefinition -- very competitively supplied. Anti-oxidants, such as 4-ADPA derivatives, areexamples of the latter. The entire rubber chemicals business, in fact, was beginning to be seenas a product line incompatible with the 20 percent ROE goal. Note that this shift in strategicthinking was occurring simultaneous to the ADPA development program.
The Rubber Chemicals Business. The company's shifting strategic goals spelledtrouble for the Rubber Chemicals (RC) business. International rubber chemicals markets arehighly competitive and subject to cyclical worldwide demand fluctuations. Most ofMonsanto's competitors had comparable production processes and excess capacity. Inaddition, a set of other market changes threatened the firm's strategic position. First, thecollapse of the Soviet Union resulted in a significant loss of sales in the region as EasternEuropean suppliers flooded the market and created significant downward pressure on prices.Second, Monsanto's customers were consolidating. In the 1980s there were 20 or more majortire manufacturers. By 1992, however, after a wave of failures, mergers, and acquisitions 5major tire producers were supplying the bulk of the world market. This consolidation allowedtire manufacturers to exercise buying power and bargain for steep price reductions fromsuppliers such as Monsanto. Finally, changes in tire manufacture itself (increased productionof radial tires) were leading to long-lasting products. Increased tire durability meant reducedrubber demand. Rubber consumption was growing worldwide by only 2 percent per year.
Taken together, these strategic factors suggested that rubber chemicals was a businesswhere growth potential was limited, particularly in relation to other markets Monsanto might
25 A high price/earnings ratio can usually be taken as evidence that market sees good growth opportunities forthe firm.26 Note that while ROE is a standard accounting measure, it is not a theoretically sound metric by which tojudge the desirability of alternative investments. ROE calculation does not require knowledge of cash flows anddoes not involve discounting, making it a highly suspect measure of profitability.27 Monsanto's shift toward "life sciences" products, such as genetically engineered fertilizers, is an example oftheir move toward specialty chemicals.
James Boyd RFF 98-30
19
enter. The numbers underscored the strategic analyses. Rubber Chemicals dropped from abusiness with a 16 percent ROE in 1989 to a business with an 8-fold reduction in net income(and a roughly 2 to 3 percent ROE) in 1992. While some of this was due to unavoidablecyclicality, the accounting returns calculated in 1992 fell far short of corporate goals.
Capital Rationing and ADPA's Impact on the Business Unit
Monsanto at the time was composed of 15 distinct business units that competedamongst themselves for shares of a limited yearly capital budget. Once granted, the budgetcould not be exceeded without the approval of corporate headquarters. Also, any project overa particular size had to be approved by headquarters. The capital investments necessary to getADPA operating commercially placed it in this category (in particular, plant constructioncosts were large). This meant that the Rubber Chemicals business was not the sole decision-maker. Capital rationing and a parent business line with relatively poor performance meantthat ADPA's financing was not assured.
ADPA's impact on the Rubber Chemicals business was strongly positive. Thequestion was, was its impact going to be positive enough to turn around the business as awhole? Management was looking at the following options and projections for the RCbusiness. Independent of ADPA, the business had secured internal financing to conduct alarge-scale business reorganization. Monsanto had granted RC a capital budget toaggressively reduce costs anywhere savings were available. The restructuring plan involvedfacility closures and "debottlenecking" innovations to capture economies of scale at coreplants. Even with these efforts, and the cost and competitive advantages they would create,the projection was for an 8 percent return on capital.28 Given the firm's new strategic targets,this was only marginally acceptable.
Development of ADPA would improve the Rubber Chemicals business' financialperformance. Expectations were that ADPA would add roughly 3 percentage points to thebusiness' return on capital. This is significant, particularly given the dilution of its benefitacross the entire business line. Nevertheless, a 10 or 11 percent ROC remained well belowMonsanto's strategic financial targets.
What's Wrong With a 10 percent Return on Capital?
While a 10 percent return fell short of the CEO's strategic goal, it is still natural to askwhy a firm would pass up a 10 percent return. The short answer is that a firm can make a 10percent return and still lose money. The more detailed answer requires a brief review offinancial principles.
Before turning to that review, however, we temporarily set aside two important issues.First, the Rubber Chemical unit's 10 percent ROC is not necessarily relevant to the ADPA
28 Note that some of the figures cited in the case refer to return on capital (ROC), while others refer to return onequity (ROE). Both are measures of investment return, though return on capital is the more comprehensivemeasure since it accounts for the return on capital financed via both equity and debt.
James Boyd RFF 98-30
20
decision. What is relevant are the returns specific to ADPA. Second, ROC is not atheoretically sound measure of financial value.29 Nevertheless, ROC, while analyticallydangerous, is not an entirely worthless measure of value. For now, we can infer--as didmanagers at Monsanto--that a discounted cash flow analysis would produce a theoreticallysound, and qualitatively identical conclusion: the Rubber Chemical unit was generatingpositive, but lackluster, returns.
The Opportunity Cost of Capital. A business that makes a 10 percent return on itscapital can lose money because the capital itself has a cost. For instance, if the capital wouldhave earned 15 percent if used to finance a new agricultural product, then 15 percent is thecost of capital. (In economic parlance, 15 percent is the opportunity cost of capital). Notethat a firm loses money if it takes capital away from a project that earns a 15 percent returnand puts it in a project that earns only 10 percent.
A firm will lose money if it directs capital from a project that offers a higher return toa project that offers a lower return. While seemingly simple, this truism has a directcorollary that is often not understood: investing in a project with a positive rate ofreturn can reduce a firm's profits.
In other words, evidence that a pollution prevention investment has a positive rate of return isnot the same as evidence that it is an economically desirable project.
This economic reasoning can also shed light on CEO Mahoney's 20 percent ROCtarget. Given new technological and market opportunities opening to Monsanto, the directionof capital toward Rubber Chemicals had a high opportunity cost. In fact, this cost may havebeen so high that investment in assets promising a 10 percent return would have reduced thevalue of the firm. This was particularly true given the financial risks presented by the RubberChemicals business, an issue to which we now turn.
Risk, Return, and the Cost of Capital. The opportunity cost of capital is a function ofmore than the returns offered by alternative investments. It is also a function of thoseinvestments' risk.
Given a choice between a risky investment and a safe one, an investor will alwaysprefer the safer of the two. The implication is that, in order to acquire capital from aninvestor, the riskier firm will have to promise a higher return than the safer firm.30 In turn,this means that the opportunity cost of an investor's capital is higher for riskier firms. Thus, afirm's cost of capital is related to the way in which capital markets assess its risk. These ideasare the basis of understanding the so-called capital asset pricing model (CAPM). CAPM saysthat an asset's expected risk premium varies in direct proportion to an index of risk, called
29 For reasons similar to those mentioned in footnote 26.30 This explains why so-called prime lending rates, with which most consumers are familiar, are always wellbelow the corporate cost of capital (hurdle rate). To compensate for the greater risk relative to treasury bills, themarket provides an average risk premium well above the return provided by safe treasury bills.
James Boyd RFF 98-30
21
beta.31 Because riskier firms must offer a higher return, capital is more expensive for them toacquire.
Risk and the Rubber Chemicals Business. Not all risks affect capital costs. Forinstance, because of the ability to diversify, investors can significantly reduce risks by holdinga portfolio of investments whose uncertain price movements "cancel out" on average. A riskyinvestment can have a "low beta," and in turn relatively low capital costs, as long as the risksit presents are diversifiable. Only non-diversifiable risks affect capital costs.
Non-diversifiable risks are a function of several factors. Perhaps the most importantfactor is the sensitivity of a firm's earnings to the economy's overall business cycle. It isnoteworthy that the Rubber Chemicals business is highly cyclical, and so would be expectedto have a high beta. Also, a project's operating leverage -- the proportion of its costs that arefixed and that therefore must be borne regardless of whether the asset is ultimately productiveor idle -- influences the project's risk. All else equal, projects with higher fixed costs willhave higher betas.32 On this score, too, Rubber Chemicals is likely to have a high beta. Thefixed costs associated with chemicals manufacture tend to imply high project-specific betas.This would also hold true for the ADPA investment itself.
Because of the non-diversifiable risks associated with the RC business, and ADPAspecifically, the cost of capital for this business could be higher than 10 percent, perhapssignificantly so. High risk, low return businesses are not desirable targets for capitalinvestment. For these reasons it is not surprising that some within Monsanto were resistingany continued investment in the RC business.
Disentangling ADPA from the Rubber Chemicals Business
Strictly speaking, the firm's concern with returns in the RC business should not havebeen relevant to the ADPA investment decision. An inviolable principle of financial projectevaluation is that a new investment should be evaluated "incrementally," not on the basis ofits impact on average returns across a larger business. Financial theory holds that, whenevaluating a new capital investment, only the new, appropriately discounted, cash inflows andoutflows created by the project are relevant. Taking this view, ADPA was a much betterinvestment than indicated by calculations such as "ADPA will improve the RC business' ROCby 3 percentage points." In fact, a preliminary estimate suggested that, on its own, ADPApromised a 45 percent return on capital, a return well above the firm's strategic target. Giventhat projects should be evaluated incrementally, and given the high ROC estimate, why didn'tthe firm simply move ahead with ADPA as a stand-alone project?
31 Statistically speaking, beta is the ratio of (1) the covariance between an asset's return and the return of abroader portfolio, and (2) the variance of the broader portfolio. Typically, the broad portfolio is a diversifiedportfolio of publicly traded stocks. Beta therefore measures the sensitivity of an asset's value to changes in themarket generally.32 For more detail on how to estimate a project's beta see Foster (1978).
James Boyd RFF 98-30
22
Monsanto analysts sought to view ADPA independently, but in the end "couldn'tdivorce" ADPA from the RC business. To understand why, it is necessary to highlight a keytechnical interdependence associated with the 4-ADPA process. This technical relationship,in turn, had financial and accounting implications that tied the ADPA decision to the RCbusiness and other integrated Monsanto businesses.
4-ADPA and Chlorobenzenes. The old 4-ADPA production process required largequantities of a product called PNCB (paranitrochlorobenzene). This product, along with a co-product, ONCB (orthonitrochlorobenzene), was produced by another Monsanto division. Theinnovative ADPA process eliminated the bulk of Monsanto's PNCB needs and would severelylimit the availability of ONCB. In fact, this is a primary source of ADPA's economic benefit.Process steps and raw inputs used to make chlorobenzenes are eliminated by ADPA. Thischange, however, meant that the financial impact of ADPA could not be isolated. Costsassociated with chlorobenzenes had to be considered. These costs can be separated into twocategories. First, ADPA created cash outflows by reducing efficiencies in chlorobenzeneproduction and requiring plant decommissioning expenditures. Second, ADPA raisedaccounting issues within Monsanto related to the recovery of fixed costs associated with now-redundant chlorobenzene units.
Negative Cash Flows Created by the Switch to ADPA. While reduced chlorobenzeneswas a benefit of ADPA, there were also some off-setting costs associated with reducedchlorobenzenes production. First, closure of one or more chlorobenzene units was apossibility. In many ways this was considered a desirable outcome (the chlorobenzenesbusiness, like Rubber Chemicals, was relatively lackluster). Nevertheless, there were costsassociated with closure. Some of these costs were tangible, such as the cost ofdecontaminating and disposing of redundant, non-salvageable capital equipment. Others wereless tangible, such as the impact on the workforce of plant closures. Second, Monsanto stillrequired PNCB and ONCB for other products, though in limited quantities. This meant thatthe elimination of all the firm's PNCB plants was not possible. The elimination ofchlorobenzenes from 4-ADPA production meant that these plants would be significantlyunder-utilized, and thus be less efficient to operate. Because plants were optimized for pre-ADPA production volumes, ADPA would have the effect of increasing operating costs at thePNCB plants remaining on-line. These costs, because they were cash outflows and the directresult of a shift to ADPA, were relevant to the financial analysis of ADPA.
Accounting Charges Associated with ADPA. Looming even larger were a set of largefixed costs associated with the now-obsolescent chlorobenzene facilities. With PNCB nolonger being used by Rubber Chemicals, the chlorobenzenes business would have a muchharder time recovering the fixed costs associated with its production. As a result, financialprojections for the ADPA project and the RC business as a whole included "charges"corresponding to these unrecovered fixed costs. This had a clear, negative impact on theADPA project's economics.
From the standpoint of financial theory, these costs should not have been assigned toADPA or Rubber Chemicals. Unrecovered fixed costs from the chlorobenzenes business
James Boyd RFF 98-30
23
were, technically speaking, sunk costs and therefore should have been irrelevant.33 The costof building the chlorobenzene plants was a cash outflow that occurred many years before theADPA decision was made. Whether or not ADPA went forward, Monsanto had alreadyborne this cost.
It is common to confuse sunk costs and cash flows. One reason is that accountingprocedures take a fixed cost and "depreciate," or spread, it over a period of years. Butdepreciation does not mean that the firm is paying a fraction of a fixed cost in yearlyinstallments. Rather, depreciation is a technique required by the tax system to calculate afirm's yearly profits (and thus its tax liability). While for tax purposes the method spreads acost over a number of years, there is not a yearly cash outflow. The actual cash outflowtypically occurs earlier, at the time the capital is installed--for instance, when contractors andequipment suppliers are paid.
Also, large fixed costs create complicated issues for diversified firms such asMonsanto. In order to compare the value and performance of individual business units, firmswill typically make those units into distinct "profit centers." Profit centers allow each businessunit (such as Rubber Chemicals) to be evaluated on its own terms. This leads to betterinvestment decisions and, with performance monitoring, allows the firm to create managerialincentives tied to an individual unit's successes and failures. An issue arises, however, whenone internal business requires an input from another internal business: namely, how is thatinput to be priced? While not purchased on the open market, the input must have a "price" thatcan be assigned to the appropriate profit center. The simple answer is that the internal priceshould be equal to the cost of producing the input. This becomes complicated, however, whenthe cost involves fixed costs that must be shared between businesses.
Rubber Chemicals was being "charged" just such an internal price for the PNCB usedto make 4-ADPA. This is a completely sound financial practice, and one that is necessary forfirms using distinct profit centers as an internal accounting strategy. With ADPA, RubberChemicals no longer needed PNCB. This threatened the chlorobenzene business' ability torecover its fixed costs via Rubber Chemicals charges. The accounting solution was to chargeRubber Chemicals obsolescence costs (the unrecovered chlorobenzene costs). Again, this is asound financial practice, if it is used simply to assign costs for internal accounting purposes.What was unsound was the assignment of obsolescence costs to ADPA during the project'sfinancial evaluation. The assignment was inappropriate because the unrecovered, fixedchlorobenzene costs were sunk costs. As cash flows, they had been paid out years earlier.The confusion was natural enough. After all, the Rubber Chemicals business had been seeingchlorobenzene charges as annual cash outflows. From the larger corporate perspective,though, the unrecovered chlorobenzene costs should have been identified as sunk and thusirrelevant to the ADPA decision.
33 The so-called "sunk cost fallacy" is a common and time-worn error in financial analysis. For examples seeBrealey and Meyers (1991), pp. 96-98.
James Boyd RFF 98-30
24
Failure to appropriately distinguish between financial measures such as cash flows,accounting charges, and sunk costs can bias analysis of new investments.
These financial evaluation issues ultimately did not hinder the development of ADPA.The innovation's benefits were so obviously positive that development went forward. But thecase provides a lesson in the complexities and challenges that confront financial evaluation.Financial analysis techniques are an area where many firms continue to innovate and improvequality. In this regard, it is instructive to note that current internal guidelines at Monsantostress the importance of incremental analysis to sound capital budgeting evaluations. Asimilar change has occurred with regard to discounted cash flow techniques. As we haveseen, in the early 90s Monsanto used non-discounted cashflow benchmarks (e.g., return oncapital) to compare projects. The firm's current capital appropriation procedures requirediscounted cash flow measures of expected profitability.
ADPA's Commercial Development
ADPA was a technology with significant economic value. Unfortunately, the productit produced was embedded in an under-performing business. The strategic solution, and whatultimately guaranteed ADPA's development, was Monsanto's divestiture of the RubberChemicals business. In 1995, Monsanto formed a joint venture, Flexsys America, with AkzoNobel. The venture provided a desirable solution to several of the strategic and financialissues raised by ADPA and the rubber chemicals market.
Under the firms' agreement, Monsanto would transfer to Flexsys the bulk of its rubberchemicals capital base, including a number of plants worldwide, as well as rights to theproprietary ADPA technology. Akzo Nobel would transfer several of its own rubberchemicals products and businesses to Flexsys. Ownership of the joint venture was evenlydivided between the two firms and the resulting business was able to finance the developmentof an ADPA production facility in Belgium.
The joint venture promised several benefits. It permitted consolidation in theEuropean rubber chemicals market. In particular, the firms would be able to capture scaleeconomies in production and staffing. Also, the joint venture implied significantly greatermarket share. This promised a competitive advantage that could be used to counter tiremanufacturers' increased buying power in the rubber chemicals market.
While Monsanto had to share its new technology, the joint venture allowed them to shedthe RC business' under-performing capital assets and get another firm to underwrite the ADPA'scommercial development costs. ADPA's implementation ultimately hinged on a major businessrestructuring, brought on by worldwide market changes and shifting strategic goals.
Environmental Accounting
ADPA's entanglement with complex production and strategic issues should notobscure the fact that a primary driver for its development was pollution prevention. Pollutionprevention motivated the R&D effort which spawned the new process chemistry. Given this,
James Boyd RFF 98-30
25
and given the significant environmental benefits associated with ADPA, how was the value ofthis improvement expressed in the firm's financial decision-making process?
The environmental benefits were not translated into financial terms that had a directimpact on the decision analysis. There are several reasons for this. First, the financial analysisof all costs and benefits--not just environmental costs and benefits--was relatively rudimentary.As indicated earlier, year-by-year cash flows were only estimated. A detailed line-item cost andbenefit analysis was not conducted. While the firm failed to quantitatively account for financialbenefits arising from changed environmental conditions, it also failed to quantitatively accountfor many other benefits and costs. Second, it could be argued that detailed financial analysis ofenvironmental changes was unnecessary because the waste reductions were so obviously largethat there was no need to estimate their precise financial value.
The goal of environmental cost accounting is to ensure that environmental costs (andsavings from reduced costs) are given weight in decision-making equal to the weight given tonon-environmental costs and benefits. We should ask, then, whether ADPA's environment-related financial benefits--though not quantified--got equal qualitative weight in the firm'sdecision-making. There is evidence that ADPA environmental benefits were prominentlyvalued in the firm's decision-making. A good guide to this is the prominence ofenvironmental considerations in business summaries presented to top management. Internaldocuments show that waste reduction was listed as a key driver in favor of ADPA in everysummary of the investment's pros and cons presented to financial staff. In a "CorporateFinance Staff Review" ADPA's environmental benefits are presented on equal footing withfinancial and strategic considerations. Or consider a decision brief presented to CEOMahoney that included a small list of key considerations, two of which were related to theproject's environmental benefits. These summaries invariably included statements such as"reduces waste by 95%." Environmental problems associated with chlorobenzene productionwere also typically listed as reasons to get out of that business.34 While state of the art riskanalysis and financial estimation of these environmental benefits was not in evidence duringthe ADPA decision, there is no evidence that environmental benefits were being giveninsufficient weight in the business' decision calculus.
34 These problems included the production of hydrochloric acid salts. While not a regulated substance,elimination of this waste stream was nevertheless seen as having a significant (if unquantified) value.
James Boyd RFF 98-30
26
DUPONT
The Product
The DuPont case relates to a product called the "DuCare" photochemical processingsystem. The DuCare system is a package of four integrated products designed for sale tocustomers in the graphic arts (printing and publishing) industry. The industry, in the processof developing 1.5 billion square feet of silver halide photographic film annually, generates ahuge amount of photochemical waste. The DuCare system was designed to reducephotochemical consumption and the industry's pressing disposal needs. In lieu of traditionalfixer and developer chemistries, DuCare uses proprietary process chemistries that allow forrecycling. The four integrated products that make up the DuCare system include (1) aproprietary, recyclable "developer," (2) a recyclable "fixer," previously commercialized byDuPont, (3) a transportation system that collects and returns the developer and fixer to aDuPont processing facility for recycling, and (4) technical assistance in the choice andinstallation of washwater treatment technologies. Note that the chemicals are not recyclableon site. Instead, the chemicals require transport to a central facility where the recyclingchemistry takes place, followed by re-distribution to the graphic arts customer. The goal ofthe system is a "zero effluent" photochemical process.35 The target customer base iscomposed of medium- and large-scale commercial printers and publishers with environmentalcompliance, stewardship, and cost concerns.
The Pollution Prevention Opportunity
The environmental benefits of the DuCare system are, by design, significant.Traditional methods for dealing with photochemical waste include direct release to the drainfor subsequent treatment at a POTW (publicly owned treatment works), transport of wastesfor off-site TSDF disposal, or illegal dumping. DuCare, by recycling the photochemicals,eliminates releases to the environment, whether those releases are destined for the drain, atreatment works, or a disposal facility.
A variety of wastes are eliminated by a recyclable chemical process. With respect tophotographic developer, the standard process creates an environmentally problematicchemical oxygen demand (COD). A typical developer has a high COD of roughly 100,000ppm. As a point of reference, the EPA limit is a COD of 2,000 ppm. Again, spent developeris either is hauled away for disposal at a licensed toxic substance disposal facility, is dumpedillegally, or is sent legally to a POTW where treatment charges may be levied. The DuCaredeveloper, by being fully recyclable, eliminates all of these releases.
There are significant environmental gains associated with the fixer and washwatertreatment, as well. The standard photographic fixer, if untreated, contains 2,000 to 6,000 ppmof silver (EPA limit, .7 ppm), 40,000 ppm of ammonia (900), 180,000 ppm total sulfates(5,000), and has a COD of 120,000. Most photoprocessing labs use some method to reducesilver concentrations, but all of the other undesirable effluents generally remain untreated.Again, because it is totally recyclable, the DuCare fixer completely eliminates these releases.
35 While the product must be transported off-site, it is technically a form of "in-process" recycling.
James Boyd RFF 98-30
27
The DuCare washwater treatments reduce freshwater consumption, which is significant inphotochemical processing. These kinds of benefits arise each time a graphic arts customeremploys the product. Calculated on a base of 500 customers, DuPont estimates that theDuCare system results, annually, in a 10 ton reduction in silver emissions and a 375,000 tonreduction in other chemical wastes.36
From a private financial perspective, DuPont saw a commercial opportunity in itsability to sell this kind of pollution prevention. This is in contrast to the two cases we havepreviously analyzed. In the previous cases, the analysis related to decisions regarding a firm'sown investment in pollution prevention. The DuPont case is somewhat different. TheDuPont case features financial and marketing analysis relating to a pollution preventiontechnology that it wishes to sell to other firms. To a great extent, then, the case's focus will beon the demand of DuPont's customers for pollution prevention.
Customer demand for pollution prevention was a primary motivator for DuPont'sdevelopment of the product. The DuCare system was envisioned as a way to reduceenvironmental compliance costs for its film and photochemical customers. While beingassociated with environmental leadership is mentioned in company documents as a desirableaspect of the product, the primary motivation was financial. DuPont expected to make moneyby selling pollution prevention to its customers. The market opportunity became possible viathe reality (and perception) of increasingly stringent environmental regulation.37 As productplanning proposals spelled out clearly, "customers want to minimize environmental risk andliability and want help in managing these issues." By eliminating emissions, DuCare wouldhelp its customers' regulatory compliance issues disappear. There was the possibility that theDuCare system might be viewed by regulators as a best available control technology status.Moreover, full recyclability meant that customers who used third-party disposal wouldeliminate any "cradle to grave" liability exposures associated with that transaction.
The regulatory and legal environment in which graphic arts photo-processors exist wasexpected to give rise to a demand for pollution prevention. This demand could be satisfiedvia DuPont's technology, service, and transportation system, presumably at some profit toDuPont. Also, there was a generally accepted belief among managers that an environmentalprocessing technology would lead, not only to increased photochemical sales, but to increasedfilm sales, as well. This was a significant financial driver for DuPont since film sales createthe bulk of its graphic arts revenues and profits.38
36 DuPont estimates that, industry-wide, 30 million gallons of used fixer and developer are created annually. On theassumption that each square meter of processed film creates 800 ml of waste fixer and developer, this annual effluentcontains approximately 1,000 tons of hydroquinone, 1,000 tons of sodium sulfite, 2,000 tons of ammonia, and 75tons of silver. Currently, the vast majority of this waste either is released to POTWs or is dumped illegally.37 DuCare strategy documents highlighted changing patterns and stringency of regulation. "Public concernabout the environment has led to more regulations and increasing enforcement. As a result, photochemicaleffluents are coming under greater scrutiny and more stringent control across North America."38 This synergy was quantitatively estimated in firm analyses. Each gallon of recycled developer was expectedto generate demand for 50 to 100 square feet of DuPont film.
James Boyd RFF 98-30
28
DuCare Today
The DuCare system was introduced commercially by DuPont in 1994. Since then, theproduct has been successful, when viewed from a technical perspective. From a chemistry andproduct design standpoint, all elements of the system have performed as projected. Unfortunately,the product has failed, by a significant margin, to live up to its initial financial promise.Development-stage projections were quite promising. A 1993 financial analysis predicted that theproduct would have a 10-year net present value of $2.78 million, not including film sales attributedto customer use of DuCare. Film sales generated by DuCare were estimated to have an additional$6.5 million 10-year NPV. Currently, however, the product has failed to turn any profit.Excluding the uncertain value of stimulated film sales, the product has to date been unable to earnrevenues sufficient to recover operating and startup costs.
The most direct explanation for this failure to meet expectations is that consumerdemand for the product has been much weaker than predicted. A 1992 business plan offered a"conservative" estimate that DuCare would lead to a 10 percent--and continuously increasing--market share in the graphic arts film and photochemicals business. Today, that market share isless than 5 percent. Out of an estimated universe of more than 16,000 potential customers,DuCare is currently used by fewer than 600.
The DuPont graphic arts business unit--the business unit that developed andcommercialized DuCare--is being sold to Agfa, a competitor in the graphic arts business. Thesale comes on the heels of relatively poor financial performance from the graphic artsbusiness unit generally. DuPont's inability to motivate significant sales of the DuCare systemcontributed to these financial difficulties. We now turn to the question of why demand for theDuCare product fell so far short of expectations.
Why Has Demand for the DuCare System Been Relatively Weak?
DuCare is a pollution prevention technology embedded in a photo-processing system.DuPont's customers, while potentially drawn to pollution prevention, are primarily purchasinga photo-processing system. The photo-processing market itself is quite competitive.DuPont's direct competitors include Kodak, Agfa, Anitec, Fuji, and 3M. Thus, a direct, butincomplete, explanation for DuCare's financial under-performance is that other firms haveout-competed DuPont. To understand why this may be, note that a customer is essentiallychoosing a process technology with two primary features: price and environmentalperformance. DuCare has failed to sell up to expectations because it is at the high end of theprice spectrum and because customers (apparently) do not feel that its environmentalcharacteristics are sufficiently valuable to outweigh the price premium. At this point it isuseful to turn to a more detailed analysis of DuCare's costs and environmental benefits,relative to other options available to DuPont's customers. We will compare DuCare to(1) DuPont's existing (and more "standard") photochemical process and (2) a competing,photoprocessing technology with pollution prevention features.
James Boyd RFF 98-30
29
A non-environmental cost comparison
First, consider the non-environmental costs associated with the alternatives. Theseinclude up-front capital, chemical input, chemical processing, and transport costs.
DuCare vs. the standard process. Excluding environmental considerations, thestandard photochemical process is cheap, relative to DuCare. The chemicals employed arecheaper to produce and more competitively supplied. The recyclability of the DuCarechemicals means that there is less of a need to purchase "fresh" chemicals, but thetransportation and chemical recycling costs mean that even recycled batches of the chemicalsare more expensive than DuPont's standard chemicals. For example, the standard developercosts $1.79 per gallon. The DuCare developer is more than twice as expensive, costing $4.65per gallon. This is a single up-front cost differential, however, since it relates only to the costof the initial batch of developer. Subsequent, recycled batches cost $1.38 per gallon. Doesthis mean that the DuCare developer is cheaper in the long run? No, since the $1.38 cost doesnot include the cost of transporting the developer as part of the recycling process.Transportation costs add an additional $.81 per gallon.
As for the recyclable fixer, it is more expensive than standard fixer, but is also ofhigher concentration. The greater concentration implies a lower replenishment rate, so thatcustomers ultimately need to purchase less fixer. So despite its higher price per gallon, therecyclable fixer's effective cost is roughly equivalent to the costs of a non-recyclable fixer.Again, though, transportation adds further to the overall cost. Because fixer has a"hazardous" regulatory classification, its transportation costs are even higher than they are fordeveloper. With a hazardous classification, licensed transport and storage is required. Thistranslates into fixer transportation costs of $1.42 per gallon, on average. (A set of additionalproblems associated with fixer's hazardous classification is discussed below.)
Up-front capital costs associated with the standard DuPont and DuCare systems arecomparable.
DuCare vs. a competing environmental process. A competing technology, called OnLine Recirculating Electrolysis (ORE) allows for effluent reductions and reduces the fixerreplenishment rate. From a non-environmental standpoint, the ORE technology requires amuch higher up-front capital cost ($10,000 versus $3,000) than does the DuCare system.However, it has lower on-going chemical costs and, because it is not a recycling technology,does not have the costs associated with chemical transportation to a recycling facility.Excluding environmental considerations, the ORE technology is a cheaper long-runalternative to DuCare. And because of its desirable impact on fixer replenishment, its long-run cost may be even less than the cost of the more standard photochemical process.
Note that this cost analysis highlights a fact with significant competitive implications.Quite simply, unless compliance costs are considered to be a relevant concern, the DuCaresystem is more expensive than other options available to DuPont's customers.
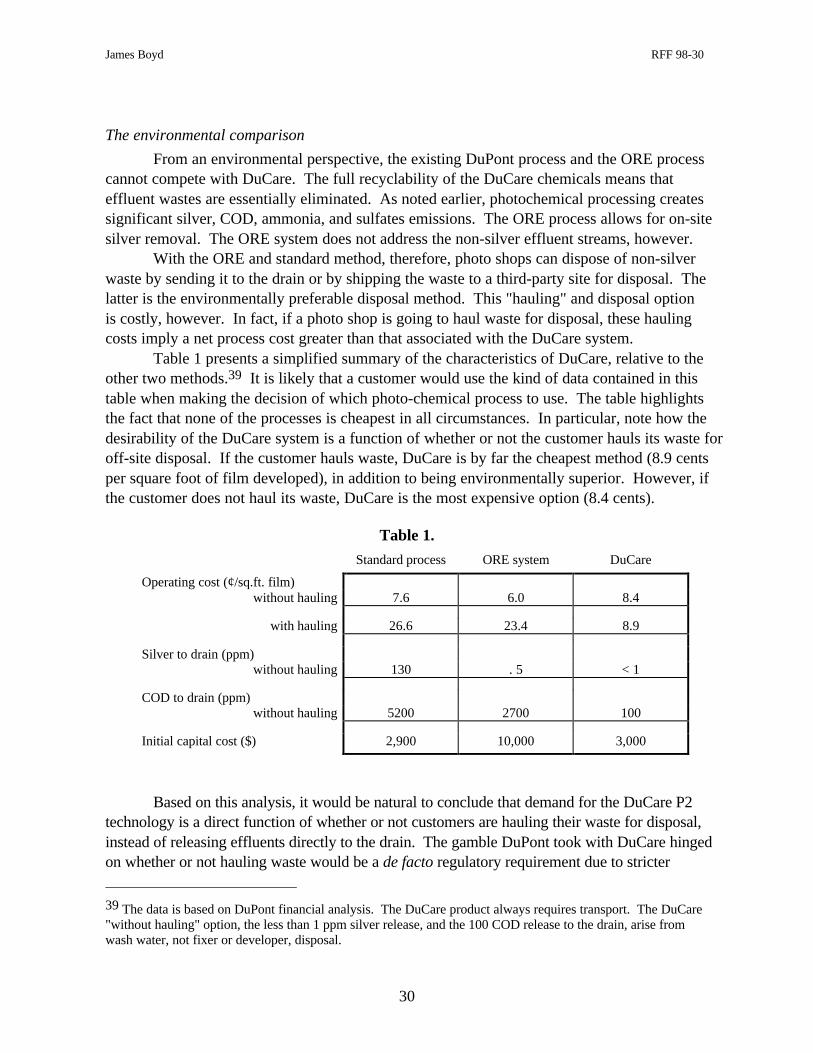
James Boyd RFF 98-30
30
The environmental comparison
From an environmental perspective, the existing DuPont process and the ORE processcannot compete with DuCare. The full recyclability of the DuCare chemicals means thateffluent wastes are essentially eliminated. As noted earlier, photochemical processing createssignificant silver, COD, ammonia, and sulfates emissions. The ORE process allows for on-sitesilver removal. The ORE system does not address the non-silver effluent streams, however.
With the ORE and standard method, therefore, photo shops can dispose of non-silverwaste by sending it to the drain or by shipping the waste to a third-party site for disposal. Thelatter is the environmentally preferable disposal method. This "hauling" and disposal optionis costly, however. In fact, if a photo shop is going to haul waste for disposal, these haulingcosts imply a net process cost greater than that associated with the DuCare system.
Table 1 presents a simplified summary of the characteristics of DuCare, relative to theother two methods.39 It is likely that a customer would use the kind of data contained in thistable when making the decision of which photo-chemical process to use. The table highlightsthe fact that none of the processes is cheapest in all circumstances. In particular, note how thedesirability of the DuCare system is a function of whether or not the customer hauls its waste foroff-site disposal. If the customer hauls waste, DuCare is by far the cheapest method (8.9 centsper square foot of film developed), in addition to being environmentally superior. However, ifthe customer does not haul its waste, DuCare is the most expensive option (8.4 cents).
Table 1.
Standard process ORE system DuCare
Operating cost (¢/sq.ft. film)without hauling 7.6 6.0 8.4
with hauling 26.6 23.4 8.9
Silver to drain (ppm)without hauling 130 . 5 < 1
COD to drain (ppm)without hauling 5200 2700 100
Initial capital cost ($) 2,900 10,000 3,000
Based on this analysis, it would be natural to conclude that demand for the DuCare P2technology is a direct function of whether or not customers are hauling their waste for disposal,instead of releasing effluents directly to the drain. The gamble DuPont took with DuCare hingedon whether or not hauling waste would be a de facto regulatory requirement due to stricter
39 The data is based on DuPont financial analysis. The DuCare product always requires transport. The DuCare"without hauling" option, the less than 1 ppm silver release, and the 100 COD release to the drain, arise fromwash water, not fixer or developer, disposal.
James Boyd RFF 98-30
31
effluent standards and greater enforcement. According to one document, "in areas with strictregulations where hauling waste is becoming the norm, the Zero Effluent offering will have asignificant cost advantage." The fact that demand for DuCare has not been as strong asenvisioned may be explained by relatively lax enforcement of photochemical waste regulations.
Regulatory Pressure and the Market for P2
From the beginning, the project's financial and strategic analyses identified regulatorypressure as the primary driver of the market for DuCare. Much of DuPont's optimistic financialand marketing analyses was predicated on the assumption that regulatory compliance and standardswould continuously tighten and affect larger and larger numbers of graphic arts facilities. Becauseof the perceived trend in regulatory stringency, the firm felt that "the financial advantage ofcompetitive offerings is already gone in some areas and is expected to be short-lived in manymore." As part of its analysis, DuCare financial projections and business plans included an"environmental pressure map" of the United States. This map ranked different areas (down to thezip-code level) in terms of regulatory stringency--stringency being measured by allowable silverconcentrations and the perceived likelihood of enforcement. Three categories were differentiated:"strict," "transitioning," and "lax."40 Customer concentrations were then laid on top of this map tocreate an overall estimate of the number of potential customers in stringent or transitioning areas.These firms were DuPont's target customer group.
The importance of regulatory pressure is further highlighted by the degree to whichlax regulatory enforcement was viewed by project managers as an unlikely risk, but one of thekey assumptions on which marketing projections were based. As one document, labeled "KeyBusiness Risks and Assumptions" put it, there was a risk that "customers may be unwilling topay for [DuCare] services in environmentally lax or transitioning areas."
Existing effluent standards can act as a powerful motivator for pollution prevention bycreating markets for technologies that can address firms' compliance issues. It isimportant to emphasize, however, that standards must be monitored and enforced ifthey are to have the maximum impact.
It is difficult to definitively establish that insufficiently aggressive effluent monitoring andenforcement is the root cause of DuCare's difficulties. The financial analysis presented above,however, points to enforcement issues as at least a partial cause of DuPont's marketing problems.
It is not entirely surprising that monitoring and enforcement would be problematic.Photochemical drain discharge occurs in relatively small amounts and by numerous,
40 "Strict" areas were defined as those in which there was an enforced silver standard below 1 part per million.A "lax" area was one in which the standard was greater than 5 ppm or one in which standards were "notenforced" at all.
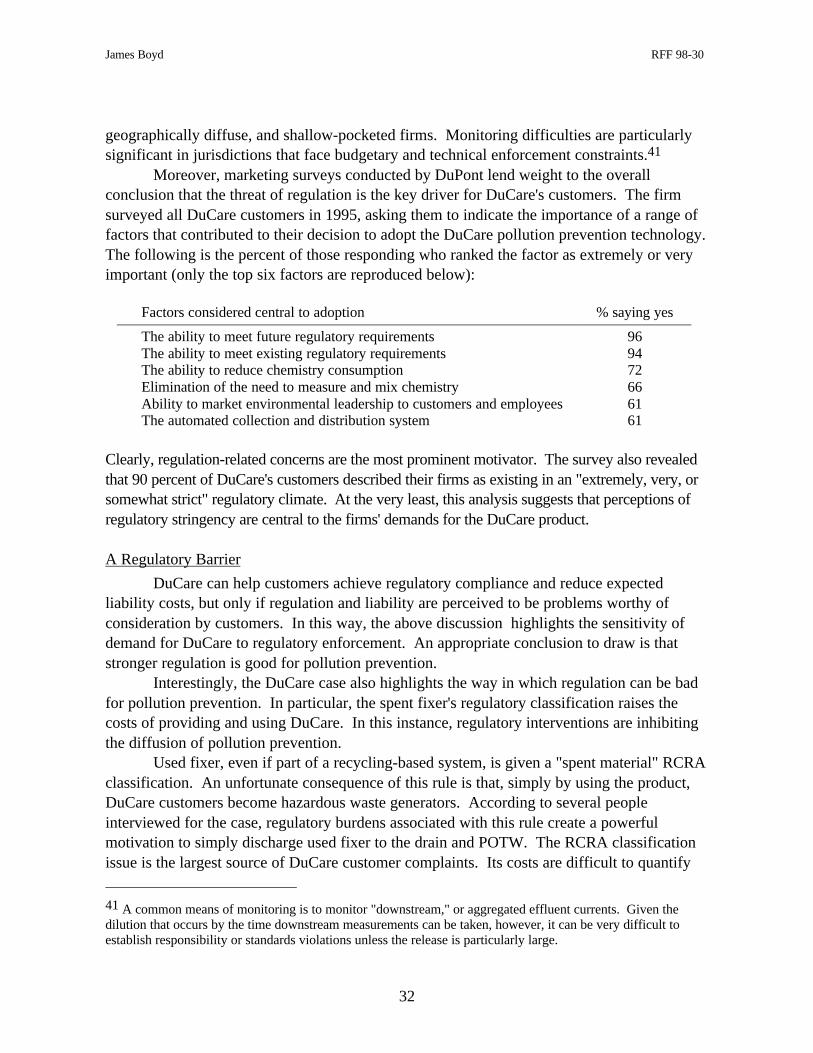
James Boyd RFF 98-30
32
geographically diffuse, and shallow-pocketed firms. Monitoring difficulties are particularlysignificant in jurisdictions that face budgetary and technical enforcement constraints.41
Moreover, marketing surveys conducted by DuPont lend weight to the overallconclusion that the threat of regulation is the key driver for DuCare's customers. The firmsurveyed all DuCare customers in 1995, asking them to indicate the importance of a range offactors that contributed to their decision to adopt the DuCare pollution prevention technology.The following is the percent of those responding who ranked the factor as extremely or veryimportant (only the top six factors are reproduced below):
Factors considered central to adoption % saying yes
The ability to meet future regulatory requirements 96The ability to meet existing regulatory requirements 94The ability to reduce chemistry consumption 72Elimination of the need to measure and mix chemistry 66Ability to market environmental leadership to customers and employees 61The automated collection and distribution system 61
Clearly, regulation-related concerns are the most prominent motivator. The survey also revealedthat 90 percent of DuCare's customers described their firms as existing in an "extremely, very, orsomewhat strict" regulatory climate. At the very least, this analysis suggests that perceptions ofregulatory stringency are central to the firms' demands for the DuCare product.
A Regulatory Barrier
DuCare can help customers achieve regulatory compliance and reduce expectedliability costs, but only if regulation and liability are perceived to be problems worthy ofconsideration by customers. In this way, the above discussion highlights the sensitivity ofdemand for DuCare to regulatory enforcement. An appropriate conclusion to draw is thatstronger regulation is good for pollution prevention.
Interestingly, the DuCare case also highlights the way in which regulation can be badfor pollution prevention. In particular, the spent fixer's regulatory classification raises thecosts of providing and using DuCare. In this instance, regulatory interventions are inhibitingthe diffusion of pollution prevention.
Used fixer, even if part of a recycling-based system, is given a "spent material" RCRAclassification. An unfortunate consequence of this rule is that, simply by using the product,DuCare customers become hazardous waste generators. According to several peopleinterviewed for the case, regulatory burdens associated with this rule create a powerfulmotivation to simply discharge used fixer to the drain and POTW. The RCRA classificationissue is the largest source of DuCare customer complaints. Its costs are difficult to quantify
41 A common means of monitoring is to monitor "downstream," or aggregated effluent currents. Given thedilution that occurs by the time downstream measurements can be taken, however, it can be very difficult toestablish responsibility or standards violations unless the release is particularly large.
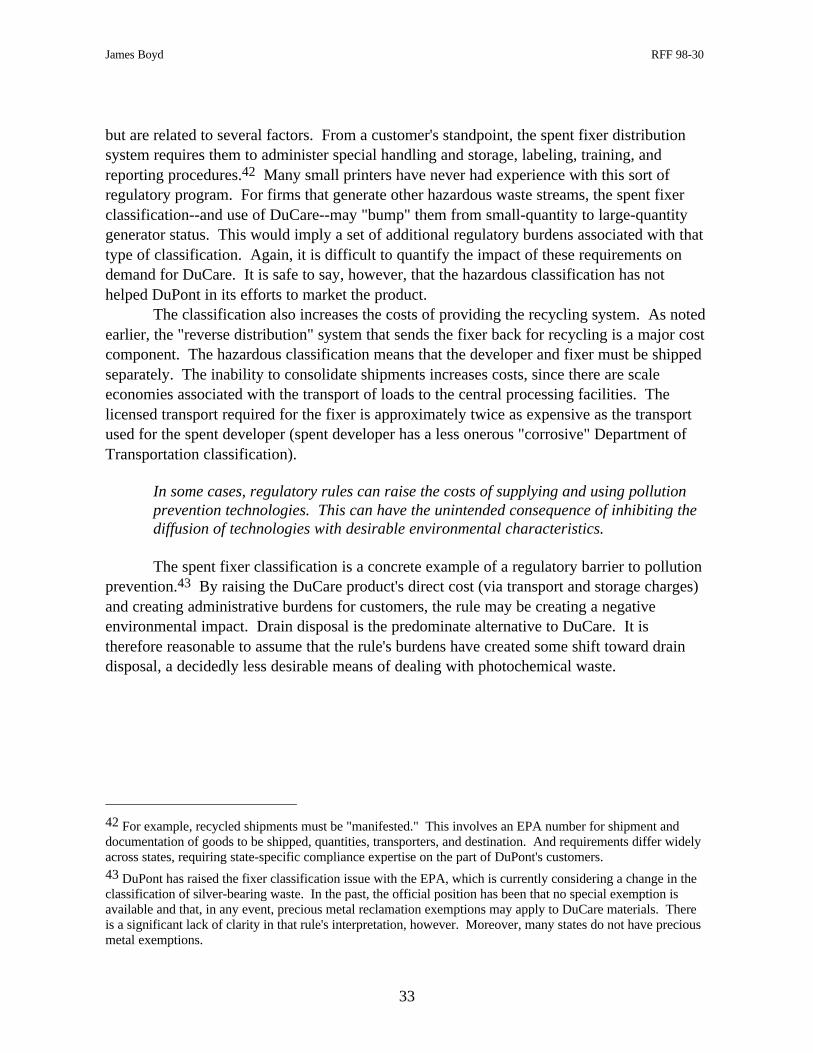
James Boyd RFF 98-30
33
but are related to several factors. From a customer's standpoint, the spent fixer distributionsystem requires them to administer special handling and storage, labeling, training, andreporting procedures.42 Many small printers have never had experience with this sort ofregulatory program. For firms that generate other hazardous waste streams, the spent fixerclassification--and use of DuCare--may "bump" them from small-quantity to large-quantitygenerator status. This would imply a set of additional regulatory burdens associated with thattype of classification. Again, it is difficult to quantify the impact of these requirements ondemand for DuCare. It is safe to say, however, that the hazardous classification has nothelped DuPont in its efforts to market the product.
The classification also increases the costs of providing the recycling system. As notedearlier, the "reverse distribution" system that sends the fixer back for recycling is a major costcomponent. The hazardous classification means that the developer and fixer must be shippedseparately. The inability to consolidate shipments increases costs, since there are scaleeconomies associated with the transport of loads to the central processing facilities. Thelicensed transport required for the fixer is approximately twice as expensive as the transportused for the spent developer (spent developer has a less onerous "corrosive" Department ofTransportation classification).
In some cases, regulatory rules can raise the costs of supplying and using pollutionprevention technologies. This can have the unintended consequence of inhibiting thediffusion of technologies with desirable environmental characteristics.
The spent fixer classification is a concrete example of a regulatory barrier to pollutionprevention.43 By raising the DuCare product's direct cost (via transport and storage charges)and creating administrative burdens for customers, the rule may be creating a negativeenvironmental impact. Drain disposal is the predominate alternative to DuCare. It istherefore reasonable to assume that the rule's burdens have created some shift toward draindisposal, a decidedly less desirable means of dealing with photochemical waste.
42 For example, recycled shipments must be "manifested." This involves an EPA number for shipment anddocumentation of goods to be shipped, quantities, transporters, and destination. And requirements differ widelyacross states, requiring state-specific compliance expertise on the part of DuPont's customers.43 DuPont has raised the fixer classification issue with the EPA, which is currently considering a change in theclassification of silver-bearing waste. In the past, the official position has been that no special exemption isavailable and that, in any event, precious metal reclamation exemptions may apply to DuCare materials. Thereis a significant lack of clarity in that rule's interpretation, however. Moreover, many states do not have preciousmetal exemptions.
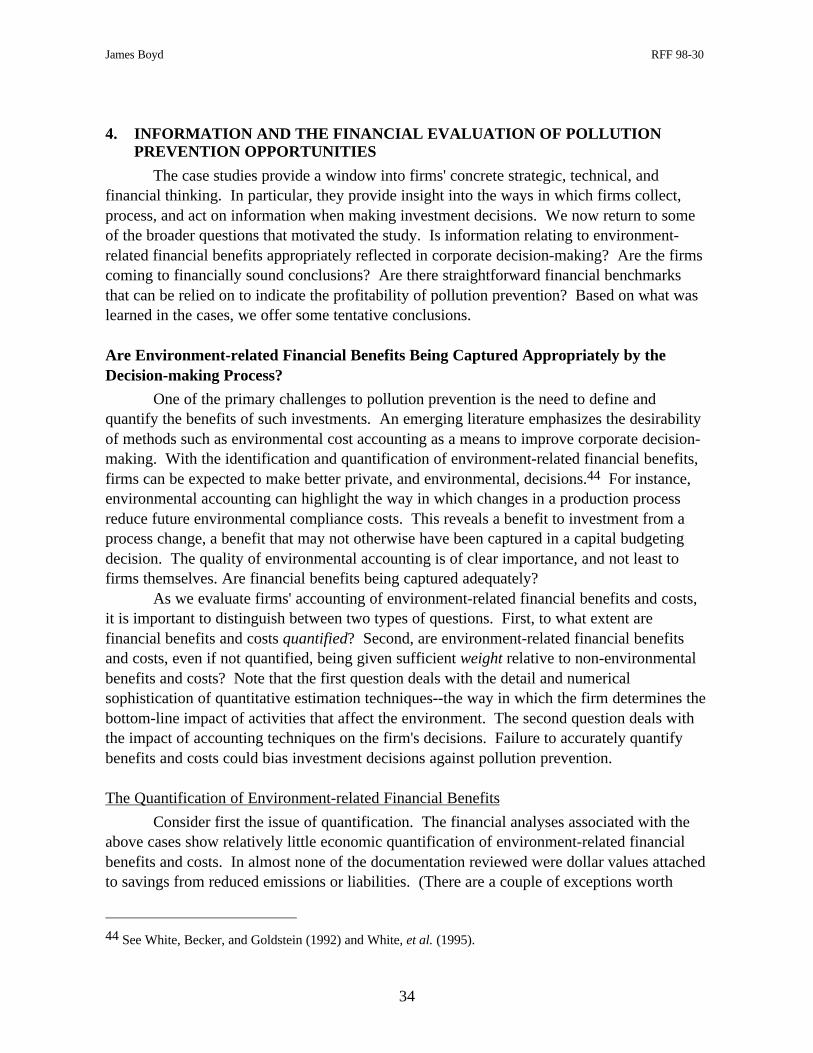
James Boyd RFF 98-30
34
4. INFORMATION AND THE FINANCIAL EVALUATION OF POLLUTIONPREVENTION OPPORTUNITIES
The case studies provide a window into firms' concrete strategic, technical, andfinancial thinking. In particular, they provide insight into the ways in which firms collect,process, and act on information when making investment decisions. We now return to someof the broader questions that motivated the study. Is information relating to environment-related financial benefits appropriately reflected in corporate decision-making? Are the firmscoming to financially sound conclusions? Are there straightforward financial benchmarksthat can be relied on to indicate the profitability of pollution prevention? Based on what waslearned in the cases, we offer some tentative conclusions.
Are Environment-related Financial Benefits Being Captured Appropriately by theDecision-making Process?
One of the primary challenges to pollution prevention is the need to define andquantify the benefits of such investments. An emerging literature emphasizes the desirabilityof methods such as environmental cost accounting as a means to improve corporate decision-making. With the identification and quantification of environment-related financial benefits,firms can be expected to make better private, and environmental, decisions.44 For instance,environmental accounting can highlight the way in which changes in a production processreduce future environmental compliance costs. This reveals a benefit to investment from aprocess change, a benefit that may not otherwise have been captured in a capital budgetingdecision. The quality of environmental accounting is of clear importance, and not least tofirms themselves. Are financial benefits being captured adequately?
As we evaluate firms' accounting of environment-related financial benefits and costs,it is important to distinguish between two types of questions. First, to what extent arefinancial benefits and costs quantified? Second, are environment-related financial benefitsand costs, even if not quantified, being given sufficient weight relative to non-environmentalbenefits and costs? Note that the first question deals with the detail and numericalsophistication of quantitative estimation techniques--the way in which the firm determines thebottom-line impact of activities that affect the environment. The second question deals withthe impact of accounting techniques on the firm's decisions. Failure to accurately quantifybenefits and costs could bias investment decisions against pollution prevention.
The Quantification of Environment-related Financial Benefits
Consider first the issue of quantification. The financial analyses associated with theabove cases show relatively little economic quantification of environment-related financialbenefits and costs. In almost none of the documentation reviewed were dollar values attachedto savings from reduced emissions or liabilities. (There are a couple of exceptions worth
44 See White, Becker, and Goldstein (1992) and White, et al. (1995).
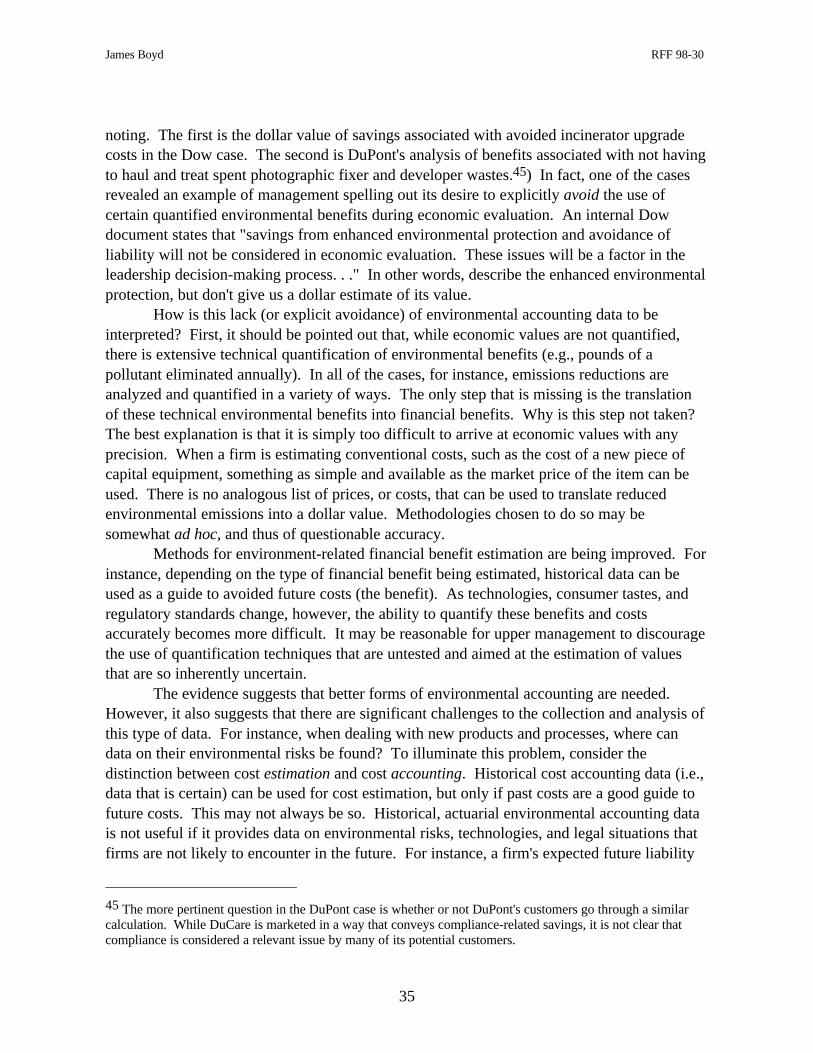
James Boyd RFF 98-30
35
noting. The first is the dollar value of savings associated with avoided incinerator upgradecosts in the Dow case. The second is DuPont's analysis of benefits associated with not havingto haul and treat spent photographic fixer and developer wastes.45) In fact, one of the casesrevealed an example of management spelling out its desire to explicitly avoid the use ofcertain quantified environmental benefits during economic evaluation. An internal Dowdocument states that "savings from enhanced environmental protection and avoidance ofliability will not be considered in economic evaluation. These issues will be a factor in theleadership decision-making process. . ." In other words, describe the enhanced environmentalprotection, but don't give us a dollar estimate of its value.
How is this lack (or explicit avoidance) of environmental accounting data to beinterpreted? First, it should be pointed out that, while economic values are not quantified,there is extensive technical quantification of environmental benefits (e.g., pounds of apollutant eliminated annually). In all of the cases, for instance, emissions reductions areanalyzed and quantified in a variety of ways. The only step that is missing is the translationof these technical environmental benefits into financial benefits. Why is this step not taken?The best explanation is that it is simply too difficult to arrive at economic values with anyprecision. When a firm is estimating conventional costs, such as the cost of a new piece ofcapital equipment, something as simple and available as the market price of the item can beused. There is no analogous list of prices, or costs, that can be used to translate reducedenvironmental emissions into a dollar value. Methodologies chosen to do so may besomewhat ad hoc, and thus of questionable accuracy.
Methods for environment-related financial benefit estimation are being improved. Forinstance, depending on the type of financial benefit being estimated, historical data can beused as a guide to avoided future costs (the benefit). As technologies, consumer tastes, andregulatory standards change, however, the ability to quantify these benefits and costsaccurately becomes more difficult. It may be reasonable for upper management to discouragethe use of quantification techniques that are untested and aimed at the estimation of valuesthat are so inherently uncertain.
The evidence suggests that better forms of environmental accounting are needed.However, it also suggests that there are significant challenges to the collection and analysis ofthis type of data. For instance, when dealing with new products and processes, where candata on their environmental risks be found? To illuminate this problem, consider thedistinction between cost estimation and cost accounting. Historical cost accounting data (i.e.,data that is certain) can be used for cost estimation, but only if past costs are a good guide tofuture costs. This may not always be so. Historical, actuarial environmental accounting datais not useful if it provides data on environmental risks, technologies, and legal situations thatfirms are not likely to encounter in the future. For instance, a firm's expected future liability
45 The more pertinent question in the DuPont case is whether or not DuPont's customers go through a similarcalculation. While DuCare is marketed in a way that conveys compliance-related savings, it is not clear thatcompliance is considered a relevant issue by many of its potential customers.
James Boyd RFF 98-30
36
costs should probably not be estimated by looking at its past Superfund liability costs.Because of Superfund, firms dispose of wastes very differently than they did 20 and 30 yearsago. Because of its highly uncertain technical and legal nature, environmental cost estimationmay inherently be more speculative than we, or firms themselves, would hope.
The Effect of Uncertain Financial Benefits on Decision-making
Given the lack of quantified financial benefits, do the cases suggest that potentialenvironmental improvements are given inadequate weight by corporate decision-makers?The answer is no. While un-quantified, environmental benefits are given significantqualitative value in the decision-making process. Evidence for qualitative weighting includesthe inclusion of environmental benefits as key "drivers" in the decision-making process.Environmental benefits, such as physical data on quantities of emissions reduced, areroutinely featured in summary documents presented to upper management at the time ofdecision-making. The "paper trail" (agendas, strategic analyses, and decision-makingsummaries) followed to re-construct these cases are permeated with a qualitativeunderstanding of environmental benefits. The cases suggest, therefore, that non-quantifiedenvironmental benefits do not necessarily imply an inadequate weighting of environmentalbenefits in the decision-making process. Instead, lack of quantification may simply indicatethe inherent difficulty of establishing precise financial values. In light of this, it also deservesmention that many types of accounting data (i.e., not just environmental accounting data) areoften incomplete and surprisingly imprecise. Thus, evidence of poor environmentalaccounting data and procedures can be viewed as a symptom of poor accounting techniquesgenerally, rather than as evidence of a specific environmental accounting problem.46
Are Firms Missing Win-Win Pollution Prevention Opportunities?
Some observers believe that companies fail to pursue their own economic self-interestwhen it comes to pollution prevention. For instance, Porter (1995, 132) claims that companiesexaggerate the risk of environmental investments, use inappropriate rate of return hurdles, andthus "leave ten-dollar bills on the ground." This type of assertion, while thought-provoking, isdifficult to prove or refute without evidence related to actual corporate investment decisions.Even when an investment is explored in detail, as in the NRDC study of the same Dow LaPorteinvestment described in this paper (Greer and van Loben Sels, 1997), conclusions about an
46 There is a justifiable concern that environmental benefits may not be captured adequately by accountingprocedures based on short time horizons. However, in the cases (Dow and DuPont) where yearly cash flows wereestimated, the time horizon used was ten years. (Current corporate guidelines at Monsanto require evaluation overa 10 year horizon.) Particularly given the effects of discounting, a 10 year horizon is methodologically sound andshould capture the lion's share of net present environmental benefits.
James Boyd RFF 98-30
37
investment's economic desirability are often made without adequate analysis of business andfinancial considerations.47
The case studies in this paper were motivated in large part by the desire to betterunderstand the corporate rationale for rejecting, or delaying, identifiable pollution preventionopportunities. As the cases show, basic concepts from business and financial theory suggestthat the firms' investment decisions were financially rational. This is contrary to the view thatfirms suffer from a myopic inability to appreciate cost-saving P2 investments. Instead,significant unresolved technical difficulties, uncertain market conditions, and, in some cases,regulatory barriers or insufficient emissions enforcement, rendered the investments financiallyunattractive. In many cases, the mystery of why firms do not pursue P2 opportunities can beresolved by simply having a deeper understanding of the costs, benefits, and risks associatedwith those investments.
This conclusion implies nothing about the social desirability of the firms' decisions.Reasonable persons can--and do--differ regarding how much pollution prevention is the rightamount of pollution prevention. But it does imply that there may be fewer high-return P2opportunities than many believe. Those who favor mandated, command and control-style,regulations may wish to claim that many high-return, win-win opportunities exist, but thatfirms ignore those opportunities. After all, if this were true, command and control regulationscould be viewed as forcing firms to do what is in their own economic self-interest anyway.This line of thinking should be viewed with skepticism. The investments analyzed here wereby no means clear-cut financial winners. The cases suggest that firms are quite capable ofidentifying the actions that are in their greatest financial self-interest.
Information Barriers and the Search for Clear Financial Benchmarks of P2 Profitability
The cases challenge the belief that organizational barriers are to blame for missed ordelayed P2 opportunities. Nevertheless, it should also be clear that firms face significantinformational problems when they evaluate new investment opportunities. Managers neverhave perfect information regarding the costs and benefits of a new investment. In fact,imperfect information explains a great deal about the way in which firms analyze and makeinvestments. It is important, however, to distinguish between a firm's imperfect methods fordealing with imperfect information and evidence of organizational failures.
The term "organization failure" connotes the existence of a correctable managementstrategy, accounting procedure, or financial methodology. For instance, if the benefits of anenvironmental investment were analyzed only over a 3-year horizon, this could easily be
47 This paper's description of the La Porte investment decision owes a great deal to the NRDC's excellenttechnical study of pollution prevention opportunities at the plant. It disagrees with the study's conclusionsregarding the financial desirability of TOX retirement, however. Dow's failure to approve the investment is takenas evidence that "cost savings are not enough to convince industry to adopt prevention actions" (p. 418). Thisconclusion is based on the authors' belief that TOX retirement would reduce costs for Dow. But conclusionsabout cost savings require business and financial analysis that is as detailed as NRDC's technical analysis. Whendetailed financial analysis is brought to bear on the question of cost savings, those savings are far from certain.
James Boyd RFF 98-30
38
labeled an organizational failure. The failure to account for benefits beyond three years couldeasily be corrected by a longer-horizon investment analysis. And better, more profitabledecisions would be expected. Similarly, if financial managers rarely spoke withenvironmental managers or infrequently integrated regulatory expertise into business analysis,this could be easily, and profitably, corrected. The cases, however, exhibit little in the way ofthese correctable types of failure. Instead, the cases depict managers struggling with muchmore formidable challenges to investment decision-making--challenges that are pervasive andnot limited to the analysis of environmental investments.
Consider the concept of a "hurdle rate" for new investments. Most firms define a rate ofreturn that new projects must exceed before capital is directed toward the investment. In general,firms will not make investments that fall short of the hurdle rate, even if the investments have apositive rate of return. This can be a source of frustration to advocates of pollution prevention,who see a positive rate of return as evidence of profitability. A positive rate of return seems tobe a clear benchmark. When firms ignore that benchmark and focus on some higher hurdle rateit is natural to suspect the firm's "decision rule." But is a hurdle rate decision rule a correctableorganizational failure? The answer is no. Hurdle rates and the rationing of capital serve animportant, inescapable corporate function. They are means by which firms account for the risksof investment and inherent imperfection of information at their disposal.
The Rate of Return
In order to explore these concepts in more detail, consider a hypothetical P2investment opportunity that has been estimated to have a 30 percent rate of return. How canwe explain why a firm would not make an investment that offers such an apparently positivereturn on investment?
In a capital budgeting context, the "internal rate of return" (IRR) on a proposed projectis a function of the timing and size of "cash flows" associated with the project. Cash flowsinclude the initial cost of a project (the outlay) and its subsequent inflows (such as salesrevenues). While rate of return is a concept that seems intuitive, it is actually quite subtle.Consider the technical definition of IRR: a project's internal rate of return is the discount rateat which the project's net present value is zero. While the technical definition is somewhatobscure, for simplicity, it is possible to think of rate of return as a measure that accounts for aproject's benefits and costs, year-by-year.
The first point to make about IRR calculations is that in the capital budgeting stagerates of return are always estimates, and thus are inescapably uncertain. An IRR estimate isonly as good as the analysis on which it is based. Techniques such as environmental costaccounting are methods to improve the accuracy of these estimates. Environmental costaccounting allows for a more complete accounting of the cash flows that form the basis of theIRR calculation. A problem with rate of return calculations may be that they fail toincorporate "soft" (harder to quantify) costs and benefits. If this is true, a 30 percent rate ofreturn estimate may be "adjusted" qualitatively by managers. For instance, if a project has acalculated rate of return of 30 percent, but will result in employee layoffs, the cost of which
James Boyd RFF 98-30
39
has not been quantified, managers should view the 30 percent figure as being too high.Alternatively, if the project analysis does not include environmental cost savings, managerswould, appropriately, view the 30 percent figure as too low.
Accounting techniques must be evaluated in order to determine whether reportedbenchmark figures (such as rate of return) are viewed by management insiders ascomplete and unbiased. Managers are likely to better understand the ways in whichtheir own analyses are biased. If so, benchmark figures must be interpreted with care,particularly by outside analysts.
Assuming the IRR is an unbiased, accurate estimate, the financially sound IRRinvestment rule is as follows: proceed with the investment if the IRR exceeds the cost ofcapital. Technically speaking, this rule ensures that the investment has a positive Net PresentValue, a measure of profitability. Projects are desirable (profit-maximizing) only if they havepositive NPVs. Thus, the IRR figure is by itself not a guide to an investment's desirability. Itis the comparison of IRR and cost of capital that is relevant.
Risk and the Cost of Capital
What is meant by the "cost of capital?" First, note that the cost of capital has little todo with what we normally think of as a "cost." In particular, it is distinct from the cashoutlays necessary to buy equipment or change a production process. These conventional costsare, in financial parlance, "negative cash flows." The cost of capital is not a cash flow.Instead, a project's cost of capital is defined as the "opportunity cost of using the capital forthe project versus using it for some other equivalent project." In other words, if a projectrequires a $100 cash outlay, the cost of capital is not the $100. The cost of capital is the costof not spending the $100 on something else.
Returning to the definition, the cost of capital is the opportunity cost of using thecapital for this project versus using it for some other equivalent projects. What are equivalentprojects? Equivalent projects are those that pose equivalent risks. The relationship betweenrisk and the cost of capital is central to the analysis of capital budgeting decisions. Whensomeone loans or invests their money they are concerned with both the expected return on andthe risk associated with the loan or investment. Investors have varying "tastes" for risk andreturn. Some prefer safer investments. Those willing to accept risk can do so, and becausethey take on these risks, command a higher expected return.
When a firm seeks money for a risky project it must raise the capital from investorswho are attracted to the level of risk and return presented by the project. But note that theseinvestors could just as easily invest their money in other firms' risky projects. Theopportunity cost of investing $100 in the project is thus the cost of giving up the opportunityto invest $100 in other projects with similar risk profiles. What is the "opportunity" that isbeing given up? The opportunity is the ability to earn the rate of return associated with the
James Boyd RFF 98-30
40
other projects. If a 30 percent return can be earned on other investments, a firm needs toshow investors that their risk-equivalent project can yield a return of at least 30 percent.
Determining the cost of capital therefore requires an understanding of otheropportunities available in the market. Financial tools such as the Capital Asset Pricing Model(CAPM) account for the importance of risk and are designed to value investment opportunities.Capital cost estimation requires knowledge of the broader market's "risk free interest rate" and"market risk premium." These terms, respectively, relate to the returns offered by a perfectlysafe investment and a diversified stock or bond portfolio. Then, the firm must estimate itsequity and debt "betas." Roughly, these betas measure the contribution of an investment in thefirm to the riskiness of a diversified portfolio. With these estimates a firm's cost of capital canbe estimated. The technical, mathematical nature of these concepts should not obscure the factthat the process of estimating them is as much an art-form as it is a science.
Rate of return is relevant only as it compares to a project's cost of capital. Moreover,the cost of capital is not typically easy to measure, since it is intimately related toproject risk. Thus, the implication of a particular rate of return figure for decision-making requires detailed knowledge of factors contributing to risk. No single rate ofreturn "hurdle" can be used as a benchmark for judging an investment's profitability.
Finally, it should be noted that a firm's cost of capital will not in general be the sameas the cost of capital for a specific project. Because the cost of capital is a function of risk,capital costs will differ in different divisions, for different product lines, and across individualprojects. If the project in question is riskier than the firm's business generally, the cost ofcapital will be higher--because riskier investments demand a higher return. Ideally, then, it isdesirable to estimate the equity and debt betas associated with investments that are equivalentto the contemplated project. This usually involves the estimation of betas associated withother firms' investments. The difficulty in determining investments that are "risk-equivalent"is one of the things that makes the task subjective.
Capital Rationing
Now assume that a firm has calculated a project's cost of capital at 25 percent. If theIRR is 30 percent, should the firm make the investment? In general, yes, since these numbersindicate a positive net present value (the rate of return exceeds the opportunity cost ofcapital). In practice, however, businesses commonly depart from a pure "positive net presentvalue" decision rule. In other words, firms do not generally move forward with projectssimply because they have positive NPVs. Instead, firms often set limits on the capitalavailable to individual business units. This places a ceiling on funds available for newinvestment and forces managers to prioritize across projects, all of which may have positiveNPVs. This financial management technique is termed "capital rationing" and is usedcommonly in the private sector.
James Boyd RFF 98-30
41
Capital rationing is in evidence in the Monsanto and Dow cases. The P2 projects hadpositive rates of return, rates that may in fact have exceeded the firms' costs of capital.Nevertheless, the supply of investment capital to the business decision-making units waslimited by corporate headquarters. Thus, the capital constraint can be viewed as a culprit inthe failure of the firms to move forward with the investments. After all, if the businesses hadno such constraint any investment with a positive NPV would presumably be financed. Giventhis, is capital rationing an organizational barrier to pollution prevention? In other words, isthe rationing of capital an irrational, correctable corporate decision-making procedure?
To answer these questions, it is necessary to explore firms' rationale for limiting theavailability of capital to their business units. The principal rationale is that capital rationing isnecessary for internal financial control. In this view, rationing counters the tendency ofmanagers to overstate the benefits of investment opportunities with which they are involved.In general, it is very difficult to align the personal incentives of managers with the incentivesof the firm as a whole. For instance, compensation and prestige are invariably related to thescope of projects under a manager's control. This creates a tendency to propose and seekacceptance of a large number of investment projects. One way to seek acceptance for projectsis to make capital budgeting estimates that are over-optimistic. That is, managers may be ledto bias their forecasts of cash flows associated with a new investment (e.g., over-stateexpected benefits or under-state expected costs). Again, this emphasizes the inherentlyuncertain, and subjective, nature of financial data. Capital rationing, therefore, is a means tocorrect largely unavoidable problems associated with imperfect information, managerialmonitoring, and investment incentives.48 It should not be viewed as an easily correctableorganizational failure.
When capital is rationed, investments are not judged on the basis of whether the rateof return exceeds the cost of capital (the positive NPV rule). Instead, projects are typicallyranked, with capital invested in those promising the highest net return. In practice, this canmean that the most rational investments need not be those that promise the highest rates ofreturn or net present value. Instead, the most desirable projects are those that provide thehighest NPV per dollar invested.49
The implication is that capital rationing leads firms to prioritize their investments.While this may mean that certain P2 opportunities are passed over, it does not in general meanthat environmental investments are disadvantaged. The Dow La Porte investment isillustrative. One reason the TOX elimination project has not moved forward is that theproject has failed to meet the polyurethane business' current hurdle rate. The hurdle rate washigh--roughly 86 percent. The hurdle rate was this high, however, because an alternative use 48 For analyses that explore the theoretical justification for capital rationing see Holmstrom and Costa (1986)and Antle and Eppen (1985). They show how the private concerns of managers, combined with privateinformation, can create managerial incentives to over-invest. Capital rationing is shown to be an effectivecorporate strategy to counter these incentives.49 See Brealey and Meyers (1991) who give examples of the way in which investment rules under capitalrationing can violate the idealized NPV rule.
James Boyd RFF 98-30
42
of the business' funds promised an 86 percent return. Given capital rationing, money used atLa Porte would have taken away from this other project. In effect, the "bar was raised" on theLa Porte investment because of the need to prioritize expenditures and the existence ofhigher-priority investments.50 Also, it is worthy of note that the higher-priority investmentwas also more environmentally beneficial than the La Porte P2 investment would have been.Source reductions associated with the rival investment exceeded reductions at La Porte by anorder of magnitude. Thus, prioritized capital budgeting should not be viewed as a barrier topollution prevention. In fact, financially prioritized investment is also likely to lead toprioritized environmental innovation.
5. CONCLUSION: POLLUTION PREVENTION AND PUBLIC POLICY
The cases presented in this analysis were explored in order to shed light on theorganizational and economic issues that shape pollution prevention decision-making. Forthose concerned about environmental quality, it is natural to be frustrated with decisions thatreject or delay investments that could improve a corporation's environmental performance.Much of that frustration may be alleviated, however, via a better understanding of thestrategic and financial factors that affect the profitability of pollution prevention investments.
This analysis' conclusions should not be taken as either a defense or condemnation ofthe firms' environmental performance. The "right" level of pollution prevention to beundertaken by the corporate sector is a question left to a different study (though it is worthemphasizing that regulations, and the avoidance of regulatory costs, were in all the cases a"driver" that motivated the firms' search for pollution prevention). Still, without a detailedaccounting of social benefits and costs, little can be said about whether more or less stringentregulation was appropriate in these cases. Instead, the cases say much more about the way inwhich firms are regulated.
The results of this analysis can be viewed largely as a defense of the soundness withwhich managers weighed the private benefits, costs, and risks of the pollution preventioninvestments they were evaluating. Instead of revealing evidence of corporate organizationalbarriers or myopic decision-making, the cases demonstrate a set of complex, but ultimatelyprosaic motivations for the decisions that were made. Appreciation of those motivations isimportant because it can help guide public- and private-sector efforts to improve corporatepollution prevention performance.
The findings here run counter to the perception that firms are somehow failing topursue win-win opportunities. Instead, failure to pursue P2 is usually best explained by aproject's lack of expected profitability. Surely some profitable P2 opportunities have gone
50 The rationing issue was addressed by internal corporate decision-making documents in the following way:"The polyurethane business is global and makes capital environment decisions based on global priorities. Thecost and return of the TOX elimination project was not as favorable as other projects the business is funding.These other projects include as much as a hundred million dollars in capital and two new source reductiontechnologies which will eliminate 30-60 million pounds per year of material from incineration by increasing theyield of processes in the polyurethane business."
James Boyd RFF 98-30
43
undetected by the private sector. But once unearthed, firms have both the motive and abilityto evaluate profit opportunities. Convincing firms of the profitability of investments they areuniquely capable of evaluating themselves is likely to be a relatively unconstructive approachto P2 promotion. Instead, a more fruitful approach is to focus on barriers to P2's profitability.
What policy changes are likely to enhance P2's profitability? First, the cases revealregulatory barriers of varying significance. The desire to experiment with P2 innovation isoften thwarted by rigid media- and technology-specific regulations. The rigidity of manyregulations is understandable given the difficulties of environmental enforcement.Nevertheless, efforts to promote regulatory flexibility and innovations should be embraced asa means to foster the corporate sector's ability to develop environmental innovations. TheDuPont case featured a regulatory barrier associated with a material classification issue.While there are sound reasons for the material classification system in general, removal ofthat barrier would be a desirable example of "seeing the regulatory forest for the trees." Inspecific cases, rules act at cross purposes with the environmental goal. Flexibility is the onlyway to avoid that kind of problem. Of course, the DuPont case also highlighted a way inwhich lax regulatory enforcement can weaken the demand for P2 technologies.
Second, performance-based (as opposed to technology-forcing) regulation is likely tobe a better way to promote private sector P2 innovations.51 P2 increasingly calls for firms toengage in the redesign of complex products and processes in ever-changing product markets.Performance-based regulations, which allow greater latitude for technological experimentationand longer time-horizons for compliance, allow firms to meet targets in the largest variety ofways.52 In contrast, existing regulations feature substantial regulatory influence over thetechnologies used by firms. Not only are specific technologies often mandated, but technicalconstraints also arise because emission standards are applied to individual substances ratherthan broader categories of effluent. Because of this, limits on the output of a single substancecan significantly constrain the design (or redesign) of a production process.53 Moreover,
51 Instead of judging environmental compliance on the basis of specific technological inputs or narrowly-defined emissions standards, performance-based regulation relies on more holistic measures of a facility'senvironmental performance. For instance, compliance with aggregate limits (on a larger "bundle" of chemicals),rather than chemical-specific limits, is consistent with a performance-based approach. The EPA's "Project XL"--a voluntary industry-regulator initiative to promote innovative forms of environmental regulation--is currentlyfostering experimentation with performance-based permitting.52 Care must be taken not to confuse "flexibility" with a lack of regulatory stringency. Flexible permitting, atthe aggregate level, can be very stringent. But flexible permitting allows firms to meet even stringent aggregatetargets in the way they best see fit. Performance-based regulation is not without limitations of its own. Monitoring and enforcement issues, inparticular, loom large. The uniformity (inflexibility) of standard command and control regulations is a virtue,since it is easier to monitor technology or emissions standards that are fixed and common to many firms.However, given the unique characteristics of most firms, the constraints imposed by uniform standards should beviewed as a potentially significant barrier to P2 innovation.53 Emission standards may not explicitly dictate a technology choice. However, they often carry an implicitincentive to employ a standard technology. This is because standards are usually developed based upon theemission characteristics of specific technologies. Firms can minimize their likelihood of being found inviolation of standards by employing the technologies on which the standards were based. Innovative approachesrun a higher risk of generating permit violations, or triggering permitting delays.
James Boyd RFF 98-30
44
because of an emphasis on specific abatement procedures for specific effluent streams, firmsmust continually re-permit as their production processes change. This re-permitting is a costlyand time-consuming exercise in and of itself--particularly for firms whose productionprocesses must change frequently. Performance-based environmental permitting should beexplored as a means to lower these barriers and constraints.
Flexible, performance-based regulation has another important consequence: namely, itenhances the private sector's demand for improved environmental accounting information.Rigid regulations do a particularly poor job of fostering the private sector's demand for, anddevelopment of, better environmental accounting information and methods. After all, end-of-pipe, single-media, and technology-forcing regulations leave firms with little reason to innovate,and therefore even less reason to collect information that would reveal environment-drivenfinancial opportunities. Better information helps firms only if they have the flexibility to act on--and benefit from--better information. Regulatory flexibility, by expanding the technologicaloptions open to firms, increases the value of information relating to those options. In the end,regulation that allows for a wide variety of innovative solutions is likely to be the best way toinduce firms to invest in better environmental information and decision-making.
The analysis of financial evaluation procedures has highlighted significant informationbarriers faced by firms. This underscores the continued importance of improvedenvironmental cost accounting methods to better estimate environment-related financialbenefits. Improved data collection, estimation, and evaluation techniques can only improvecorporate decision-making. The important, and open, question for future research is: whatforms of environment-related information are likely to be most valuable to the private sector?This study has suggested that firms can be expected to do a relatively good job of evaluatingthe environmental and financial characteristics of P2 opportunities, once those opportunitiesare identified. Perhaps the greatest challenge for firms, however, is the initial identification ofthose opportunities. The technical identification of P2 opportunities may be well served bygreater efforts at basic R&D and firm-specific "materials accounting."54 Mandatedaccounting requirements are of questionable value, given the idiosyncratic needs of specificfirms and facilities. And confidential business information issues undermine the practicalityof mandatory and publicly-disclosed P2 planning. However, government promotion of stateof the art accounting practices, including materials accounting, is likely to concretely benefitfirms that are increasingly concerned with environment-related costs and opportunities.
54 Materials accounting denotes efforts to track the physical flow of materials into, through, and out of a givenfacility.
James Boyd RFF 98-30
45
REFERENCES
Antle, Rick and Gary Eppen. 1985. "Capital Rationing and Organizational Slack in CapitalBudgeting," Management Science, 31:2, pp. 163-174.
Brealey, Richard and Stewart Meyers. 1991. Principles of Corporate Finance (New York:McGraw-Hill).
Commoner, Barry. 1994. "Pollution Prevention: Putting Comparative Risk Assessment in ItsPlace," in Adam Finkel and Dominic Golding, editors, Worst Things First? The Debate overRisk-based National Environmental Priorities (Washington, D.C.: Resources for the Future).
Dixit, A. and R. Pindyck. 1994. Investment Under Uncertainty (Princeton, NJ: PrincetonUniversity Press).
Environmental Protection Agency. 1991. Amoco - U.S. EPA Pollution Prevention Project:Yorktown, Virginia, Executive Summary, (U.S. Environmental Protection Agency:Washington, DC) December (revised May, 1992).
Environmental Protection Agency. 1997. Pollution Prevention 1997: A National ProgressReport, EPA 742-R-97-00, Office of Pollution Prevention and Toxics, (United StatesEnvironmental Protection Agency: Washington DC), June.
Foster, George. 1978. Financial Statement Analysis, 2d. edition (Englewood Cliffs, N.J.: PrentissHall).
Freeman, Harry, Teresa Harten, Johnny Springer, Paul Randall, Mary Ann Curran, and KennethStone. 1992. "Industrial Pollution Prevention: A Critical Review," Journal of the Air andWaste Management Association, 42, pp. 618-656.
Greer, Linda, and Christopher van Loben Sels. 1997. "When Pollution Prevention Meets theBottom Line," Environmental Science and Technology, 31, pp. 418-422.
Holmstron, Bengt and Joan Ricart I Costa. 1986. "Managerial Incentives and CapitalManagement," Quarterly Journal of Economics, November, pp. 835-860.
Natan, Thomas, Catherine Miller, Bonnie Scarborough, and Warren Muir. 1996. Evaluating theEffectiveness of Pollution Prevention Planning in New Jersey: A Program-Based Evaluation(Alexandria, Va.: Hampshire Research Associates).
Pelley, Janet. 1997. "Environmental R&D Shifts to Pollution Prevention," EnvironmentalScience and Technology News, March.
Porter, Michael E. 1995. "Green and Competitive: Ending the Stalemate," Harvard BusinessReview, Sept.-Oct., pp. 120-134.
Sarokin, David et al. 1985. Cutting Chemical Wastes, (New York: Inform).
White, Allen, Monica Becker, and James Goldstein. 1992. Total Cost Assessment: AcceleratingIndustrial Pollution Prevention through Innovative Project Financial Analysis, Office ofPollution Prevention and Toxics, EPA/741/R-92/002, May.
White, Allen, Deborah Savage, Julia Brady, Dmitri Cavander, and Lori Lach. 1995.Environmental Cost Accounting for Capital Budgeting: A Benchmark Survey of ManagementAccountants, Office of Pollution Prevention and Toxics, EPA/742/R-95/005, September.