Embed Size (px)
Citation preview
MARINE ECOLOGY PROGRESS SERIESMar Ecol Prog Ser
Vol. 360: 73–84, 2008doi: 10.3354/meps07379
Published May 22
INTRODUCTION
On a global scale, cyanobacterial N2 fixation con-tributes significantly to new production in aquatic eco-systems (Capone et al. 1997, Montoya et al. 2004). Inthe Baltic Sea, mass occurrences of cyanobacteria insurface waters are regular events during the summermonths (Lindahl et al. 1978). Satellite imaging studiessuggest that the frequency and magnitudes of theblooms have increased in the Baltic Sea (Kahru et al.1994, Finni et al. 2001). A general increase in phyto-plankton productivity in both coastal and open watersof the Baltic Sea has been attributed to anthropogeniceutrophication (Larsson et al. 1985). Estimates suggest
that the total input of nitrogen (N) and phosphorus (P)to the Baltic Sea increased by approximately 4- and 8-fold, respectively, during the last century (Larsson etal. 1985).
Diazotrophic cyanobacteria with the ability to as-similate atmospheric N2 may have a competitive ad-vantage in waters with low ratios of dissolved inor-ganic nitrogen (DIN) to phosphorus (DIP) (Smith 1983).This conclusion derives from the concomitant appear-ance in summer of low dissolved N:P nutrient ratios insurface waters of the Baltic Sea with the annual peaksin N2 fixation (Hübel & Hübel 1976). Growth and N2
fixation in Baltic Sea cyanobacteria are characterisedby a high spatial and temporal variability, including
© Inter-Research 2008 · www.int-res.com*Email: [email protected]
Seasonal significance of N2 fixation in coastal andoffshore waters of the northwestern Baltic Sea
Jenny Degerholm1, 2,*, Kjell Gundersen1, 3, Birgitta Bergman1, Erik Söderbäck1, 4
1Department of Botany, Stockholm University, 106 91 Stockholm, Sweden
2Present address: Faculty of Natural Sciences, Södertörn University College, 141 89 Huddinge, Sweden3Present address: Department of Marine Science, University of Southern Mississippi, 1020 Balch Boulevard,
Stennis Space Center, Mississippi 39529, USA4Present address: QIAGEN, Frösundaviks Allé 15, 169 70 Solna, Sweden
ABSTRACT: Annual rates of N2 fixation were measured over 3 yr (1998–2000) at an open waterstation (BY31) and 2 coastal stations (H4 and X1) in the Baltic Sea. This is the first report on depth-integrated rates of N2 fixation from more than one complete growth season in the Baltic Sea. Annualestimates of N2 fixation ranged from 56 000 to 125 000 t N in the Baltic Proper, and 18 000 to 162 000 tN at the inshore stations (Himmerfjärden). Rates of N2 fixation were measured in situ at 4 depthsbetween 0 and 25 m using the 15N tracer technique for size fractionated organisms larger and smallerthan 20 μm. Maximum rates of N2 fixation were found in surface waters (0 to 4 m depth), and a majorpart of this activity (80% in coastal and 89% in offshore waters) took place during daylight hours.Integrated rates of N2 fixation in cells >20 μm followed the average abundance of filamentouscyanobacteria (primarily Aphanizomenon sp.) in the water column. Molar C:N mass ratios in particles>20 μm, i.e. filamentous cyanobacteria, suggest that this size fraction was N-sufficient during sum-mer, whereas the molar C:P mass ratios indicated P-limitation during this period. A reduction insewage discharge to the Himmerfjärden bay area during the study period appears not to have beencompensated for by increased rates of N2 fixation. The patchy distribution of cyanobacteria and thehigh seasonal variability in N2 fixation rates emphasize the need for adequate spatial and temporalsampling strategies in studies of N2 fixation in coastal and open waters of the Baltic Sea.
KEY WORDS: Baltic Sea · Aphanizomenon · Nodularia · N2 fixation · Himmerfjärden
Resale or republication not permitted without written consent of the publisher
Mar Ecol Prog Ser 360: 73–84, 2008
great inter-annual fluctuations (Rahm et al. 2000, Was-mund et al. 2001). The highest recorded rates of N2 fix-ation are in the southern and western parts of theBaltic Proper (Hübel & Hübel 1976, Rahm et al. 2000),which is characterised by persistently low dissolvedN:P ratios. Annual estimates of N2 fixation in the BalticSea are higher for open waters (60 to 263 mmol N m–2;Larsson et al. 2001, Wasmund et al. 2001) than for thecoastal zone (21 to 79 mmol N m–2; Lindahl et al. 1978).Earlier reports estimated that N2 fixation contributes 3to 13% of annual input of total N to the Baltic Sea (Lin-dahl et al. 1978, Lindahl & Wallström 1985). High nutri-ent loading in coastal waters caused by river run-offand anthropogenic sources may explain why N2 fixa-tion appears less significant in coastal waters of theBaltic Sea.
The long history of N2 fixation measurements in theBaltic Sea has demonstrated the importance of this bio-geochemical pathway to new production. Estimatedannual N input by N2 fixation to the Baltic Proper(based on acetylene reduction (AR) measurements)are in the range of 100 000 to 167 000 t (Rinne et al.1978, Brattberg 1980, Leppänen et al. 1988). Recentestimates, however, based on measurement of thesummer increase of total N in surface waters or on sen-sitive 15N-label assays, suggest a wider range (30 000to 434 000 t N yr–1), with even greater inter-annualvariability (Rahm et al. 2000, Larsson et al. 2001, Was-mund et al. 2001, 2005, Rolff et al. 2007). For compari-
son, estimates of the N contributions from river run-offand coastal anthropogenic point sources amount to390 000 t yr–1 (Stålnacke et al. 1999) and, between 1991and 1995, the average loading of atmospheric N to theBaltic Sea was 185 000 t yr–1 (HELCOM 1997). Inrecent years, coastal point source discharges to theBaltic Sea have been reduced by improving N and Pretention in the existing sewage treatment plants.Since 1998, the Himmerfjärden sewage treatmentplant (Fig. 1) has been removing 90% of the total Nload (Elmgren & Larsson 2001). However, reduced Navailability may result in lower dissolved N:P ratios,and hence create an environment favourable for dia-zotrophic cyanobacteria. A potential increase in fila-mentous cyanobacteria followed by increased total N2
fixation in inshore waters may in fact counteract theintensified sewage treatment (Savchuk & Wulff 1999).
Despite the long history of N2 fixation measurementsin the Baltic Sea, few studies have covered the entiregrowth season of the filamentous cyanobacteria. InSwedish coastal waters, there have been only 2 limitedseasonal field studies (Lindahl et al. 1978, Lindahl &Wallström 1985), and most annual estimates of N2 fixa-tion in open waters are extrapolations of short-termcruises made in summer. The aim of this 3 yr study wasto conduct a continuous seasonal investigation of theoccurrence and rates of N2 fixation in filamentouscyanobacteria collected in open and coastal waters ofthe Baltic Sea. By applying the sensitive 15N tracer
technique we estimated the significance ofN2 fixation as a source of N for new produc-tion in coastal and offshore phytoplanktoncommunities.
MATERIALS AND METHODS
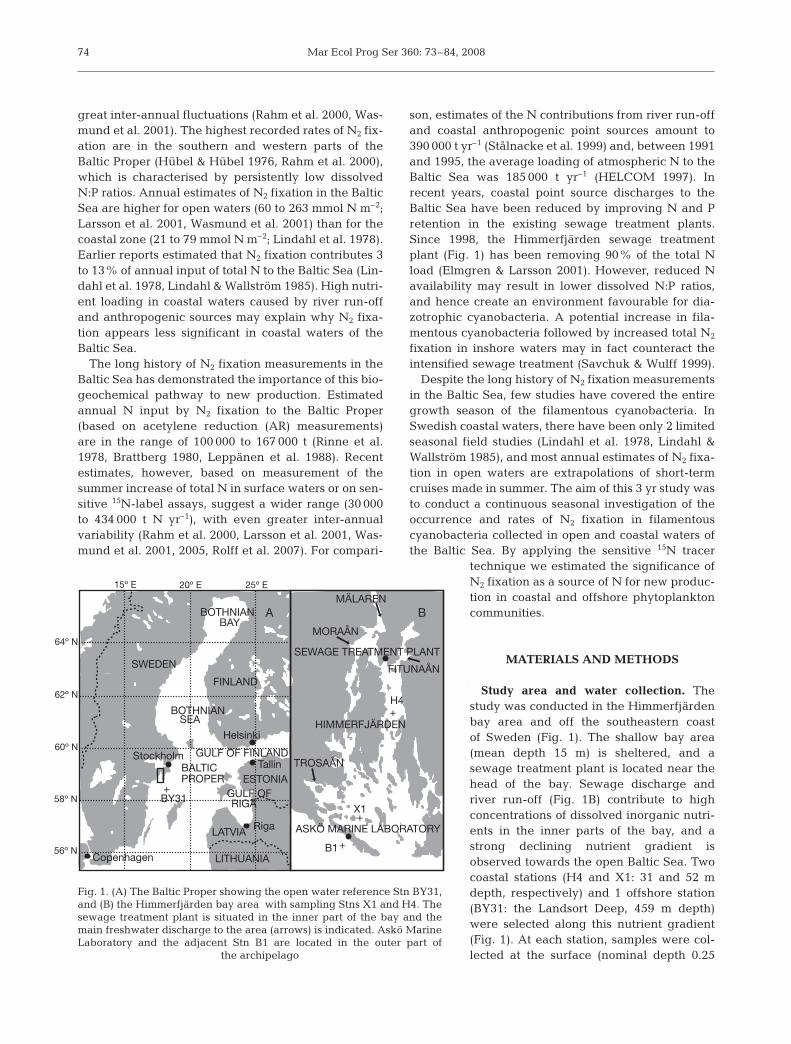
Study area and water collection. Thestudy was conducted in the Himmerfjärdenbay area and off the southeastern coastof Sweden (Fig. 1). The shallow bay area(mean depth 15 m) is sheltered, and asewage treatment plant is located near thehead of the bay. Sewage discharge andriver run-off (Fig. 1B) contribute to highconcentrations of dissolved inorganic nutri-ents in the inner parts of the bay, and astrong declining nutrient gradient isobserved towards the open Baltic Sea. Twocoastal stations (H4 and X1: 31 and 52 mdepth, respectively) and 1 offshore station(BY31: the Landsort Deep, 459 m depth)were selected along this nutrient gradient(Fig. 1). At each station, samples were col-lected at the surface (nominal depth 0.25
74
SWEDEN
Stockholm
Copenhagen
Riga
TallinESTONIA
LATVIA
LITHUANIA
Helsinki
FINLAND
BALTICPROPER
BOTHNIANBAY
BOTHNIANSEA
GULF OF FINLAND
BY31
64º N
58º N
62º N
60º N
56º N
15º E
+
20º E 25º E
+
+
ASKÖ MARINE LABORATORY
X1
H4
HIMMERFJÄRDEN
SEWAGE TREATMENT PLANT
MORAÅN
FITUNAÅN
TROSAÅN
MÄLAREN
GULF OFRIGA
+B1
A B
Fig. 1. (A) The Baltic Proper showing the open water reference Stn BY31,and (B) the Himmerfjärden bay area with sampling Stns X1 and H4. Thesewage treatment plant is situated in the inner part of the bay and themain freshwater discharge to the area (arrows) is indicated. Askö MarineLaboratory and the adjacent Stn B1 are located in the outer part of
the archipelago

Degerholm et al.: N2 fixation in the Baltic Sea
m), 4, 10 and 20 m depth using a 5 l Hydrobios watersampler. The water collected was immediately trans-ferred to 10 l polypropylene carboys that had been pre-cleaned with 10% hydrochloric acid (HCl). In order toachieve homogeneity, each carboy was gently invertedtwice prior to sub-sampling.
Diel (24 h) estimates and diurnal (daylight) rates ofN2 fixation. The open water Stn BY31 was only visitedaround noon and during daylight hours (first samplecollected around 10:00, followed by 4 to 5 h incubationtime), whereas Stns H4 and X1 were sampled in themorning (09:00) and incubated for 24 h. In order tomake all 3 stations comparable, the data generatedfrom Stn BY31 were converted to daily rates of N2 fixa-tion by the following method. Gallon et al. (2002)demonstrated a diel pattern in diazotrophic filamen-tous cyanobacteria in the Baltic Sea whereby the rateof N2 fixation was driven by photosynthetic energy anddiurnal solar irradiance. We investigated the diel pat-tern of N2 fixation at Stn BY31 in August 2000 by per-forming a number of short-term acetylene reduction(AR) incubations over a 24 h period. Surface net tows(Hydrobios, 90 μm mesh, 0.5 m diameter) showed thatAphanizomenon and Nodularia were present at thetime of sampling. The cyanobacterial filaments werecarefully collected using the plankton net and re-sus-pended in an acid-cleaned polypropylene containerand subsequently dispensed into glass septum bottles(35 ml) in triplicate for each time-point. The AR incu-bations followed the recommendations of Capone(1993). Acetylene (C2H2) was added to a final concen-tration of 14% (v/v) in the liquid phase and thesamples were incubated for 30 min using an on-deckincubator. The incubator was flushed continually withambient surface seawater, and a neutral screen pro-vided 63% of incident photosynthetic irradiance to thebottles. Assuming an average attenuation coefficient(k) of –0.353 in surface waters of the Baltic Sea (Walsbyet al. 1997), the screen reduced photosynthetic activeradiation (PAR) to that occurring at 1.3 m depth. A newset of samples was incubated every 2 to 4 h through a24 h cycle. A gas sample from the head space of eachincubation bottle was withdrawn at each time-pointand stored separately in 5 ml Vacutainers in darknessat 4°C. The ethylene (C2H4) end product concentra-tions were determined on a Shimadzu GC-8A gaschromatograph equipped with a 2 m long stainlesssteel column (Porapac, 3 mm inner diameter, N80/100mesh) using ethylene of known concentration(100 ppm) as a gas standard.
A comparison was made between the 4 to 5 h incu-bations and the 24 h diel incubations at Stn BY31 tovalidate the conversion of short-term N2 fixation intodaily rates. These parallel incubations, which wereconducted in August 1999 and again in June and July
2000, were measured by the 15N-labelled dinitrogengas incorporation technique (see below). A third dielstudy was performed in August 2000 at Stn BY31 andat coastal Stn B1 (Fig. 1B) when measured rates of N2
fixation in daylight incubations were compared withsimilar incubations at night. Surface seawater sampleswere collected, size fractionated, and then incubatedusing 15N-labelled dinitrogen gas (see below) undergrowth conditions as described for the on-deck incuba-tor (above).
N2 fixation measurements. Duplicate polycarbonateErlenmeyer flasks (250 ml) were filled to the brim withsample water from surface, 4, 10 and 20 m depth.Great care was taken to avoid air-bubbles as the lidwas gently screwed back onto each flask. Each lid wasequipped with a Teflon-coated silicon membrane and4.6 ml of 15N-labelled dinitrogen gas (15N2; CambridgeIsotopes) were injected into each flask using a syringe.Since gas dissolution in seawater may vary as afunction of the injected gas volume, salinity and tem-perature (Weiss 1970), the percentage 15N2 enrichmentwas calculated for each station and time (range 43 to48%).
Each pair of bottles was incubated in situ at itsrespective depth overnight (Stns H4 and X1) or for 4 to5 h around noon (Stn BY31) using a tethered floatingarray. A time zero sample from each depth and stationwas filter-fractionated immediately after deploymentand processed as described below. The samplesretrieved at Stns H4 and X1 were transported in thedark in a portable insulated cooler back to the AsköMarine Laboratory (approximately 1.5 h transit time)and processed immediately upon arrival. At the off-shore Stn BY31, the retrieved samples were filteredimmediately onboard the ship. All samples were sizefractionated by gravity filtration and collected on pre-combusted Whatman GF/C (cells >20 μm) and What-man GF/F (cells <20 μm) filters. The samples weredried at 65°C, fumed by concentrated HCl, dried againand packed in tin foil capsules. The 15N enrichmentswere analysed on a Europa Mass Spectrometer 20-20,with an ANCA-SL preparatory unit. The mass spec-trometer was standardised with bovine serum albuminand the precision of the analytical procedure, as mea-sured by the standard deviation of the nitrogen iso-tope, was typically 0.04%. The rate of N2 fixation wascalculated as outlined by Montoya et al. (1996) andusing the gas dissolution constants of Weiss (1970).
Abundance of filamentous cyanobacteria. Planktonsamples were collected twice per month from sta-tions H4, X1 and BY31 on the day (or preceding/fol-lowing days) of N2 fixation measurements. Each sta-tion was sampled by submerging a plastic hose(inner diameter 25 mm) from the surface to 14 m(Stns H4, X1) or 20 m depth (Stn BY31). The hose
75
Mar Ecol Prog Ser 360: 73–84, 2008
was closed off and the sample was collected in abucket. Sample aliquots of 200 ml were preservedwith 0.8 ml acidified Lugol’s solution and stored at4ºC until processing. The samples were concentratedin an Utermöhl settling chamber (10 or 25 ml sub-sample volume) and viewed under a Nikon invertedmicroscope with phase contrast optics. The lengths ofthe cyanobacterial filaments were counted in diago-nals or as half or whole chamber bottom areas at 100or 150× magnification (HELCOM 1988). Abundanceof the cyanobacteria was expressed as the totallength of filaments enumerated per volume of samplewater (m ml–1).
Particulate organic carbon (C), nitrogen (N) andphosphorus (P). Elemental C and N samples werecollected in 250 ml duplicates, filtered onto pre-combusted (5 h, 500ºC) Whatman GF/F or GF/C filters(same sampling procedure as for N2 fixation measure-ments) and stored at –20 ºC. Prior to analysis, the C andN filter samples were dried at 65ºC, fumigated withconcentrated HCl, dried again and packed in tincapsules. Particulate organic C and N contents wereanalysed on an LECO CHNS-932 Analyser.
The samples used for P determinations were col-lected as duplicates of 5 or 10 ml water aliquots filteredonto HCl-washed Whatman GF/C filters. The P sam-ples were analysed by the ash-hydrolysis method fol-lowing Solorzano & Sharp (1980). The filters weresoaked in phosphate-free, deionised water (particlefree) and dried prior to use. The filter-collectedsamples were rinsed with 0.17 M Na2SO4 and stored inacid cleaned containers at –20ºC. Prior to analysis, thesamples were thawed, 0.017 M MgSO4 was added toeach, and they were left overnight at 95°C. The sam-ples were combusted at 500°C for 3 h and the remain-ing P was extracted in 2 ml of 0.2 M HCl at 80°C for aminimum of 1 h. The acid extract was centrifuged(30 min, 4100 × g) and the supernatant was analysedfor soluble reactive phosphate (SRP) following Strick-land & Parsons (1972). The blue-coloured reactioncomplex was measured on a Jasco 7800 Spectropho-tometer at 885 nm.
Physical data. Surface irradiance was measured inVisby on the island of Gotland (100 km south of StnBY31) and provided by the Swedish Meteorologicaland Hydrological Institute (SMHI). Diurnal surfaceirradiance was reported as hourly averages of contin-ual measurements of total irradiance (290–4000 nm) ona flat surface and recalculated as a fraction of eachdaily maximum. Sea surface temperature (SST), rela-tive salinity and density (δ) data were extracted fromcontinuous CTD profiles (Meerestechnik Electronik)provided by the Stockholm Marine Research Centre(SMF, available at: www.smf.su.se/english/). SST wascalculated as 0–5 m depth averages, and the water col-
umn stability index was calculated as the difference indensity between measurements at surface and 15 mdepths (δ15m – δSurface).
RESULTS
Diel versus diurnal rates of N2 fixation
At Stns H4 and X1, all in situ incubations were doneovernight, while the offshore Stn BY31 was visitedonly during daylight hours (4 to 5 h incubations). Inorder to obtain diel estimates of N2 fixation at StnBY31, we factor-corrected the daily estimates by anequation obtained as follows. Rates of N2 fixation inBaltic Sea cyanobacteria change during the course of a
76
10 100 1000
10
100
1000
Die
l N2
fixat
ion
(ng
l–1 d
–1)
Daytime N2 fixation (ng l–1 d–1)
0 4 8 12 16 20 240.0
0.2
0.4
0.6
0.8
1.0
Rel
ativ
e N
2 fix
atio
n &
PA
R
Time (h)
A
B
1:1
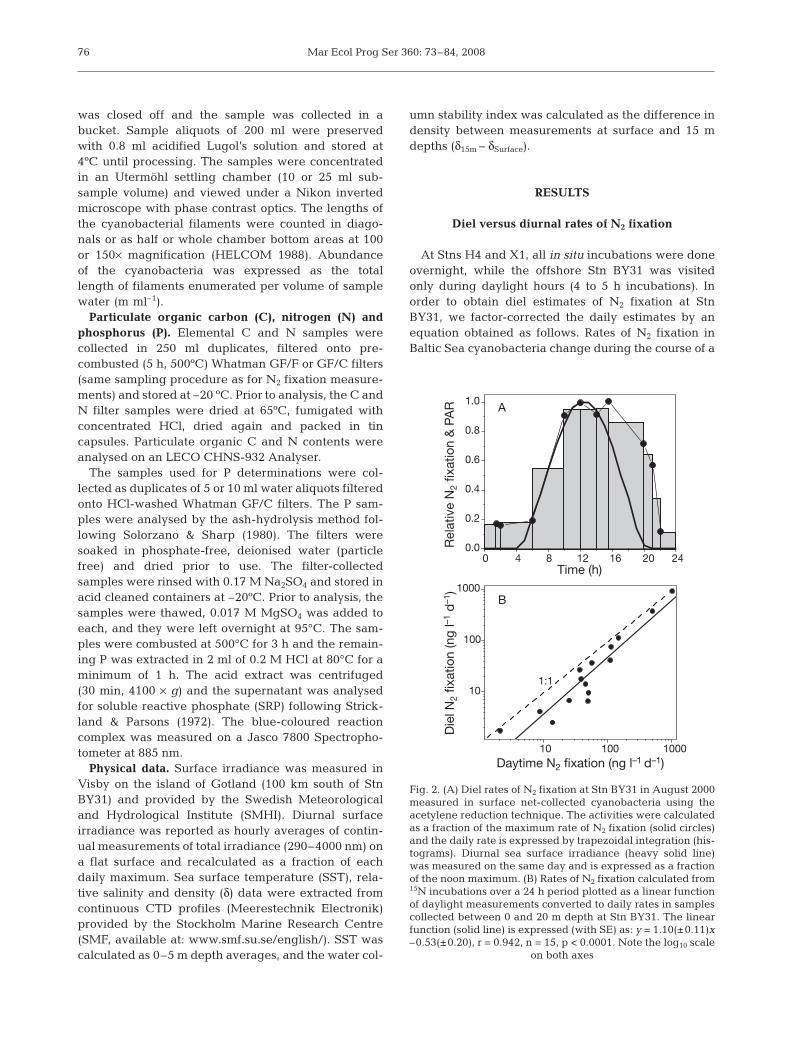
Fig. 2. (A) Diel rates of N2 fixation at Stn BY31 in August 2000measured in surface net-collected cyanobacteria using theacetylene reduction technique. The activities were calculatedas a fraction of the maximum rate of N2 fixation (solid circles)and the daily rate is expressed by trapezoidal integration (his-tograms). Diurnal sea surface irradiance (heavy solid line)was measured on the same day and is expressed as a fractionof the noon maximum. (B) Rates of N2 fixation calculated from15N incubations over a 24 h period plotted as a linear functionof daylight measurements converted to daily rates in samplescollected between 0 and 20 m depth at Stn BY31. The linearfunction (solid line) is expressed (with SE) as: y = 1.10(±0.11)x–0.53(±0.20), r = 0.942, n = 15, p < 0.0001. Note the log10 scale
on both axes
Degerholm et al.: N2 fixation in the Baltic Sea
day (Gallon et al. 2002) and this trend appears to followthe relative distribution of PAR (Fig. 2A), with a time-lag extending into the evening. The relative distribu-tion of PAR (PARA) was calculated by trapezoid area
integration over a 24 h period (PARA = ). From
the surface irradiance data, we observed a seasonalchange in PARA as a function of the daylength, with amaximum during mid summer (authors’ unpubl. data).The area of the relative distribution of N2 fixation(Fig. 2A) was calculated by trapezoid integration
(ARA= ), and we assumed a constant relationship
between diel ARA and diurnal PARA (f = ARA/PARA =1.666) for the entire year. A daily rate of N2 fixation(mg N d–1) could then be calculated from the short-term incubations (mg N h–1) at Stn BY31:
N2 fixation (mg d–1) =
where T0 and T1 are the time points of the short-term
incubation during daylight hours (h) and is
the area integration of PAR during the incubationperiod. Fig. 2B shows a comparison between diel incu-bations of N2 fixation (0 to 24 h) and daytime incuba-tions converted to daily rates using the equation above.There was no significant difference (p < 0.4) betweenthe 1:1 relationship and the regression line generatedfrom the 3 overnight visits to Stn BY31 in 2000 (Fig. 2B).
Vertical profiles of N2 fixation
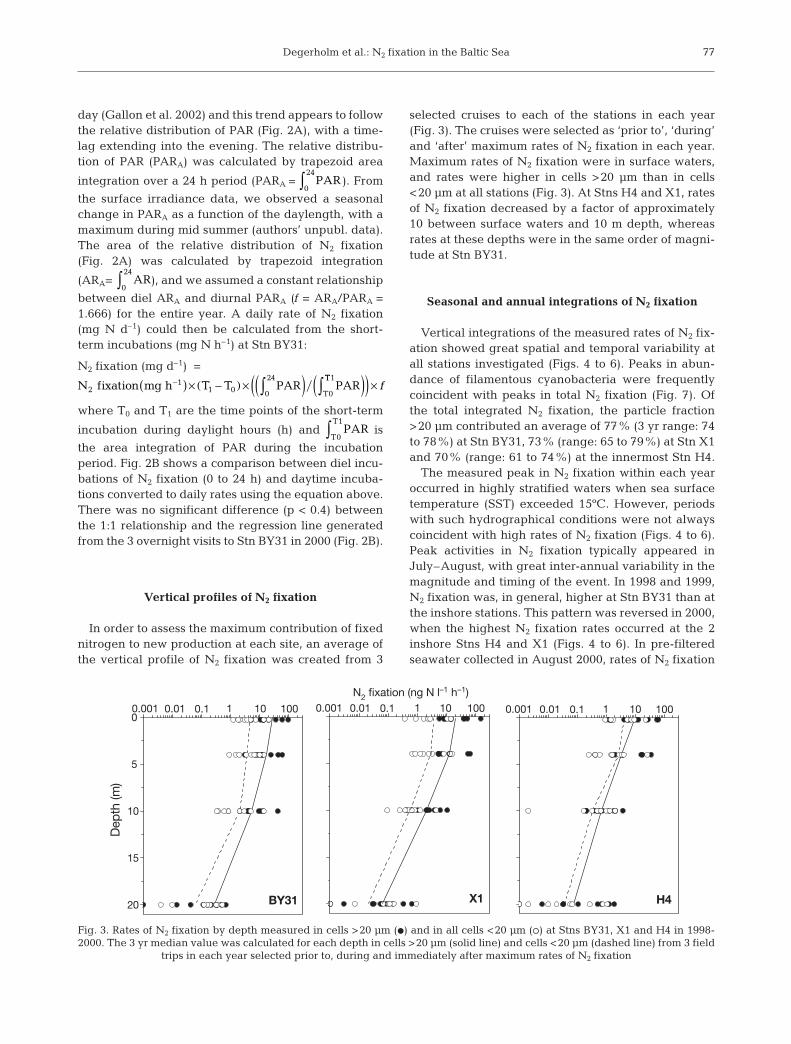
In order to assess the maximum contribution of fixednitrogen to new production at each site, an average ofthe vertical profile of N2 fixation was created from 3
selected cruises to each of the stations in each year(Fig. 3). The cruises were selected as ‘prior to’, ‘during’and ‘after’ maximum rates of N2 fixation in each year.Maximum rates of N2 fixation were in surface waters,and rates were higher in cells >20 μm than in cells<20 μm at all stations (Fig. 3). At Stns H4 and X1, ratesof N2 fixation decreased by a factor of approximately10 between surface waters and 10 m depth, whereasrates at these depths were in the same order of magni-tude at Stn BY31.
Seasonal and annual integrations of N2 fixation
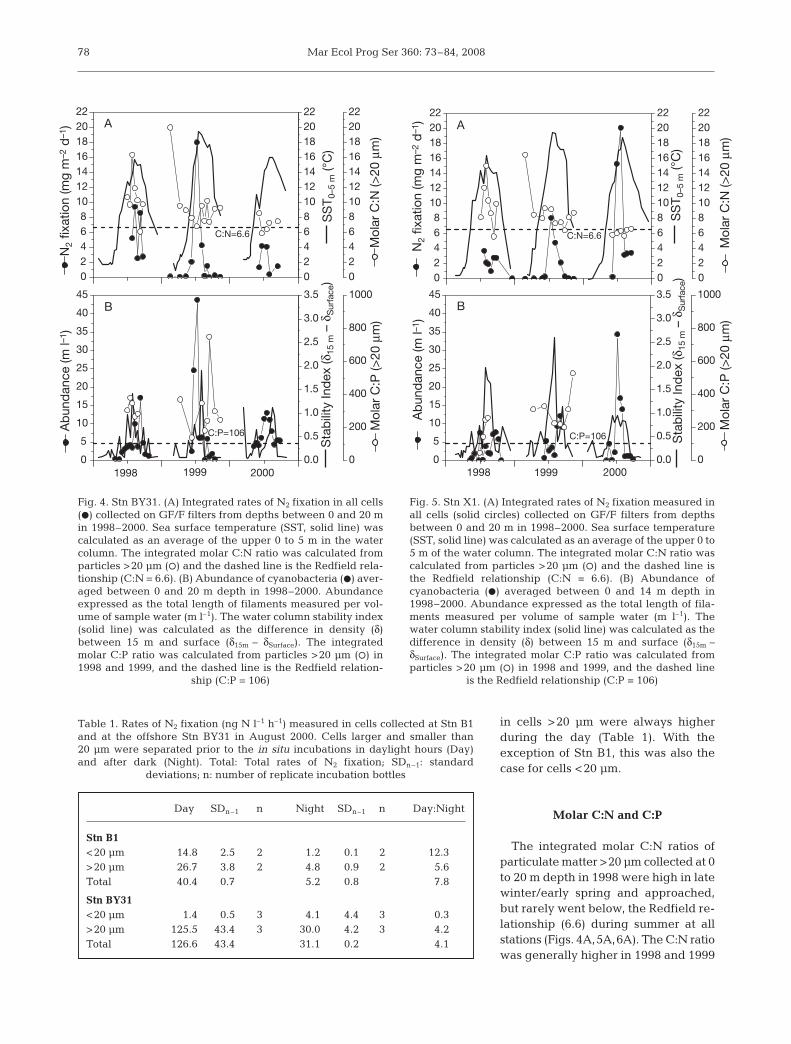
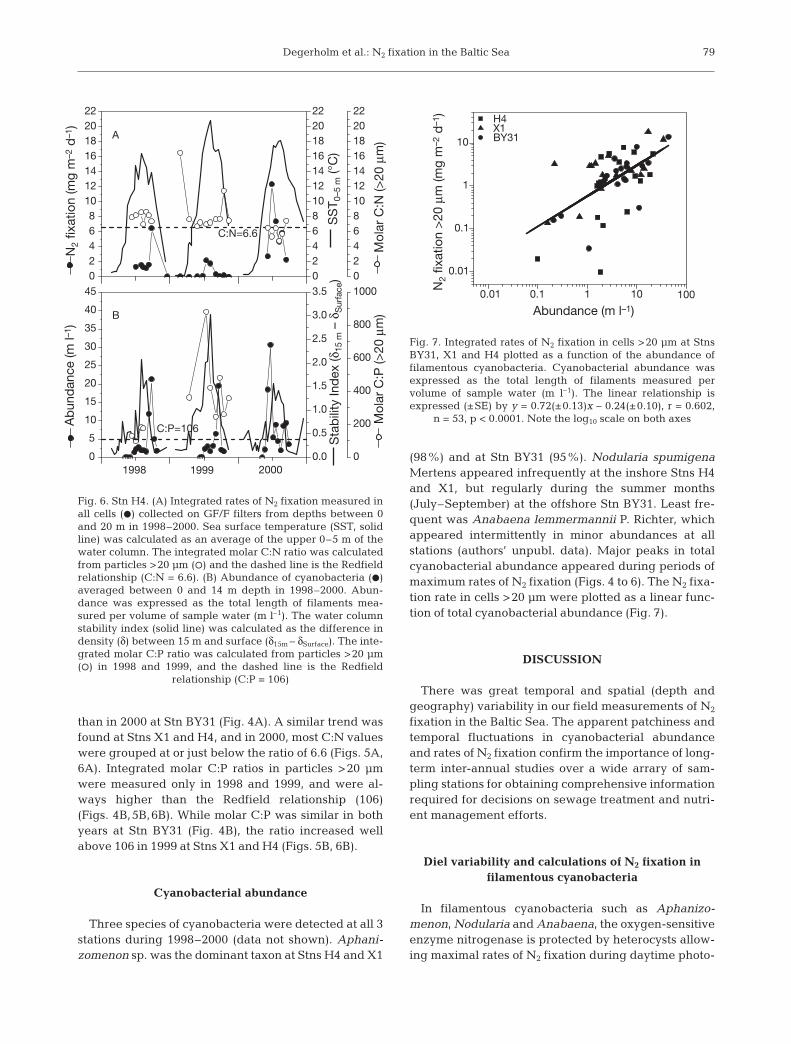
Vertical integrations of the measured rates of N2 fix-ation showed great spatial and temporal variability atall stations investigated (Figs. 4 to 6). Peaks in abun-dance of filamentous cyanobacteria were frequentlycoincident with peaks in total N2 fixation (Fig. 7). Ofthe total integrated N2 fixation, the particle fraction>20 μm contributed an average of 77% (3 yr range: 74to 78%) at Stn BY31, 73% (range: 65 to 79%) at Stn X1and 70% (range: 61 to 74%) at the innermost Stn H4.
The measured peak in N2 fixation within each yearoccurred in highly stratified waters when sea surfacetemperature (SST) exceeded 15ºC. However, periodswith such hydrographical conditions were not alwayscoincident with high rates of N2 fixation (Figs. 4 to 6).Peak activities in N2 fixation typically appeared inJuly–August, with great inter-annual variability in themagnitude and timing of the event. In 1998 and 1999,N2 fixation was, in general, higher at Stn BY31 than atthe inshore stations. This pattern was reversed in 2000,when the highest N2 fixation rates occurred at the 2inshore Stns H4 and X1 (Figs. 4 to 6). In pre-filteredseawater collected in August 2000, rates of N2 fixation
PART0
T1
∫
N fixation mg h T T PAR PAR2 0
24
T0
−( ) × −( ) × ( )∫11 0 �
TT1
∫( )( ) × f
AR0
24
∫
PAR0
24
∫
77
0
5
10
15
20
0.001
BY31
N2 fixation (ng N l–1 h–1)
H4
Dep
th (m
)
X1
0.01 0.1 1 10 100 0.001 0.01 0.1 1 10 100 0.001 0.01 0.1 1 10 100
Fig. 3. Rates of N2 fixation by depth measured in cells >20 μm (d) and in all cells <20 μm (s) at Stns BY31, X1 and H4 in 1998-2000. The 3 yr median value was calculated for each depth in cells >20 μm (solid line) and cells <20 μm (dashed line) from 3 field
trips in each year selected prior to, during and immediately after maximum rates of N2 fixation
Mar Ecol Prog Ser 360: 73–84, 2008
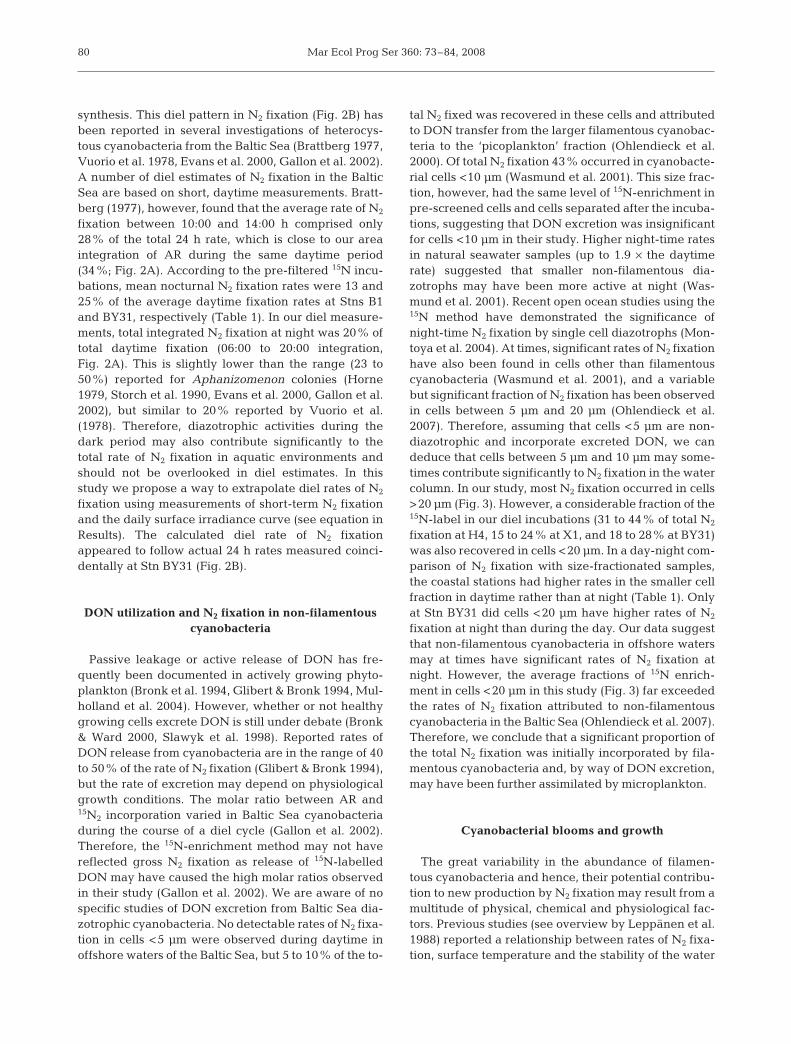
in cells >20 μm were always higherduring the day (Table 1). With theexception of Stn B1, this was also thecase for cells <20 μm.
Molar C:N and C:P
The integrated molar C:N ratios ofparticulate matter >20 μm collected at 0to 20 m depth in 1998 were high in latewinter/early spring and approached,but rarely went below, the Redfield re-lationship (6.6) during summer at allstations (Figs. 4A,5A,6A). The C:N ratiowas generally higher in 1998 and 1999
78
Day SDn–1 n Night SDn–1 n Day:Night
Stn B1<20 μm 14.8 2.5 2 1.2 0.1 2 12.3>20 μm 26.7 3.8 2 4.8 0.9 2 5.6Total 40.4 0.7 5.2 0.8 7.8
Stn BY31<20 μm 1.4 0.5 3 4.1 4.4 3 0.3>20 μm 125.5 43.4 3 30.0 4.2 3 4.2Total 126.6 43.4 31.1 0.2 4.1
Table 1. Rates of N2 fixation (ng N l–1 h–1) measured in cells collected at Stn B1and at the offshore Stn BY31 in August 2000. Cells larger and smaller than20 μm were separated prior to the in situ incubations in daylight hours (Day)and after dark (Night). Total: Total rates of N2 fixation; SDn–1: standard
deviations; n: number of replicate incubation bottles
0
5
10
15
20
25
30
35
40
45
Mol
ar C
:P (>
20 μ
m)
Sta
bili
ty In
dex
(δ15
m –
δS
urfa
ce)
1998 1999 2000
Ab
und
ance
(m l–
1 )
0.0
0.5
1.0
1.5
2.0
2.5
3.0
3.5
0
200
400
600
800
1000
02468
10121416182022
N2
fixat
ion
(mg
m–2
d–1
)
0246810121416182022
Mol
ar C
:N (>
20 μ
m)
SS
T 0–5
m (°
C)
0246810121416182022
C:P=106
C:N=6.6
A
B
Fig. 4. Stn BY31. (A) Integrated rates of N2 fixation in all cells(d) collected on GF/F filters from depths between 0 and 20 min 1998–2000. Sea surface temperature (SST, solid line) wascalculated as an average of the upper 0 to 5 m in the watercolumn. The integrated molar C:N ratio was calculated fromparticles >20 μm (s) and the dashed line is the Redfield rela-tionship (C:N = 6.6). (B) Abundance of cyanobacteria (d) aver-aged between 0 and 20 m depth in 1998–2000. Abundanceexpressed as the total length of filaments measured per vol-ume of sample water (m l–1). The water column stability index(solid line) was calculated as the difference in density (δ)between 15 m and surface (δ15m – δSurface). The integratedmolar C:P ratio was calculated from particles >20 μm (s) in1998 and 1999, and the dashed line is the Redfield relation-
ship (C:P = 106)
0
5
10
15
20
25
30
35
40
45
1998 1999 20000.0
0.5
1.0
1.5
2.0
2.5
3.0
3.5
0
200
400
600
800
1000
02468
10121416182022
0246810121416182022
0246810121416182022
C:N=6.6
C:P=106
A
B
Mol
ar C
:P (>
20 μ
m)
Sta
bili
ty In
dex
(δ15
m –
δS
urfa
ce)
Ab
und
ance
(m l–
1 )N
2 fix
atio
n (m
g m
–2 d
–1)
Mol
ar C
:N (>
20 μ
m)
SS
T 0–5
m (°
C)
Fig. 5. Stn X1. (A) Integrated rates of N2 fixation measured inall cells (solid circles) collected on GF/F filters from depthsbetween 0 and 20 m in 1998–2000. Sea surface temperature(SST, solid line) was calculated as an average of the upper 0 to5 m of the water column. The integrated molar C:N ratio wascalculated from particles >20 μm (s) and the dashed line isthe Redfield relationship (C:N = 6.6). (B) Abundance ofcyanobacteria (D) averaged between 0 and 14 m depth in1998–2000. Abundance expressed as the total length of fila-ments measured per volume of sample water (m l–1). Thewater column stability index (solid line) was calculated as thedifference in density (δ) between 15 m and surface (δ15m – δSurface). The integrated molar C:P ratio was calculated fromparticles >20 μm (s) in 1998 and 1999, and the dashed line
is the Redfield relationship (C:P = 106)
Degerholm et al.: N2 fixation in the Baltic Sea
than in 2000 at Stn BY31 (Fig. 4A). A similar trend wasfound at Stns X1 and H4, and in 2000, most C:N valueswere grouped at or just below the ratio of 6.6 (Figs. 5A,6A). Integrated molar C:P ratios in particles >20 μmwere measured only in 1998 and 1999, and were al-ways higher than the Redfield relationship (106)(Figs. 4B,5B,6B). While molar C:P was similar in bothyears at Stn BY31 (Fig. 4B), the ratio increased wellabove 106 in 1999 at Stns X1 and H4 (Figs. 5B, 6B).
Cyanobacterial abundance
Three species of cyanobacteria were detected at all 3stations during 1998–2000 (data not shown). Aphani-zomenon sp. was the dominant taxon at Stns H4 and X1
(98%) and at Stn BY31 (95%). Nodularia spumigenaMertens appeared infrequently at the inshore Stns H4and X1, but regularly during the summer months(July–September) at the offshore Stn BY31. Least fre-quent was Anabaena lemmermannii P. Richter, whichappeared intermittently in minor abundances at allstations (authors’ unpubl. data). Major peaks in totalcyanobacterial abundance appeared during periods ofmaximum rates of N2 fixation (Figs. 4 to 6). The N2 fixa-tion rate in cells >20 μm were plotted as a linear func-tion of total cyanobacterial abundance (Fig. 7).
DISCUSSION
There was great temporal and spatial (depth andgeography) variability in our field measurements of N2
fixation in the Baltic Sea. The apparent patchiness andtemporal fluctuations in cyanobacterial abundanceand rates of N2 fixation confirm the importance of long-term inter-annual studies over a wide arrary of sam-pling stations for obtaining comprehensive informationrequired for decisions on sewage treatment and nutri-ent management efforts.
Diel variability and calculations of N2 fixation infilamentous cyanobacteria
In filamentous cyanobacteria such as Aphanizo-menon, Nodularia and Anabaena, the oxygen-sensitiveenzyme nitrogenase is protected by heterocysts allow-ing maximal rates of N2 fixation during daytime photo-
79
0
5
10
15
20
25
30
35
40
45
19991998 20000.0
0.5
1.0
1.5
2.0
2.5
3.0
3.5
0
200
400
600
800
100002468
10121416182022
0246810121416182022
0246810121416182022
C:N=6.6
C:P=106
A
B
Mol
ar C
:P (>
20 μ
m)
Sta
bili
ty In
dex
(δ15
m –
δS
urfa
ce)
Ab
und
ance
(m l–
1 )N
2 fix
atio
n (m
g m
–2 d
–1)
Mol
ar C
:N (>
20 μ
m)
SS
T 0–5
m (°
C)
Fig. 6. Stn H4. (A) Integrated rates of N2 fixation measured inall cells (D) collected on GF/F filters from depths between 0and 20 m in 1998–2000. Sea surface temperature (SST, solidline) was calculated as an average of the upper 0–5 m of thewater column. The integrated molar C:N ratio was calculatedfrom particles >20 μm (s) and the dashed line is the Redfieldrelationship (C:N = 6.6). (B) Abundance of cyanobacteria (D)averaged between 0 and 14 m depth in 1998–2000. Abun-dance was expressed as the total length of filaments mea-sured per volume of sample water (m l–1). The water columnstability index (solid line) was calculated as the difference indensity (δ) between 15 m and surface (δ15m – δSurface). The inte-grated molar C:P ratio was calculated from particles >20 μm(s) in 1998 and 1999, and the dashed line is the Redfield
relationship (C:P = 106)
0.01
0.01
0.1
1
10
H4 X1 BY31
N2
fixat
ion
>20
µm
(mg
m–2
d–1
)
Abundance (m l–1)0.1 1 10 100
Fig. 7. Integrated rates of N2 fixation in cells >20 μm at StnsBY31, X1 and H4 plotted as a function of the abundance offilamentous cyanobacteria. Cyanobacterial abundance wasexpressed as the total length of filaments measured pervolume of sample water (m l–1). The linear relationship isexpressed (±SE) by y = 0.72(±0.13)x – 0.24(±0.10), r = 0.602,
n = 53, p < 0.0001. Note the log10 scale on both axes
Mar Ecol Prog Ser 360: 73–84, 2008
synthesis. This diel pattern in N2 fixation (Fig. 2B) hasbeen reported in several investigations of heterocys-tous cyanobacteria from the Baltic Sea (Brattberg 1977,Vuorio et al. 1978, Evans et al. 2000, Gallon et al. 2002).A number of diel estimates of N2 fixation in the BalticSea are based on short, daytime measurements. Bratt-berg (1977), however, found that the average rate of N2
fixation between 10:00 and 14:00 h comprised only28% of the total 24 h rate, which is close to our areaintegration of AR during the same daytime period(34%; Fig. 2A). According to the pre-filtered 15N incu-bations, mean nocturnal N2 fixation rates were 13 and25% of the average daytime fixation rates at Stns B1and BY31, respectively (Table 1). In our diel measure-ments, total integrated N2 fixation at night was 20% oftotal daytime fixation (06:00 to 20:00 integration,Fig. 2A). This is slightly lower than the range (23 to50%) reported for Aphanizomenon colonies (Horne1979, Storch et al. 1990, Evans et al. 2000, Gallon et al.2002), but similar to 20% reported by Vuorio et al.(1978). Therefore, diazotrophic activities during thedark period may also contribute significantly to thetotal rate of N2 fixation in aquatic environments andshould not be overlooked in diel estimates. In thisstudy we propose a way to extrapolate diel rates of N2
fixation using measurements of short-term N2 fixationand the daily surface irradiance curve (see equation inResults). The calculated diel rate of N2 fixationappeared to follow actual 24 h rates measured coinci-dentally at Stn BY31 (Fig. 2B).
DON utilization and N2 fixation in non-filamentouscyanobacteria
Passive leakage or active release of DON has fre-quently been documented in actively growing phyto-plankton (Bronk et al. 1994, Glibert & Bronk 1994, Mul-holland et al. 2004). However, whether or not healthygrowing cells excrete DON is still under debate (Bronk& Ward 2000, Slawyk et al. 1998). Reported rates ofDON release from cyanobacteria are in the range of 40to 50% of the rate of N2 fixation (Glibert & Bronk 1994),but the rate of excretion may depend on physiologicalgrowth conditions. The molar ratio between AR and15N2 incorporation varied in Baltic Sea cyanobacteriaduring the course of a diel cycle (Gallon et al. 2002).Therefore, the 15N-enrichment method may not havereflected gross N2 fixation as release of 15N-labelledDON may have caused the high molar ratios observedin their study (Gallon et al. 2002). We are aware of nospecific studies of DON excretion from Baltic Sea dia-zotrophic cyanobacteria. No detectable rates of N2 fixa-tion in cells <5 μm were observed during daytime inoffshore waters of the Baltic Sea, but 5 to 10% of the to-
tal N2 fixed was recovered in these cells and attributedto DON transfer from the larger filamentous cyanobac-teria to the ‘picoplankton’ fraction (Ohlendieck et al.2000). Of total N2 fixation 43% occurred in cyanobacte-rial cells <10 μm (Wasmund et al. 2001). This size frac-tion, however, had the same level of 15N-enrichment inpre-screened cells and cells separated after the incuba-tions, suggesting that DON excretion was insignificantfor cells <10 μm in their study. Higher night-time ratesin natural seawater samples (up to 1.9 × the daytimerate) suggested that smaller non-filamentous dia-zotrophs may have been more active at night (Was-mund et al. 2001). Recent open ocean studies using the15N method have demonstrated the significance ofnight-time N2 fixation by single cell diazotrophs (Mon-toya et al. 2004). At times, significant rates of N2 fixationhave also been found in cells other than filamentouscyanobacteria (Wasmund et al. 2001), and a variablebut significant fraction of N2 fixation has been observedin cells between 5 μm and 20 μm (Ohlendieck et al.2007). Therefore, assuming that cells <5 μm are non-diazotrophic and incorporate excreted DON, we candeduce that cells between 5 μm and 10 μm may some-times contribute significantly to N2 fixation in the watercolumn. In our study, most N2 fixation occurred in cells>20 μm (Fig. 3). However, a considerable fraction of the15N-label in our diel incubations (31 to 44% of total N2
fixation at H4, 15 to 24% at X1, and 18 to 28% at BY31)was also recovered in cells <20 μm. In a day-night com-parison of N2 fixation with size-fractionated samples,the coastal stations had higher rates in the smaller cellfraction in daytime rather than at night (Table 1). Onlyat Stn BY31 did cells <20 μm have higher rates of N2
fixation at night than during the day. Our data suggestthat non-filamentous cyanobacteria in offshore watersmay at times have significant rates of N2 fixation atnight. However, the average fractions of 15N enrich-ment in cells <20 μm in this study (Fig. 3) far exceededthe rates of N2 fixation attributed to non-filamentouscyanobacteria in the Baltic Sea (Ohlendieck et al. 2007).Therefore, we conclude that a significant proportion ofthe total N2 fixation was initially incorporated by fila-mentous cyanobacteria and, by way of DON excretion,may have been further assimilated by microplankton.
Cyanobacterial blooms and growth
The great variability in the abundance of filamen-tous cyanobacteria and hence, their potential contribu-tion to new production by N2 fixation may result from amultitude of physical, chemical and physiological fac-tors. Previous studies (see overview by Leppänen et al.1988) reported a relationship between rates of N2 fixa-tion, surface temperature and the stability of the water
80
Degerholm et al.: N2 fixation in the Baltic Sea
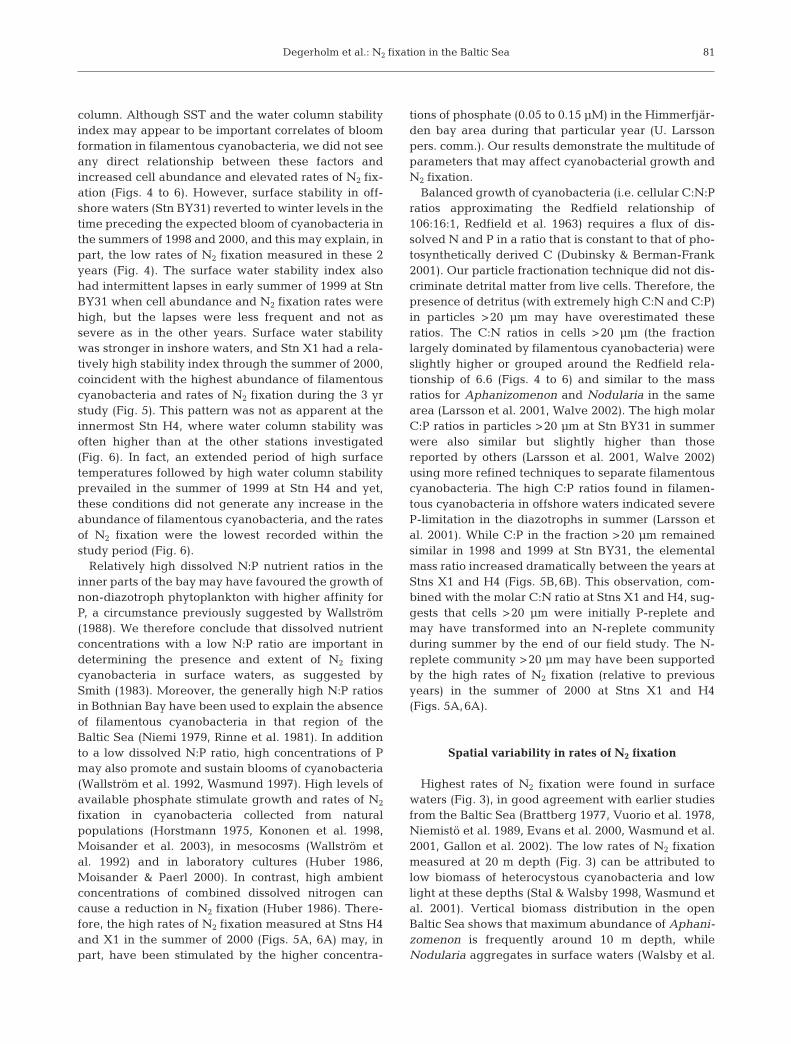
column. Although SST and the water column stabilityindex may appear to be important correlates of bloomformation in filamentous cyanobacteria, we did not seeany direct relationship between these factors andincreased cell abundance and elevated rates of N2 fix-ation (Figs. 4 to 6). However, surface stability in off-shore waters (Stn BY31) reverted to winter levels in thetime preceding the expected bloom of cyanobacteria inthe summers of 1998 and 2000, and this may explain, inpart, the low rates of N2 fixation measured in these 2years (Fig. 4). The surface water stability index alsohad intermittent lapses in early summer of 1999 at StnBY31 when cell abundance and N2 fixation rates werehigh, but the lapses were less frequent and not assevere as in the other years. Surface water stabilitywas stronger in inshore waters, and Stn X1 had a rela-tively high stability index through the summer of 2000,coincident with the highest abundance of filamentouscyanobacteria and rates of N2 fixation during the 3 yrstudy (Fig. 5). This pattern was not as apparent at theinnermost Stn H4, where water column stability wasoften higher than at the other stations investigated(Fig. 6). In fact, an extended period of high surfacetemperatures followed by high water column stabilityprevailed in the summer of 1999 at Stn H4 and yet,these conditions did not generate any increase in theabundance of filamentous cyanobacteria, and the ratesof N2 fixation were the lowest recorded within thestudy period (Fig. 6).
Relatively high dissolved N:P nutrient ratios in theinner parts of the bay may have favoured the growth ofnon-diazotroph phytoplankton with higher affinity forP, a circumstance previously suggested by Wallström(1988). We therefore conclude that dissolved nutrientconcentrations with a low N:P ratio are important indetermining the presence and extent of N2 fixingcyanobacteria in surface waters, as suggested bySmith (1983). Moreover, the generally high N:P ratiosin Bothnian Bay have been used to explain the absenceof filamentous cyanobacteria in that region of theBaltic Sea (Niemi 1979, Rinne et al. 1981). In additionto a low dissolved N:P ratio, high concentrations of Pmay also promote and sustain blooms of cyanobacteria(Wallström et al. 1992, Wasmund 1997). High levels ofavailable phosphate stimulate growth and rates of N2
fixation in cyanobacteria collected from naturalpopulations (Horstmann 1975, Kononen et al. 1998,Moisander et al. 2003), in mesocosms (Wallström etal. 1992) and in laboratory cultures (Huber 1986,Moisander & Paerl 2000). In contrast, high ambientconcentrations of combined dissolved nitrogen cancause a reduction in N2 fixation (Huber 1986). There-fore, the high rates of N2 fixation measured at Stns H4and X1 in the summer of 2000 (Figs. 5A, 6A) may, inpart, have been stimulated by the higher concentra-
tions of phosphate (0.05 to 0.15 μM) in the Himmerfjär-den bay area during that particular year (U. Larssonpers. comm.). Our results demonstrate the multitude ofparameters that may affect cyanobacterial growth andN2 fixation.
Balanced growth of cyanobacteria (i.e. cellular C:N:Pratios approximating the Redfield relationship of106:16:1, Redfield et al. 1963) requires a flux of dis-solved N and P in a ratio that is constant to that of pho-tosynthetically derived C (Dubinsky & Berman-Frank2001). Our particle fractionation technique did not dis-criminate detrital matter from live cells. Therefore, thepresence of detritus (with extremely high C:N and C:P)in particles >20 μm may have overestimated theseratios. The C:N ratios in cells >20 μm (the fractionlargely dominated by filamentous cyanobacteria) wereslightly higher or grouped around the Redfield rela-tionship of 6.6 (Figs. 4 to 6) and similar to the massratios for Aphanizomenon and Nodularia in the samearea (Larsson et al. 2001, Walve 2002). The high molarC:P ratios in particles >20 μm at Stn BY31 in summerwere also similar but slightly higher than thosereported by others (Larsson et al. 2001, Walve 2002)using more refined techniques to separate filamentouscyanobacteria. The high C:P ratios found in filamen-tous cyanobacteria in offshore waters indicated severeP-limitation in the diazotrophs in summer (Larsson etal. 2001). While C:P in the fraction >20 μm remainedsimilar in 1998 and 1999 at Stn BY31, the elementalmass ratio increased dramatically between the years atStns X1 and H4 (Figs. 5B,6B). This observation, com-bined with the molar C:N ratio at Stns X1 and H4, sug-gests that cells >20 μm were initially P-replete andmay have transformed into an N-replete communityduring summer by the end of our field study. The N-replete community >20 μm may have been supportedby the high rates of N2 fixation (relative to previousyears) in the summer of 2000 at Stns X1 and H4(Figs. 5A,6A).
Spatial variability in rates of N2 fixation
Highest rates of N2 fixation were found in surfacewaters (Fig. 3), in good agreement with earlier studiesfrom the Baltic Sea (Brattberg 1977, Vuorio et al. 1978,Niemistö et al. 1989, Evans et al. 2000, Wasmund et al.2001, Gallon et al. 2002). The low rates of N2 fixationmeasured at 20 m depth (Fig. 3) can be attributed tolow biomass of heterocystous cyanobacteria and lowlight at these depths (Stal & Walsby 1998, Wasmund etal. 2001). Vertical biomass distribution in the openBaltic Sea shows that maximum abundance of Aphani-zomenon is frequently around 10 m depth, whileNodularia aggregates in surface waters (Walsby et al.
81
Mar Ecol Prog Ser 360: 73–84, 2008
1995, Heiskanen & Olli 1996, Wasmund et al. 2001,Hajdu et al. 2007). Therefore, a significant and activepart of the diazotrophic community may exist in sub-surface waters and must be included in order to obtainaccurate estimates of total water column N2 fixationrates (Stal & Walsby 1998).
Cyanobacterial biomass had abrupt seasonal max-ima and great inter-annual differences at our stations(Figs. 4B,5B,6B). Although Aphanizomenon sp. wasmost frequent, surface blooms of Nodularia sp. oftenoccurred during summer at the offshore Stn BY31. Anoverview of the abundance distribution of filamentouscyanobacteria in the Baltic Sea (Finni et al. 2001) alsoshows that Aphanizomenon sp. is the most commonlyencountered species in recent history. The positive lin-ear relationship between average abundance of fila-mentous cyanobacteria and the rate of N2 fixation(Fig. 7) largely explains the rather ephemeral biomassdistribution and the temporal and spatial variability inmeasured rates of total N2 fixation.
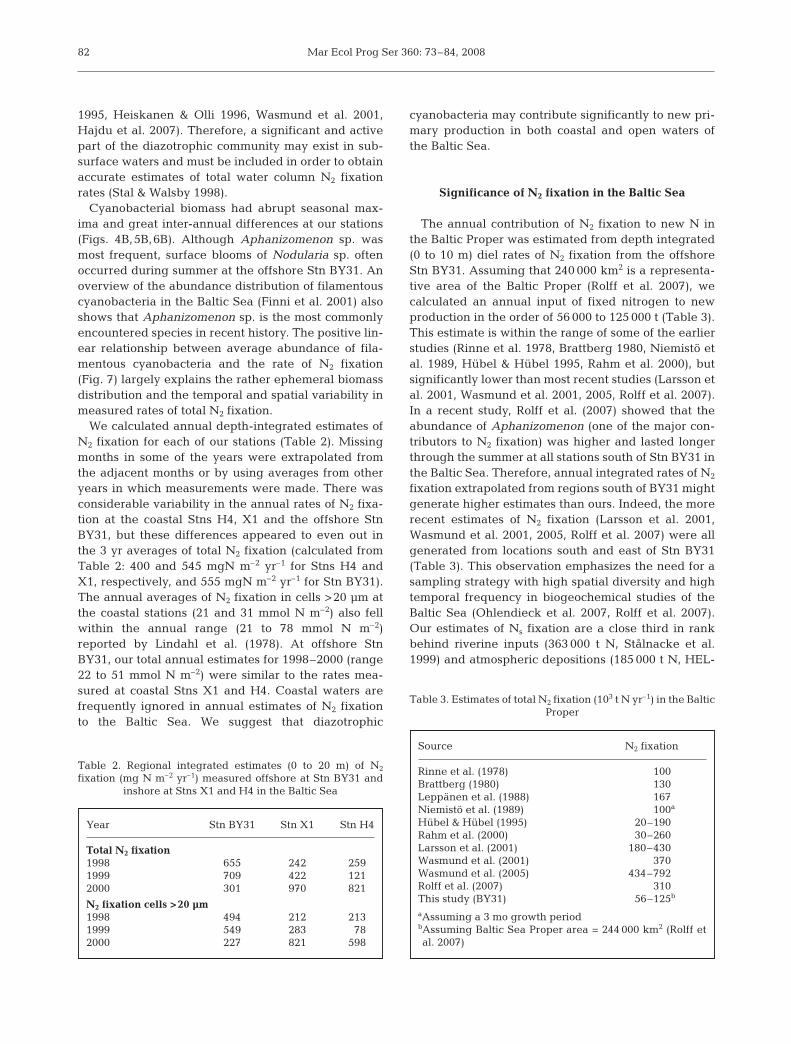
We calculated annual depth-integrated estimates ofN2 fixation for each of our stations (Table 2). Missingmonths in some of the years were extrapolated fromthe adjacent months or by using averages from otheryears in which measurements were made. There wasconsiderable variability in the annual rates of N2 fixa-tion at the coastal Stns H4, X1 and the offshore StnBY31, but these differences appeared to even out inthe 3 yr averages of total N2 fixation (calculated fromTable 2: 400 and 545 mgN m–2 yr–1 for Stns H4 andX1, respectively, and 555 mgN m–2 yr–1 for Stn BY31).The annual averages of N2 fixation in cells >20 μm atthe coastal stations (21 and 31 mmol N m–2) also fellwithin the annual range (21 to 78 mmol N m–2)reported by Lindahl et al. (1978). At offshore StnBY31, our total annual estimates for 1998–2000 (range22 to 51 mmol N m–2) were similar to the rates mea-sured at coastal Stns X1 and H4. Coastal waters arefrequently ignored in annual estimates of N2 fixationto the Baltic Sea. We suggest that diazotrophic
cyanobacteria may contribute significantly to new pri-mary production in both coastal and open waters ofthe Baltic Sea.
Significance of N2 fixation in the Baltic Sea
The annual contribution of N2 fixation to new N inthe Baltic Proper was estimated from depth integrated(0 to 10 m) diel rates of N2 fixation from the offshoreStn BY31. Assuming that 240 000 km2 is a representa-tive area of the Baltic Proper (Rolff et al. 2007), wecalculated an annual input of fixed nitrogen to newproduction in the order of 56 000 to 125 000 t (Table 3).This estimate is within the range of some of the earlierstudies (Rinne et al. 1978, Brattberg 1980, Niemistö etal. 1989, Hübel & Hübel 1995, Rahm et al. 2000), butsignificantly lower than most recent studies (Larsson etal. 2001, Wasmund et al. 2001, 2005, Rolff et al. 2007).In a recent study, Rolff et al. (2007) showed that theabundance of Aphanizomenon (one of the major con-tributors to N2 fixation) was higher and lasted longerthrough the summer at all stations south of Stn BY31 inthe Baltic Sea. Therefore, annual integrated rates of N2
fixation extrapolated from regions south of BY31 mightgenerate higher estimates than ours. Indeed, the morerecent estimates of N2 fixation (Larsson et al. 2001,Wasmund et al. 2001, 2005, Rolff et al. 2007) were allgenerated from locations south and east of Stn BY31(Table 3). This observation emphasizes the need for asampling strategy with high spatial diversity and hightemporal frequency in biogeochemical studies of theBaltic Sea (Ohlendieck et al. 2007, Rolff et al. 2007).Our estimates of Ns fixation are a close third in rankbehind riverine inputs (363 000 t N, Stålnacke et al.1999) and atmospheric depositions (185 000 t N, HEL-
82
Year Stn BY31 Stn X1 Stn H4
Total N2 fixation1998 655 242 2591999 709 422 1212000 301 970 821
N2 fixation cells >20 µm1998 494 212 2131999 549 283 782000 227 821 598
Table 2. Regional integrated estimates (0 to 20 m) of N2
fixation (mg N m–2 yr–1) measured offshore at Stn BY31 andinshore at Stns X1 and H4 in the Baltic Sea
Source N2 fixation
Rinne et al. (1978) 100Brattberg (1980) 130Leppänen et al. (1988) 167Niemistö et al. (1989) 100a
Hübel & Hübel (1995) 20–190Rahm et al. (2000) 30–260Larsson et al. (2001) 180–430Wasmund et al. (2001) 370Wasmund et al. (2005) 434–792Rolff et al. (2007) 310This study (BY31) 56–125b
aAssuming a 3 mo growth periodbAssuming Baltic Sea Proper area = 244 000 km2 (Rolff etal. 2007)
Table 3. Estimates of total N2 fixation (103 t N yr–1) in the Baltic Proper
Degerholm et al.: N2 fixation in the Baltic Sea
COM 1997) among the main sources of new N to off-shore waters of the Baltic Sea.
The annual input of N2 fixation to the Himmerfjär-den Bay area alone (179 km2; Stns H4 and X1) wasvery variable and the estimates should be regardedwith caution. Therefore, we are only considering herethe 3 yr annual averages of 65 t N at Stn H4 and 89 t Nat Stn X1 (calculated from Table 2). The estimatedannual discharge of N from the sewage treatmentplant in the Himmerfjärden bay area (Fig. 1) was onaverage 130 t N during the period of our study (Elm-gren & Larsson 2001). This is in sharp contrast to previ-ous years (1976–1994) when the annual load rangedbetween 500 and 900 t N (Elmgren & Larsson 2001).Due to legislation, the sewage treatment plant todayremoves 90% of the annual load of total N. Prior to1998, the sewage treatment plant was a significantpoint source contributing on average 40% of theannual input of total N to the bay area. Our estimatessuggest that during the study period the reduction in Ndischarged from the sewage treatment plant was notcompensated for by an increase in new N viacyanobacterial N2 fixation. After agricultural run-offand sewage discharge, N2 fixation was still only thethird largest source of new N to the Himmerfjärdenbay area. However, the large annual variability in themeasured rates of N2 fixation in the bay area demon-strates the need to investigate the multitude of factorsdetermining cyanobacterial growth and N2 fixation.This effort should be considered before costly nutrientwaste management efforts are implemented.
Acknowledgements. We thank the staff at the Askö MarineLaboratory and the captain and crew on RV ‘Baltica’, RV ‘Fyr-byggaren’ and RV ‘Searcher’. We also thank F. Lipschultz(BBSR) for analyses of the 15N-isotope samples, U. Larsson(Stockholm University) for access to the hydrographical time-series, S. Hajdu (Stockholm University) for cyanobacterialabundance data, and SMHI for the surface irradiance dataset. Our work was supported by the Sustainable Coastal ZoneManagement Programme (SUCOZOMA, within the Founda-tion for Strategic Environmental Research [MISTRA]), Stock-holm Marine Research Centre, The Swedish EnvironmentalProtection Agency, Landstingets Miljövårdsfond, Carl Tryg-gers Research Foundation and Magnus Bergvalls Foundation.This is an ELOISE publication supported by the EuropeanCommission (the Environment Programme), contract numberEV5V-CT94-0404 to the BASIC project.
LITERATURE CITED
Brattberg G (1977) Nitrogen fixation in a polluted brackishwater archipelago. Ambio Spec Rep 5:27–42
Brattberg G (1980) Kvävefixering i marin miljö – Östersjön. In:Rosswall T (ed) Processer i kvävets kretslopp. SwedishEnvironmental Protection Agency Report 1213, Stockholm,p 95–103
Bronk DA, Ward BB (2000) Magnitude of dissolved organicnitrogen release relative to grow nitrogen uptake in
marine systems. Limnol Oceanogr 45:1879–1883Bronk DA, Glibert PM, Ward BB (1994) Nitrogen uptake,
dissolved organic nitrogen release and new production.Science 265:1843–1846
Capone DG (1993) Determination of nitrogenase activity inaquatic samples using the acetylene reduction procedure.In: Kemp P, Sherr BF, Sherr EB, Cole JJ (eds) Aquatic micro-bial ecology. Lewis Publishers, Boca Raton, FL, p 621–623
Capone DG, Zehr J, Paerl H, Bergman B, Carpenter EJ (1997)Trichodesmium: a globally significant marine cyanobac-terium. Science 276:1221–1229
Dubinsky Z, Berman-Frank I (2001) Uncoupling primary pro-duction from population growth in photosynthesizingorganisms in aquatic ecosystems. Aquat Sci 63:4–17
Elmgren R, Larsson U (2001) Nitrogen and the Baltic Sea:managing nitrogen in relation to phosphorus. Sci World J1(Suppl 2):371–377, available at: www.thescientificworld.com/scientificworldjournal/
Evans AM, Gallon JR, Jones A, Staal M, Stal LJ, Villbrandt M,Walton TJ (2000) Nitrogen fixation by Baltic cyanobacteriais adapted to the prevailing photon flux density. New Phy-tol 147:285–297
Finni T, Kononen K, Olsonen R, Wallström K (2001) The his-tory of cyanobacterial blooms in the Baltic Sea. Ambio 30:172–178
Gallon JR, Albertano P, Bergman B, von Bröckel K and others(2002) N2 fixation and primary production are uncoupledin a developing cyanobacterial bloom in the Baltic Sea.Limnol Oceanogr 47:1514–1521
Glibert PM, Bronk DA (1994) Release of dissolved organicnitrogen by marine diazotrophic cyanobacteria, Tricho-desmium spp. Appl Environ Microbiol 60:3996–4000
Hajdu S, Höglander H, Larsson U (2007) Phytoplankton verti-cal distributions and composition in Baltic Sea cyanobac-terial blooms. Harmful Algae 6:189–205
Heiskanen A, Olli K (1996) Sedimentation and buoyancy ofAphanizomenon cf. flos-aquae (Nostocales, Cyanophyta)in a nutrient-replete and nutrient depleted coastal area ofthe Baltic Sea. Phycologia 35:94–101
HELCOM (Helsinki Commission) (1988) Guidelines for theBaltic monitoring programme for the third stage. BalticSea Environmental Proceedings 27, Government PrintingCentre, Helsinki
HELCOM (Helsinki Commission) (1997) Airborne pollutionload to the Baltic Sea 1991–1995. Baltic Sea Environmen-tal Proceedings 69, Bratts Tryckeri, Jönköping
Horne AJ (1979) Nitrogen fixation in Clear Lake, California.4: diel studies on Aphanizomenon and Anabaena blooms.Limnol Oceanogr 24:329–341
Horstmann U (1975) Eutrophication and mass production ofblue-green algae in the Baltic. Havsforskn Inst Skr 239:83–90
Hübel H, Hübel M (1976) Die Rolle der N2-Bindung im Stick-stoffhaushalt von Kustengewässern der Ostsee. Limnolog-ica 10:425–426
Hübel H, Hübel M (1995) Blaualgen-Wasserblüten in derOstsee: Ursachen-Ausmass-Folgen. Deutsche Hydrogra-phische Z 2(Suppl):151–158
Huber AL (1986) Nitrogen fixation by Nodularia spumigenaMertens (Cyanobacteriaceae). 2: laboratory studies. Hy-drobiologia 133:193–202
Kahru M, Horstmann U, Rud O (1994) Satellite detection ofincreased cyanobacteria blooms in the Baltic Sea: naturalfluctuation or ecosystem change? Ambio 23:469–472
Kononen K, Hällfors S, Kokkonen M, Kuosa H, Laanemets J,Pavelson J, Autio R (1998) Development of a subsurfacechlorophyll maximum at the entrance to the Gulf of Fin-
83
Mar Ecol Prog Ser 360: 73–84, 2008
land, Baltic Sea. Limnol Oceanogr 43:1089–1106Larsson U, Elmgren R, Wulff F (1985) Eutrophication and the
Baltic Sea: causes and consequences. Ambio 14:9–14Larsson U, Hajdu S, Walve J, Elmgren R (2001) Baltic nitrogen
fixation estimated from the summer increase in uppermixed layer total nitrogen. Limnol Oceanogr 46:811–820
Leppänen JM, Niemi Å, Rinne I (1988) Nitrogen fixation ofcyanobacteria (blue-green algae) and the nitrogen cycleof the Baltic Sea. Symbiosis 6:181–194
Lindahl G, Wallström K (1985) Nitrogen fixation (acetylenereduction) in planktic cyanobacteria in Öresundsgrepen,SW Bothnian Sea. Arch Hydrobiol 104:193–204
Lindahl G, Wallström K, Brattberg G (1978) On nitrogen fixa-tion in a coastal area of the northern Baltic. Kiel Meeres-forsch (Sonderh) 4:171–177
Moisander PH, Paerl HW (2000) Growth, primary productiv-ity, and nitrogen fixation potential of Nodularia spp.(Cyanophyceae) in water from a subtropical estuary in theUnited States. J Phycol 36:645–658
Moisander PH, Steppe TF, Hall NS, Kuparinen J, Paerl HW(2003) Variability in nitrogen and phosphorus limitationfor Baltic Sea phytoplankton during nitrogen-fixingcyanobacterial blooms. Mar Ecol Prog Ser 262:81–95
Montoya JP, Voss M, Kähler P, Capone DG (1996) A simple,high-precision, high-sensitivity tracer assay for N2 fixa-tion. Appl Environ Microbiol 62:986–993
Montoya JP, Holl CM, Zehr JP, Hansen A, Villareal TA,Capone DG (2004) High rates of N2 fixation by unicellulardiazotrophs in the oligotrophic Pacific Ocean. Nature 430:1027–1031
Mulholland MR, Bronk DA, Capone DG (2004) Dinitrogen fix-ation and release of ammonium and dissolved organicnitrogen by Trichodesmium IMS101. Aquat Microb Ecol37:85–94
Niemi Å (1979) Blue-green algal blooms and N:P ratio in theBaltic Sea. Acta Bot Fenn 110:57–61
Niemistö L, Rinne I, Melvasalo T, Niemi Å (1989) Blue-greenalgae and their nitrogen fixation in the Baltic Sea in 1980,1982 and 1984. Meri 17:1–59
Ohlendieck U, Stuhr A, Siegmund H (2000) Nitrogen fixationby diazotrophic cyanobacteria in the Baltic Sea and trans-fer of the newly fixed nitrogen to picoplankton organisms.J Mar Syst 25:213–219
Ohlendieck U, Gundersen K, Meyerhofer M, Fritsche P,Nachtigall K, Bergman B (2007) The significance of nitro-gen fixation to new production during early summer in theBaltic Sea. Biogeosciences 4:63–73
Rahm L, Jönsson A, Wulff F (2000) Nitrogen fixation in theBaltic proper: an empirical study. J Mar Syst 25:239–248
Redfield AC, Ketchum BH, Richards FA (1963) The influenceof organisms on the sea water. In: Hill MN (ed) The sea,Vol 2. General Edition Inter-science Publishers, New York,p 26–77
Rinne I, Melvasalo T, Niemi Å, Niemistö L (1978) Nitrogenfixation by blue-green algae in the Baltic Sea. KielMeeresforsch (Sonderh) 4:178–187
Rinne I, Melvasalo T, Niemi Å, Niemistö L (1981) Studies onnitrogen fixation in the Gulf of Bothnia. Finn Mar Res 248:117–127
Rolff C, Almesjö L, Elmgren R (2007) Nitrogen fixation and
abundance of the diazotrophic cyanobacterium Aphani-zomenon sp. in the Baltic Proper. Mar Ecol Prog Ser 332:107–118
Savchuk O, Wulff F (1999) Modelling regional and large-scale response of Baltic Sea ecosystems to nutrient loadreductions. Hydrobiologia 393:35–43
Slawyk G, Raimbault P, Garcia N (1998) Measuring grossuptake of 15N-labeled nitrogen by marine phytoplanktonwithout particulate matter collection: evidence of low 15Nlosses to the dissolved organic nitrogen pool. LimnolOceanogr 43:1734–1739
Smith VH (1983) Low nitrogen to phosphorus ratios favourdominance by blue-green algae in lake phytoplankton.Science 221:669–671
Solorzano L, Sharp JH (1980) Determination of total dissolvedphosphorus and particulate phosphorus in natural waters.Limnol Oceanogr 25:754–758
Stal LJ, Walsby AE (1998) The daily integral of nitrogen fixa-tion by planktonic cyanobacteria in the Baltic Sea. NewPhytol 139:665–671
Stålnacke P, Grimvall A, Sundblad K, Tonderski A (1999) Esti-mation of riverine loads of nitrogen and phosphorus to theBaltic Sea, 1970–1993. Environ Monit Assess 58:173–200
Storch TA, Saunders GW, Ostrofsky ML (1990) Diel nitrogenfixation by cyanobacterial surface blooms in SanctuaryLake, Pennsylvania. Appl Environ Microbiol 56:466–471
Strickland JDH, Parsons TR (1972) A practical handbook ofseawater analysis. Bull Fish Res Board Can 167:1–310
Vuorio H, Rinne I, Sundman V (1978) Nitrogen fixation ofplanktonic blue-green algae in the Helsinki sea areadetermined as acetylene reduction. Aqua Fenn 8:47–57
Wallström K (1988) The occurrence of Aphanizomenon flos-aquae (Cyanophyceae) in a nutrient gradient in the Baltic.Kiel Meeresforsch (Sonderh) 6:210–220
Wallström K, Johansson S, Larsson U (1992) Effects of nutrientenrichment on planktic blue-green algae in the Baltic Sea.Acta Phytogeogr Suec 78:25–31
Walsby AE, Hayes PK, Boje R (1995) The gas vesicles, buoy-ancy and vertical distribution of cyanobacteria in theBaltic Sea. Eur J Phycol 30:87–94
Walsby AE, Hayes P, Boje R, Stal LJ (1997) The selectiveadvantage of buoyancy provided by gas vesicles forplanktonic cyanobacteria in the Baltic Sea. New Phytol136:407–417
Walve J (2002) Nutrient limitation and elemental ratios inBaltic Sea plankton. PhD thesis, Stockholm University,Stockholm
Wasmund N (1997) Occurrence of cyanobacterial blooms inthe Baltic Sea in relation to environmental conditions. IntRev Gesamten Hydrobiol 82:169–184
Wasmund N, Voss M, Lochte K (2001) Evidence of nitrogenfixation by non-heterocystous cyanobacteria in the BalticSea and re-calculation of a budget of nitrogen fixation.Mar Ecol Prog Ser 214:1–14
Wasmund N, Nausch G, Schneider B, Nagel K, Voss M (2005)Comparison of nitrogen fixation rates determined with dif-ferent methods: a study in the Baltic Proper. Mar Ecol ProgSer 297:23–31
Weiss RF (1970) The solubility of nitrogen, oxygen, and argonin seawater. Deep-Sea Res 17:721–735
84
Editorial responsibility: Matthias Seaman,Oldendorf/Luhe, Germany
Submitted: July 5, 2007; Accepted: December 17, 2007Proofs received from author(s): May 2, 2008