Embed Size (px)
Citation preview

Pozo et al.: Phenology of Calakmul Butterflies 407
SEASONALITY AND PHENOLOGY OF THE BUTTERFLIES (LEPIDOPTERA: PAPILIONOIDEA AND HESPERIOIDEA) OF MEXICO’S CALAKMUL REGION
C
ARMEN
P
OZO
1,2
, A
RMANDO
L
UIS
-M
ARTÍNEZ
3
, J
ORGE
L
LORENTE
-B
OUSQUETS
3
, N
OEMÍ
S
ALAS
-S
UÁREZ
2
,A
IXCHEL
M
AYA
-M
ARTÍNEZ
2
, I
SABEL
V
ARGAS
-F
ERNÁNDEZ
3
AND
A
NDREW
D. W
ARREN
1, 3
1
McGuire Center for Lepidoptera and Biodiversity, Florida Museum of Natural History,University of Florida, SW 34th St. and Hull Rd., Gainesville, FL 32611-2710
2
Present address: Depto. de Ecología Terrestre, El Colegio de la Frontera Sur,Av. Centenario Km 5.5, A.P. 424, Chetumal, Quintana Roo, C.P. 77014, México
3
Museo de Zoología “Alfonso L. Herrera”, Facultad de Ciencias, Universidad Nacional Autónoma de México,Apdo. Postal 70-399, C.P. 04510, México, D.F., México
A
BSTRACT
The phenology of butterflies was analyzed in the Calakmul Region (CR) in the state ofCampeche, México, over the course of 3 years. Altogether, 60,662 individuals were recorded,consisting of 359 species in 207 genera, 18 subfamilies, 5 families, and 2 superfamilies.Greatest species diversity was recorded during Oct and Nov. Monthly fluctuation in diver-sity was defined by rare species. Hesperiidae (135 species) and Nymphalidae (111 species)were the most diverse families, and showed the greatest variation with respect to distribu-tion of species richness throughout the year. Papilionidae showed the greatest species rich-ness during the dry season. Pieridae, Nymphalidae, and Lycaenidae showed peaks ofgreatest species richness and relative abundance during the rainy season. Results werecompared to faunal studies of the Sierra de Atoyac de Álvarez, in the state of Guerrero, andof the Sierra de Manantlán, in Jalisco and Colima. Important similarities were observedamong phenological patterns in the butterfly fauna of the 3 regions, especially between CRand Manantlán. The phenology of species with greater relative abundance was analyzed inrelation to wingspan as a parameter of adult size. The small and medium-sized groups,taken together, showed variations in species richness. An analysis of species seasonality wasconducted with NMDS, ANOSIM and SIMPER, in the program PRIMER 4.0. Differencesamong the composition of butterfly communities with respect to the seasons were found.
Key Words: Calakmul Biosphere Reserve, rare species, Yucatán Peninsula
R
ESUMEN
La fenología de las mariposas fue analizada en la región de Calakmul (CR), Campeche,México. A lo largo de tres años se registraron 60,662 individuos, de 359 especies en 207 gé-neros, 18 subfamilias, cinco familias, y dos superfamilias. La mayor diversidad fue regis-trada durante octubre y noviembre. La fluctuación mensual de la diversidad fue definida porlas especies raras. Las familias con mayor diversidad fueron Hesperiidae (135 especies) yNymphalidae (111 especies) y presentaron la mayor variación con respecto a la distribuciónde la riqueza de especies a través del año. Papilionidae mostró la riqueza más grande de es-pecies durante la estación seca. Pieridae, Nymphalidae y Lycaenidae presentaron sus máxi-mos de riqueza de especies y abundancia relativa durante la estación lluviosa. Se hizo unacomparación entre el presente estudio y los de fauna de Atoyac de Álvarez, en el estado deGuerrero, y de Manantlan, en Jalisco y Colima. Se observaron semejanzas entre la fenologíade las tres regiones, especialmente entre CR y Manantlan. La fenología de las especies conmayor abundancia relativa fue analizada en relación a la envergadura alar como un pará-metro del tamaño de las especies. Los grupos pequeños y medianos, en conjunto, muestranvariaciones en la riqueza de especies. Se realizó un análisis de estacionalidad de especies conlas matrices de datos, aplicando NMDS, ANOSIM y SIMPER con el programa PRIMER 4.0.Se encontraron diferencias en la composición de las comunidades de mariposas con respectoa las estaciones.
Translation provided by the authors.
Phenology is the study of the sequence of de-termined biological events; this type of observa-tion began with the first agrarians of various cul-
tures (Williams-Linera & Meave 2002; Shapiro etal. 2004). With respect to insects, phenology is de-fined as the process of the appearance of different
408
Florida Entomologist
91(3) September 2008
stages in the life cycle of a taxonomic group overthe course of a year, and across several seasons(dry and wet or warm and cold periods). Amongbutterflies, this phenomenon has generally beendescribed based on the appearance of the adultstage or imago of various species. The presenceand activity of each generation has been ex-plained as a function of diverse climatic or vege-tation factors, such as temperature, precipitation,seasonality of vegetation, food availability, andfood quality. Phenological patterns in butterfliesmay be determined by fruiting or flowering plants(Tanaka & Tanaka 1982; Young 1982; Scott 1986;Wolda 1987, 1988a), annual humidity distribu-tion (Wolda 1987), cloudiness (Luis & Llorente1990), photoperiodic changes (Shapiro 1975), sub-strate availability and palatability of larval foodplants (Owen et al. 1972).
As with most other insects, butterfly life cyclesare strictly linked to seasonal changes (Owen1971), such as temperature, day length or photo-period, and humidity, among others. Species rich-ness is influenced by climatic factors, which deter-mine reproduction and survival conditions, andtherefore dictate the number of individuals or bio-mass documented. Voltinism is defined as the re-lationship between life cycle, annual climatic be-havior, and the number of generations per year.Depending on the number of generations per year,terms such as univoltinism, bivoltinism, trivolt-inism and multivoltinism are used to characterizethe phenology of a population, species, or taxon(Gullan & Cranston 2000). Flight in adults is fun-damental to conducting diverse vital actions suchas feeding, reproduction, and oviposition. Giventhat butterflies are heliothermic organisms, theirflight is dependent upon sunlight (Shapiro 1975).Gilbert & Singer (1975) and Shapiro (1975) sug-gested that interactions with hostplants and cli-mate may explain most of the distributional pat-terns seen among Lepidoptera. Shapiro (1975)emphasized that this seasonal history tends to beextremely conservative even at the family level;an example is the stage at which diapause takesplace (e.g., various Pieridae as pupae and manyLycaenidae as eggs).
The phenology of an insect fauna is summarizedby the pattern of species emergence throughoutthe year, which shows records obtained throughseveral generations during several years. Whenstudying phenology, we can distinguish at least 3principal components of the insect community. Thefirst component refers to species that are presentyear after year, regardless of the particular envi-ronmental conditions of any given year. The secondcomponent consists of species occurring in a givenseason, generally univoltine species. The thirdcomponent consists of species whose abundance istoo low to determine their seasonality.
Describing insect phenology is a complex en-deavor. Species behavior,
relative abundance, and
the sampling methods are usually biased towardscertain taxonomic groups. Often, information ob-tained on relative abundance does not correspondwith reality. For example, greater efforts are gen-erally employed in collecting rare or very local-ized species, and less effort is usually made to col-lect abundant or common, vagile, and widely dis-tributed species (eurytopics) (Pozo et al. 2005).
The objective of this paper is to describe sea-sonal and phenological patterns of the butterflycommunity (Papilionoidea and Hesperioidea) inthe tropical forest of the Calakmul region, basedon 2 different methodologies, with data collectedduring 26 months over the course of 3 years.
M
ATERIALS
AND
M
ETHODS
Study Area
The Municipality of Calakmul is located insoutheastern Campeche State, Mexico, in the cen-ter of the Yucatan Peninsula. With an area of16,806 km
2
, Mpio. Calakmul borders the State ofQuintana Roo to the east and the Department ofEl Petén, Guatemala, to the south. Almost half ofthe municipality was placed under protection bydecree of the Calakmul Biosphere Reserve (CR) in1989 (Fig. 1). The reserve includes an area of7,232 km
2
, with an altitude 100 to 300 m above sealevel. The Reserve has a semi-humid, warm cli-mate. Annual precipitation ranges from 600-1200mm, and annual average temperature is 24.6°C(Fig. 2) (INEGI 1996). The dry season extendsfrom Feb to May, followed by the rainy seasonfrom Jun to Sep, which in turn is followed by the“nortes” (or cold) season, from Oct to Jan. “Nortes”refer to frequent fronts of cold winds that cross theGulf of Mexico and carry humidity from a NE toSW direction (Williams-Linera & Meave 2002).
In the CR, 7 vegetation types are found: talltropical evergreen forest, medium height tropicalsemi-evergreen forest, medium height tropicalsemi-deciduous forest, savanna, low tropicalsemi-evergreen forest, low tropical semi-decidu-ous forest and, low tropical semi-deciduous sea-sonally flooded forest. The medium height tropi-cal semi-evergreen forest and low tropical semi-deciduous forest dominate the landscape withinthe CR (Martínez & Galindo-Leal 2002).
Sampling
The butterfly fauna of CR was surveyed during266 d distributed over 26 months, across 3 years(Mar 1997-Dec 1999), representing approximately5562 person-h and 8840 trap-h (Table 1). Sam-pling was conducted at sites dominated by themost representative vegetation types of the re-gion, medium height tropical semi-evergreen for-est (selva mediana, or Upland Standard Forest
sensu
Schulze 1992) and low tropical semi-decid-

Pozo et al.: Phenology of Calakmul Butterflies 409
uous forest (selva baja or Low Forest
sensu
Rze-dowski 1983), as determined by botanist EstebanMartínez. Within each forest type, transects of500 m were established within habitat types ofdifferent successional stages, including primaryforest, forest disturbed more than 10 years ago,and forest disturbed within the past 10 years. Ineach habitat type, replicate transects were sam-pled (separated by at least 300 m), for a total of 18transects in the first year, and 12 transects dur-
ing the second and third years (Table 2), at a totalof 11 localities. Six localities are within or nearthe northern portion of the CR, and 5 are withinor near the southern part of the CR (Fig. 1).
The first year, sampling was conducted 4 tineseach season at each locality. The second year,sampling was conducted only during the monthsof greatest butterfly abundance, from Jun to Nov.The third year, all localities were sampledmonthly. Two sampling methods were utilized, di-
Fig. 1. Location of the 11 study sites within and near the Calakmul Biosphere Reserve: A = Calakmul Archeo-logical Zone; B = road to Calakmul Archeological Zone; C = Narciso Mendoza Ejido; D = Nuevo Becal Ejido; E = en-trance to El Papagayo; F = path to Flores Magón; G = north of Mancolona; H = Plan de Ayala Ejido; I = west of ElRefugio Ejido, with medium tropical semi-evergreen forest; J = west of El Refugio Ejido, with low tropical semi-de-ciduous forest. Ejido = communal property.

410
Florida Entomologist
91(3) September 2008
rect search (DS) and transects (T). For eachmethod, 2 sampling techniques were employed:traps with bait (t) and entomological nets (n).Transects (T) were established through the forestby clearing a small path of 500 m length, with amachete, and wide enough to permit the passageof the observer without altering the canopy. Ineach transect, 10 Van Someren-Rydon traps (Ry-don 1964) baited with banana, pineapple, andbeer, were hung (from 0700 to 1800 h) at 50 m in-tervals, on alternate sides of the path. Fresh baitwas added each morning. Two surveyors spent120 to 150 min in each transect. Surveyorswalked each transect, spending 10 min at eachtrap to record trap contents (on a pre-prepared
form) and sample nearby individuals with ento-mological nets. Direct Search surveys (DS) weremore opportunistic. These were conducted bywalking along roads (2 observers for approxi-mately 8 h per d) in search of sites where butter-flies were concentrated (sunny gaps, nectarsources, damp ground, etc.), sampling butterfliesas opportunities were encountered. In addition,10 traps baited with fermenting fruit (as above)were placed in “optimal” localities along the road-sides and checked periodically.
Upon determination to species-level, trappedbutterflies were usually released. In cases wherethe identity of a trapped butterfly was uncertainor unknown, it was collected for determination at,
Fig. 2. Annual evaporation levels, precipitation and temperature recorded for 1997, 1998, and 1999 at the Zoh-Laguna Research Station in the Calakmul region.
T
ABLE
1. N
UMBER
OF
DAYS
PER
MONTH
SAMPLING
WAS
CONDUCTED
,
INCLUDING
ANNUAL
TRAP
-
HOURS
AND
MAN
-
HOURS
,
FOR
1997, 1998,
AND
1999.
J F M A M J J A S O N D TotalTrap- hours
Man- hours
1997 — — 12 12 — 12 — 12 — 14 12 12 86 3440 23221998 13 — — — — — 13 11 14 9 9 8 77 2310 13861999 3 9 9 10 7 7 8 10 11 9 12 8 103 3090 1854
Total 266 8840 5562

Pozo et al.: Phenology of Calakmul Butterflies 411
and integration into the Zoology Museum at ElColegio de la Frontera Sur, Chetumal, Mexico(duplicate specimens are deposited at the ZoologyMuseum of the Universidad Nacional Autónomade Mexico, Mexico City). To determine the extentto which released butterflies may be re-trappedand re-counted, all individuals released for a 3-month period were marked before release, and re-capture data was collected. Recapture data con-firmed that once released from a trap, individualsdid not usually return to traps (Hughes et al.1998). However, only long-lived and phylopatricspecies, or those with a small “home range” couldcause a bias in the data through recaptures, andfew such species were encountered in the CR.
Data from fieldwork were entered into the da-tabase of the Lepidoptera collection at the ZoologyMuseum at ECOSUR, representing a total of60,662 records of 359 species, in 207 genera, from18 subfamilies, 5 families and 2 superfamilies(nomenclature follows Llorente et al. 2006; A.Warren 2000, except that for the analyses we con-sidered the families Riodinidae and Lycaenidaetogether).
Analysis
Monthly species abundance (phenology) andseasonal distribution (seasonality) data were ana-lyzed. In order to describe phenological patterns,analyses were divided into 2 parts. First, the totalnumber of individuals and species recorded wasconsidered, and a family-level analysis was con-ducted (Shapiro 1975). Second, the phenology ofthe most abundant species was analyzed (specieswith 100 or more records during the 3 years ofsampling. The abundant species were divided into3 size categories (Young 1982; Vargas-Fernández etal. 1999). Because of the great diversity of butterflyspecies within the CR, adult size showed greatvariability (e.g.,
Pyrisitia nise nelphe
) (R. Felder1869), (forewing length = 17 mm ± 0.9 mm) and
Leptotes cassius cassidula
(Boisduval 1870), (12.7mm ± 1.1 mm)
vs
.
Archaeoprepona demophon cen-tralis
(Fruhstorfer 1905), (54 mm ± 4.4) and
Mor-pho achilles montezuma
Guenée 1859 (67 mm ± 4.0mm). Wingspan intervals were used as a proxy of
body size (Vargas-Fernández et al. 1999). The 3 ar-bitrary wingspan size categories were: small (
≤
30mm), medium (31-50 mm), and large (
≥
51 mm).
Seasonality
For each year, a data matrix was constructed,which recorded the species and their abundancein each season (dry, rainy, and cold or “nortes”).An NMDS analysis was applied to each matrix.Data was log-transformed according to the Boxand Cox test (Legendre & Legendre 1998). Forthese analyses we used PRIMER 4.0 software(Carr 1996), and results were graphed with Sigma-Plot Version 7.1, Systat. In order to statisticallyevaluate differences among groups in each sea-son, an ANOSIM test (ANalyis Of SIMilarities)was applied, and subsequently, a SIMPER (SIMi-larity PERcentages) analysis was applied to de-tect species that contributed to group formation,and those species which acted as discriminantsamong groups (Herrando-Pérez 2002).
R
ESULTS
Phenology
In general, the phenological patterns found inthis study are similar to those described by de laMaza and de la Maza (1985a, b) and Austin et al.(1996), with peak butterfly diversity at the end ofthe dry season and another peak during the rainyseason. Reduced species diversity was observedfrom the end of the rainy season to the middle of thedry season (Fig. 3). Nine percent of the Calakmulbutterfly species have been recorded in everymonth; similarly, Austin et al. (1996) reported 10%of the butterfly fauna from the Tikal area, Guatema-la (about 100 km S of Calakmul), from all months.
The month with the greatest species richnesswas Oct 1997, with 231 species, and the monthwith the greatest relative abundance was Aug1998, with 17,324 individuals (more than the1997 annual total of 16,257 records). Maximumspecies diversity was observed during Oct andNov, in agreement with previous studies in Méx-ico (Vargas-Fernández et al. 1992, 1999). This pe-
T
ABLE
2. T
RANSECTS
IN
EACH
HABITAT
TYPE
SURVEYED
IN
1997, 1998,
AND
1999.
Vegetationtype
Primary Disturbance >10 years Disturbance <10 years
1997 1998 1999 1997 1998 1999 1997 1998 1999
MT
a
3 2 2 3 2 2 3 2 2LT
b
3 2 2 3 2 2 3 2 2
Total 6 4 4 6 4 4 6 4 4
a
Medium tropical semi-evergreen forest.
b
Low tropical semi-deciduous forest.
412
Florida Entomologist
91(3) September 2008
riod coincides with the end of the rainy season.The year with the greatest species richness was1997, with 265 species recorded (74% of the totalspecies number), although a similar diversity wasobserved in 1998 (261 species). During 1999, spe-cies richness decreased to just 58% of the totalspecies diversity recorded in this study.
Large numbers of records for any given monthdo not necessarily indicate great species diversity.The greatest number of records obtained duringany month of the study was 17,324 records in Aug
1998, representing 28.56% of the total records ob-tained during this study. However, these individ-uals represented only 108 species (Table 3), and 3migratory species comprised 86.5% of the sample:
Memphis pithyusa
(R. Felder, 1869),
Anaea trogl-odyta aidea
(Guérin-Ménéville, 1844) and
Eunicatatila
tatila
(Herrich-Schäffer, 1855).
Memphispithyusa
was the most frequently recorded spe-cies in this study, with 12,848 records (Table 6).
Table 4 shows that 90.8% of the species re-corded during this study were represented byonly 19.7% of the recorded individuals. Specieswhich were present from 9 to 12 months equaled28.4% of total species recorded, and 95.4% of thetotal number of records. There were 140 speciespresent during 6 or more months of the year(98.1% of all records), while 178 species were re-corded only during 3 or fewer months, represent-ing half of the fauna studied (49.58% of speciesand 1.31% of records). Among species surveyed inthis study, 183 are represented by 10 or fewerrecords (60 of which were only recorded once).These are the “rare” species and represent 0.001%of the total number of records.
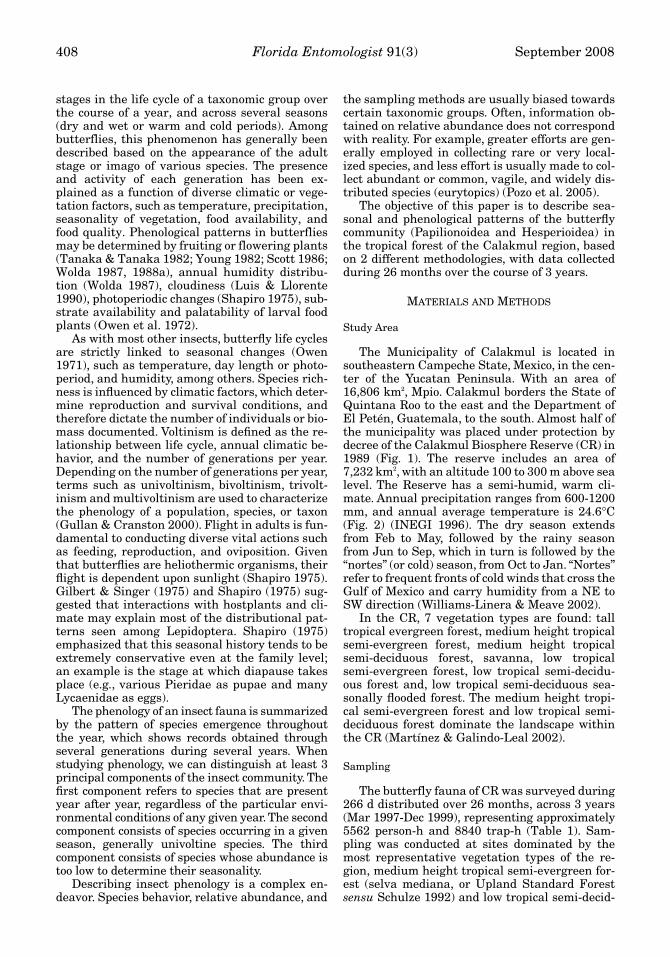
Butterflies were divided into 5 groups accord-ing to their relative abundance (Fig. 3). The firstgroup contains species represented by 10 or fewerrecords (183 species), the second group by 11 to100 records (110 species), the third by 101 to 1000records (55 species), the fourth by 1001 to 10,000records (10 species) and the fifth by more than10,000 records. This last group only included onespecies (
M. p. pithyusa
). Monthly variation in spe-cies richness is clearly defined by the first 2groups, represented by 293 species (81.6% of totalspecies richness and 7.5% of total relative abun-dance), 96 of which were recorded during only 1month (of those, 35 in Oct), and 60 of these repre-sented by only 1 individual (21 in Oct) (Fig. 3). Ta-ble 4
shows species frequency by month, fromthose present all year (33 species), to those re-corded only during 1 month. It is remarkable
thathalf of
the fauna (178 species) was recorded dur-ing 3 or fewer months, whereas 84 species werepresent during 10 or more months. Thus, half ofthe species are strongly seasonal (49.6%).
The 2 peaks in species richness coincide withthe greatest relative abundance (Fig. 3a and Ta-ble 3). The largest peak was observed from Jun toDec, which corresponds with the rainy season, al-though there were markedly fewer species duringSep. The smaller peak was observed from Feb toApr. We estimated that a minimum of 110 speciesshould fly each month, if we consider that 28-35%of species in this study were found during the en-tire year, and every year.
Family Level Phenology
The most diverse families in the study area arethose showing the largest variation in species
Fig. 3. a) Phenological pattern of the butterfly faunaof the Calakmul region, showing species abundancethroughout the year; b) phenological pattern of the but-terfly fauna of the Sierra de Manantlán, Jalisco-Colima;c) phenological pattern of the butterfly fauna of the Si-erra de Atoyac de Álvarez, Guerrero.

Pozo et al.: Phenology of Calakmul Butterflies 413
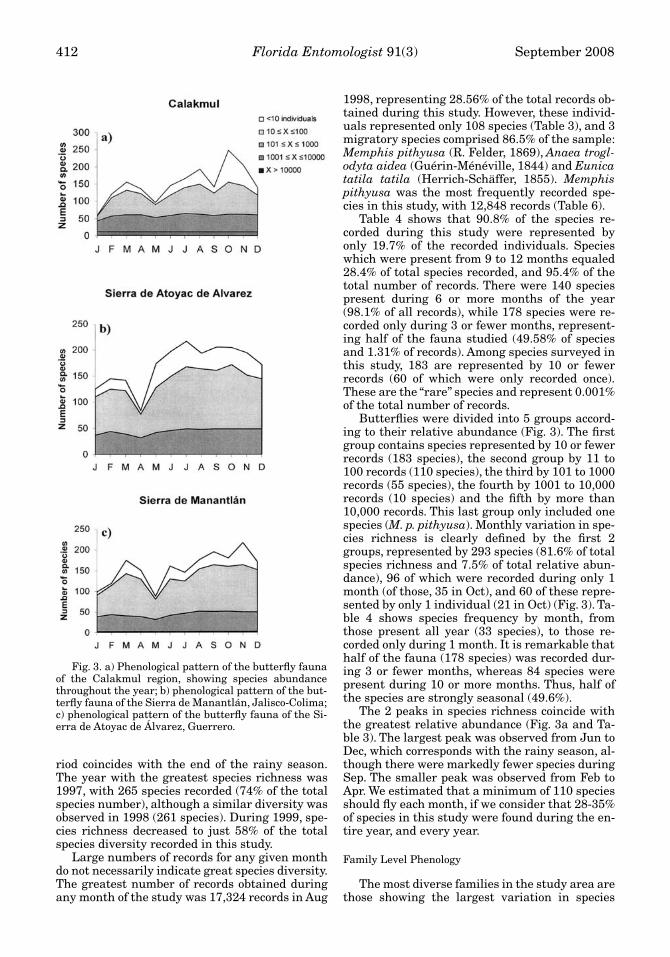
richness throughout the year (Hesperiidae = 135species, Nymphalidae = 111 species; Fig. 4). Incontrast to other families, peak diversity of Papil-ionidae was observed during the late dry seasoninto the early rainy season, as reported by Austinet al. (1996) for the Tikal area. Relative abun-dance of Papilionidae was distributed irregularlythroughout the year, but the greatest number ofindividuals (27.5%) was recorded in Apr (Table 5);the greatest species richness was in Jul (13 spe-cies), Apr (11 species) and Aug (11 species). Diver-sity and relative abundance of Pieridae speciesremained more or less constant throughout theyear, showing a slight increase during the rainymonths of Aug to Nov; Oct was the peak month forspecies richness (with 21 species) as well as rela-tive abundance. Hesperiidae, Lycaenidae, andNymphalidae showed 2 periods of increased spe-cies richness: the first (and lesser) occurred dur-ing the dry season, while the second (and greater)occurred during the rainy season; these two peri-ods are separated by the dry month of May whena decreased species diversity was observed. Spe-
cifically, the greatest species diversity for Lycae-nidae was Oct (44 species; a second peak in Marwith 25 species), with the greatest relative abun-dance in Aug; the lowest species diversity and rel-ative abundance among Lycaenidae was observedin Jan. The greatest species diversity for Nymph-alidae was observed in Oct (with a smaller peak inMar), while the greatest relative abundance wasin Aug (with a smaller peak in April). The differ-ence in abundance of Nymphalidae between dryand rainy seasons was greatly accentuated: 90%between the months of highest and lowest abun-dance (Table 5). Similarly, over 2 times as manyspecies of Lycaenidae, and over 3 times as manyspecies of Hesperiidae were recorded in the rainyseason than in the dry season (Table 5).
Phenology of Abundant Species Related to Size
Sixty-eight species were considered abundant(Table 6), and 75% of these were recorded from allmonths. These species are distributed among 5families, but most (51 species) are nymphalids.
T
ABLE
3. S
PECIES
DIVERSITY
AND
ABUNDANCE
OF
THE
BUTTERFLY
FAUNA
OF
THE CR.
Year J F M A M J J A S O N D Total
Species1997 102 95 112 152 231 187 122 2651998 50 103 108 137 101 74 60 2611999 35 121 131 119 98 94 142 90 74 73 72 53 2081997-1999 59 121 157 138 98 147 168 196 144 250 207 143 359
Individuals1997 800 1985 1414 2325 4277 3739 1717 162571998 1075 4002 17324 4621 2984 1403 680 320891999 320 1712 2232 1308 524 482 1906 1408 571 527 832 494 123161997-1999 1395 1712 3032 3293 524 1896 5908 21057 5192 7788 5974 2891 60662
TABLE 4. NUMBER OF MONTHS IN WHICH A NUMBER OF SPECIES AND INDIVIDUALS WERE DETECTED. FOR EXAMPLE, 19SPECIES WERE DETECTED DURING 7 MONTHS OF THE YEAR.
Numberof months
Numberof species Percentage
Cummulativepercentage
Numberof individuals Percentage
Cummulativepercentage
1 96 26.74 26.74 231 0.38 0.382 60 16.71 43.45 363 0.60 0.983 22 6.13 49.58 203 0.33 1.314 20 5.57 55.15 260 0.43 1.745 21 5.85 61.00 378 0.62 2.376 11 3.06 64.07 442 0.73 3.097 19 5.29 69.36 556 0.92 4.018 8 2.23 71.59 348 0.57 4.589 18 5.01 76.60 1557 2.57 7.1510 21 5.85 82.45 2770 4.57 11.7211 30 8.36 90.81 4846 7.99 19.7112 33 9.19 100.00 48708 80.29 100.00
Total 359 100.00 60662 100.00
414 Florida Entomologist 91(3) September 2008
These 68 species represent 91.6% of the recordsobtained in this study, but represent only 18.9% ofthe total species richness. Out of the 3 groupsformed according to size categories, 25 species aresmall, 32 are medium, and 11 are large.
Some variation exists with respect to seasonaltrends in species richness of the 3 size categories(Fig. 5). For the small-sized group, a difference of40% exists between the months of greatest andleast species richness. For medium-sized butter-flies, this difference is 31.25%, and for large butter-flies, a 36% difference exists. Figure 5b shows thelargest relative abundance for the 3 categoriesfrom Jun to Dec, with a strong decrease during Sep.
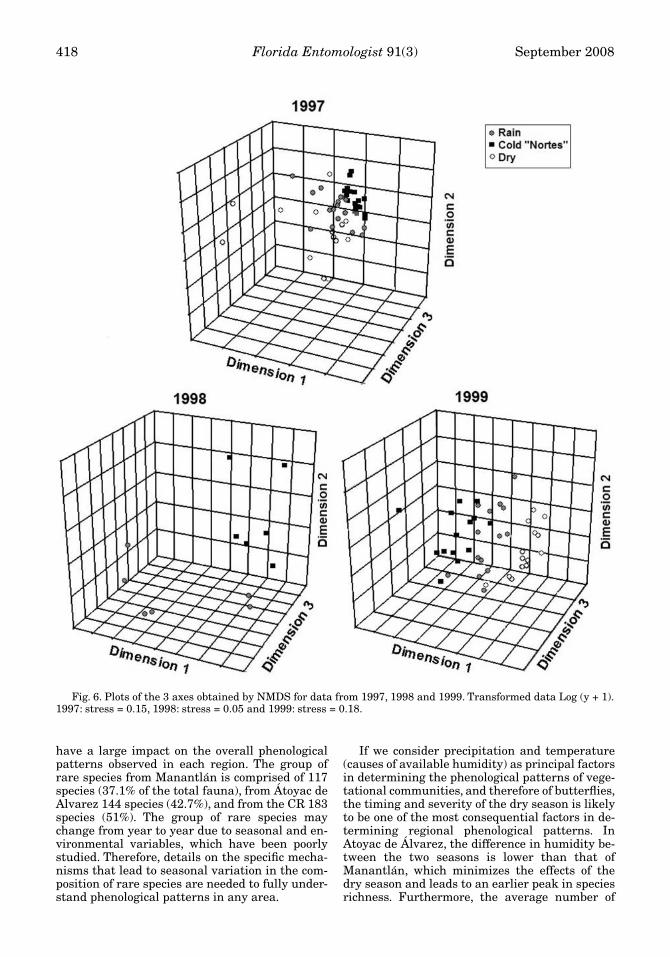
Seasonality
Butterfly diversity was found to be signifi-cantly variable among dry, rainy, and cold seasons(Fig. 6 and Fig. 7) during each year of the study(1997: stress = 0.15; 1998: stress = 0.05; 1999:stress = 0.18). Of the 359 species used for thisanalysis, 9% (32 species) provided more than 80%of the effective data when grouping the communi-ties in each of the 3 seasons (Table 7), 50% of dif-ferentiation among communities of each seasonwas determined by the relative abundance of 31species (8.6% of the total). Of the 32 species com-prising the communities in each season, 2 did not
contribute to the distinction among communities(Myscelia cyaniris cyaniris Doubleday (1848) andSiderone galanthis (Cramer 1775)), and 1 did notcontribute to the formation of groups (Marpesiachiron marius (Cramer 1779)), although it didwhen groups were analyzed separately. Of these32 species, only 3 did not belong to Nymphalidae:Kricogonia lyside (Godart 1819), Glutophrissadrusilla tenuis (Lamas 1981) and Polygonus sav-igny savigny (Latreille, (1824)) (Table 7).
When species richness by family in each sea-son is considered (Fig. 7a), it is clear that Hesperi-idae differed in phenological behavior from theother families. This family had the greatest spe-cies richness in the cold season, with values morethan double of those observed during the rainyand dry seasons. Nymphalidae and Lycaenidaeshowed maximum species richness during therainy season, with a slight decrease in the coldseason, while Pieridae and Papilionidae showedminimal variations. Pieridae showed a slight in-crease during the rainy season, at a time when di-versity of Papilionidae decreased to values lowerthan those of the dry season.
Relative abundance by season was strongly in-fluenced by Nymphalidae (Fig. 7b). Seasonal dif-ferences among the other families were not de-tected on this scale, due to the abundance ofnymphalid species. Nevertheless, abundance ofHesperiidae showed an increase in the cold sea-son (Table 5).
DISCUSSION
Phenology Considering the Relative Abundanceof Species
Wolda (1988b) concluded that there are differ-ences in phenological patterns among insect fau-nas typical of temperate and tropical zones. Un-der the assumption that seasonal changes areminimal in the tropics, adults of the majority ofspecies should be present throughout the year(Owen 1971), whereas in temperate zones adultsare restricted to the most favorable seasons (usu-ally spring and summer). Nevertheless, upon ex-amining climatic variations for each year of our
Fig. 4. Phenological patterns displayed by butterflyfamilies present in the Calakmul region (for this figure,Riodinidae is included within Lycaenidae).
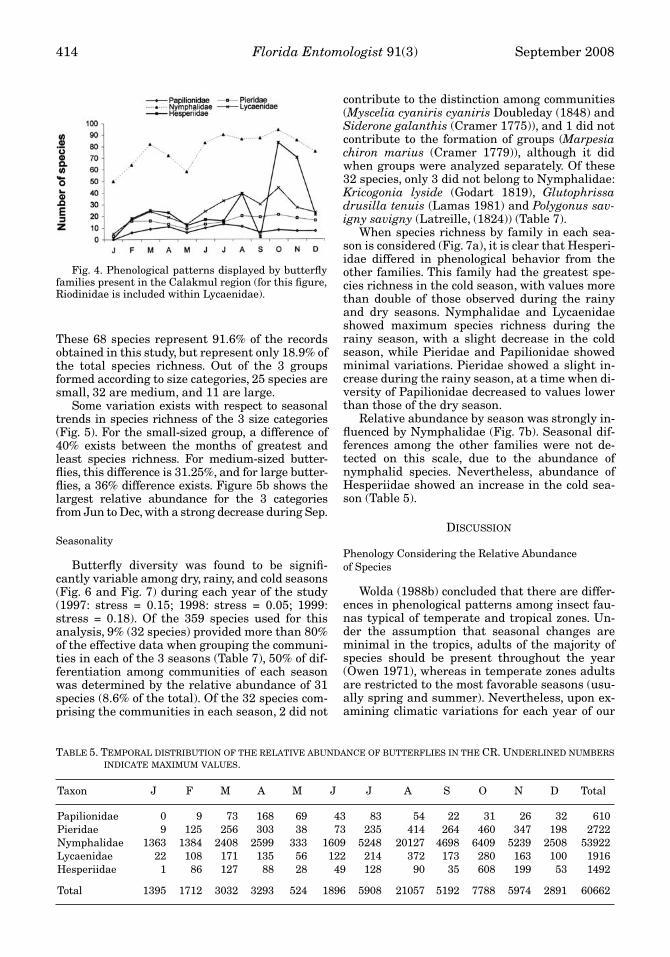
TABLE 5. TEMPORAL DISTRIBUTION OF THE RELATIVE ABUNDANCE OF BUTTERFLIES IN THE CR. UNDERLINED NUMBERSINDICATE MAXIMUM VALUES.
Taxon J F M A M J J A S O N D Total
Papilionidae 0 9 73 168 69 43 83 54 22 31 26 32 610Pieridae 9 125 256 303 38 73 235 414 264 460 347 198 2722Nymphalidae 1363 1384 2408 2599 333 1609 5248 20127 4698 6409 5239 2508 53922Lycaenidae 22 108 171 135 56 122 214 372 173 280 163 100 1916Hesperiidae 1 86 127 88 28 49 128 90 35 608 199 53 1492
Total 1395 1712 3032 3293 524 1896 5908 21057 5192 7788 5974 2891 60662

Pozo et al.: P
hen
ology of Calakm
ul B
utterfl
ies415
TABLE 6. NUMBER OF INDIVIDUALS BY MONTH AND YEAR OF THE MOST ABUNDANT SPECIES (68 SPECIES) THAT WERE USED TO ANALYZE THE PHENOLOGY CONSIDERING THESIZE OF THE SPECIES.
Taxon J F M A M J J A S O N D 1997 1998 1999 Total
SmallEunica tatila tatila (Herrich-Schäffer [1855]) 120 456 1111 199 76 159 1640 3722 242 472 449 341 344 5261 3382 8987Pareuptychia metaleuca metaleuca (Boisduval 1870) 109 5 8 40 3 2 28 79 24 41 131 43 328 39 146 513Pyrisitia nise nelphe (R. Felder 1869) 2 24 37 10 5 8 47 105 53 81 96 32 308 83 109 500Hermeuptychia hermes (Fabricius 1775) 22 40 73 51 2 31 30 11 13 75 104 34 315 23 148 486Cissia pseudoconfusa Singer, DeVries & Ehrlich 1983 33 6 31 43 11 28 25 34 16 83 120 38 239 49 180 468Kricogonia lyside (Godart 1819) 2 79 198 19 7 36 36 50 5 12 1 20 98 327 445Mestra dorcas amymone (Ménétriés 1857) 11 16 13 4 12 19 35 16 94 22 36 169 20 89 278Cissia pompilia (C.Felder & R. Felder 1867) 1 10 19 11 1 2 26 31 13 57 38 20 135 29 65 229Eumaeus toxea (Godart [1824]) 13 19 23 29 8 20 27 39 4 6 20 7 88 26 101 215Juditha molpe molpe (Hübner [1808]) 3 8 21 14 22 59 45 9 16 8 4 54 70 85 209Cepheuptychia glaucina (H.W. Bates 1864) 6 15 27 25 13 3 6 6 7 12 21 66 51 73 83 207Cissia similes (Butler 1867) 16 8 11 64 5 10 2 4 4 18 40 5 125 22 40 187Nica flavilla bachiana (R.G. Maza & J. Maza 1985) 39 6 8 36 2 11 13 5 3 33 11 107 3 57 167Cissia confuse (Staudinger 1887) 6 16 20 12 8 3 68 23 8 156 8 164Pareuptychia ocirrhoe ssp. n. 9 26 8 22 3 26 3 9 31 18 65 3 87 155Yphtimoides renata (Stoll 1780) 2 5 12 18 1 9 8 15 10 10 25 37 61 43 48 152Thessalia theona theona (Ménétriés 1855) 10 13 4 3 9 11 36 8 20 25 8 59 15 73 147Tegosa frisia tulcis (H.W. Bates 1864) 1 34 22 4 1 1 5 3 6 29 9 10 56 10 59 125Leptotes cassius cassidula (Boisduval 1870) 7 29 32 11 8 12 4 7 5 48 26 41 115Pteronymia cotytto cotytto (Guérin-Ménéville [1844]) 34 1 19 1 1 17 38 3 49 3 62 114Dynamine dyonis Geyer 1837 6 2 3 3 12 4 39 30 13 88 13 11 112Pyrgus oileus (Linnaeus 1767) 18 21 12 6 3 14 8 19 9 42 2 66 110Mesosemia tetrica Stichel 1910 4 10 5 3 1 14 16 29 13 12 34 46 27 107Pyrisitia dina westwoodi (Boisduval 1836) 4 7 1 2 2 14 9 21 13 16 9 27 29 42 98Heliopetes alana (Reakirt 1868) 4 15 8 4 2 6 5 31 7 8 60 1 29 90
MediumMemphis pithyusa pithyusa (R. Felder 1869) 204 99 76 144 5 242 707 6757 2154 1750 538 172 1737 10398 713 12848Anaea troglodyta aidea (Guérin-Ménéville [1844]) 4 19 8 18 1 231 742 5332 911 157 36 11 218 6873 379 7470Memphis forreri (Godman & Salvin 1884) 139 23 40 144 16 117 296 353 30 735 249 68 1408 468 334 2210Opsiphanes cassina fabricii (Boisduval 1870) 35 9 4 23 1 5 69 595 172 375 137 16 863 471 107 1441Myscelia ethusa ethusa (Doyère [1840]) 3 116 72 85 24 17 125 333 70 19 462 1 42 996 289 1327Memphis moruus boisduvali W.P. Comstock 1961 89 123 46 60 27 12 44 298 51 173 174 95 300 287 605 1192Taygetis virgilia (Cramer 1776) 139 4 13 144 6 65 28 172 41 171 220 50 776 189 88 1053Hamadryas februa ferentina (Godart [1824]) 22 21 36 89 16 78 45 47 164 80 57 36 225 301 165 691
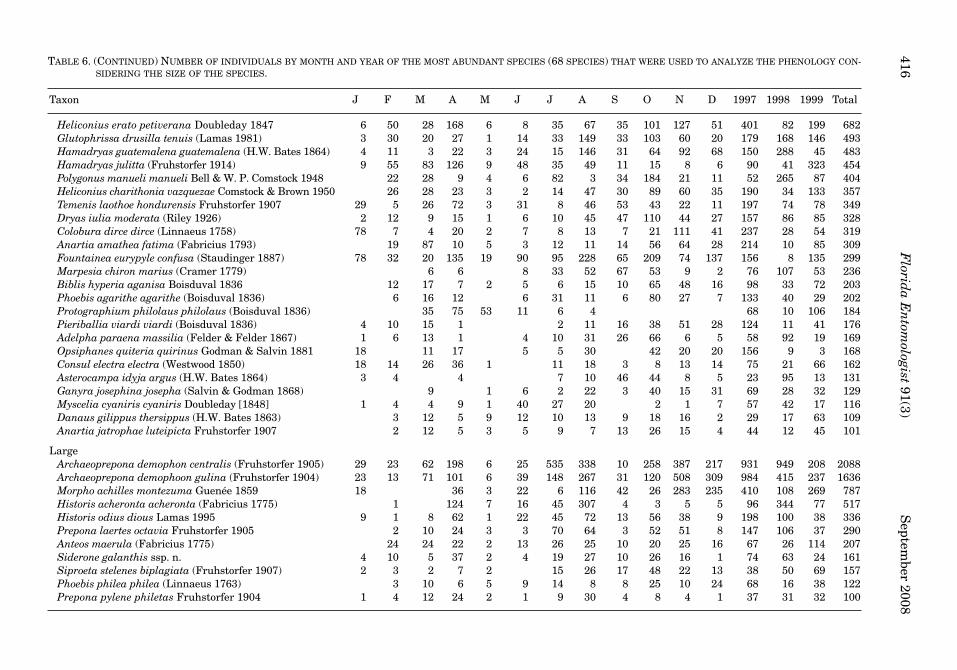
416F
lorida E
ntom
ologist 91(3)S
eptember 2008
Heliconius erato petiverana Doubleday 1847 6 50 28 168 6 8 35 67 35 101 127 51 401 82 199 682Glutophrissa drusilla tenuis (Lamas 1981) 3 30 20 27 1 14 33 149 33 103 60 20 179 168 146 493Hamadryas guatemalena guatemalena (H.W. Bates 1864) 4 11 3 22 3 24 15 146 31 64 92 68 150 288 45 483Hamadryas julitta (Fruhstorfer 1914) 9 55 83 126 9 48 35 49 11 15 8 6 90 41 323 454Polygonus manueli manueli Bell & W. P. Comstock 1948 22 28 9 4 6 82 3 34 184 21 11 52 265 87 404Heliconius charithonia vazquezae Comstock & Brown 1950 26 28 23 3 2 14 47 30 89 60 35 190 34 133 357Temenis laothoe hondurensis Fruhstorfer 1907 29 5 26 72 3 31 8 46 53 43 22 11 197 74 78 349Dryas iulia moderata (Riley 1926) 2 12 9 15 1 6 10 45 47 110 44 27 157 86 85 328Colobura dirce dirce (Linnaeus 1758) 78 7 4 20 2 7 8 13 7 21 111 41 237 28 54 319Anartia amathea fatima (Fabricius 1793) 19 87 10 5 3 12 11 14 56 64 28 214 10 85 309Fountainea eurypyle confusa (Staudinger 1887) 78 32 20 135 19 90 95 228 65 209 74 137 156 8 135 299Marpesia chiron marius (Cramer 1779) 6 6 8 33 52 67 53 9 2 76 107 53 236Biblis hyperia aganisa Boisduval 1836 12 17 7 2 5 6 15 10 65 48 16 98 33 72 203Phoebis agarithe agarithe (Boisduval 1836) 6 16 12 6 31 11 6 80 27 7 133 40 29 202Protographium philolaus philolaus (Boisduval 1836) 35 75 53 11 6 4 68 10 106 184Pieriballia viardi viardi (Boisduval 1836) 4 10 15 1 2 11 16 38 51 28 124 11 41 176Adelpha paraena massilia (Felder & Felder 1867) 1 6 13 1 4 10 31 26 66 6 5 58 92 19 169Opsiphanes quiteria quirinus Godman & Salvin 1881 18 11 17 5 5 30 42 20 20 156 9 3 168Consul electra electra (Westwood 1850) 18 14 26 36 1 11 18 3 8 13 14 75 21 66 162Asterocampa idyja argus (H.W. Bates 1864) 3 4 4 7 10 46 44 8 5 23 95 13 131Ganyra josephina josepha (Salvin & Godman 1868) 9 1 6 2 22 3 40 15 31 69 28 32 129Myscelia cyaniris cyaniris Doubleday [1848] 1 4 4 9 1 40 27 20 2 1 7 57 42 17 116Danaus gilippus thersippus (H.W. Bates 1863) 3 12 5 9 12 10 13 9 18 16 2 29 17 63 109Anartia jatrophae luteipicta Fruhstorfer 1907 2 12 5 3 5 9 7 13 26 15 4 44 12 45 101
LargeArchaeoprepona demophon centralis (Fruhstorfer 1905) 29 23 62 198 6 25 535 338 10 258 387 217 931 949 208 2088Archaeoprepona demophoon gulina (Fruhstorfer 1904) 23 13 71 101 6 39 148 267 31 120 508 309 984 415 237 1636Morpho achilles montezuma Guenée 1859 18 36 3 22 6 116 42 26 283 235 410 108 269 787Historis acheronta acheronta (Fabricius 1775) 1 124 7 16 45 307 4 3 5 5 96 344 77 517Historis odius dious Lamas 1995 9 1 8 62 1 22 45 72 13 56 38 9 198 100 38 336Prepona laertes octavia Fruhstorfer 1905 2 10 24 3 3 70 64 3 52 51 8 147 106 37 290Anteos maerula (Fabricius 1775) 24 24 22 2 13 26 25 10 20 25 16 67 26 114 207Siderone galanthis ssp. n. 4 10 5 37 2 4 19 27 10 26 16 1 74 63 24 161Siproeta stelenes biplagiata (Fruhstorfer 1907) 2 3 2 7 2 15 26 17 48 22 13 38 50 69 157Phoebis philea philea (Linnaeus 1763) 3 10 6 5 9 14 8 8 25 10 24 68 16 38 122Prepona pylene philetas Fruhstorfer 1904 1 4 12 24 2 1 9 30 4 8 4 1 37 31 32 100
TABLE 6. (CONTINUED) NUMBER OF INDIVIDUALS BY MONTH AND YEAR OF THE MOST ABUNDANT SPECIES (68 SPECIES) THAT WERE USED TO ANALYZE THE PHENOLOGY CON-SIDERING THE SIZE OF THE SPECIES.
Taxon J F M A M J J A S O N D 1997 1998 1999 Total

Pozo et al.: Phenology of Calakmul Butterflies 417
study, the expected uniformity in phenologicalpatterns of butterfly species at our tropical studysites does not exist. During the 3 years of ourstudy, there were important differences in precip-itation levels, and to a lesser degree, in tempera-ture, which caused levels of evaporation to differbetween years. Our results indicate a speciesturnover of more than 30% (as represented byadults), from the dry to rainy season. This helpsexplain seasonal variation in butterfly speciesrichness, as only 33 species (9%) fly year-round,either as 1 long-lived generation, multiple super-imposed generations, or several non-superim-posed generations. The greatest species richnesswas observed during 1997, the year with the larg-est evaporation levels.
In the CR, biotic and abiotic factors are not ho-mogeneously distributed, generally due to soilcharacteristics of the region, which in turn deter-mine the existence of a heterogeneous mosaic ofvegetation types. This mosaic is so intertwinedthat it is difficult to define vegetation types, andeven more so to distinguish them (Galindo-Leal2001; García-Gil et al. 2001; Martínez & Galindo-Leal 2002). This in turn produces a differentialspatial and temporal distribution of the lepi-dopteran fauna. It is possible that the phenologyof each species is more closely related to these fac-
tors, in response to the different micro-habitatswhere they live.
In order to investigate this relationship, ourresults were compared with phenological data onthe butterflies of the Sierra de Atoyac de Álvarez,Guerrero (Vargas-Fernández et al. 1992), and theSierra de Manantlán, Jalisco-Colima (Vargas-Fernánez et al. 1999). Both areas cover altitudi-nal transects; the former from 300 to 2500 m, andthe latter from 250 to 1750 m. The sampling pro-tocols used in these studies are equivalent to thatof the present study, thus we believe that compar-isons can be made among phenological data ob-tained for each of the 3 areas. However, the 2 Si-erras (mountain ranges) present biotic and abi-otic conditions that differ from those found in theCR, and have different biogeographical histories.While the Sierra de Atoyac de Álvarez and the Si-erra de Manantlán are situated along Mexico’sPacific watershed, they differ in latitude, averageprecipitation levels, and average temperature.
Species richness of Papilionoidea is very similaracross the 3 areas (although Hesperiidae were notsurveyed by Vargas-Fernández et al. 1992, 1999).In Atoyac de Álvarez, 337 species were recorded,with the greatest species richness in Jul (216 spe-cies), whereas in Manantlán, 315 species were re-corded, with a maximum diversity of 216 in No-vember. In the CR, 359 species were recorded (250in Oct), representing an average difference in over-all diversity among the sites of about 12%.
Unique environmental attributes of each regionshould cause phenological patterns among thebutterfly fauna to vary among them. Some reviewsof butterfly phenology suggest that climate is themain factor controlling the activity of these organ-isms (Brakefield & Shreeve 1992; Warren 1992;Gutiérrez & Menéndez 1998). However, climaticfactors may be influenced by differences betweenhabitats or years, correlated with microclimaticchanges at local or regional levels. In this study,phenological similarities were found with respectto species richness trends throughout the year.Two periods of maximum species richness weredistinguished: the period of greatest diversity dur-ing the rainy season, and the other peak duringthe dry season. This indicates that phenologicalpatterns among tropical butterfly faunas are muchmore complex than some authors have recognized.
Several authors have suggested that tropicalfaunas may be characterized by a large number ofspecies with very low densities (Lamas et al.1991; Owen 1971; Owen et al. 1972), which formthe group of “rare” species. This group is an im-portant part of the species diversity of each regionand is the modulating factor of phenologicalchanges, as demonstrated in this study. Upon ex-amining those species represented by fewer than10 records for each of the 3 regions we compared,it is evident that they represent a significant pro-portion of total species richness, and that they
Fig. 5. Analysis of phenological patterns and relativeabundance according to adult size. a) Phenology repre-sented by size groups: small (<30 mm wingspan); me-dium (31 to 50 mm); large (>51 mm); and combined. b)Relative abundance of individual butterflies by sizegroup.
418 Florida Entomologist 91(3) September 2008
have a large impact on the overall phenologicalpatterns observed in each region. The group ofrare species from Manantlán is comprised of 117species (37.1% of the total fauna), from Átoyac deAlvarez 144 species (42.7%), and from the CR 183species (51%). The group of rare species maychange from year to year due to seasonal and en-vironmental variables, which have been poorlystudied. Therefore, details on the specific mecha-nisms that lead to seasonal variation in the com-position of rare species are needed to fully under-stand phenological patterns in any area.
If we consider precipitation and temperature(causes of available humidity) as principal factorsin determining the phenological patterns of vege-tational communities, and therefore of butterflies,the timing and severity of the dry season is likelyto be one of the most consequential factors in de-termining regional phenological patterns. InAtoyac de Álvarez, the difference in humidity be-tween the two seasons is lower than that ofManantlán, which minimizes the effects of thedry season and leads to an earlier peak in speciesrichness. Furthermore, the average number of
Fig. 6. Plots of the 3 axes obtained by NMDS for data from 1997, 1998 and 1999. Transformed data Log (y + 1).1997: stress = 0.15, 1998: stress = 0.05 and 1999: stress = 0.18.

Pozo et al.: Phenology of Calakmul Butterflies 419
species present per month is greater in Atoyac deÁlvarez than in the other 2 regions. On the otherhand, in Manantlán, the process of species accu-mulation to the point of maximum diversity isslower, possibly because deciduous or semi-decid-uous vegetation (drier forests than those ofAtoyac de Álvarez) is present at almost all locali-ties below 1800 m. The same phenomenon is alsobe observed in the CR, where the dry season isvery pronounced, particularly due to the soil typecharacterized by calcareous rock, which causesrapid drainage. As a consequence of this, agreater similarity exists between the phenologi-cal patterns of the butterfly fauna of Manantlánand CR, than between CR and Atoyac de Álvarez.
While the “rare” species of a region comprisean important component of overall species diver-sity (as for CR, Fig. 8a), they do not allow for astraightforward phenological analysis, since thecomposition of rare species may change monthlyand yearly. Thus, in order to study seasonal andannual phenological patterns, we excluded rarespecies to standardize comparisons (Fig. 8b). Withrare species excluded, overall phenological pat-terns in Manantlán and CR show great similarity,while those of Atoyac de Álvarez are discordant.
This may be due to the shorter and less severe dryseason of Atoyac de Álvarez, as compared to theother 2 regions. However, if we displace the datafrom Atoyac de Álvarez 1 month forward (Fig. 8c),phenological patterns of the 3 regions are all re-markably similar. The months with the greatestspecies richness are Oct for CR (157 species) andAtoyac de Álvarez (172) and Nov for Manantlán(164). In contrast, the months of lowest diversityare May for CR (93) and Manantlán (81), and Aprfor Atoyac de Álvarez (77). This pattern is wellknown to many experienced collectors in Mexico,
Fig. 7. a) Diversity of Papilionidae, Pieridae, Nymph-alidae, Lycaenidae (including Riodinidae) and Hesperi-idae across the 3 seasons (dry, rain, cold) of theCalakmul region. b) Relative abundance of adults of allfamilies combined for each season.
TABLE 7. SPECIES LIST THAT CONTRIBUTED TO DISTIN-GUISH THE COMMUNITY OF BUTTERFLY FOREACH SEASON IN THE CALAKMUL AREA.
PieridaeKricogonia lyside (Godart, 1819)Glutophrissa drusilla tenuis (Lamas, 1981)
NymphalidaeHeliconius erato petiveranus Doubleday, 1847Historis odius dious Lamas, 1995Historis acheronta acheronta (Fabricius, 1775)Colobura dirce dirce (Linnaeus, 1758)*Myscelia cyaniris cyaniris Doubleday, [1848]Myscelia ethusa ethusa (Doyère, [1840])Eunica tatila tatila (Herrich-Schäffer, [1855])Hamadryas februa ferentina (Godart, [1824])Hamadryas guatemalena guatemalena (H.W. Bates, 1864)Hamadryas julitta (Fruhstorfer, 1914)Temenis laothoe hondurensis Fruhstorfer, 1907Nica flavilla bachiana (R.G. Maza y J. Maza, 1985)**Marpesia chiron marius (Cramer, 1779)Archaeoprepona demophon centralis (Fruhstorfer, 1905)Archaeoprepona demophoon gulina (Fruhstorfer, 1904)Prepona laertes octavia Fruhstorfer, 1905*Siderone galanthis ssp. nov. Anaea troglodyta aidea (Guérin-Ménéville, [1844])Consul electra electra (Westwood, 1850)Fountainea eurypyle confusa (A. Hall, 1929)Memphis forreri (Godman & Salvin, 1884)Memphis phila boisduvali W.P. Comstock, 1961Memphis pithyusa (R. Felder, 1869)Morpho achilles montezuma Guenée, 1859Opsiphanes invirae fabricii (Boisduval, 1870)Cepheuptychia glaucina (H.W. Bates, 1864)Cissia pseudoconfusa Singer, DeVries & Ehrlich, 1983Pareuptychia binocula metaleuca (Boisduval, 1870)Pareuptychia ocirrhoe ssp. nov.Taygetis virgilia (Cramer, 1776)
HesperiidaePolygonus manueli manueli Bell & W. P. Comstock, 1948
*Species that contributed to form groups.**Species that contributed to separate the groups.

420 Florida Entomologist 91(3) September 2008
yet this is the first time this pattern has beenquantified with data from various regions.
Family Level Phenology
Papilionidae is composed of few species, mostof which are large-bodied, often with small popu-lation sizes. Longer survivorship due to theirlarge adult size may allow this family to maintainrelatively constant levels of species richnessthroughout the year. Larger butterflies are goodat maintaining their water balance (Janzen &Schoener 1968), the greatest problem confrontedby insects during the dry season. The effect of hu-midity is important with respect to insect bodysize, and those organisms with small bodies des-iccate more easily than those with medium tolarge bodies (Young 1982). In addition, the rela-tively consistent diversity of Papilionidae acrossthe seasons could be related to phenological pat-terns of larval foodplants or the availability of
adult nectar or mineral resources. For specieswith long reproductive lives (e.g., Heliconiinae),availability of nectar resources may be especiallyimportant in determining phenological patterns(Gilbert & Singer 1975).
In contrast, the Lycaenidae and Riodinidae arecharacterized mostly by small-sized species,many of which center their reproductive activities(and therefore adult voltinism) around the flower-ing periods of larval foodplants (New 1993); in theCR this is most often from Mar to Oct. Only 2 me-dium-sized lycaenids (Eumaeus toxea (Godart,1824) and Juditha molpe molpe (Hübner, 1808))are found throughout the year in the CR. The re-maining species of Lycaenidae and Riodinidae areseasonal, and appear only during favorable condi-tions for reproduction.
Phenology of the Most Abundant Species with Respect to Size
In the CR, we found that small and mediumsized species show monthly fluctuations in spe-cies richness, contrasting with the patterns seenin Manantlán (Vargas-Fernández et al. 1999).These fluctuations are not greatly pronounced,but taken together they can help explain seasonalvariation. Small and medium-sized species showthe greatest species turnover across seasons, andmany of them are univoltine. As also found byYoung (1982), small-sized organisms tend to havetheir largest populations during the most humidseason of the year.
Seasonality
This study shows that in the tropical CR, sea-sonal variation in the abundance and diversity ofthe butterfly fauna is small. However, through acareful analysis, seasonal differences in the faunacan be identified and compared to those of otherregions. We found that in the CR, variations inphenological patterns are largely due to “rare”species represented by fewer than 10 records,whereas the seasonality of the butterfly commu-nity is described by the most abundant species,which define the faunas of the rainy, dry and coldseasons. Of the 33 most abundant species in theCR, the 11 most common are represented by 1000to 10,000 records, while the remaining 22 speciesare represented by 100 to 1000 records per taxon.Of these, 15 species are present year-round.
Faunal studies on Lepidoptera of tropical re-gions based on systematic sampling methods con-ducted during all months of the year are scarce.Likewise, few studies have investigated seasonal-ity in tropical lepidopteran faunas. The informa-tion presented herein explains phenological andseasonal patterns of butterfly abundance and di-versity, and should be useful in future studies onthe phenology of this immensely diverse group.
Fig. 8. Phenological patterns of the butterfly fauna of3 regions in Mexico. RBC = Calakmul Region, Yucatan;Manantlán = Sierra de Manantlán, Jalisco-Colima;Atoyac de Álvarez = Sierra de Atoyac de Álvarez, Guer-rero. a) Phenological patterns of the 3 regions consider-ing all species; b) phenological patterns excluding rarespecies; c) phenological patterns with a 1-month (for-ward) displacement for the Sierra de Atoyac de Álvarez.

Pozo et al.: Phenology of Calakmul Butterflies 421
ACKNOWLEDGMENTS
We thank J. A. Padilla-Saldívar for the elaboration ofFig. 1, and B. Prado-Cuellar for editing the manuscript.We also thank El Colegio de la Frontera Sur (ECOSUR)for support provided during the various stages of thisstudy. In addition, we thank 2 anonymous reviewers forvaluable suggestions that improved the manuscript.Mexico’s “Comision Nacional para el Uso y Conserva-cion de la Biodiversidad” (CONABIO) provided finan-cial resources through projects J112 and Q049. Thesupport of projects DGAPA IN 218502, DGAPA-UNAM,PAPIME EN 202504 and CONACyT 36488 also wasvery important.
REFERENCES CITED
AUSTIN, G. T., N. M. HADDAD, C. MÉNDEZ, T. D. SISK, D.D. MURPHY, A. E. LAUNER, AND P. R. EHRLICH. 1996.Annotated checklist of the butterflies of the Tikal Na-tional Park Area of Guatemala. Trop. Lep. 7: 21-37.
BRAKEFIELD, P. M., AND T. G. SHREEVE. 1992. Diversitywithin populations, pp. 178-196 In R. L. H. Dennis[ed.], The Ecology of Butterflies in Britain. OxfordUniversity Press, Oxford.
CARR, M. R. 1996. PRIMER, Plymouth Routines in Mul-tivariate Ecological Research (user manual). Ply-mouth Marine Laboratory, UK.
DE LA MAZA, J., AND R. G. DE LA MAZA. 1985a. La faunade mariposas de Boca de Chajul, Chiapas, México(Rhopalocera). Parte I. Rev. Soc. Mex. Lep. 9: 23-44.
DE LA MAZA, J., AND R. G. DE LA MAZA. 1985b. La faunade mariposas de Boca de Chajul, Chiapas, México(Rhopalocera). Parte II. Rev. Soc. Mex. Lep. 10: 1-24.
GALINDO-LEAL, C. 2001. Calakmul: Seeing the forestthrough the trees. Wildflower 17: 28-31.
GARCÍA-GIL, G., M. I. MARCH, AND M. A. CASTILLO-SAN-TIAGO. 2001. Transformación de la vegetación porcambio de uso del suelo en la Reserva de la BiosferaCalakmul, Campeche. Investigaciones Geográficas,Bol. Inst. Geogr. UNAM: 45-57.
GILBERT, L. E., AND M. C. SINGER. 1975. Butterfly ecol-ogy. Annu Rev. Ecol. Syst. 6: 365-397.
GULLAN, P. J., AND P. S. CRANSTON. 2000. The Insects:An Outline of Entomology, Second Edition. Black-well Science, Ltd., Oxford.
GUTIÉRREZ, D., AND R. MENÉNDEZ. 1998. Phenology ofbutterflies along an altitudinal gradient in northernSpain. J. Zool. (Lond.) 244: 249-264.
HERRANDO-PERÉZ, S. 2002. Manual de EcologíaMatemática. PCA, CLUSTER, MDS. TorbellinoPress, Onda.
HUGHES, J. B., G. C. DAILY, AND P. R. EHRLICH. 1998.Use of fruit bait traps for monitoring of butterflies(Lepidoptera: Nymphalidae). Rev. Biol. Trop. 46:697-704.
INEGI (INSTITUTO NACIONAL DE GEOGRAFIA Y ESTADIS-TICA). 1996. Anuario Estadistico del Estado deCampeche. INEGI, Gobierno del Estado deCampeche, Aguascalientes, Aguascalientes.
JANSEN, D. H., AND T. W. SCHOENER. 1968. Differencesin insect abundance and diversity between wetterand drier sites during a tropical dry season. Ecol. 49:96-110.
LAMAS, G., R. K. ROBBINS, AND D. J. HARVEY. 1991. Apreliminary survey of the butterfly fauna of Pakitza,Parque Nacional del Manú, Perú, with an estimate
of its species richness. Publicaciones del Museo deHistoria Natural, Universidad Nacional Mayor deSan Marcos 40: 1-19.
LEGENDRE, P., AND L. LEGENDRE. 1998. NumericalEcology. English 2nd ed., Elsevier, Amsterdam.
LLORENTE-BOUSQUETS, J., A. LUIS-MARTÍNEZ, AND I.VARGAS-FERNÁNDEZ. 2006. Apéndice general dePapilionoidea: Lista sistemática, distribución estataly provincias biogeográficas, pp. 945-1009 In J. J. Mor-rone and J. Llorente-Bousquets [eds.], ComponentesBióticosprincipales de la Entomofauna Mexicana, Lasprensas de Ciencias, UNAM, México, DF. 1025 pp.
LUIS-MARTÍNEZ, M. A., AND J. LLORENTE-BOUSQUETS.1990. Mariposas en el Valle de México: Introduccióne historia I. Distribución local y estacional de losPapilionoidea de la Cañada de los Dínamos,Magdalena Contreras, D. F. México. Folia Entomol.Mex. 78: 95-198.
MARTÍNEZ, E., AND C. GALINDO-LEAL. 2002. La veget-ación de Calakmul, Campeche, México: Clasifi-cación, descripción y distribución. Bol. Soc. Bot. Mex.71: 7-32.
NEW, T. R. 1993. Conservation Biology of Lycaenidae(Butterflies). Occasional Papers of the IUCN SpeciesSurvival Commission 8: 1-173.
OWEN, D. F. 1971. Tropical Butterflies. Oxford Univer-sity Press, London.
OWEN, D. F., J. OWEN, AND D. O. CHANTER. 1972. Sea-sonal changes in relative abundance and estimatesof species diversity in a family of tropical butterflies.Oikos 23: 200-205.
POZO, C., J. LLORENTE-BOUSQUETS, A. LUIS-MARTÍNEZ,I. VARGAS-FERNÁNDEZ, AND N. SALAS. 2005. Reflex-iones acerca de los métodos de muestreo para mari-posas en las comparaciones biogeográficas, pp. 203-215 In J. Llorente-Bousquets and J. J. Morrone[eds.], Regionalización Biogeográfica en Iberoaméri-ca y Tópicos Afines: Primeras Jornadas Biogeográfi-cas de la Red Iberoaméricana de Biogeografía y En-tomología Sistemática (RIBES XII.I-CYTED).UNAM, México. 577 pp.
RYDON, A. 1964. Notes on the use of butterfly traps inEast Africa. J. Lep. Soc. 18: 51-58.
SHAPIRO, A. M. 1975. The temporal component of but-terflies species diversity, pp. 181-195 In M. L. CodyAND J. M. Diamond [eds.], Ecology and Evolution ofCommunities. The Belknap Press of Harvard Uni-versity, London. 545 pp.
SHAPIRO, A. M., R. VANBUSKIRK, G. KAREOFELAS, AND W.D. PATTERSON. 2004. Phenofaunistics: seasonality asa property of butterfly faunas, pp. 111-147 In C. L.Boggs, W. B. Watt, and P. R. Ehrlich [eds.], Butter-flies. Ecology and Evolution Taking Flight. The Uni-versity of Chicago Press, Chicago and London. 739 pp.
SCOTT, J. A. 1986. The Butterflies of North America. ANatural History and Field Guide. Stanford Universi-ty Press, Stanford, CA.
TANAKA, L. K., AND S. K. TANAKA. 1982. Rainfall andseasonal changes in arthropod abundance on a trop-ical oceanic island. Biotropica 14: 114-123.
VARGAS-FERNÁNDEZ, I., J. LLORENTE-BOUSQUETS, ANDA. LUIS-MARTÍNEZ. 1992. Listado lepidopterofaunís-tico de la Sierra de Atoyac de Álvarez en el estado deGuerrero: Notas acerca de su distribución local y es-tacional (Rhopalocera: Papilionoidea). Folia Ento-mol. Mex. 86: 41-178.
VARGAS-FERNÁNDEZ, I., J. LLORENTE-BOUSQUETS, ANDA. LUIS-MARTÍNEZ. 1999. Distribución de los Papil-

422 Florida Entomologist 91(3) September 2008
ionoidea (Lepidoptera: Rhopalocera) de la Sierra deManantlán (250-1650 m) en los estados de Jalisco yColima. Publ. Espec. Mus. Zool. UNAM 11: 1-153.
WARREN, A. D. 2000. Hesperioidea (Lepidoptera), pp.535-580 In J. E. Llorente-Bousquets, E. GonzálezSoriano, and N. Papavero [eds.], Biodiversidad, Tax-onomía y Biogeografía de Artrópodos de México: Ha-cia una Síntesis de su Conocimiento. Volumen II.Universidad Nacional Autónoma de México, MexicoCity. xvi + 676 pp.
WARREN, M. S. 1992. Butterfly populations, pp. 73-92 InR. L. H. Dennis [ed.], The Ecology of Butterflies inBritain. Oxford University Press, Oxford. 368 pp.
WILLIAMS-LINERA, G., AND J. MEAVE. 2002. Patronesfenológicos, pp. 407-431 In M. R. Guariguata and G.
H. Kattan [eds.], Ecología y Conservación deBosques Neotropicales. Editorial Libro Universitar-io Regional, Cartago, Costa Rica. 691 pp.
WOLDA, H. 1987. Altitude, habitat and tropical insectdiversity. Biol. J. Linn. Soc. 30: 313-323.
WOLDA, H. 1988a. Insect seasonality: Why? Annu. Rev.Ecol. Syst. 19: 1-18.
WOLDA, H. 1988b. Seasonality and the community. pp.69-75 In J. H. R. Gee and P. S. Giller [eds.], Organi-zation of Comunities, Past and Present. British Eco-logical Society, Oxford. 588 pp.
YOUNG, A. M. 1982. Errata: over-exploitation of larvalhost plants by Heliconius butterflies. J. New YorkEntomol. Soc. 90: 117-118.