Embed Size (px)
Citation preview
Seattle, Washington July6-10 Session 148
2006 Joint Statistical Meetings 1
Pedagogical Utilization and Assessment of the Statistics Online
Computational Resource in Introductory Probability and Statistics Courses
Juana Sanchez (1), Ivo Dinov(1,2) and Nicolas Christou(1)
(1)UCLA Department of Statistics and (2) Center for Computational Biology
http://www.SOCR.ucla.edu http://www.StatisticsResource.org

Seattle, Washington July6-10 Session 148
2006 Joint Statistical Meetings 2
Outline1. What is SOCR (Statistics Online
Computational Resource)?
2. Quasi-experiment: Effects of SOCR on student learning, satisfaction and use of technology.
3. Conclusions

Seattle, Washington July6-10 Session 148
2006 Joint Statistical Meetings 3
1. What is SOCR?
• Ongoing, NSF-funded project created and managed by Ivo Dinov (DUE 0442992).
• Set of portable online aids for high school, and College Statistics education and research (multilingual)
• Tools for educators and researchers.

Seattle, Washington July6-10 Session 148
2006 Joint Statistical Meetings 4
1.1. SOCR Resources
(a) Distributions
(b) Simulation Experiments
(c) Learning Assessment tools
(d) Interactive Analyses
(e) Games, (f). Modeler, (g). Charts, (h). More
SOCR is at http://www.socr.ucla.edu

Seattle, Washington July6-10 Session 148
2006 Joint Statistical Meetings 5
(a) Distributions ………

Seattle, Washington July6-10 Session 148
2006 Joint Statistical Meetings 6
…help compute probabilities, e.g.P(1<x<5)..

Seattle, Washington July6-10 Session 148
2006 Joint Statistical Meetings 7
…but also help to see changes in shape,mean and sd when parameters change

Seattle, Washington July6-10 Session 148
2006 Joint Statistical Meetings 8
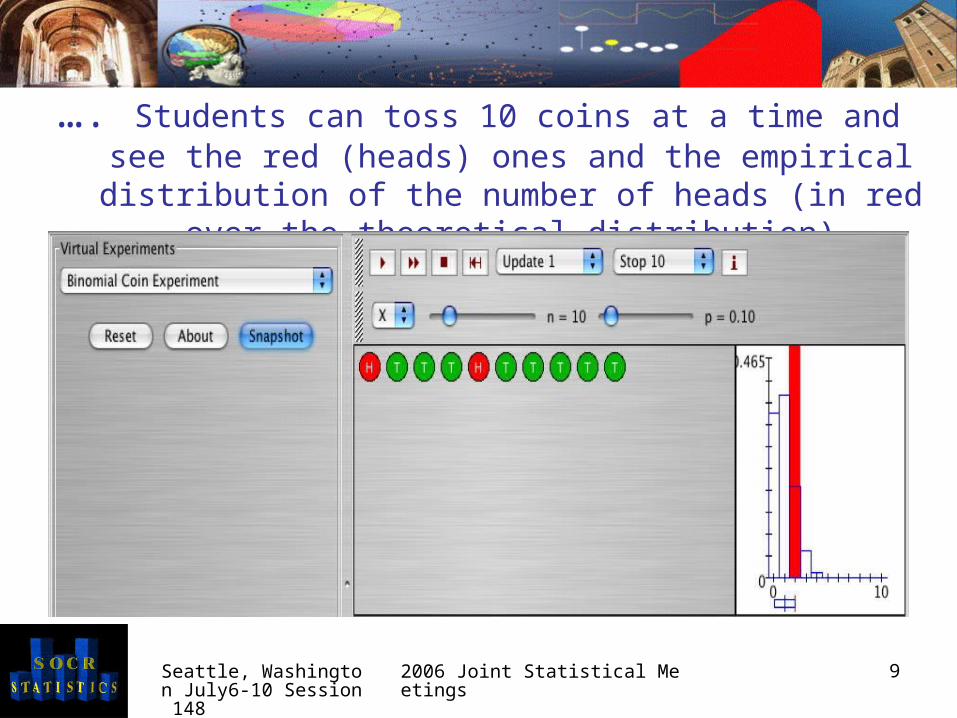
(b) Simulation Experiments, e.g. binomial coin experiment, show theoretical distribution (e.g. for
X=number of heads in n=10 tosses, p=0.1)
Seattle, Washington July6-10 Session 148
2006 Joint Statistical Meetings 9
…. Students can toss 10 coins at a time and see the red (heads) ones and the empirical distribution of the number
of heads (in red over the theoretical distribution)
Seattle, Washington July6-10 Session 148
2006 Joint Statistical Meetings 10
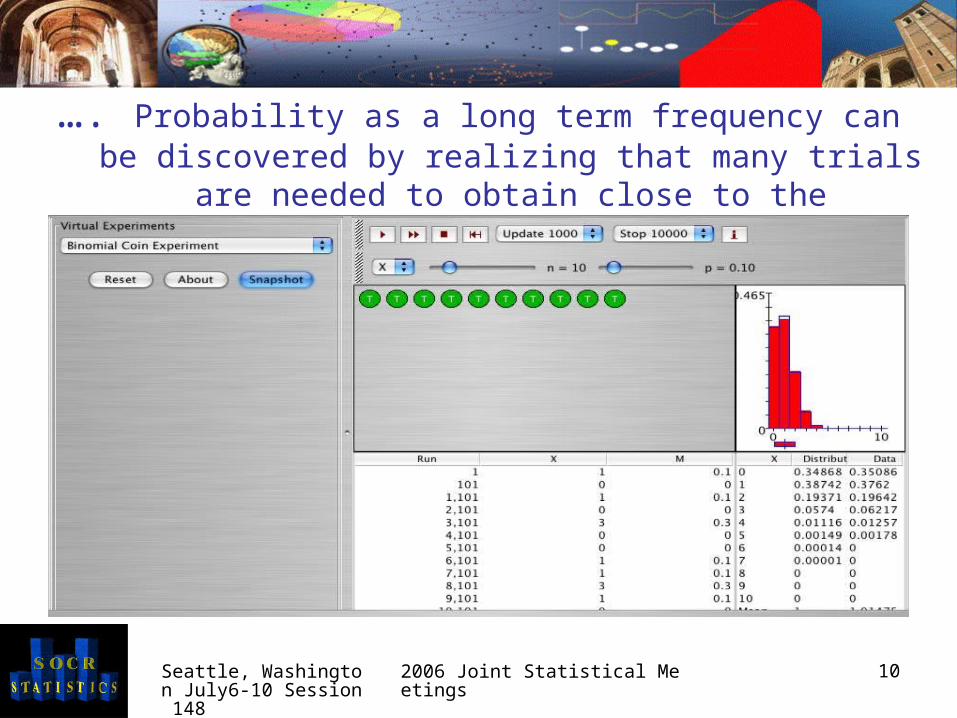
…. Probability as a long term frequency can be discovered by realizing that many trials are needed to obtain close to the
theoretical distribution.
Seattle, Washington July6-10 Session 148
2006 Joint Statistical Meetings 11
(c ) Learning Assessment Tools
After teaching Students the applets via lectures, TA sessions and detailed handouts, they can do homework and exam questions with them . For example,
What is the probability that in a room with 5 people at least two people share the same birth month? Show work.
Seattle, Washington July6-10 Session 148
2006 Joint Statistical Meetings 12
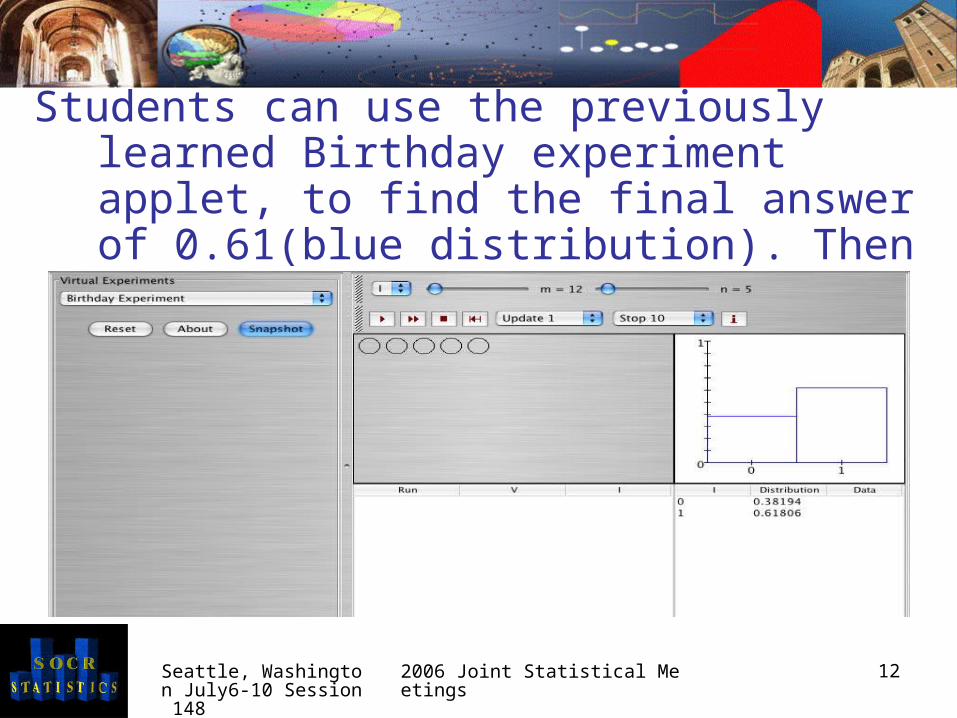
Students can use the previously learned Birthday experiment applet, to find the final answer of 0.61(blue distribution). Then they need to show computations.
Seattle, Washington July6-10 Session 148
2006 Joint Statistical Meetings 13
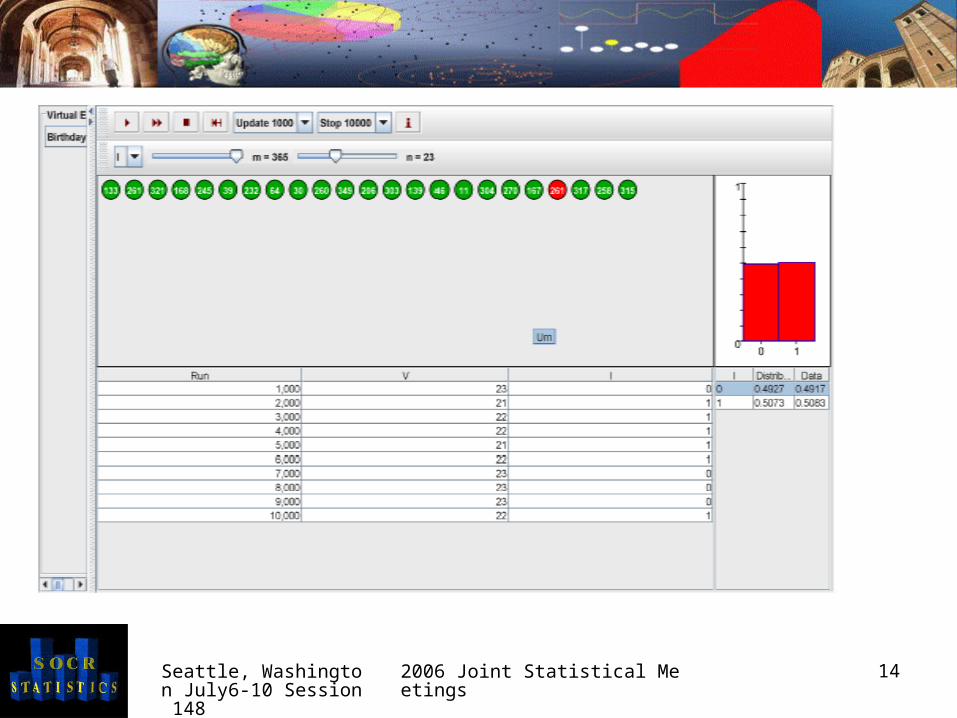
Better assessment of understanding is….
Determine empirically how large should the group of people observed be for the probabilities of at
least two sharing the same birthdays and the probability of nobody sharing same birthday to
be 50%-50%.
The answer for this question is not so straightforward
Seattle, Washington July6-10 Session 148
2006 Joint Statistical Meetings 14
Seattle, Washington July6-10 Session 148
2006 Joint Statistical Meetings 15
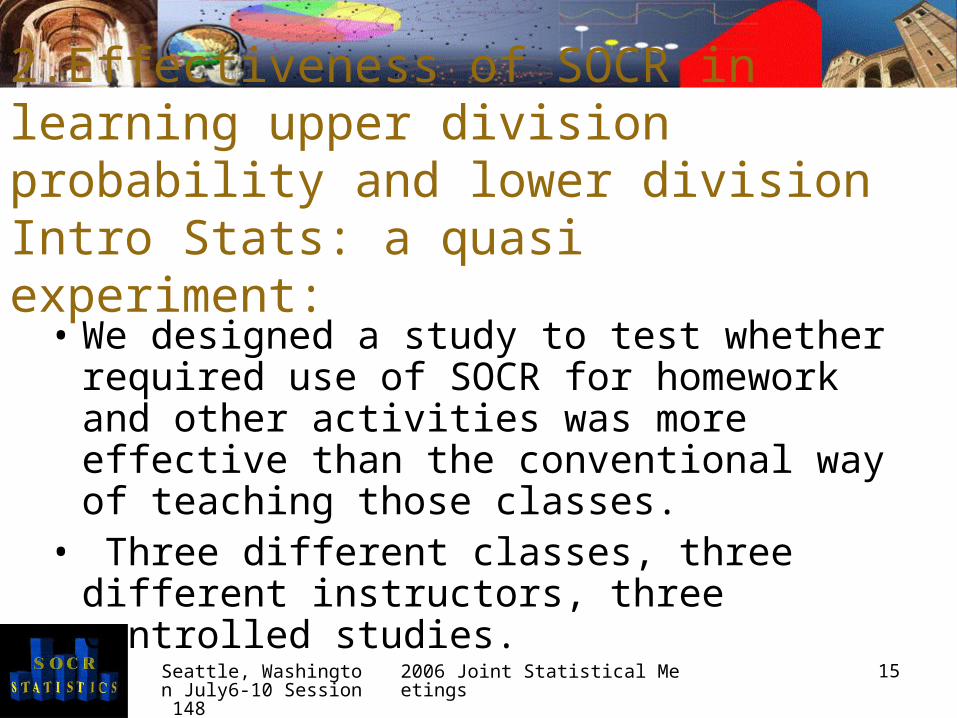
2.Effectiveness of SOCR in learning upper division probability and lower division Intro Stats: a quasi experiment:
• We designed a study to test whether required use of SOCR for homework and other activities was more effective than the conventional way of teaching those classes.
• Three different classes, three different instructors, three controlled studies.

Seattle, Washington July6-10 Session 148
2006 Joint Statistical Meetings 16
• Fall 2005. Two Introduction to Probability Classes (Sanchez), Two Intro Stats for Life and Health Sciences (Dinov), and One intro probability with separate honors session (Christou).
• One class (treatment group) subject to required SOCR in homework. The other class (control group) not exposed to required SOCR.
Seattle, Washington July6-10 Session 148
2006 Joint Statistical Meetings 17
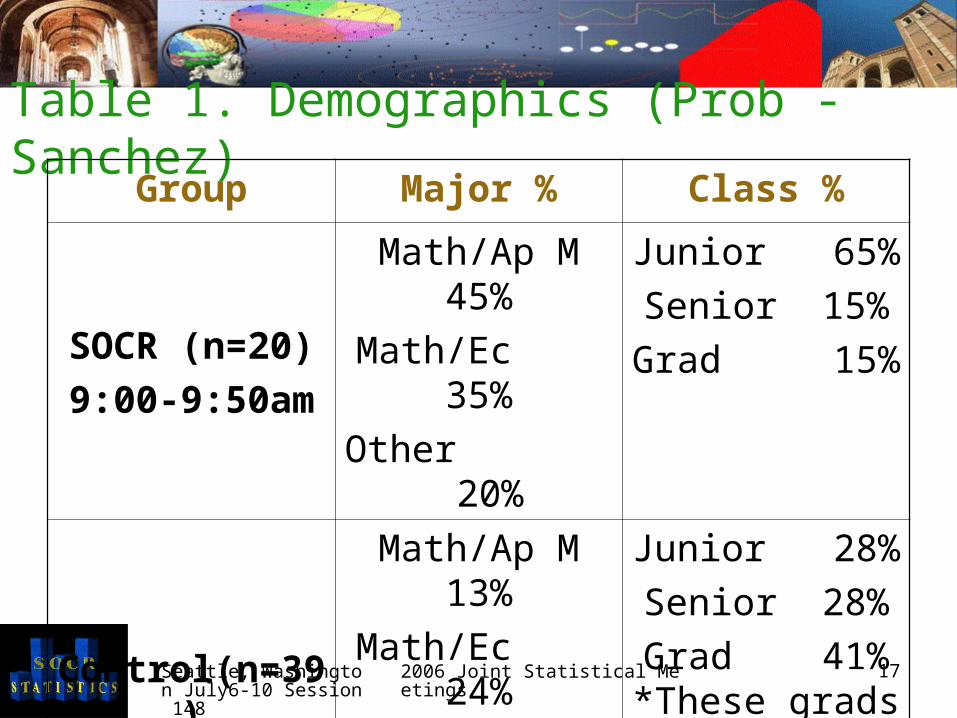
Table 1. Demographics (Prob -Sanchez)Group Major % Class %
SOCR (n=20)
9:00-9:50am
Math/Ap M 45%
Math/Ec 35%
Other 20%
Junior 65%
Senior 15%
Grad 15%
Control(n=39)
11-11:50am
Math/Ap M 13%
Math/Ec 24%
Biostat 33%
Eng,other 30%
Junior 28%
Senior 28%
Grad 41% *These grads
biostats mostly

Seattle, Washington July6-10 Session 148
2006 Joint Statistical Meetings 18
Table 2. Demographics (Intro Stats-Dinov)Control SOCR group
Freshmen 24 7
Sophomores 18 14
Juniors 16 14
Seniors 23 29
Graduates 2 0
Total 83 88

Seattle, Washington July6-10 Session 148
2006 Joint Statistical Meetings 19
Table 3. Demographics (Prob-Christou)Majors Control (class) SOCR(subset)
Mathematics 25 8
Statistics 2 1
BioStatistics 3 0
BioChem 2 0
Psycho-Bio 0 1
Sociology 0 1
Business/econ 1 0
Total 35 11
Seattle, Washington July6-10 Session 148
2006 Joint Statistical Meetings 20
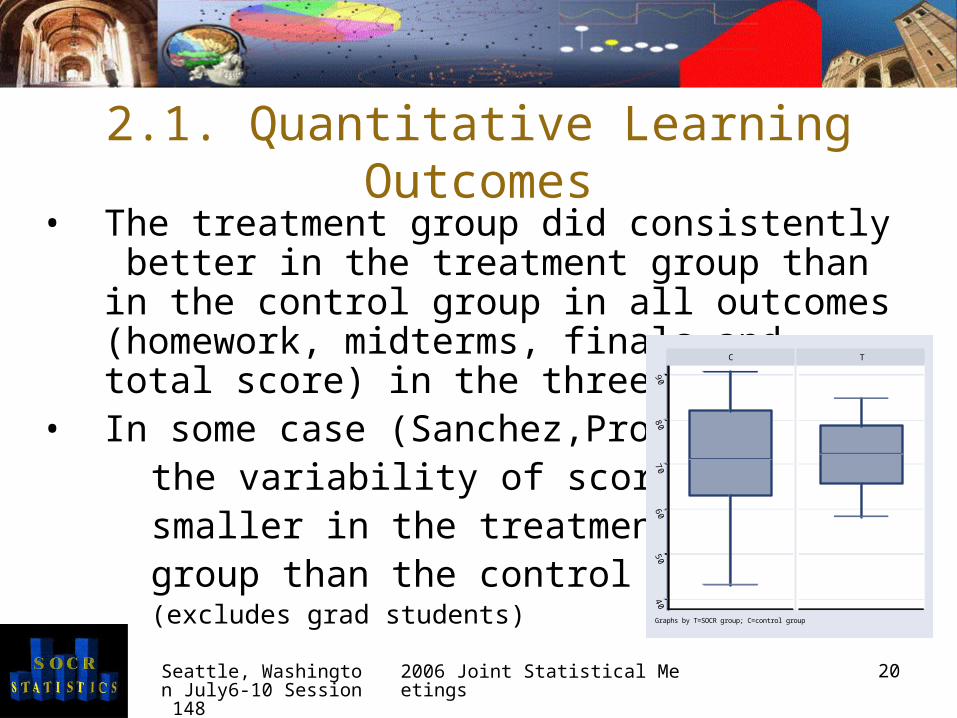
2.1. Quantitative Learning Outcomes• The treatment group did consistently better in
the treatment group than in the control group in all outcomes (homework, midterms, finals and total score) in the three classes.
• In some case (Sanchez,Prob) the variability of scores is smaller in the treatment group than the control group (excludes grad students)
C T
Graphs by T=SOCR group; C=control group

Seattle, Washington July6-10 Session 148
2006 Joint Statistical Meetings 21
Table 4. Learning Outcomes (Prob-Sanchez)

Seattle, Washington July6-10 Session 148
2006 Joint Statistical Meetings 22
Table 5. Learning Outcomes (Intro Stats-Dinov)
Seattle, Washington July6-10 Session 148
2006 Joint Statistical Meetings 23
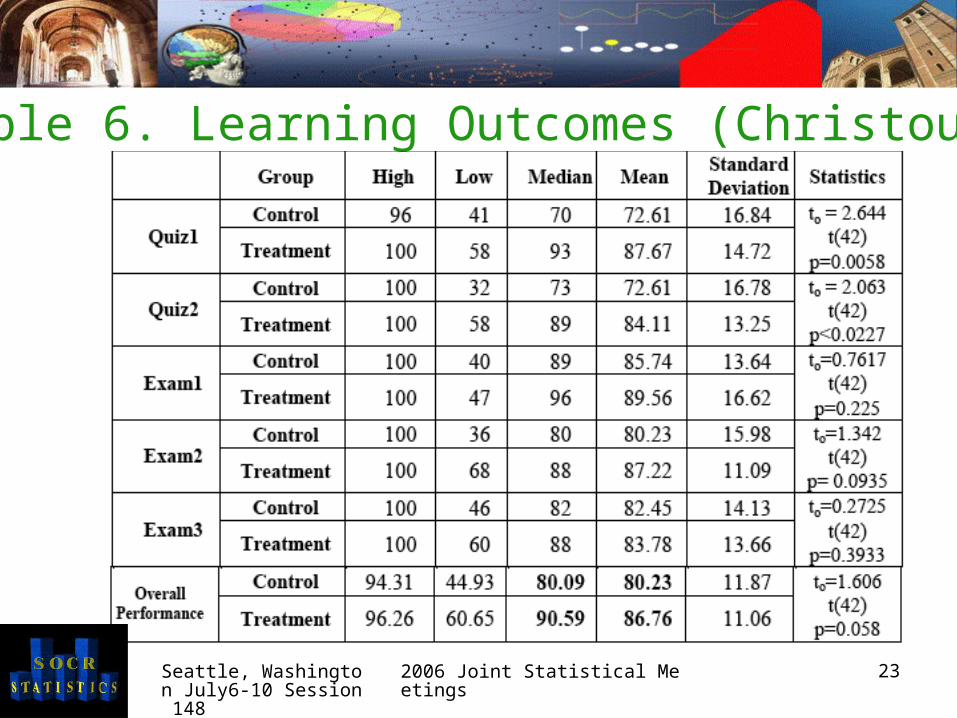
Table 6. Learning Outcomes (Christou)

Seattle, Washington July6-10 Session 148
2006 Joint Statistical Meetings 24
Pooled Learning Outcomes – all 3 courses• Treatment effects within each class are marginally significant.• Pooling the results from all 3 studies, however, yields strong evidence suggesting the SOCR-based instruction did potentiate learning. None of the examinations in any class had the control
groups scoring ≥ treatment groups. • Using the sign test and assuming independence of the examinations and the sections we obtain a p-value<0.00098, x0=10, X~B(n=10, p=0.5) – evidence that SOCR utilization
impacts students’ learning and their attitude towards technology-based instruction.
Seattle, Washington July6-10 Session 148
2006 Joint Statistical Meetings 25
2.2. “Use of Technology” outcome (Sanchez)
• Final exam conducted in computer lab with centrally monitored terminals
• Treatment group could use SOCR or R; Control group could use SOCR or R
• Use of technology to answer questions:
95% in the SOCR group (65% SOCR)
65% in the control group (mostly R)
Seattle, Washington July6-10 Session 148
2006 Joint Statistical Meetings 26
2.3. Satisfaction Outcome
End of quarter questionnaire:
(a) SOCR made the class more effective than in other classes not using technology (79% vs. 67% of Sanchez’s)
(b) Almost all students believed that SOCR helped them understand the material better (Dinov, Christou).
(c) Almost all students recommended using SOCR in other Statistics Classes (Christou)

Seattle, Washington July6-10 Session 148
2006 Joint Statistical Meetings 27
3. Conclusions… In the treatment group:
(a) Students were more at ease using technology when assessing their learning
(b) Students were more homogeneous in the performance.
(c ) Students were, overall, more satisfied.
(d) Consistent (statistically significant) improvement throughout the quarter

Seattle, Washington July6-10 Session 148
2006 Joint Statistical Meetings 28
References• More information on this material can be
found in the forthcoming publication
Dinov, I. Sanchez, J. and Christou, N. (2006) Pedagogical Utilization and Assessment of the Statistic Online Computational Resource in Introductory Probability and Statistics Courses, to appear. Journal of Computers and Education. Elsevier Publishershttp://www.elsevier.com/locate/compedu
Seattle, Washington July6-10 Session 148
2006 Joint Statistical Meetings 29
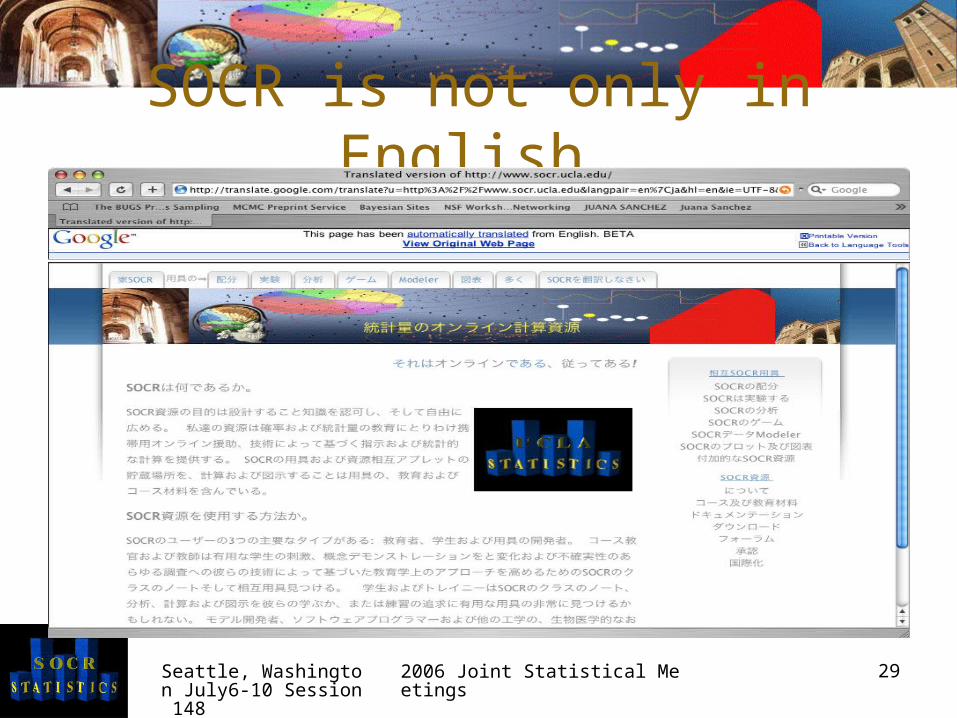
SOCR is not only in English…

Seattle, Washington July6-10 Session 148
2006 Joint Statistical Meetings 30
http://socr.stat.ucla.edu/htmls/SOCR_Languages.html
![What is pedagogical linguistics? - dickhudson.com€¦ · Web view[For Pedagogical Linguistics, vol 1] Towards a pedagogical linguistics. Richard Hudson. Abstract. Pedagogical linguistics](https://img.pdfslide.net/doc/110x75/5e21169c6214331e050a7d69/what-is-pedagogical-linguistics-web-viewfor-pedagogical-linguistics-vol-1.jpg)