Embed Size (px)
Citation preview

1
Second Quarter 2021 Investor Review
August 4, 2021

2
Forward Looking Statements and GAAP Disclaimer
These slides contain (and the accompanying oral discussion will contain) forward-looking statements, which are generally identifiable by use of the words "believes," "expects," "intends,"
"anticipates," "plans to," "seeks," "should," "estimates," "projects," "may," "likely" or similar expressions. Such statements may include, but are not limited to, statements about future financial and
operating results, the Company's plans, objectives, expectations and intentions and other statements that are not historical facts. Forward-looking statements are neither historical facts nor
assurances of future performance. Such statements are based upon the beliefs and expectations of Clean Harbors' management as of this date only and are subject to certain risks and
uncertainties that could cause actual results to differ materially, including, without limitation, the risks and uncertainties surrounding the proposed Clean Harbors and HydroChemPSC ("HPC")
transaction, and those items identified as "Risk Factors,” disclosed in our periodic filings with the Securities and Exchange Commission, including our Annual Report on Form 10-K filed on
February 24, 2021. Therefore, readers are cautioned not to place undue reliance on these forward-looking statements, which reflect management’s opinions only as of the date hereof. Our actual
results and financial condition may differ materially from those indicated in the forward-looking statements. Clean Harbors undertakes no obligation to revise or publicly release the results of any
revision to these forward-looking statements other than through its filings with the SEC, which may be viewed in the "Investors" section of the Clean Harbors website.
Statement Regarding use of Non-GAAP Measures:
Adjusted EBITDA, adjusted free cash flow, adjusted net income and adjusted earnings per share, as presented in these slides, are non-GAAP financial measures and should not be considered
alternatives to other measurements under generally accepted accounting principles (GAAP), but viewed only as a supplement to those measurements. These non-GAAP measures are not
calculated identically by all companies. Therefore, our measurements of Adjusted EBITDA, adjusted free cash flow, adjusted net income (loss) and adjusted earnings (loss) per share are clearly
defined and may not be comparable to similarly titled measures reported by other companies. We believe that Adjusted EBITDA provides additional useful information to investors since our loan
covenants are based upon levels of Adjusted EBITDA achieved and the fact that management routinely evaluates the performance of its businesses based upon levels of Adjusted EBITDA. We
believe adjusted free cash flow provides useful information to investors about our ability to generate cash. We believe adjusted net income (loss) and adjusted earnings (loss) per share provide
useful information about our performance excluding non-recurring or extraordinary items.
Adjusted EBITDA consists of net income (loss) plus accretion of environmental liabilities, stock-based compensation, depreciation and amortization, net interest expense, loss on early
extinguishment of debt, provision for income taxes and excludes other gains, losses and non-cash charges not deemed representative of fundamental segment results and other (income)
expense, net. Adjusted free cash flow consists of net cash from operating activities excluding cash impacts of items derived from non-operating activities, such as taxes paid in connection with
divestitures, less additions to property, plant and equipment plus proceeds from sale of fixed assets. All amounts in USD unless otherwise noted.
For a reconciliation of Adjusted EBITDA and adjusted net income to net income, a reconciliation of adjusted earnings per share to net income per share and a reconciliation of net cash from
operating activities to adjusted free cash flow, please refer to the appendix of this presentation.

3
Summary of Q2 Results
* For a reconciliation of non-GAAP measures to its nearest GAAP equivalent, please refer to the appendix in this presentation.
▪ Revenue of $926.5M, a 30% increase YoY; up 15% sequentially from Q1
▪ Net income of $67.1 million or EPS of $1.22 and Adjusted EPS of $1.19
▪ Adjusted EBITDA* increased 36% to $187.8M, including $5.2M from government pandemic
relief programs; Adjusted EBITDA margin climbed 80 bps to 20.3%
▪ Adjusted free cash flow was $114.6 million compared with $98.1 million in Q2’20
▪ Environmental Services segment benefited from continued high-value waste streams and
service business recovery, supported by productivity gains and cost measures
▪ Safety-Kleen Sustainability Solutions segment grew revenue and profitability substantially
due to wider re-refining spread driven by market conditions and YoY increases in volume
▪ Corporate segment increased YoY due to higher incentive comp, insurance and other areas
such as professional fees and investments in information technology and cybersecurity
4
$176.2 $176.0
28.8%
24.3%
12.0%
17.0%
22.0%
27.0%
32.0%
37.0%
42.0%
$0.0
$20.0
$40.0
$60.0
$80.0
$100.0
$120.0
$140.0
$160.0
$180.0
Q2 2020 Q2 2021
Adjusted EBITDA Margin
$612.6
$724.1
Q2 2020 Q2 2021
Revenue(in millions)
Adjusted
EBITDA*(in millions)
* For a reconciliation of Adjusted EBITDA to net income, please refer to the appendix in this presentation.
+ 18%
0%
Q2 Performance
▪ Revenue up YoY primarily due to growth in disposal volumes and
strong Industrial Services activity. Favorable comparison to Q2’20
when pandemic lockdowns impacted overall economy
▪ Adjusted EBITDA was flat based on high level of government
assistance and COVID decontamination work a year ago, partly
offset by higher revenue, pricing, cost savings and mix of waste
▪ Incinerator utilization was 87% vs. 87% a year ago and 80% in Q1,
reflecting strong waste volumes, particularly high-value streams.
Average price up 5% from Q2’20
▪ Landfill tonnage up 13% YoY as project volumes began to recover,
while average price per ton up 10%
▪ $11M from decontamination response work vs. $50M a year ago;
completed more than 18,000 responses since inception
▪ Performed 240K parts washer services up from 215K a year ago,
and 235K in Q1; most SK core offerings trending up sequentially
Environmental Services

5
$97.4
$202.3
Q2 2020 Q2 2021
+ 108%
Q2 Performance
▪ Revenue increased YoY due substantially higher pricing, more
volumes and normal production levels vs prior year where we
experienced pandemic-related slowdowns and shutdowns;
revenue up 32% from Q1 due to recovery in demand and higher
pricing
▪ Higher Adjusted EBITDA and margin reflect widening of re-
refining spread due to supply-driven increases in base oil
pricing, supported by productivity and cost initiatives
▪ Gathered 57 million gallons of waste oil, compared with 43
million a year ago and 47 million in Q1; average charge-for-oil
down considerably from a year ago as volumes increased, and
base oil prices have doubled
▪ Reflecting the base oil market opportunities, blended products
accounted for 21% of volume compared with 29% a year ago
and 23% in Q1; direct volume was 6% in the quarter, compared
with 10% a year ago and 7% in Q1
$8.4
$63.3
8.7%
31.3%
5.0%
17.0%
29.0%
41.0%
$-
$10.0
$20.0
$30.0
$40.0
$50.0
$60.0
$70.0
Q2 2020 Q2 2021
Adjusted EBITDA Margin
Revenue(in millions)
* For a reconciliation of Adjusted EBITDA to net income, please refer to the appendix in this presentation.
Adjusted
EBITDA*(in millions)
Safety-Kleen Sustainability Solutions
+ 651%

6
▪ Valued at $1.25 billion in all-cash transaction
▪ Plan to fund through combination of existing cash and newly issued debt
▪ HPC forecasting $744M of revenue and $115M of Adjusted EBITDA in 2021
▪ Expect to achieve $40M+ of synergies after first full year of operation
▪ Paying 8.1X on a post-synergized basis
▪ 240+ service locations, 5,000+ employees, 5,600+ vehicles and 1,000+
customers
▪ Anticipating close in 2021
▪ Expect this transaction to drive considerable value to shareholders,
customers and employees
– Transaction Overview

7
– Key Strategic Benefits
▪ Gain significant size, scale and capabilities in IS and FS businesses
▪ Increase focus on higher margin Industrial Services (IS) offerings
▪ Expand Field Services (FS) business with strength in utility vertical
▪ Leverage material synergy and efficiency opportunities across multiple areas
▪ Improve IS safety profile through more automation and technology
▪ Acquire a talented and experienced leadership team
▪ Generate significant cross-selling through waste disposal and ER

8
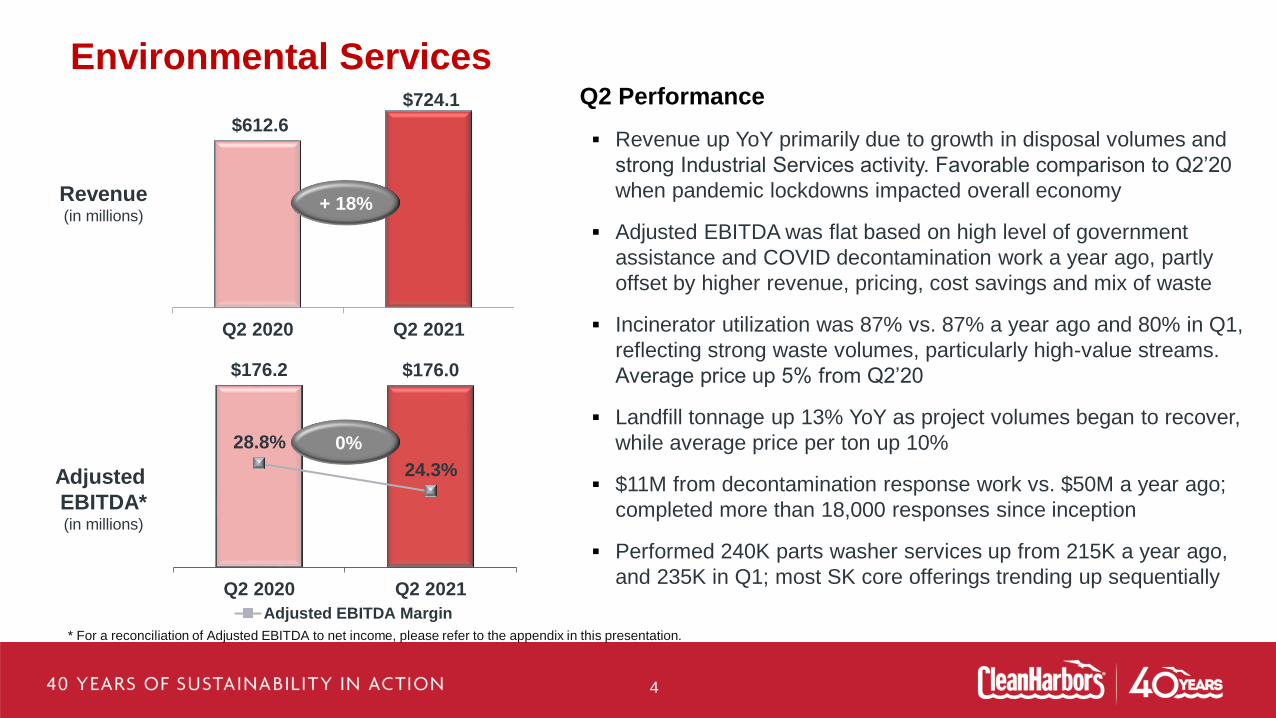
▪ Plan to add 70,000-ton state-of-the-art incinerator to Kimball facility
▪ Kiln modeled after our El Dorado plant and will meet/exceed all state and
federal emissions control standards
▪ Permitting process has begun on $180 million project
▪ Excellent relationship with local community; 100 additional permanent jobs
expected
▪ Target is to have new plant operational in late 2024 and accepting hazardous
waste in the first half of 2025
▪ Market dynamics will support new capacity
Incineration Network Expansion – Kimball, NE
9
Incineration Network Expansion – Kimball, NE

10
▪ Invest capex to drive growth
▪ Evaluate acquisition and divestiture
opportunities
▪ Execute authorized buyback plan
▪ Assess current debt structure
Capital Allocation Strategy – Driven by ROIC
Organic Growth
Investments
Acquisitions
& Divestitures
Share
Repurchases
Debt
Repayment
1 2
43
11
FINANCIAL OVERVIEW

12
Q2 Income Statement(in millions, except percentages and per share data)
* Please refer to the appendix in this presentation for a reconciliation to the nearest GAAP equivalent.
Revenues
Cost of revenues
Gross profit
Gross margin %
Selling, general and administrative expenses
SG&A %
Depreciation and amortization
Income from operations
Adjusted EBITDA*
Adjusted EBITDA* margin %
Net income
Diluted earnings per share
Adjusted earnings per share*
Q2 2020
$710.0
$470.7
$239.3
33.7%
$103.8
14.6%
$72.5
$60.2
$138.3
19.5%
$29.0
$0.52
$0.52
Q2 2021
$926.5
$617.9
$308.6
33.3%
$124.1
13.4%
$71.6
$110.0
$187.8
20.3%
$67.1
$1.22
$1.19

13
3/31/21
$570.7
$213.4
$675.4
$1,556
$205.4
Balance Sheet Highlights
Cash and short-term marketable securities
Accounts payable
Billed and unbilled receivables
Current and long-term debt
Environmental liabilities
(in millions) 6/30/21
$666.3
$249.2
$718.8
$1,555
$205.9
12/31/20
$571.0
$195.9
$667.2
$1,557
$202.7

14
Q2 2021
$162.4
($47.8)
$114.6
$18.9
Cash Flow Highlights
Cash from operations
Capital expenditures, net of disposals
Adjusted free cash flow*
Share repurchases
(in millions)
* Please refer to the appendix in this presentation for a reconciliation to the nearest GAAP equivalent.
Q2 2020
$139.8
($41.7)
$98.1
$0.0

15
Full-Year 2021
Range
Net Income
Adjusted EBITDA*
$159
$620
to $193
to $650
Guidance (as of August 4, 2021)
* Please refer to the appendix in this presentation for a reconciliation of Adjusted EBITDA and Adjusted Free Cash Flow to the nearest GAAP equivalent.
Net Cash from Operating Activities
Adjusted Free Cash Flow*
$475
$285
to $525
to $315
(in millions)
16
APPENDIX
17
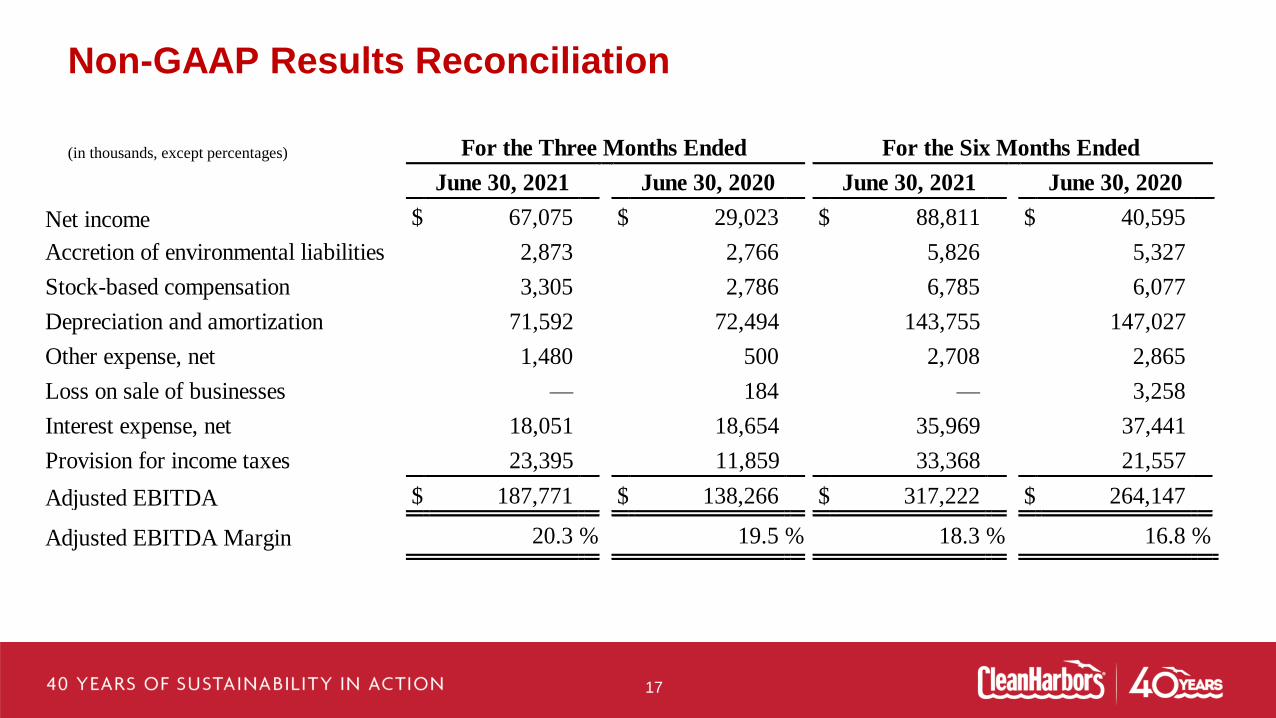
For the Three Months Ended For the Six Months Ended
June 30, 2021 June 30, 2020 June 30, 2021 June 30, 2020
Net income $ 67,075 $ 29,023 $ 88,811 $ 40,595
Accretion of environmental liabilities 2,873 2,766 5,826 5,327
Stock-based compensation 3,305 2,786 6,785 6,077
Depreciation and amortization 71,592 72,494 143,755 147,027
Other expense, net 1,480 500 2,708 2,865
Loss on sale of businesses — 184 — 3,258
Interest expense, net 18,051 18,654 35,969 37,441
Provision for income taxes 23,395 11,859 33,368 21,557
Adjusted EBITDA $ 187,771 $ 138,266 $ 317,222 $ 264,147
Adjusted EBITDA Margin 20.3 % 19.5 % 18.3 % 16.8 %
Non-GAAP Results Reconciliation
(in thousands, except percentages)
18
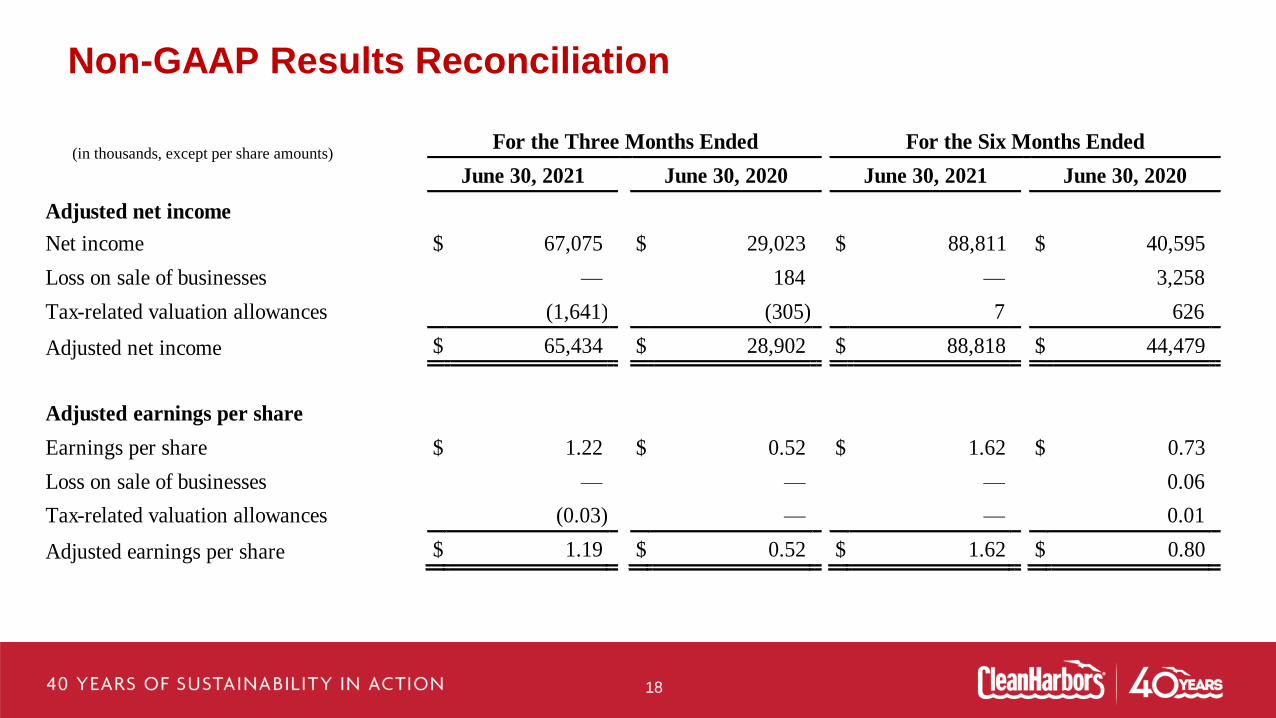
(in thousands, except per share amounts)
Non-GAAP Results Reconciliation
For the Three Months Ended For the Six Months Ended
June 30, 2021 June 30, 2020 June 30, 2021 June 30, 2020
Adjusted net income
Net income $ 67,075 $ 29,023 $ 88,811 $ 40,595
Loss on sale of businesses — 184 — 3,258
Tax-related valuation allowances (1,641) (305) 7 626
Adjusted net income $ 65,434 $ 28,902 $ 88,818 $ 44,479
Adjusted earnings per share
Earnings per share $ 1.22 $ 0.52 $ 1.62 $ 0.73
Loss on sale of businesses — — — 0.06 Tax-related valuation allowances (0.03) — — 0.01
Adjusted earnings per share $ 1.19 $ 0.52 $ 1.62 $ 0.80

19
Non-GAAP Results Reconciliation
(in thousands) For the Three Months Ended For the Six Months Ended
June 30, 2021 June 30, 2020 June 30, 2021 June 30, 2020
Adjusted free cash flow
Net cash from operating activities $ 162,432 $ 139,805 $ 265,432 $ 173,486
Additions to property, plant and equipment (50,075) (42,954) (91,988) (125,721)
Purchase and capital improvements of corporate HQ — 345 — 21,080
Proceeds from sale and disposal of fixed assets 2,275 951 3,479 3,101
Adjusted free cash flow $ 114,632 $ 98,147 $ 176,923 $ 71,946

20
Non-GAAP Guidance Reconciliation
For the Year Ending
December 31, 2021
Projected net cash from operating activities $475 to $525
Additions to property, plant and equipment (205) to (225)
Proceeds from sale and disposal of fixed assets 15 to 15
Projected adjusted free cash flow $285 to $315
For the Year Ending
December 31, 2021
Projected GAAP net income $159 to $193
Adjustments:
Accretion of environmental liabilities 12 to 11
Stock-based compensation 16 to 18
Depreciation and amortization 290 to 280
Other expense, net 3 to 3
Interest expense, net 73 to 72
Provision for income taxes 67 to 73
Projected Adjusted EBITDA $620 to $650
(in millions)
(in millions)

21
QUESTIONS?