Embed Size (px)
Citation preview
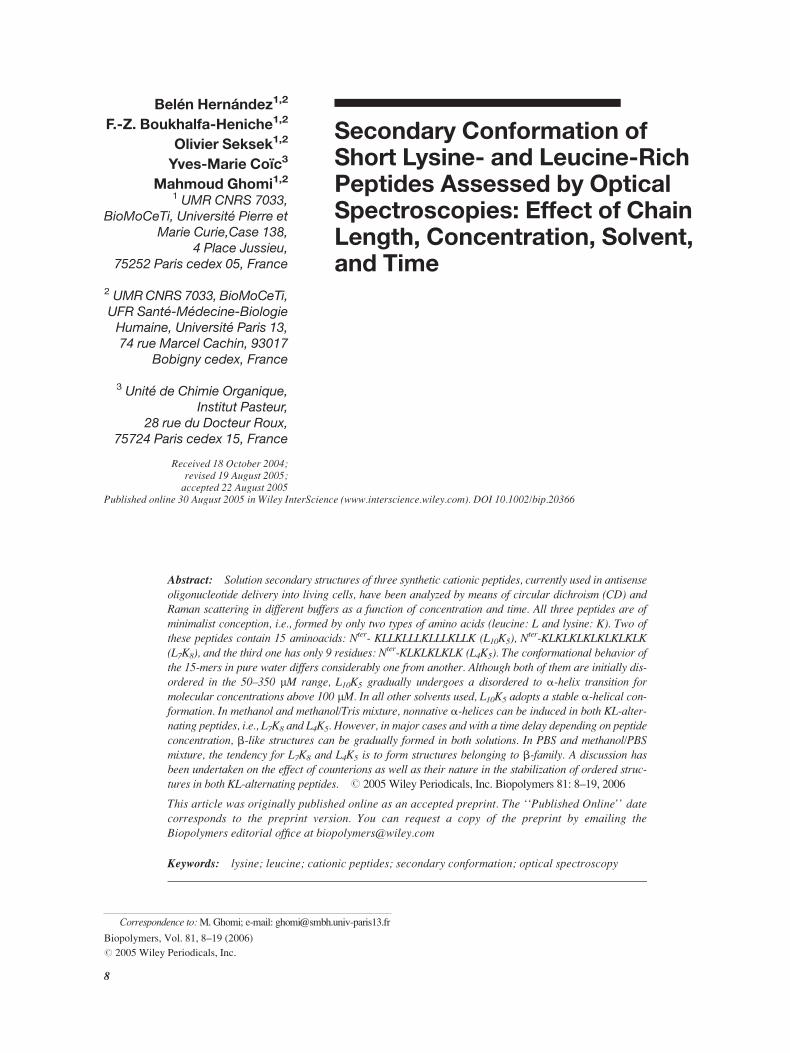
Secondary Conformation ofShort Lysine- and Leucine-RichPeptides Assessed by OpticalSpectroscopies: Effect of ChainLength, Concentration, Solvent,and Time
Belen Hernandez1,2
F.-Z. Boukhalfa-Heniche1,2
Olivier Seksek1,2
Yves-Marie Coıc3
Mahmoud Ghomi1,21 UMR CNRS 7033,
BioMoCeTi, Universite Pierre etMarie Curie,Case 138,
4 Place Jussieu,75252 Paris cedex 05, France
2 UMRCNRS7033, BioMoCeTi,UFR Sante-Medecine-BiologieHumaine, Universite Paris 13,74 rue Marcel Cachin, 93017
Bobigny cedex, France
3 Unite de Chimie Organique,Institut Pasteur,
28 rue du Docteur Roux,75724 Paris cedex 15, France
Received 18 October 2004;revised 19 August 2005;accepted 22 August 2005
Published online 30 August 2005 in Wiley InterScience (www.interscience.wiley.com). DOI 10.1002/bip.20366
Abstract: Solution secondary structures of three synthetic cationic peptides, currently used in antisenseoligonucleotide delivery into living cells, have been analyzed by means of circular dichroism (CD) andRaman scattering in different buffers as a function of concentration and time. All three peptides are ofminimalist conception, i.e., formed by only two types of amino acids (leucine: L and lysine: K). Two ofthese peptides contain 15 aminoacids: Nter- KLLKLLLKLLLKLLK (L10K5), N
ter-KLKLKLKLKLKLKLK(L7K8), and the third one has only 9 residues: N
ter-KLKLKLKLK (L4K5). The conformational behavior ofthe 15-mers in pure water differs considerably one from another. Although both of them are initially dis-ordered in the 50–350 lM range, L10K5 gradually undergoes a disordered to a-helix transition formolecular concentrations above 100 lM. In all other solvents used, L10K5 adopts a stable a-helical con-formation. In methanol and methanol/Tris mixture, nonnative a-helices can be induced in both KL-alter-nating peptides, i.e., L7K8 and L4K5. However, in major cases and with a time delay depending on peptideconcentration, b-like structures can be gradually formed in both solutions. In PBS and methanol/PBSmixture, the tendency for L7K8 and L4K5 is to form structures belonging to b-family. A discussion hasbeen undertaken on the effect of counterions as well as their nature in the stabilization of ordered struc-tures in both KL-alternating peptides. # 2005Wiley Periodicals, Inc. Biopolymers 81: 8–19, 2006
This article was originally published online as an accepted preprint. The ‘‘Published Online’’ datecorresponds to the preprint version. You can request a copy of the preprint by emailing theBiopolymers editorial office at [email protected]
Keywords: lysine; leucine; cationic peptides; secondary conformation; optical spectroscopy
Correspondence to:M. Ghomi; e-mail: [email protected]
Biopolymers, Vol. 81, 8–19 (2006)
# 2005 Wiley Periodicals, Inc.
8
INTRODUCTION
We have recently evidenced the ability of a cationic
peptide, i.e., the 15-mer Nter-KLLKLLLKLLLKLLK,
to translocate a nonspecific phosphorothioate oligo-
deoxynucleotide (PS-ODN) into glioma cells with
low cytotoxicity.1 Spectroscopic investigations (CD
and Raman scattering) could emphasize that this pep-
tide adopts an �-helix structure in phosphate buffer
and in methanol. The capability of cationic vectors,2–5
particularly minimalist cationic peptides,6,7 to con-
dense DNA and to facilitate its in vitro cellular trans-
fection were shown in the framework of antisense ther-
apy. Among the minimalist peptides, those formed
only by lysine (K: cationic and hydrophilic monomer)
and leucine (L: neutral and hydrophobic monomer),
were found to be highly efficient.1,8–15 This is mainly
due to their ability to mimic the behavior of natural
peptides as regards their strong lytic activity and their
aptitude to perturb cell membranes.9–15 On the other
hand, it is now well established that the secondary
structure of peptides and proteins does influence their
interactions with membranes and model membranes.8–
12,15–18 Structural properties of a few KL-minimalist
peptides were subject to previous investigations by
means of CD and vibrational spectroscopy,8–12,19,20
with the consideration of chain length, molecular con-
centration, and ionic force.20 We can recall here the
results obtained from some (LK)n and (LKKL)n pepti-
des,20 those from the peptides belonging to LiKj (i ¼2j)1,8–10,12 and LnKnþ1
11 families. Among the LiKj
(i ¼ 2j) peptides, the 9-mer Nter-KLLLKLLLK (L6K3)
revealed a very low level of structuring, whereas the
15-mer Nter-KLLKLLLKLLLKLLK (L10K5) was
shown to be capable of forming an �-helical secondarystructure.8 Furthermore, it was shown that, because of
their amphipathic feature, the hemolytic activity of
LiKj (i ¼ 2j) peptides increases proportionally with
their chain length. The activity of L10K5 is even higher
than that of mellitin taken as a standard.10 As far as
LnKnþ1 peptides (L4K5, L5K6, L6K7, L7K8) are con-
cerned, a previous work based on FT-ir spectroscopic
measurements performed in bulk solid state (samples
obtained after evaporation of methanolic solutions) is
to be mentioned.11 It turned out that all of these pepti-
des adopt preferentially �-sheet or �-turn secondary
structures and that the amount of �-sheet conformation
increases with the chain length in going from 9- to 15-
mer. On the other hand, it has been shown that, in
aqueous solution, KL-alternating peptides tend to form
�-type family conformations, whereas –LKKL– pepti-
des adopt preferentially an �-helical structure.20 In
both cases, the appearance of structured species
depends on the peptide concentration and/or on the
amount of added salt. In diluted solutions without
added salt, all of these peptides are unstructured.
In some previous reports it has been mentioned that
CD spectra alone cannot elucidate unambiguously sec-
ondary conformation of peptides and proteins.21–24 A
nonnegligible uncertainty remains in structural interpre-
tations mainly in the case of �-family structures, due to
the presence of numerous subfamilies23 and to the fact
that CD spectroscopy may assign extended loops and
strands to unordered elements.21 Therefore, to circum-
vent eventual misinterpretations, CD and vibrational
studies can be combined together. The simultaneous
use of CD25,26 and vibrational markers27–32 leads to a
more precise conformational determination in solution.
As far as the solvents are concerned, we have mainly
considered those routinely used in cell transfection
experiments, i.e., Tris, PBS, methanol (but in a lesser
extent), as well as their bicomponent mixtures. We
have also considered the temporal evolution of the sec-
ondary conformations of peptides in different solvents.
This study can be considered as the first step prior to
the analysis of the interactions of cationic peptides with
antisense oligonucleotides.
MATERIALS AND METHODS
Three different peptides, containing either 15 or 9 amino
acids, have been synthesized with the following primary se-
quences: Nter-KLLKLLLKLLLKLLK, Nter-KLKLKL-
KLK, and Nter-KLKLKLKLKLKLKLK, hereafter abbre-
viated and referred to as L10K5, L4K5, and L7K8, respec-
tively (Table I). They were synthesized at the Institut
Pasteur (Paris) by solid phase methodology following the
Fmoc chemistry protocol.33 Chemical synthesis of L10K5
and L4K5 was made from a Fmoc-PAL-PEG-PS resin on a
Pioneer continuous-flow peptide synthesizer using 4-fold
molar excess of Fmoc amino acid derivatives with double
coupling cycles. L7K8 was synthesized on a Model 433A
batch synthesizer from Fmoc Amid Resin using single cou-
pling cycles with 10-fold molar excess of Fmoc amino acid
derivatives. HATU [0-(7-azabenzotriazol-1-yl)-1,1,3,3,tetra-
methyluronium hexafluorophosphate] and DIPEA (N,N,diiso-
propylethylamine) were used as coupling reagents. Both ap-
paratus as well as chemical reagents were obtained from
Applied Biosystems (Foster City, CA, USA). All peptides
were cleaved from the resin using trifluroacetic acid (TFA)
with 5% water. After resin filtration, the cleavage mixtures
were poured into cold diethyl ether. The fully deprotected
peptides were then recovered by filtration of the precipitate
(L4K5 and L7K8) or extraction with water (L10K5) and
lyophilized. Crude peptides were dissolved with a mixture
of 0.08% aqueous TFA/acetonitrile and directly purified by
reverse-phase MPLC using a Nucleoprep 20 �m C18 100 A
preparative column and a linear gradient (1%/min) of aceto-
nitrile in 0.08% aqueous TFA (pH 2) over 60 min at a
Optical Spectroscopy Assessment of LK Peptides 9
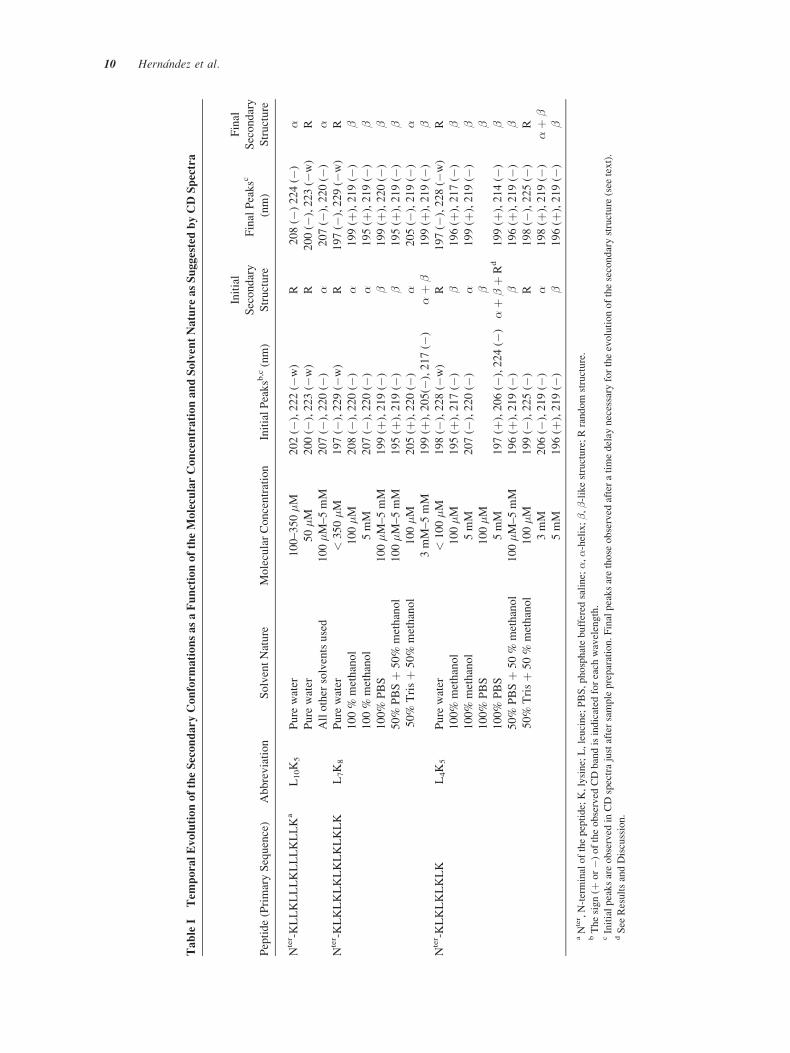
TableI
TemporalEvolutionoftheSecondaryConformationsasaFunctionoftheMolecularConcentrationandSolventNatureasSuggestedbyCDSpectra
Peptide(PrimarySequence)
Abbreviation
SolventNature
MolecularConcentration
InitialPeaksb
,c(nm)
Initial
Secondary
Structure
FinalPeaksc
(nm)
Final
Secondary
Structure
Nter -KLLKLLLKLLLKLLKa
L10K5
Pure
water
100–350�M
202(�
),222(�
w)
R208(�
)224(�
)�
Pure
water
50�M
200(�
),223(�
w)
R200(�
),223(�
w)
R
Allother
solventsused
100�M–5mM
207(�
),220(�
)�
207(�
),220(�
)�
Nter -KLKLKLKLKLKLKLK
L7K8
Pure
water
<350�M
197(�
),229(�
w)
R197(�
),229(�
w)
R
100%
methanol
100�M
208(�
),220(�
)�
199(þ
),219(�
)�
100%
methanol
5mM
207(�
),220(�
)�
195(þ
),219(�
)�
100%
PBS
100�M–5mM
199(þ
),219(�
)�
199(þ
),220(�
)�
50%
PBSþ
50%
methanol
100�M–5mM
195(þ
),219(�
)�
195(þ
),219(�
)�
50%
Trisþ
50%
methanol
100�M
205(þ
),220(�
)�
205(�
),219(�
)�
3mM–5mM
199(þ
),205(�
),217(�
)�þ
�199(þ
),219(�
)�
Nter -KLKLKLKLK
L4K5
Pure
water
<100�M
198(�
),228(�
w)
R197(�
),228(�
w)
R
100%
methanol
100�M
195(þ
),217(�
)�
196(þ
),217(�
)�
100%
methanol
5mM
207(�
),220(�
)�
199(þ
),219(�
)�
100%
PBS
100�M
��
100%
PBS
5mM
197(þ
),206(�
),224(�
)�þ
�þ
Rd
199(þ
),214(�
)�
50%
PBSþ
50%
methanol
100�M–5mM
196(þ
),219(�
)�
196(þ
),219(�
)�
50%
Trisþ
50%
methanol
100�M
199(�
),225(�
)R
198(�
),225(�
)R
3mM
206(�
),219(�
)�
198(þ
),219(�
)�þ
�5mM
196(þ
),219(�
)�
196(þ
),219(�
)�
aNter ,N-terminalofthepeptide;K,lysine;L,leucine;PBS,phosphatebuffered
saline;�,�-helix;�,�-likestructure;Rrandom
structure.
bThesign(þ
or�)
oftheobserved
CDbandisindicated
foreach
wavelength.
cInitialpeaksareobserved
inCDspectrajustaftersamplepreparation.Finalpeaksarethose
observed
afteratimedelay
necessary
fortheevolutionofthesecondarystructure
(see
text).
dSee
ResultsandDiscussion.
10 Hernandez et al.
18 mL/min flow rate. The purity of the peptides was
checked by HPLC on a nucleosil 5 �m C18 300 A analyti-
cal column, using a linear gradient of acetonitrile (1%/min)
in 0.08% aqueous TFA (pH 2) over 20 min at a 1 mL/min
flow rate. Purified peptides were quantified by amino acid
analysis and finally characterized by using positive ion
electrospray ionization mass spectrometry (ESþ). PBS sol-
utions as well as methanol and Tris were purchased from
PROLABO (Paris, France).
CD and Raman setups were described extensively in a
recent paper.34 Peptides were dissolved in i) pure water, ii)
methanol, iii) phosphate buffer containing 10 mM of Kþ
and Naþ cations (pH 6.8, for details see reference 35), iv)
PBS containing 10 mM phosphate buffer, 2.7 mM KCl,
137 mM NaCl (pH 7.4), v) Tris buffer containing 20 mM
Tris and 130 mM NaCl (pH 7.4), vi) a mixture of 50%
methanol þ 50% Tris or 50% PBS þ 50% methanol. CD
spectra were recorded in suprasil quartz cells with two dif-
ferent path lengths to demonstrate the effect of sample con-
centration either in the 50 to100 �M (2 mm path-length
cell) or in the 100 �M to 5 mM (0.01 mm path-length cell)
ranges. Spectra were analyzed at room temperature in
the 180- to 300-nm range. Each spectrum corresponds to
5 min of accumulation. The measured ellipticity for each
sample, [�]observed, was normalized to obtain the so-called
mean residue ellipticity, [�], by using the expression: [�]¼ [�]observed/10ncl, where n, c, and l are the number of resi-
dues in the peptide, the molar concentration, and the optical
path length of the sample, respectively.36 The normalized
ellipticity was expressed in deg cm2 dmol–1. The theoretical
estimates of [q]100% �-helix at 222 nm as calculated by the
expression given in reference 36, are �30,000 and �23,400
deg cm2 dmol–1, for a 15- and a 9-mer, respectively. These
values allow us to have a rough estimation of �-helix con-
tent in each sample when the general shape of its CD spec-
trum resembles that generally obtained for an �-helix.Raman spectra were recorded in the 5 to 8 mM concentra-
tion range. Samples were placed in a microcell of 13 �L inner
volume and excited with the 488 nm line of an argon laser.
Each spectrum was accumulated during 20 min at room tem-
perature and analyzed in the 1750–700 cm–1 region. Tempo-
ral evolution of CD and Raman spectra has been analyzed by
recording them as a function of time after sample preparation.
Especially at 5 mM in PBS, CD and Raman data were col-
lected simultaneously on the samples taken from the same
stock solution. To estimate the contribution of TFA anions to
Raman spectra of peptides, we have prepared reference solu-
tions as follows: solutions containing 1 mL of pure TFA
diluted in 9 mL of H2O (millipore) were neutralized by add-
ing NaOH (8 M) to reach pH 7; they then were lyophilized
and dissolved in water for preparing TFA anion solutions at
25 or 40 mM. These concentrations correspond well to those
existing in peptide solutions. Raman spectra were collected
from buffer, TFA, and peptides. Subtraction of buffer from
peptide spectrum was performed by normalizing each of them
to the water bending band at ca.1645 cm–1. In the same man-
ner, the contribution of water in TFA spectrum was corrected.
Finally, the TFA contribution was subtracted from the water-
corrected peptide spectrum after normalization to the intense
Raman band at 1436 cm–1 (TFA marker).
Postprocessing (subtraction of buffer contribution, base-
line correction, smoothing, and curve fitting) of all spectral
data were performed using GRAMS/32 software (Galactic
Industries). To get some more information about the secon-
dary structure of these peptides, curve fitting of their amide
I Raman profile observed in the 1750–1600 cm–1 range was
attempted. This procedure has been previously applied to
vibrational spectra to probe the secondary conformations
existing in the whole structure of proteins.16,37,38 To
decompose Raman bands, mixed Gaussian þ Lorentzian
functions, with Lorentzian contribution kept equal to or
greater than 50%, were employed. Initial guesses for their
maximum wavenumbers were based on the second derivative
analysis in the amide I region. Figures shown in this paper
have been drawn using the SIGMAPLOT (Systat Software
Inc., Point Richmond, CA) package.
RESULTS AND DISCUSSION
CD Spectra
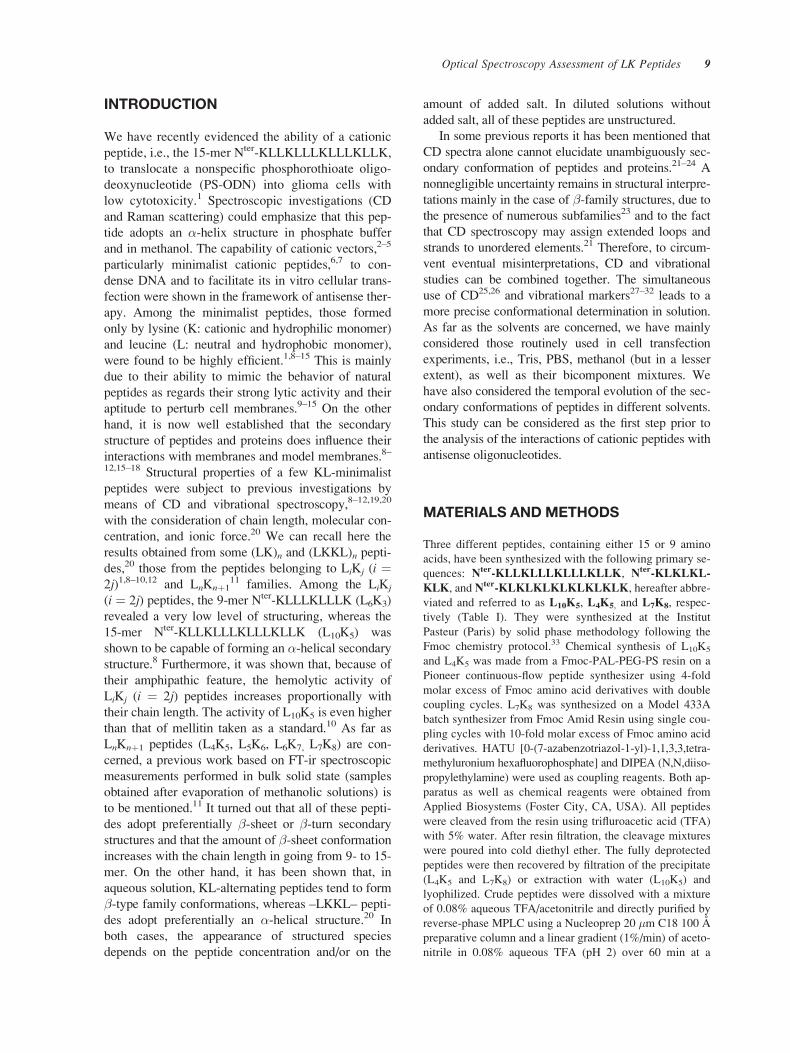
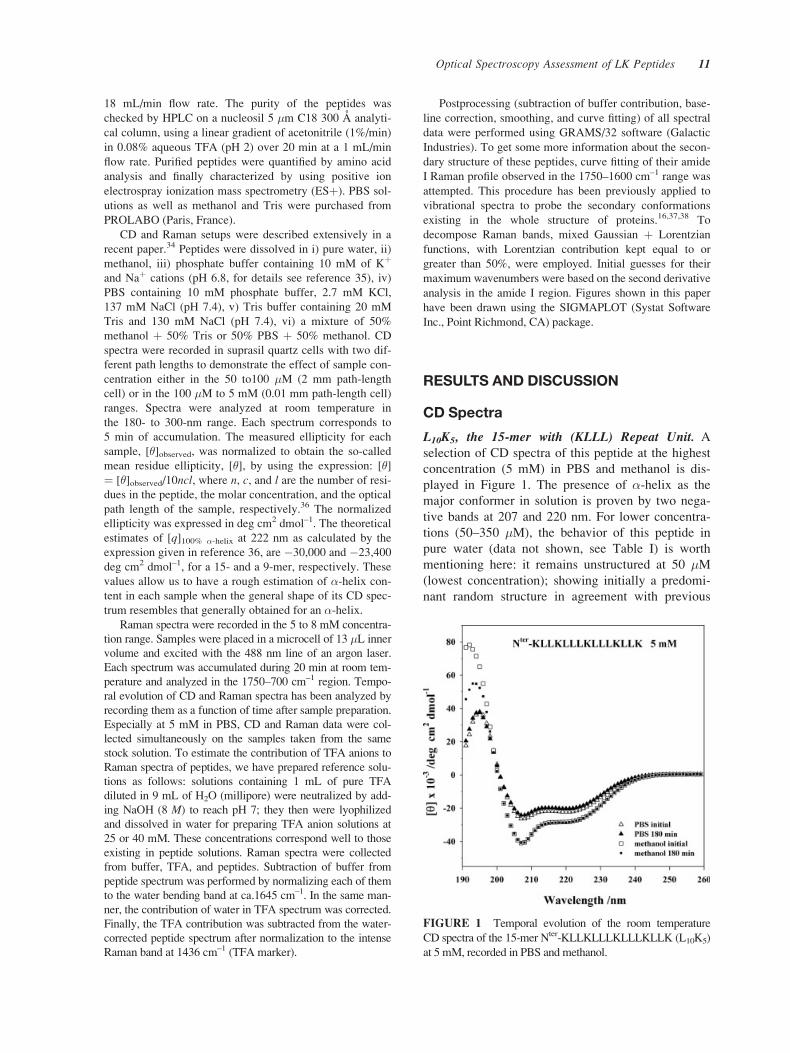
L10K5, the 15-mer with (KLLL) Repeat Unit. A
selection of CD spectra of this peptide at the highest
concentration (5 mM) in PBS and methanol is dis-
played in Figure 1. The presence of �-helix as the
major conformer in solution is proven by two nega-
tive bands at 207 and 220 nm. For lower concentra-
tions (50–350 �M), the behavior of this peptide in
pure water (data not shown, see Table I) is worth
mentioning here: it remains unstructured at 50 �M(lowest concentration); showing initially a predomi-
nant random structure in agreement with previous
FIGURE 1 Temporal evolution of the room temperature
CD spectra of the 15-mer Nter-KLLKLLLKLLLKLLK (L10K5)
at 5 mM, recorded in PBS and methanol.
Optical Spectroscopy Assessment of LK Peptides 11
results,20 this peptide undergoes a gradual transition
toward an �-helical structure (complete transition
observed after �3 h). In all other cases (solvent, con-
centration), L10K5 adopts a stable �-helical structure.
L7K8 and L4K5, the 15- and 9-mer with (KL) RepeatUnit. In contrast to L10K5, these two peptides present
a random structure in pure water, remaining unchanged
with time in the 50 to 350 �M concentration range
(data not shown, see Table I).
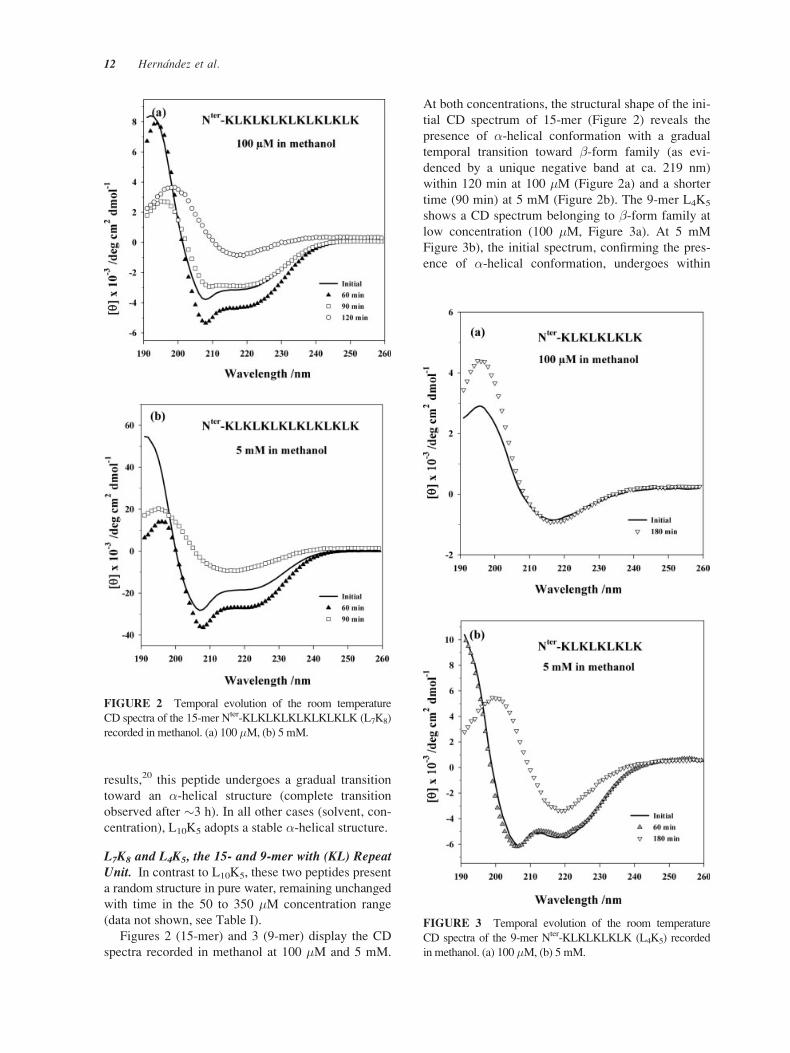
Figures 2 (15-mer) and 3 (9-mer) display the CD
spectra recorded in methanol at 100 �M and 5 mM.
At both concentrations, the structural shape of the ini-
tial CD spectrum of 15-mer (Figure 2) reveals the
presence of �-helical conformation with a gradual
temporal transition toward �-form family (as evi-
denced by a unique negative band at ca. 219 nm)
within 120 min at 100 �M (Figure 2a) and a shorter
time (90 min) at 5 mM (Figure 2b). The 9-mer L4K5
shows a CD spectrum belonging to �-form family at
low concentration (100 �M, Figure 3a). At 5 mM
Figure 3b), the initial spectrum, confirming the pres-
ence of �-helical conformation, undergoes within
FIGURE 2 Temporal evolution of the room temperature
CD spectra of the 15-mer Nter-KLKLKLKLKLKLKLK (L7K8)
recorded in methanol. (a) 100 �M, (b) 5 mM.
FIGURE 3 Temporal evolution of the room temperature
CD spectra of the 9-mer Nter-KLKLKLKLK (L4K5) recorded
in methanol. (a) 100 �M, (b) 5 mM.
12 Hernandez et al.
180 min a substantial change in the spectral shape, in
accordance with an �-helix toward �-structure con-
version.
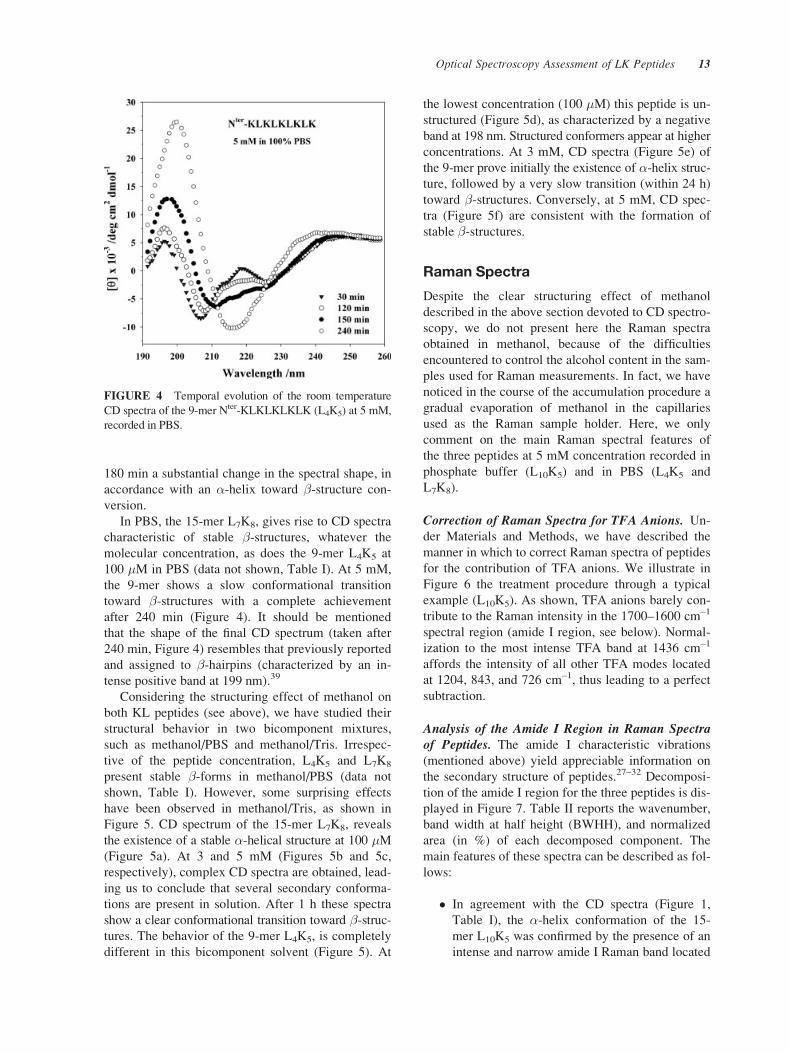
In PBS, the 15-mer L7K8, gives rise to CD spectra
characteristic of stable �-structures, whatever the
molecular concentration, as does the 9-mer L4K5 at
100 �M in PBS (data not shown, Table I). At 5 mM,
the 9-mer shows a slow conformational transition
toward �-structures with a complete achievement
after 240 min (Figure 4). It should be mentioned
that the shape of the final CD spectrum (taken after
240 min, Figure 4) resembles that previously reported
and assigned to �-hairpins (characterized by an in-
tense positive band at 199 nm).39
Considering the structuring effect of methanol on
both KL peptides (see above), we have studied their
structural behavior in two bicomponent mixtures,
such as methanol/PBS and methanol/Tris. Irrespec-
tive of the peptide concentration, L4K5 and L7K8
present stable �-forms in methanol/PBS (data not
shown, Table I). However, some surprising effects
have been observed in methanol/Tris, as shown in
Figure 5. CD spectrum of the 15-mer L7K8, reveals
the existence of a stable �-helical structure at 100 �M(Figure 5a). At 3 and 5 mM (Figures 5b and 5c,
respectively), complex CD spectra are obtained, lead-
ing us to conclude that several secondary conforma-
tions are present in solution. After 1 h these spectra
show a clear conformational transition toward �-struc-tures. The behavior of the 9-mer L4K5, is completely
different in this bicomponent solvent (Figure 5). At
the lowest concentration (100 �M) this peptide is un-
structured (Figure 5d), as characterized by a negative
band at 198 nm. Structured conformers appear at higher
concentrations. At 3 mM, CD spectra (Figure 5e) of
the 9-mer prove initially the existence of �-helix struc-
ture, followed by a very slow transition (within 24 h)
toward �-structures. Conversely, at 5 mM, CD spec-
tra (Figure 5f) are consistent with the formation of
stable �-structures.
Raman Spectra
Despite the clear structuring effect of methanol
described in the above section devoted to CD spectro-
scopy, we do not present here the Raman spectra
obtained in methanol, because of the difficulties
encountered to control the alcohol content in the sam-
ples used for Raman measurements. In fact, we have
noticed in the course of the accumulation procedure a
gradual evaporation of methanol in the capillaries
used as the Raman sample holder. Here, we only
comment on the main Raman spectral features of
the three peptides at 5 mM concentration recorded in
phosphate buffer (L10K5) and in PBS (L4K5 and
L7K8).
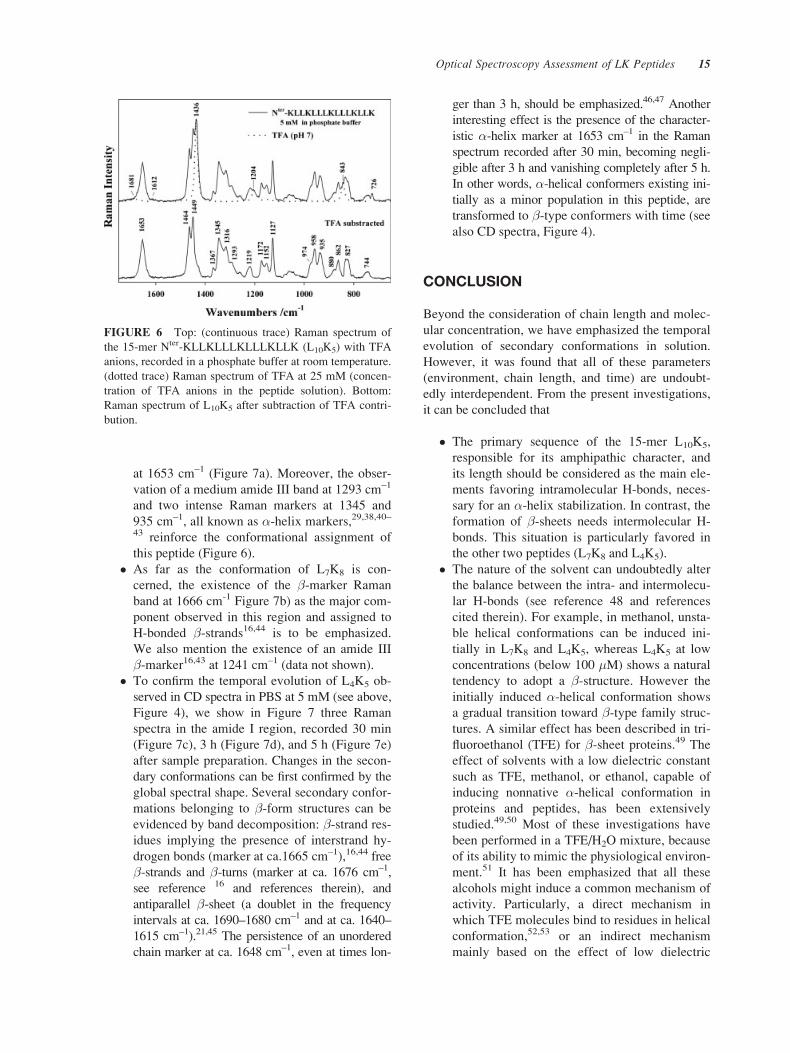
Correction of Raman Spectra for TFA Anions. Un-
der Materials and Methods, we have described the
manner in which to correct Raman spectra of peptides
for the contribution of TFA anions. We illustrate in
Figure 6 the treatment procedure through a typical
example (L10K5). As shown, TFA anions barely con-
tribute to the Raman intensity in the 1700–1600 cm–1
spectral region (amide I region, see below). Normal-
ization to the most intense TFA band at 1436 cm–1
affords the intensity of all other TFA modes located
at 1204, 843, and 726 cm–1, thus leading to a perfect
subtraction.
Analysis of the Amide I Region in Raman Spectraof Peptides. The amide I characteristic vibrations
(mentioned above) yield appreciable information on
the secondary structure of peptides.27–32 Decomposi-
tion of the amide I region for the three peptides is dis-
played in Figure 7. Table II reports the wavenumber,
band width at half height (BWHH), and normalized
area (in %) of each decomposed component. The
main features of these spectra can be described as fol-
lows:
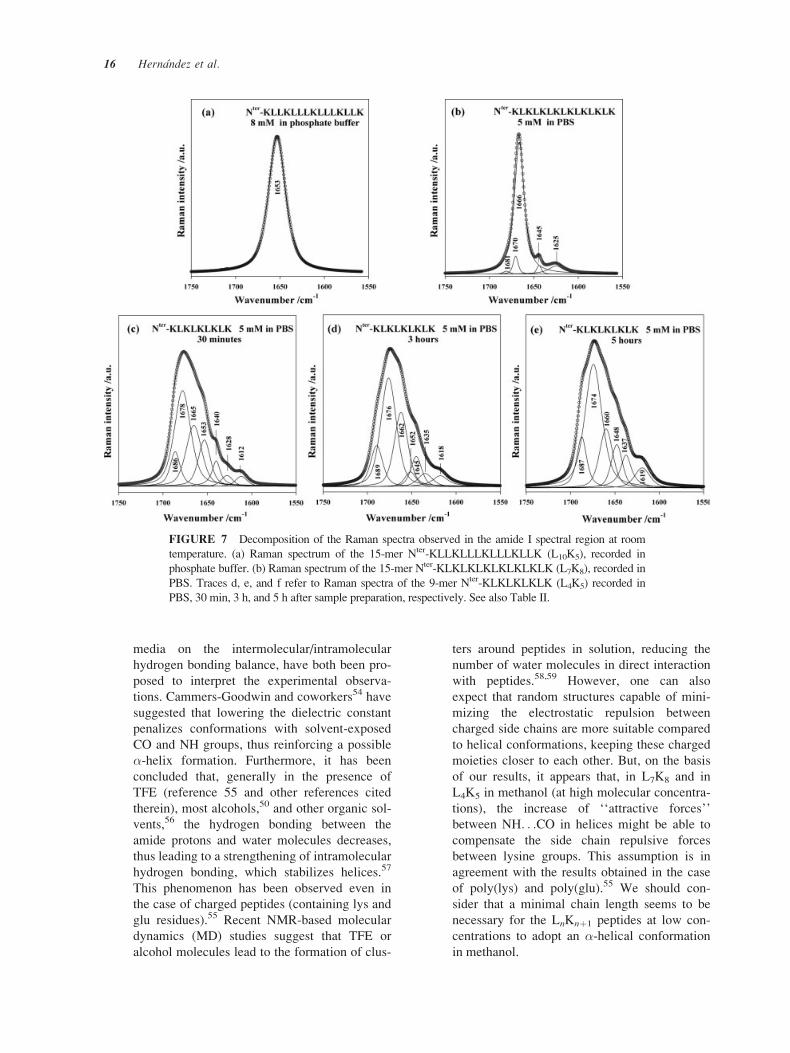
� In agreement with the CD spectra (Figure 1,
Table I), the �-helix conformation of the 15-
mer L10K5 was confirmed by the presence of an
intense and narrow amide I Raman band located
FIGURE 4 Temporal evolution of the room temperature
CD spectra of the 9-mer Nter-KLKLKLKLK (L4K5) at 5 mM,
recorded in PBS.
Optical Spectroscopy Assessment of LK Peptides 13
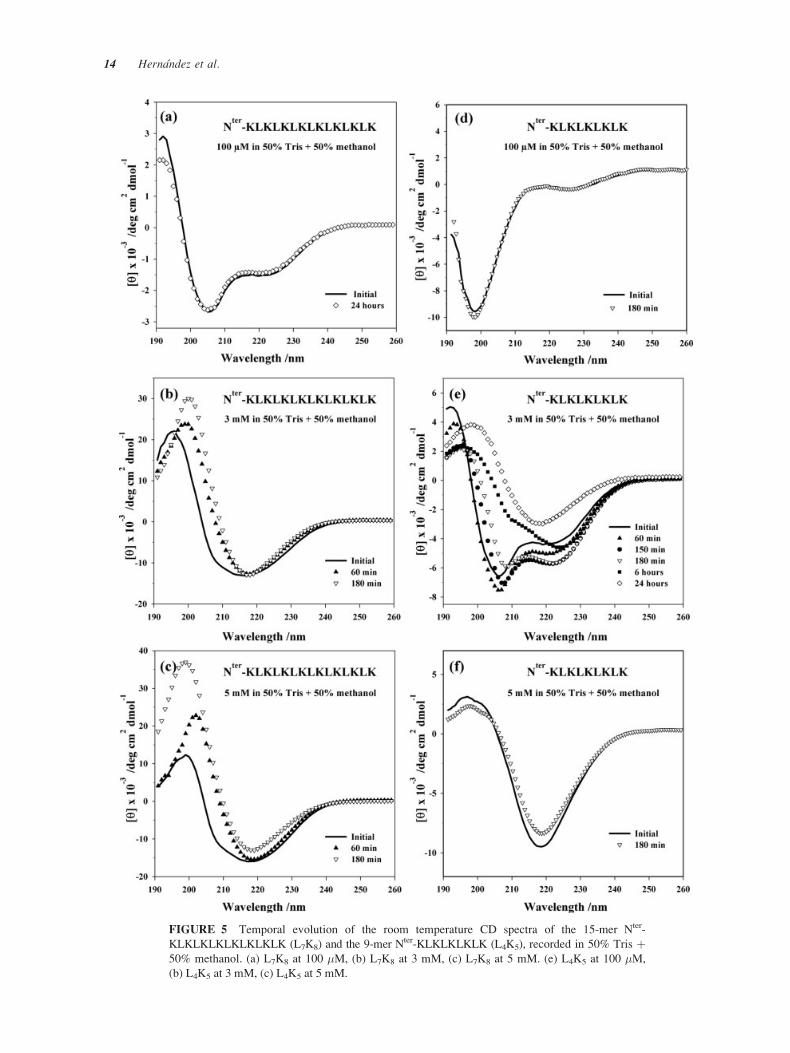
FIGURE 5 Temporal evolution of the room temperature CD spectra of the 15-mer Nter-
KLKLKLKLKLKLKLK (L7K8) and the 9-mer Nter-KLKLKLKLK (L4K5), recorded in 50% Tris þ50% methanol. (a) L7K8 at 100 �M, (b) L7K8 at 3 mM, (c) L7K8 at 5 mM. (e) L4K5 at 100 �M,
(b) L4K5 at 3 mM, (c) L4K5 at 5 mM.
14 Hernandez et al.
at 1653 cm–1 (Figure 7a). Moreover, the obser-
vation of a medium amide III band at 1293 cm–1
and two intense Raman markers at 1345 and
935 cm–1, all known as �-helix markers,29,38,40–
43 reinforce the conformational assignment of
this peptide (Figure 6).
� As far as the conformation of L7K8 is con-
cerned, the existence of the �-marker Raman
band at 1666 cm-1 Figure 7b) as the major com-
ponent observed in this region and assigned to
H-bonded �-strands16,44 is to be emphasized.
We also mention the existence of an amide III
�-marker16,43 at 1241 cm–1 (data not shown).
� To confirm the temporal evolution of L4K5 ob-
served in CD spectra in PBS at 5 mM (see above,
Figure 4), we show in Figure 7 three Raman
spectra in the amide I region, recorded 30 min
(Figure 7c), 3 h (Figure 7d), and 5 h (Figure 7e)
after sample preparation. Changes in the secon-
dary conformations can be first confirmed by the
global spectral shape. Several secondary confor-
mations belonging to �-form structures can be
evidenced by band decomposition: �-strand res-
idues implying the presence of interstrand hy-
drogen bonds (marker at ca.1665 cm–1),16,44 free
�-strands and �-turns (marker at ca. 1676 cm–1,
see reference 16 and references therein), and
antiparallel �-sheet (a doublet in the frequency
intervals at ca. 1690–1680 cm–1 and at ca. 1640–
1615 cm–1).21,45 The persistence of an unordered
chain marker at ca. 1648 cm–1, even at times lon-
ger than 3 h, should be emphasized.46,47 Another
interesting effect is the presence of the character-
istic �-helix marker at 1653 cm–1 in the Raman
spectrum recorded after 30 min, becoming negli-
gible after 3 h and vanishing completely after 5 h.
In other words, �-helical conformers existing ini-
tially as a minor population in this peptide, are
transformed to �-type conformers with time (see
also CD spectra, Figure 4).
CONCLUSION
Beyond the consideration of chain length and molec-
ular concentration, we have emphasized the temporal
evolution of secondary conformations in solution.
However, it was found that all of these parameters
(environment, chain length, and time) are undoubt-
edly interdependent. From the present investigations,
it can be concluded that
� The primary sequence of the 15-mer L10K5,
responsible for its amphipathic character, and
its length should be considered as the main ele-
ments favoring intramolecular H-bonds, neces-
sary for an �-helix stabilization. In contrast, the
formation of �-sheets needs intermolecular H-
bonds. This situation is particularly favored in
the other two peptides (L7K8 and L4K5).
� The nature of the solvent can undoubtedly alter
the balance between the intra- and intermolecu-
lar H-bonds (see reference 48 and references
cited therein). For example, in methanol, unsta-
ble helical conformations can be induced ini-
tially in L7K8 and L4K5, whereas L4K5 at low
concentrations (below 100 �M) shows a natural
tendency to adopt a �-structure. However the
initially induced �-helical conformation shows
a gradual transition toward �-type family struc-
tures. A similar effect has been described in tri-
fluoroethanol (TFE) for �-sheet proteins.49 Theeffect of solvents with a low dielectric constant
such as TFE, methanol, or ethanol, capable of
inducing nonnative �-helical conformation in
proteins and peptides, has been extensively
studied.49,50 Most of these investigations have
been performed in a TFE/H2O mixture, because
of its ability to mimic the physiological environ-
ment.51 It has been emphasized that all these
alcohols might induce a common mechanism of
activity. Particularly, a direct mechanism in
which TFE molecules bind to residues in helical
conformation,52,53 or an indirect mechanism
mainly based on the effect of low dielectric
FIGURE 6 Top: (continuous trace) Raman spectrum of
the 15-mer Nter-KLLKLLLKLLLKLLK (L10K5) with TFA
anions, recorded in a phosphate buffer at room temperature.
(dotted trace) Raman spectrum of TFA at 25 mM (concen-
tration of TFA anions in the peptide solution). Bottom:
Raman spectrum of L10K5 after subtraction of TFA contri-
bution.
Optical Spectroscopy Assessment of LK Peptides 15
media on the intermolecular/intramolecular
hydrogen bonding balance, have both been pro-
posed to interpret the experimental observa-
tions. Cammers-Goodwin and coworkers54 have
suggested that lowering the dielectric constant
penalizes conformations with solvent-exposed
CO and NH groups, thus reinforcing a possible
�-helix formation. Furthermore, it has been
concluded that, generally in the presence of
TFE (reference 55 and other references cited
therein), most alcohols,50 and other organic sol-
vents,56 the hydrogen bonding between the
amide protons and water molecules decreases,
thus leading to a strengthening of intramolecular
hydrogen bonding, which stabilizes helices.57
This phenomenon has been observed even in
the case of charged peptides (containing lys and
glu residues).55 Recent NMR-based molecular
dynamics (MD) studies suggest that TFE or
alcohol molecules lead to the formation of clus-
ters around peptides in solution, reducing the
number of water molecules in direct interaction
with peptides.58,59 However, one can also
expect that random structures capable of mini-
mizing the electrostatic repulsion between
charged side chains are more suitable compared
to helical conformations, keeping these charged
moieties closer to each other. But, on the basis
of our results, it appears that, in L7K8 and in
L4K5 in methanol (at high molecular concentra-
tions), the increase of ‘‘attractive forces’’
between NH. . .CO in helices might be able to
compensate the side chain repulsive forces
between lysine groups. This assumption is in
agreement with the results obtained in the case
of poly(lys) and poly(glu).55 We should con-
sider that a minimal chain length seems to be
necessary for the LnKnþ1 peptides at low con-
centrations to adopt an �-helical conformation
in methanol.
FIGURE 7 Decomposition of the Raman spectra observed in the amide I spectral region at room
temperature. (a) Raman spectrum of the 15-mer Nter-KLLKLLLKLLLKLLK (L10K5), recorded in
phosphate buffer. (b) Raman spectrum of the 15-mer Nter-KLKLKLKLKLKLKLK (L7K8), recorded in
PBS. Traces d, e, and f refer to Raman spectra of the 9-mer Nter-KLKLKLKLK (L4K5) recorded in
PBS, 30 min, 3 h, and 5 h after sample preparation, respectively. See also Table II.
16 Hernandez et al.
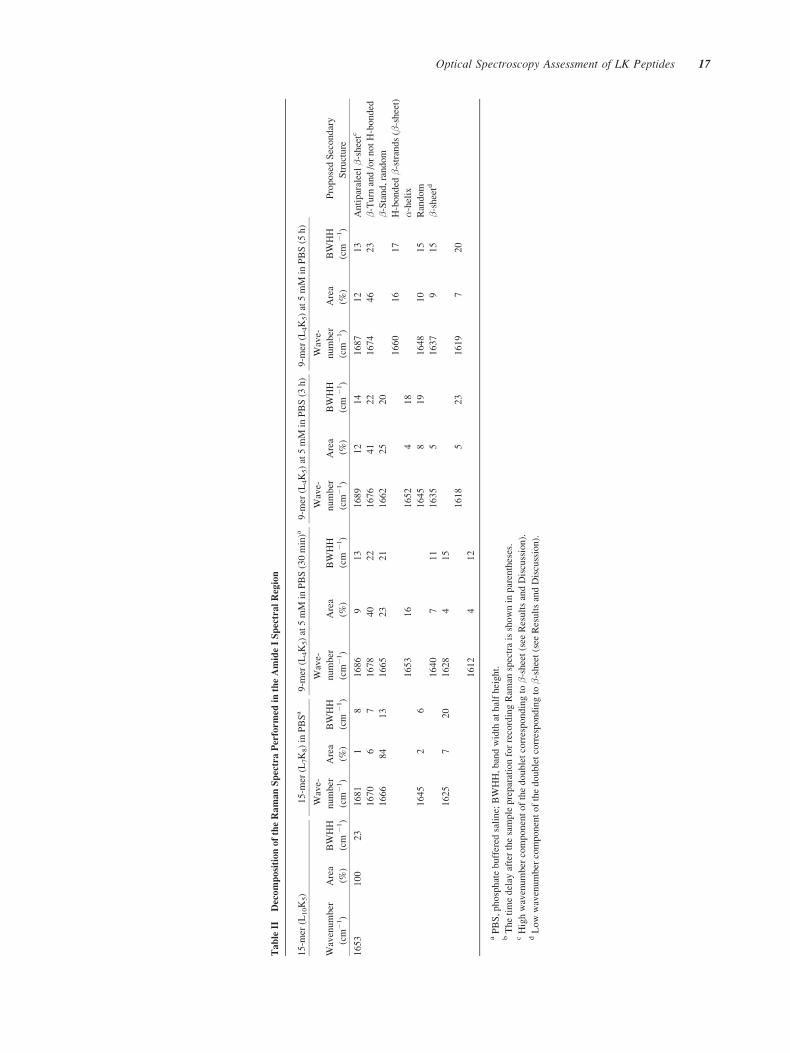
TableII
DecompositionoftheRamanSpectraPerformedin
theAmideISpectralRegion
15-m
er(L
10K5)
15-m
er(L
7K8)in
PBSa
9-m
er(L
4K5)at5mM
inPBS(30min)a
9-m
er(L
4K5)at5mM
inPBS(3
h)
9-m
er(L
4K5)at5mM
inPBS(5
h)
ProposedSecondary
Structure
Wavenumber
(cm
�1)
Area
(%)
BWHH
(cm
�1)
Wave-
number
(cm
�1)
Area
(%)
BWHH
(cm
�1)
Wave-
number
(cm
�1)
Area
(%)
BWHH
(cm
�1)
Wave-
number
(cm
�1)
Area
(%)
BWHH
(cm
�1)
Wave-
number
(cm
�1)
Area
(%)
BWHH
(cm
�1)
1653
100
23
1681
18
1686
913
1689
12
14
1687
12
13
Antiparaleel�-sheetc
1670
67
1678
40
22
1676
41
22
1674
46
23
�-Turn
and/ornotH-bonded
1666
84
13
1665
23
21
1662
25
20
�-Stand,random
1660
16
17
H-bonded
�-strands(�-sheet)
1653
16
1652
418
�-helix
1645
26
1645
819
1648
10
15
Random
1640
711
1635
51637
915
�-sheetd
1625
720
1628
415
1618
523
1619
720
1612
412
aPBS,phosphatebuffered
saline;BWHH,bandwidth
athalfheight.
bThetimedelay
afterthesamplepreparationforrecordingRam
anspectraisshownin
parentheses.
cHighwavenumber
componentofthedoubletcorrespondingto
�-sheet(see
ResultsandDiscussion).
dLowwavenumber
componentofthedoubletcorrespondingto
�-sheet(see
ResultsandDiscussion).
Optical Spectroscopy Assessment of LK Peptides 17
� The increase in peptide concentration, espe-
cially in the case of a short peptide such as
L4K5 dissolved in methanol or in methanol/Tris,
favors the formation of �-helix, by an entropic
effect arising from the helix–helix interactions.
Previous results were consistent with the forma-
tion of short helices through multihelix bundle
effect.60 These nonnative �-helices are not sta-
ble and undergo a conformational transition
toward �-type structures with a temporal evolu-
tion faster in pure methanol.
� Solutions containing methanol þ Tris (and con-
sequently NaCl) bring Cl– anions in the vicinity
of peptides and the shielding effect of these
counterions reduces the repulsive interactions of
adjacent lysines, thus explaining a higher stabil-
ity of helical conformation. Moreover, a Tris
molecule (containing 3 OH and 1 NH2 groups)
can also contribute to the formation of H-bonds
with the peptides and consequently stabilize the
helical structures. In contrast, in PBS as well as
in methanol/PBS, �-type structures are favored
in L4K5 and L7K8. Indeed, ‘‘bulky’’ phosphate
anions might have the capability of forming
bridges between positively charged side chains,
favoring strand–strand interactions.
F.-Z. Boukhalfa-Heniche thanks the Fondation pour la
Recherche Medicale (FRM) and the Association pour la
Recherche contre le Cancer (ARC) for doctoral fellowships.
B. Hernandez acknowledges the Spanish Ministry of Edu-
cation, Culture, and Sport for a postdoctoral fellowship
EX2001 12751081. The authors thank Catherine Herve du
Penhoat and Vladimir Baumruk for their careful reading of
the manuscript and helpful suggestions.
REFERENCES
1. Boukhalfa-Heniche, F. Z.; Hernandez, B.; Gaillard, S.;
Coıc, Y. M.; Huynh-Dinh, T.; Lecouvey, M.; Seksek,
O.; Ghomi, M. Biopolymers 2004, 73, 727–734.
2. Wyman, T. B.; Nicol, F.; Zelphati, O.; Scaria, P. V.;
Plank, C.; Szoka F.C., Jr. Biochemistry 1997, 36,
3008–3017.
3. Li, W.; Nicol, F.; Szoka F.C., Jr.; Adv Drug Deliv Rev
2004, 56, 967–985.
4. Morris, M. C.; Chaloin, L.; Mery, J.; Heitz, F.; Divita,
G. Nucleic Acids Res 1999, 27, 3510–3517.
5. Derossi, D.; Chassaing, G.; Prochiantz, A. Trends Cell
Biol 1998, 8, 84–87.
6. Niidome, T.; Takaji, K.; Urakawa, M.; Ohmori, N.;
Wada, A.; Hirayama, T.; Aoyagi, H.; Bioconjug Chem
1999, 10, 773–780.
7. Kubo, T.; Yokoyama, K.; Ueki, R.; Abe, S.; Goto, K.;
Niidome, T.; Aoyagi, H.; Iwakuma, K.; Ando, S.;
Ono, S.; Fujii, M. Nucleic Acids Symp Ser 2000, 44,
49–50.
8. Dufourcq, J.; Neri, W.; Henry-Toulme, N. FEBS Lett
1998, 421, 7–11.
9. Castano, S.; Desbat, B.; Laguerre, M.; Dufourcq, J.
Biochim Biophys Acta 1999, 1416, 176–194.
10. Castano, S.; Cornut, I.; Buttner, K.; Dasseux, J. L.;
Dufourcq, J. Biochim Biophys Acta 1999, 1416, 161–175.
11. Castano, S.; Desbat, B.; Dufourcq, J. Biochim Biophys
Acta 2000, 1463, 65–80.
12. Beven, L.; Castano, S.; Dufourcq, J.; Wieslander, A.;
Wroblewski, H. Eur J Biochem 2003, 270, 2207–2217.
13. Albiol Matanic, V. C.; Castilla, V. Int J Antimicrob
Agents 2004, 23, 382–389.
14. Kagan, B. L.; Selsted, M. E.; Ganz, T.; Lehrer, R. I.
Proc Natl Acad Sci U S A 1990, 87, 210–214.
15. Blondelle, S. E.; Houghten, R. A. Biochemistry 1992,
31, 12688–12694.
16. Maiti, N. C.; Apetri, M. M.; Zagorski, M. G.; Carey, P.
R.; Anderson, V. E. J Am Chem Soc 2004, 126, 2399–
2408.
17. Maget-Dana, R.; Lelievre, D. Biopolymers 2001, 59,
1–10.
18. Kiyota, T.; Lee, S.; Sugihara G.Biochemistry 1996, 35,
13196–13204.
19. Cornut, I.; Buttner, K.; Dasseux, J. L.; Dufourcq, J.
FEBS Lett 1994, 349, 29–33.
20. Baumruk, V.; Huo, D.; Dukor, R. K.; Keiderling, T. A.;
Lelievre, D.; Brack, A.; Biopolymers 1994, 34, 1115–
1121.
21. Dong, A.; Kendrich, B.; Kreilgard, L.; Matsuura, J.;
Manning, M. C.; Carpenter, J. F. Arch Biochem Bio-
phys 1997, 347, 213–220.
22. Glattli, A.; Daura, X.; Seebach, D.; van Gunsteren, W.
F. J Am Chem Soc 2002, 124, 12972–12978.
23. Pelton, J. T.; McLean, L. R. Anal Biochem 2000, 277,
167–176.
24. Yada, R. Y.; Jackman, R. L.; Nakai, S. Int J Peptide
Protein Res 1988, 98–108.
25. Greenfield, N. J. Anal Biochem 1996, 235, 1–10.
26. Kelly, S. M.; Price, N.C. Biochim Biophys Acta 1997,
1338, 161–185.
27. Jackson, M.; Mantsch, H. H. Crit Rev Biochem Mol
Biol 1995, 30, 95–120.
28. Krimm, S.; Bandekar, J. Adv Protein Chem 1986, 38,
181–364.
29. Miura, T.; Thomas, G. J., Jr. Subcell Biochem 1995,
24, 55–99.
30. Peticolas, W. L. Methods Enzymol 1995, 226, 389–
416.
31. Sane, S. U.; Cramer, S. M.; Przybycien, T. M. Anal
Biochem 1999, 269, 255–272.
32. Marx, J.; Berjot, M.; Alix, A. J. P. J Raman Spectrosc
1987, 18, 289–300.
33. Chan, W. C.; White, P. D. In Fmoc Solid Phase Peptide
Synthesis: A Practical Approach. Oxford University
Press: Oxford, UK, 2000.
34. Hernandez, B.; Baumruk, V.; Gouyette, C.; Ghomi, M.
Biopolymers 2005, 78, 21–34.
18 Hernandez et al.
35. Baumruk, V.; Gouyette, C.; Huynh-Dinh, T.; Sun, J. S.;
Ghomi, M. Nucleic Acids Res 2001, 29, 4089–4096.
36. Lazo, N. D.; Downing, D. T. J Peptide Res 2001, 58,
457–463.
37. Munishkina, L. A.; Phelan, C.; Uversky, V. N.; Fink,
A. L. Biochemistry 2003, 42, 2720–2730.
38. Debelle, L.; Alix, A. J. P.; Wei, S. M.; Jacob, M. P.;
Huvenne, J. P.; Berjot, M.; Legrand, P. Eur J Biochem
1998, 258, 533–539.
39. Hilario, J.; Kubelka, J.; Keiderling, T. A. J Am Chem
Soc 2003, 125, 7562–7574.
40. Overman, S. A.; Thomas, G. J., Jr.; Biochemistry 1998,
37, 5654–5665.
41. Tsuboi, M.; Suzuki, M.; Overman, S. A.; Thomas, G.
J., Jr. Biochemistry 2000, 39, 2677–2684.
42. Overman, S. A.; Thomas, G. J., Jr. Biochemistry 1999,
38, 4018–4027.
43. Williams, R. W.; Dunker, A. K. J Mol Biol 1981, 152,
783–813.
44. Shao, Z.; Vollrath, F.; Sirichaisit, J.; Young, R. J. Poly-
mer 1999, 40, 2493–2500.
45. Kubelka, J.; Keiderling, T. A. J Am Chem Soc 2001,
12, 12048–12058.
46. Dong, J.; Wan, Z.; Popov, M.; Carey, P. R.; Weiss, M.
A. J Mol Biol 2003, 330, 431–442.
47. Thomas, P. J.; Ko, Y. H.; Pedersen P. L. FEBS Lett
1992, 312, 7–9.
48. Awasthi, S. K.; Shankaramma, S. C.; Raghothama, S.;
Balaram, P. Biopolymers 2001, 58, 465–476.
49. Dong, A.; Matsuura, J.; Manning M. C.; Carpenter J. F.
Arch Biochem Biophys 1998, 355, 275–281.
50. Arunkumar, A. I.; Kumar, T. K. S.; Yu, C. Int J Biol
Macromol 1997, 21, 223–230.
51. Buck, M. Q Rev Biophys 1998, 31, 297–355.
52. Jasanoff, A.; Fesht A. R. Biochemistry 1994, 33, 2129–
2135.
53. Storrs, R. W.; Truckses, D.; Wemmer, D. E. Biopoly-
mers 1992, 32, 1695–1702.
54. Cammers-Goodwin, A.; Allen, T. J.; Oslik, S. L.;
McClure, K. F.; Lee, J. H.; Kemp, D. S. J Am Chem
Soc 1996, 118, 3082–3090.
55. Luo, P.; Baldwin, R. L. Proc Natl Acad Sci U S A.,
1992, 96, 4930–4935.
56. Arunkumar, A. I.; Kumar, T. K. S.; Sivaraman, T.; Yu,
C. Int J Biol Macromol 1997, 21, 299–305.
57. Nelson, J. W.; Kallenbach, N. R. Proteins Struct Funct
Genet 1986, 1, 211–217.
58. Roccatano, D.; Colombo, G.; Fiorini, M.; Mark, A. E.
Proc Natl Acad Sci U S A 2002, 99, 12179–12184.
59. Fiorini, M.; Diaz, M. D.; Buger, K.; Berger, S. J Am
Chem Soc 2002, 124, 7737–7744.
60. Eisenberg, D.; Wilcox, W.; Eshita, S. M.; Pryciak, P.
M.; Ho, S. P.; DeGrado, W. F. Proteins 1986, 1, 16–22.
Reviewing Editor: Nancy Stellwagen
Optical Spectroscopy Assessment of LK Peptides 19