Embed Size (px)
Citation preview
The Mathematics Educator 2010, Vol. 20, No. 1, 8–21
8
Secondary Mathematics: Four Credits, Block Schedules, Continuous Enrollment? What Maximizes College Readiness?
Jeremy Zelkowski
This paper posits the position that if higher education and secondary schools wish to increase students’ college readiness, specifically in mathematics and critical thinking skills, continuous enrollment in secondary mathematics is one avenue worth exploring as opposed to increasing mathematics graduation requirements only in terms of Carnegie credits. NAEP-HSTS 2005 and NELS:88 data indicate, respectively, non-continuous enrollment in secondary mathematics results in lower mathematics achievement and decreases the odds of completing a bachelor’s degree. Nationally, schools following 4 4 block schedules (90-minute classes that meet daily for only one semester) were found to have mathematics achievement scores two thirds of one grade-level lower than schools following a 50-minute year-long mathematics courses. Typical college-bound students who do not take mathematics all four years of high school likely diminish their odds of bachelor degree completion by about 20%.
State and district education policies concerning the
number of high school mathematics credits required for graduation vary widely (Education Commission of the States [ECS], 2007). Further, higher education institutional admissions criteria also vary broadly between institutions. Over the course of the last 10 years, many states have increased the number of mathematics credits required for high school graduation from the three credits recommended by the Nation at Risk report (National Commission on Excellence in Education, 1983) to the now popular policy of four mathematics credits. However, among states with the increased requirement, only a few have a written policy that requires college bound students to be enrolled in a mathematics class each year of high school. The policy language tends to focus more on accumulation of credits than mathematics achievement. Moreover, I argue the position that block scheduling in high schools (see “Secondary School Class Scheduling Formats”) may well be contributing to the stagnant college graduation rates and remediation issues well-documented over the past decade (e.g. Aldeman, 2010; Attewell, Lavin, Domina, & Levey, 2006; Horn, 2006; Hoyt & Sorensen, 2001; Knapp, Kelly-Reid, & Ginder, 2010).
Adelman (1999, 2006) indicated that secondary mathematics is the predominant predictor of bachelor degree completion using two national longitudinal data sets—High School and Beyond (HS&B) and the
National Education Longitudinal Study (NELS). This research extends Adelman’s contention by studying secondary course enrollments in mathematics to test the conjecture that continuous enrollment in high school mathematics is linked to bachelor degree completion. If this conjecture were to hold up, then institutes of higher education, state departments of education, and school districts should consider implementing a continuous enrollment policy for mathematics. Moreover, schools and districts may reexamine whether the popular 4 4i block schedule format, present in nearly one-third of secondary schools (National Assessment of Education Progress [NAEP], 2009), is actually increasing students’ mathematics achievement or decreasing it and thereby possibly reducing college readiness.
Conceptual Framework
College Readiness
For nearly 75 years, researchers have been studying critical thinking (Browne, Haas, Vogt, & West, 1977; Ennis, 1993; Facione & Facione, 1994; Glaser, 1941; Jones & Ratcliff, 1993; Norris, 1989, 1990, 1992; Williams & Worth, 2001). Glaser (1941, pp. 5-6) defined critical thinking to include: (a) an attitude of being disposed to consider in a thoughtful way the problems and subjects that come within the range of one’s experiences; (b) knowledge of the methods of logical inquiry and reasoning; and (c) some skill in applying those methods. More recently, researchers (Ennis, 1993; Facione & Facione, 1994; Williams & Worth, 2001) have tried to narrow the definition and measure a person’s ability to think critically. Though a universal definition of critical
Dr. Jeremy Zelkowski is an Assistant Professor of Secondary Mathematics Education at The University of Alabama. Part of his research focuses on the post-secondary educational benefits associated with secondary mathematics factors.
Jeremy Zelkowski
9
thinking currently does not exist, many college and university faculty agree that the ability to think critically is central to success in college regardless of course content. Thompson and Joshua-Shearer (2002) surveyed and interviewed college students and reported two overwhelming conclusions: high schools need to teach better critical thinking and study skills. In the same study, the teachers most frequently labeled by students as their worst teachers in high school were mathematics and science teachers. In light of Thompson and Joshua-Shearer’s findings, it might be expected that average college-bound students looking to be college-eligible rather than college-ready would avoid challenging mathematics and science courses in high school if policy permitted such action.
David Conley (2005) reported the distinctive environment of U.S. high schools focuses more on getting students college-eligible rather than college-ready. College-eligible refers to meeting a state’s minimum high school graduation requirements and public college admission requirements. College-ready, on the other hand, refers to meeting a state’s highly recommended course-taking suggestions to improve college-readiness, completing rigorous advanced core subject courses during the senior year of high school, and/or meeting the minimum college entrance test scores predicting successful completion of entry-level college core courses.
Conley (2005), arguably the leading U.S. researcher in this field, has led a charge in trying to build a bridge from secondary school coursework to college coursework. His Standards-For-Success (S4S) project is the most extensive compilation of specific college-readiness standards for the core high school subjects. However, many students today may still avoid challenging courses late in high school knowing they have reached college-eligibility. ACTii, Inc. (2005) indicates only 22% of students who complete the three basic core mathematics classes of Algebra 1, Geometry, and Algebra 2 (or the equivalent) will meet the ACT college-readiness benchmark (22 out of 36 on the ACT mathematics component), which, ACT indicates, is the tipping point predictor score of successful completion of an entry-level college algebra course. In secondary schools requiring a fourth credit for graduation, students can easily fulfill the final mathematics credit with half-credit mathematics electives (special topics courses) that may fail to increase college-readiness. “Typically, students (even the brightest ones) avoid tasks that appear to require more energy than the students are willing to expend” (Sparapani, 1998, p.1). Hence, although increasing
graduation credit requirements in mathematics might seem to be a fix to the situation, students can still avoid challenging mathematics in preparation for college. Schools following the 90-minute 4 4 block schedule format present even more non-continual enrollment concerns.
Secondary School Class Scheduling Formats
Traditional Period Scheduling
Traditional period scheduling in high schools typically follows a schedule where students attend one-credit classes for the entire school year. Typically, each class meets for 50 to 55 minutes daily, for a total of seven class periods per day. In some high schools that are forced to have several lunch periods, longer classes are possible. In this case, the high schools may have an eight period day where teachers have two planning periods and teach six class periods. In an eight period day, students typically have one period as a study hall or activity period, but they could also have academic classes for all eight periods. There are other variations as well.
Block Scheduling
Block scheduling can follow different scheduling formats as well. I will briefly explain three of them here: The most common is the 4 4 block spanning 80- to 90-minute class periods. Students take four full credit courses daily each semester of the year. Some school systems divide their year into trimesters. Students essentially take a full credit course over the span of two consecutive terms in the trimester. Period lengths vary from 70- to 90-minutes for trimester formats.
In the alternating block, or the A/B block, students alternate between classes every other day, similar to a college format. However, classes meet all year instead of during just one semester. One week, students attend A block classes on Monday-Wednesday-Friday and B block classes on Tuesday-Thursday. The following week, the A and B blocks switch days of the week. The typical class length can range depending on the day of the week, but generally falls into the 70-90 minute range. There are other variations on how the days alternate.
Finally, the Copernican block schedule, a format, used in a very small percentage of high schools, has two configurations. In the first configuration, a long four-hour block consists of a main core course like English or Algebra. Then, two or three shorter 1 to 1.5 hour classes fill the rest of the day. Every month, students switch schedules where courses change to
Maximizing College-Readiness
10
balance out the curriculum time for each of the four major content areas. The second configuration takes the four-hour block into two two-hour blocks. The rest of the day is the same as the first configuration. In this configuration, students switch schedules every two months instead of monthly.
Arguably, block scheduling may be the single greatest sign of reform teaching strategies implemented since the early 90s in American high schools because the format theoretically offers longer class time to go deeper in the content during the extended 30-plus minutes of class time over traditional 45- to 55- minute class periods. However, the research community is confused by the mixed findings of block scheduling. Some research (Buckman, King, & Ryan, 1995; Duel, 1999; Fletcher, 1997; Khazzaka, 1998; Queen, Algozzine, & Eaddy; 1997; Snyder, 1997; Stader, 2001) has shown support for block scheduling formats, claiming improved achievement, student attendance, and school climate and a decreased incidence of discipline problems. Equally persistent has been research asserting block schedules produce negative results or fail to demonstrate any statistically significant improvements over other scheduling formats (Cobb, Abate, & Baker, 1999; Fletcher, 1997; Hamdy & Urich, 1998; Knight, De Leon, & Smith, 1999; Lare, Jablonski, & Salvaterra, 2002; Pisapia & Westfall; 1997). The research does agree that the subject being taught, the teacher’s ability and knowledge, and school climate are all contributors to whether any scheduling format works effectively at producing student achievement.
The Popularity of Shifting to Block Scheduling in the Early 90s
Block scheduling offers optimism to parents, teachers, and students in that it provides an opportunity for additional learning to occur in ways not possible in a 50- or 55-minute period. Specifically, block scheduling allows students to more deeply examine concepts for extended periods of time. A 4 4 block schedule also allows students to complete eight Carnegie credits in a school year instead of only seven in the traditional schedule. Theoretically, block scheduled classes provide more opportunities for student-centered instruction. Teachers have other positive aspects to consider when teaching under the block schedule format. Each semester, teachers are only preparing for three classes of students each day instead of six in traditional period schedule formats, allowing for more time to prepare and plan. Also, with only three period changes between the four classes,
students are in the hallways less frequently, thereby reducing discipline problems outside the classroom, where teachers have less control.
While, in theory, block scheduling has all the signs of setting up a major reform in the high school classroom, one cannot ignore the negatives that exist in the block-scheduling world. Many classrooms in block format see teachers direct lecturing for 50-55 minutes and then giving students the remaining 30 minutes of class time to do their homework. Or, worse yet, teachers may spend the first 20 minutes of a blocked class going over homework, teach for 45 minutes, and then give students the remaining time to complete homework. In this format, little chance exists for the deep exploration of mathematical concepts or inquiry-based learning that were the foundations behind the creation of block schedule formats. For students, block scheduling can insert a long delay in the cognitive development of critical thinking skills in mathematics. For example, students may take Algebra 1 during the fall block their freshman year. Then, the student might take geometry the following fall during the sophomore year. Essentially, students go nine months without studying mathematics. The same student may then take Algebra 2 in the spring of their junior year. Therefore, students may go two full calendar years without studying algebra extensively. This large time gap in studying algebra in high school may be a serious contributor to the fact that college algebra is the most failed and dropped college course, with calculus closely behind (Adelman, 2003, 2004). We know algebra is a true gatekeeper to access to and attainment in higher education (Jacobson, 2000; Moses, 1994; Rech & Harrington, 2000; Silva & Moses, 1990). The growing popularity of integrated mathematics courses in high school is partially attributed to this notion. Integrating algebra and geometry rather than isolating each subject has been a growing trend in high school mathematics curricula since the mid-90’s when the National Science Foundation began funding large projects for creating such curricula.
Existing Policy Worth Examination
The state of Tennessee recently changed policy regarding the mathematical trajectory that their secondary students will follow during high school. Tennessee now requires all high school students to take mathematics all four years of high school—a policy not based on total credits but continuous enrollment (Tennessee Department of Education, 2009). Students are to be evaluated, based on ACT math score, during or immediately following their junior year of high
Jeremy Zelkowski
11
school. Students meeting ACT’s recommended achievement level for college mathematics readiness, an ACT mathematics score of 22 or higher, will have the opportunity to choose which specific course(s) they will take their senior year, dependent on their previous coursework. These choices would consist of Advanced Algebra, Algebra 3, Trigonometry, Pre-calculus, Statistics, and Calculus. Students with an ACT mathematics score of 19 to 21 will be encouraged to take courses focused specifically on preparing students for entry-level college mathematics course or an entry-level job market skills course called Capstone Mathematics. Students who have not earned at least a 19 on the ACT mathematics section will be recommended to take Bridge Math, a remedial course meant to bring students closer to college- or job-market readiness.
Although Tennessee is not alone in wanting more high school students to be college-ready, Tennessee’s approach is unique because all students do not have the luxury of avoiding mathematics their senior year. The approach theoretically targets different abilities in an effort to improve students’ college readiness based on their mathematics achievement up to the start of their senior year. Michigan already has a similar policy requiring college bound (merit) students to be enrolled in mathematics the senior year without exception (Michigan Department of Education, 2006). Additionally, Kentucky and West Virginia have put policies in place requiring mathematics all four years of high school that should increase mathematics achievement and college-readiness (ECS, n.d.).
Despite these exceptions, many states have a four mathematics course credit policy. While teaching mathematics at a large, mid-Atlantic university in a
state with a four-credit policy in place, I learned how high school students can still avoid continuous enrollment in secondary mathematics. Over five years, I taught between 2500 and 3000 students in freshman level mathematics classes. During tutoring, I discovered many of the weaker students avoided continuous enrollment in high school mathematics by taking two mathematics courses in one year under the block schedule format in order to avoid a year of mathematics—usually the senior year. Other weak students had avoided the more advanced mathematics courses in high school by taking half-credit electives in order to fulfill the fourth required mathematics credit. This information was the impetus of this study. I hypothesize that the lack of continual development of critical thinking skills in mathematics resulting from continuous enrollment in secondary mathematics courses diminishes college-readiness.
Existing Data
Distribution of Scheduling in the U.S.
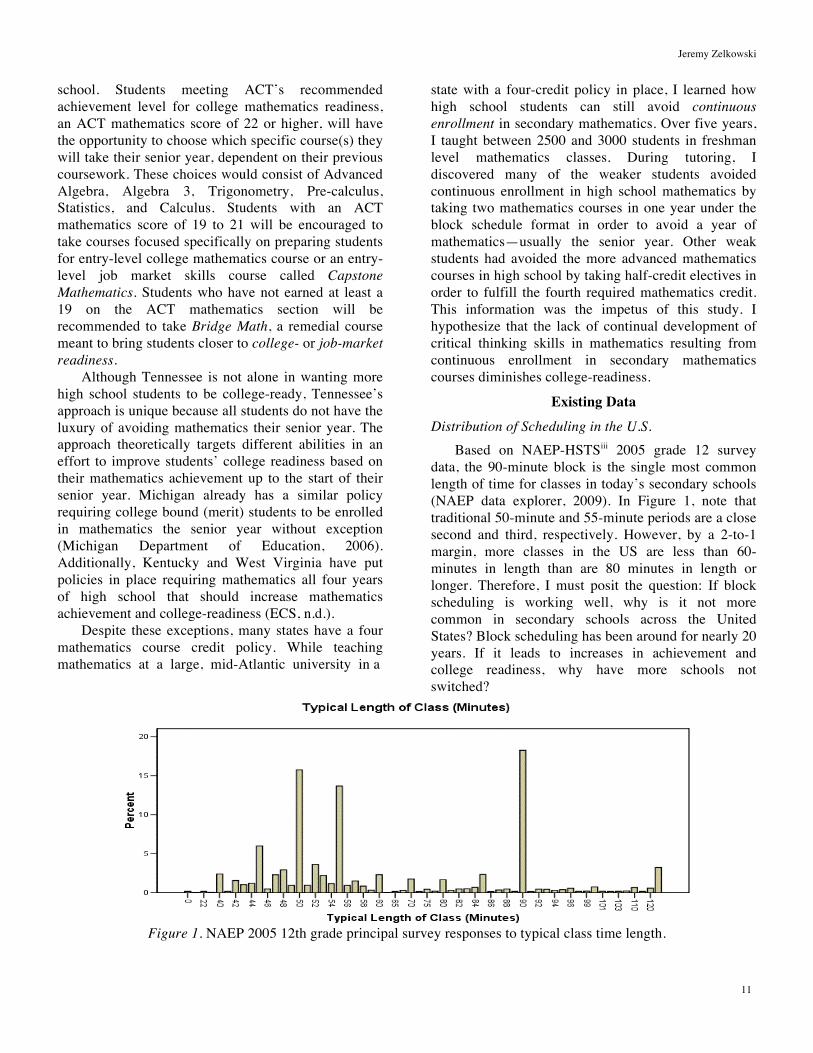
Based on NAEP-HSTSiii 2005 grade 12 survey data, the 90-minute block is the single most common length of time for classes in today’s secondary schools (NAEP data explorer, 2009). In Figure 1, note that traditional 50-minute and 55-minute periods are a close second and third, respectively. However, by a 2-to-1 margin, more classes in the US are less than 60-minutes in length than are 80 minutes in length or longer. Therefore, I must posit the question: If block scheduling is working well, why is it not more common in secondary schools across the United States? Block scheduling has been around for nearly 20 years. If it leads to increases in achievement and college readiness, why have more schools not switched?
Figure 1. NAEP 2005 12th grade principal survey responses to typical class time length.
Maximizing College-Readiness
12
Literature Review on Block Scheduling
Zepeda and Mayers (2006) analyzed 58 empirical studies concerning block scheduling covering research published from the mid-90s through 2005. However, only a select number of the 58 studies directly researched mathematics achievement. Most studies surveyed, sampled, or tested only small numbers of participants with the exception of Jenkins, Queen, and Algozzine (2002). These researchers studied over 2,100 North Carolina teachers’ teaching practices. The data suggested little difference between instructional practices of block and non-block teachers. Moreover, Adams and Salvaterra (1998) reported that although, initially, teachers attempted new progressive teaching strategies in the block schedule format, after a couple years, they seemed to regress to teacher-centered direct lecture without deep inquiry. However, the same research reported that innovative teachers were more positive about block scheduling than teachers who tried to force traditional methods and seatwork into the block format. It is possible to deduce from research that without sustained professional development, teachers regress to less advanced methods of teaching under the block format.
Snyder (1997) reported increased ACT and state test scores with moderate increases in SAT scores for students following block schedules. However, Snyder, as well as Knight et al. (1999), reported that Advanced Placement (AP) exam scores decreased slightly in block format. In contrast, Evans, Tokarczyk, Rice, and McCray (2002) reported that AP scores and standardized test scores increased after students switched from period to block scheduling. Specific to mathematics, Pisapia and Westfall (1997) reported that more schools saw increased SAT verbal scores than increased SAT mathematics scores while all AP exam scores declined. Gruber and Onwuegbuzie (2001) and Lawrence and McPherson (2000) concluded that student achievement across all four major content subjects was better under traditionally scheduled formats than block-scheduled formats. It is clear that the research findings are very mixed regarding the effects of block scheduling on mathematics achievement and college readiness.
Summary on Block Scheduling from Existing Research
Zepeda and Mayers (2006) reported three consistent findings in existing research on block scheduling. They claimed the following:
Three major themes across the five groups of studies emerged from the analysis. First, many of the research studies failed to report information
that is customarily found in formal writing such as journal articles and convention papers. Second, the majority of studies, with few exceptions, reported positive perceptions of block scheduling among teachers, students, and administrators. Third, the research presents mixed messages concerning the effect of block scheduling on teachers’ instructional practices and on student achievement. (p.158)
The most consistent report on standardized testing, though far from convincing, was that state test scores initially increased under block scheduling. However, these studies were snapshots in time over one year or less. Only one study spanned a longer era and reported initial increases but returned to former achievement levels by year three. Declining AP exam scores and standardized test scores seemed consistent in the few studies that focused on these tests (Cobb, Abate, & Baker, 1999; Knight, De Leon, & Smith, 1999). These findings contradict the strong positive views from students about block scheduling (Hurley, 1997; Salvaterra et al, 1999) and could easily be connected to the fact that grades and grade point average (GPA) increased in block schedule formats (Duel, 1999; Fletcher, 1997; Khazzaka, 1998; Knight et al., 1999; Snyder, 1997). But, these GPA increases may be attributable to a change in grading practices, thus making higher grades easier to obtain, which could, in turn, result in less knowledge and understanding by students.
Zepeda and Mayers (2006) concluded there is good evidence that blocked classes are easier than traditional period scheduled classes because less content is typically covered in blocked classes. In the same six-hour school day, students in a block schedule format complete a full credit more by the end of the year then students in a non-block format, seven Carnegie credits as opposed to eight. Therefore, for any given full credit course, less class time actually exists in the block format to study content. In fact, we can conclude that 12.5% less time is devoted inside the classroom to each course under a block schedule format than in traditional seven period formats because students complete eight full credits instead of seven in one year. Nonetheless, some research does report positive increases in student achievement under a block schedule format. Therefore, this paper examines the three most popular class period lengths with regards to associated mathematics achievement using the national NAEP HSTS 2005 mathematics test data and makes the connection from high school mathematics achievement to post-secondary completion using the NELS 88:2000 data for analysis.
Jeremy Zelkowski
13
Methodology
Data Sources
The current two-phase study uses two national data sets. The first phase involved an extensive analysis on the likelihood of bachelor degree completion based on continuous secondary mathematics enrollment using a NELS data set (for a detailed description of NELS see http://nces.ed.gov/surveys/NELS88/). Within NELS, only participants who attended four-year post-secondary institutions were analyzed. Further, students who attended highly selective institutions were excluded since advanced high school mathematics courses are required for admission to highly selective institutions. In the NELS:88 dataset, 2.5% of weighted sample population of college students with complete transcripts from higher education attended highly selective institutions. Their removal from the data set prevents skewing the results in favor of the intended research objectives of study. Thus, the population of analysis in NELS removes the highly advanced college bound students and two-year only degree seekers. This remaining population is referred to as the Typical Bachelor Degree Population here forward. For comparison purposes, a second analysis was performed on all NELS participants with post-secondary experience (Adelman’s [2006] population). This population does not include high school graduates with no post-secondary coursework experience, but does include two-year only degree seekers and the highly selective institution attendees.
The second phase compared mathematics achievement in the three most common (50-55-90 minute classes +/- 1 minute) schedules using the NAEP HSTS 2005 data from the mathematics NAEP test. All NAEP test takers of the mathematics component were included because this part of the analysis examines class format and mathematics achievement rather than college attainment.
Predictive Models
Two predictive statistical models are used in predicting bachelor degree completion using the NELS data. The first model is a logistic regression model controlling for socioeconomic status (SES) and 8th-grade mathematics achievement (prior achievement). This model produces the contribution for each variable to the odds of bachelor degree completion. The dichotomous dependent variable is completion of a bachelor’s degree or not. The independent variables considered for the model include entry to Algebra 1 before grade nine, continuous enrollment in secondary
mathematics, highest mathematics class completed in high school, an academic intensity variable constructed by Adelman (2006), and high school mathematics credits required for graduation. The second model uses discriminant analysis (DA). This method is similar to factor analysis. That is, DA allows for examination as to the strength and contribution each variable has towards group separation.
The logistic model may represent one independent variable as contributing to the odds of bachelor degree completion by three times, yet DA may produce results indicating the variable ranks low in separating degree recipients and those who fail to complete their degree. At first glance, this seems to be a contradiction. However, DA puts forth which significant variables are the strongest in separating naturally occurring groups rather than just looking at the odds contribution in logistic modeling. NAEP data compares groups using ANOVA statistics. DA yields results more powerful than the logistic regression models. Thus, type-II errors will be less likely and the degree to which independents separate the two groups will be more easily interpreted in the structure matrix. The structure matrix values are similar to factor loadings and indicate the substantive nature of the independent variables in relationship to each independent’s contribution of group separation. Bargman (1970) and Bray and Maxwell (1985) argue that high structure matrix values contribute most to group separation, while lower values contribute least to group separation. The standardized coefficients range from ±1 and speak of the relative contribution of each variable in the model. However, the logistic regression models also serve significance while considering all variables in predicting odds of bachelor degree completion. Combined, both models open the door for stronger interpretations of the results. For example, a logistic regression model may indicate the odds of degree completion increases two-fold for a specific variable. Yet, DA may only indicate a small degree of significance by this variable in separating degree earners from non-degree earners. In this example, the variable, say earning a B or better in high school geometry, may indicate a B or better doubles the odds of completing a bachelors degree. In the end, this variable may not be a strong predictor compared to other variables of separating degree and non-degree earner, but still doubles the likelihood of completing a bachelor’s degree from those who earn a C or less in geometry.
Maximizing College-Readiness
14
Data Sets Structure, Weights, and Software
NELS used a sample of U.S. students who were 8th graders in the fall of 1988 and followed these students through December of 2000. NELS was a two-staged stratified sample of schools and students by probability of random selection. First, schools were randomly chosen. Then, students within the schools were randomly chosen. This complex sampling design requires researchers to meticulously use the weights associated with the research being conducted. The methods suggested for analysis by Thomas and Heck (2001) are used by considering relative weights during analysis with SPSS 17.0. See Thomas, Heck, and Bauer (2005) for an example and detailed explanation.
NAEP is not designed to measure individual student achievement. Therefore, NAEP lists five plausible outcome scores associated with each student in the NAEP restricted data set. The analysis of student achievement in block or traditional scheduled classes uses the existing AM software (v.0.06), which encompasses accepted statistical procedures for using these five plausible values as an outcome measure. Weights are also used in concordance with NAEP and AM software when analyzing achievement in mathematics.
Statistical Analysis and Results
Data Presentation
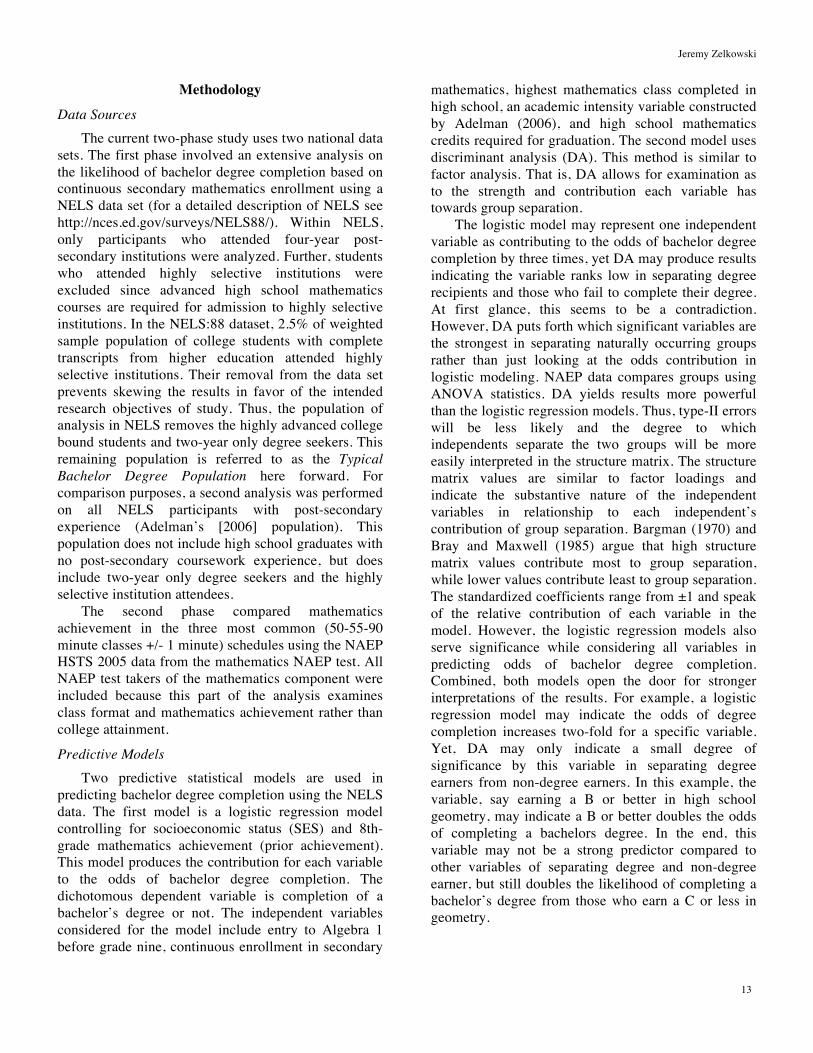
The analysis of continuous enrollment using logistic regression is given in Tables 1 and 2. Table 1 presents the findings for the typical bachelor degree seeking population in the US. This group consisted of the students most likely to be influenced if continuous
enrollment in high school mathematics was required over x number of credits.
All variables considered for analysis, including Adelman’s (2006) predictor variables of academic intensity via Carnegie credits and highest mathematics course completed, are presented in Table 1 alongside three variables of policy importance concerning college-bound students preparing mathematically in secondary schools. There are three results I would like to bring to your attention. First as expected, SES was the predominant labeler of college success for the Typical Bachelor Degree Population. Second, early entry to Algebra 1 in eighth grade resulted in decreased odds for degree completion. This may provide some insight into early algebra entry and is discussed further in the interpretation. Third, continuous enrollment did contribute more to increasing the odds of bachelor degree completion than a simple credit increase in mathematics from three to four.
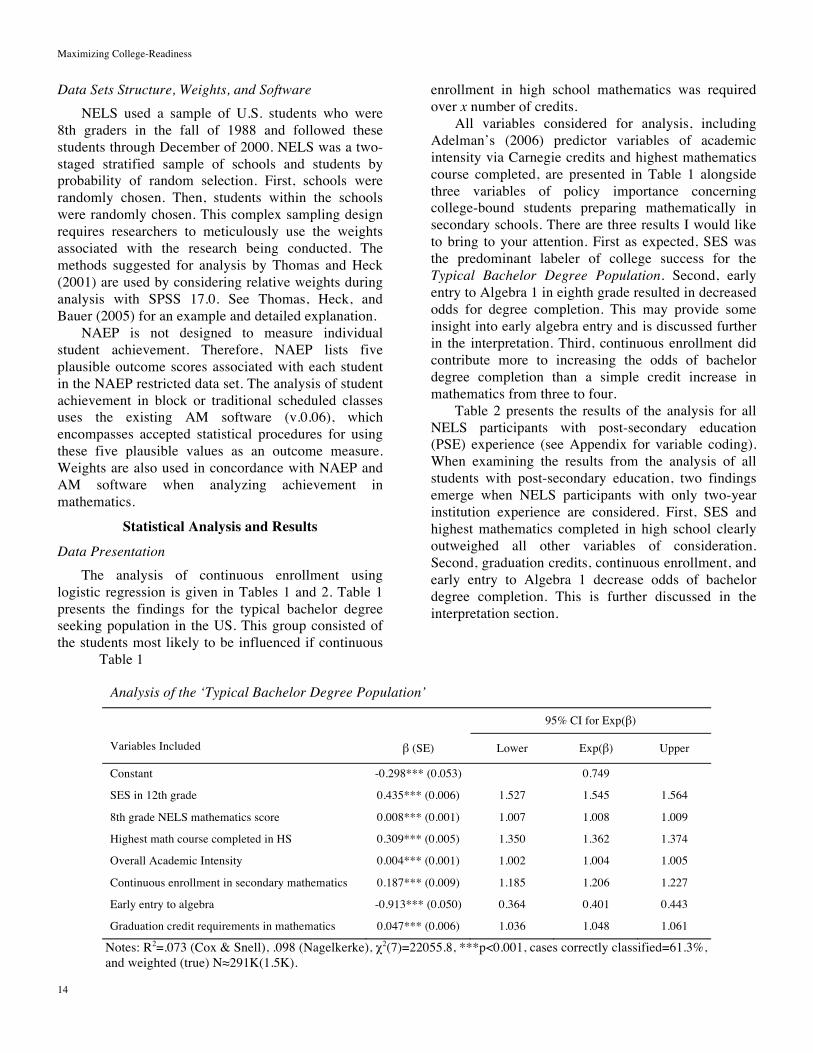
Table 2 presents the results of the analysis for all NELS participants with post-secondary education (PSE) experience (see Appendix for variable coding). When examining the results from the analysis of all students with post-secondary education, two findings emerge when NELS participants with only two-year institution experience are considered. First, SES and highest mathematics completed in high school clearly outweighed all other variables of consideration. Second, graduation credits, continuous enrollment, and early entry to Algebra 1 decrease odds of bachelor degree completion. This is further discussed in the interpretation section.
Table 1
Analysis of the ‘Typical Bachelor Degree Population’
95% CI for Exp( )
Variables Included
(SE) Lower Exp( ) Upper
Constant -0.298*** (0.053) 0.749
SES in 12th grade 0.435*** (0.006) 1.527 1.545 1.564
8th grade NELS mathematics score 0.008*** (0.001) 1.007 1.008 1.009
Highest math course completed in HS 0.309*** (0.005) 1.350 1.362 1.374
Overall Academic Intensity 0.004*** (0.001) 1.002 1.004 1.005
Continuous enrollment in secondary mathematics 0.187*** (0.009) 1.185 1.206 1.227
Early entry to algebra -0.913*** (0.050) 0.364 0.401 0.443
Graduation credit requirements in mathematics 0.047*** (0.006) 1.036 1.048 1.061
Notes: R2=.073 (Cox & Snell), .098 (Nagelkerke), 2(7)=22055.8, ***p<0.001, cases correctly classified=61.3%, and weighted (true) N 291K(1.5K).
Jeremy Zelkowski
15
Table 2
Analysis of the Full NELS Population with PSE
95% CI for Exp( )
Variables Included (SE) Lower Exp( ) Upper
Constant -1.377*** (0.028) 0.252
SES in 12th grade 0.827*** (0.003) 2.273 2.287 2.302
8th grade NELS mathematics score 0.017*** (0.000) 1.016 1.017 1.017
Highest math course completed in HS 0.362*** (0.002) 1.429 1.436 1.442
Overall academic intensity 0.065*** (0.000) 1.066 1.067 1.068
Continuous enrollment in secondary mathematics -0.237*** (0.005) 0.782 0.789 0.796
Early entry to algebra -0.843*** (0.025) 0.410 0.431 0.453
Graduation credit requirements in mathematics -0.061*** (0.003) 0.935 0.941 0.947
Notes: R2=.292 (Cox & Snell), .390 (Nagelkerke), 2(7)=451011.8, ***p<0.001, cases correctly classified=73.6%, and weighted N 1.31M, true N 6.9K.
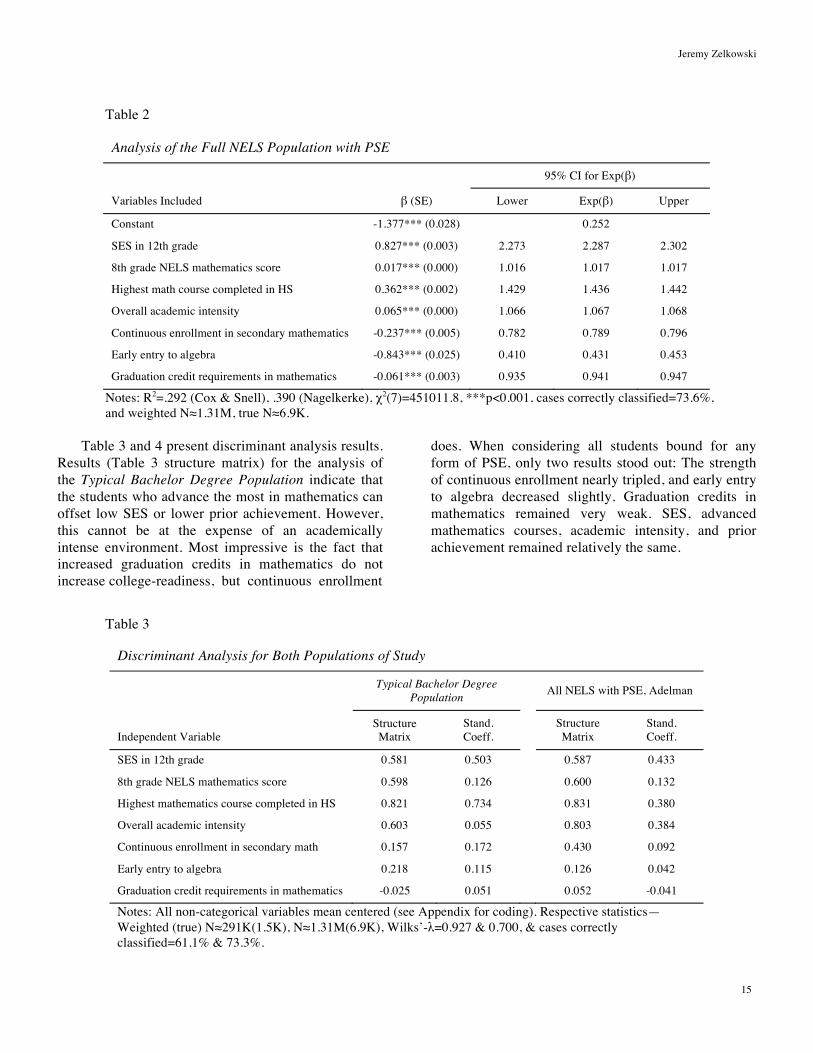
Table 3 and 4 present discriminant analysis results.
Results (Table 3 structure matrix) for the analysis of the Typical Bachelor Degree Population indicate that the students who advance the most in mathematics can offset low SES or lower prior achievement. However, this cannot be at the expense of an academically intense environment. Most impressive is the fact that increased graduation credits in mathematics do not increase college-readiness, but continuous enrollment
does. When considering all students bound for any form of PSE, only two results stood out: The strength of continuous enrollment nearly tripled, and early entry to algebra decreased slightly. Graduation credits in mathematics remained very weak. SES, advanced mathematics courses, academic intensity, and prior achievement remained relatively the same.
Table 3
Discriminant Analysis for Both Populations of Study
Typical Bachelor Degree
Population
All NELS with PSE, Adelman
Independent Variable Structure Matrix
Stand. Coeff.
Structure Matrix
Stand. Coeff.
SES in 12th grade 0.581 0.503 0.587 0.433
8th grade NELS mathematics score 0.598 0.126 0.600 0.132
Highest mathematics course completed in HS 0.821 0.734 0.831 0.380
Overall academic intensity 0.603 0.055 0.803 0.384
Continuous enrollment in secondary math 0.157 0.172 0.430 0.092
Early entry to algebra 0.218 0.115 0.126 0.042
Graduation credit requirements in mathematics -0.025 0.051 0.052 -0.041
Notes: All non-categorical variables mean centered (see Appendix for coding). Respective statistics—Weighted (true) N 291K(1.5K), N 1.31M(6.9K), Wilks’- =0.927 & 0.700, & cases correctly classified=61.1% & 73.3%.
Maximizing College-Readiness
16
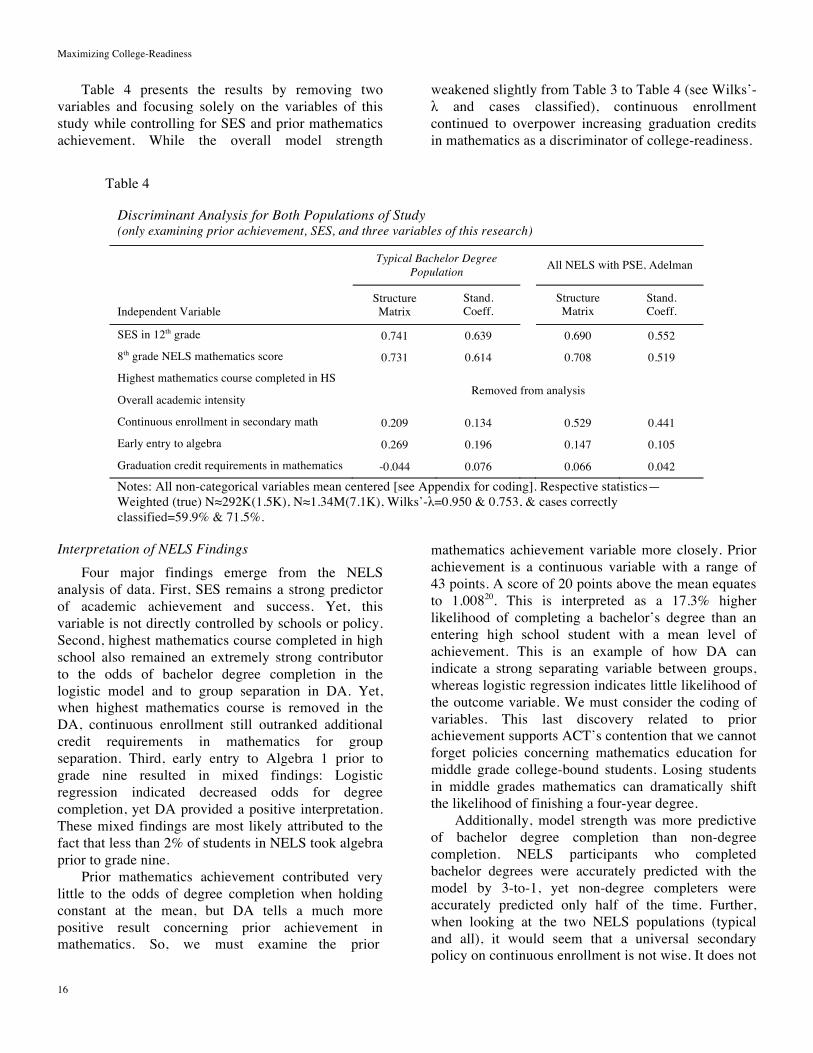
Table 4 presents the results by removing two variables and focusing solely on the variables of this study while controlling for SES and prior mathematics achievement. While the overall model strength
weakened slightly from Table 3 to Table 4 (see Wilks’- and cases classified), continuous enrollment
continued to overpower increasing graduation credits in mathematics as a discriminator of college-readiness.
Table 4
Discriminant Analysis for Both Populations of Study (only examining prior achievement, SES, and three variables of this research)
Typical Bachelor Degree
Population
All NELS with PSE, Adelman
Independent Variable Structure Matrix
Stand. Coeff.
Structure Matrix
Stand. Coeff.
SES in 12th grade 0.741 0.639 0.690 0.552
8th grade NELS mathematics score 0.731 0.614 0.708 0.519
Highest mathematics course completed in HS
Overall academic intensity Removed from analysis
Continuous enrollment in secondary math 0.209 0.134 0.529 0.441
Early entry to algebra 0.269 0.196 0.147 0.105
Graduation credit requirements in mathematics -0.044 0.076 0.066 0.042
Notes: All non-categorical variables mean centered [see Appendix for coding]. Respective statistics—Weighted (true) N 292K(1.5K), N 1.34M(7.1K), Wilks’- =0.950 & 0.753, & cases correctly classified=59.9% & 71.5%.
Interpretation of NELS Findings
Four major findings emerge from the NELS analysis of data. First, SES remains a strong predictor of academic achievement and success. Yet, this variable is not directly controlled by schools or policy. Second, highest mathematics course completed in high school also remained an extremely strong contributor to the odds of bachelor degree completion in the logistic model and to group separation in DA. Yet, when highest mathematics course is removed in the DA, continuous enrollment still outranked additional credit requirements in mathematics for group separation. Third, early entry to Algebra 1 prior to grade nine resulted in mixed findings: Logistic regression indicated decreased odds for degree completion, yet DA provided a positive interpretation. These mixed findings are most likely attributed to the fact that less than 2% of students in NELS took algebra prior to grade nine.
Prior mathematics achievement contributed very little to the odds of degree completion when holding constant at the mean, but DA tells a much more positive result concerning prior achievement in mathematics. So, we must examine the prior
mathematics achievement variable more closely. Prior achievement is a continuous variable with a range of 43 points. A score of 20 points above the mean equates to 1.00820. This is interpreted as a 17.3% higher likelihood of completing a bachelor’s degree than an entering high school student with a mean level of achievement. This is an example of how DA can indicate a strong separating variable between groups, whereas logistic regression indicates little likelihood of the outcome variable. We must consider the coding of variables. This last discovery related to prior achievement supports ACT’s contention that we cannot forget policies concerning mathematics education for middle grade college-bound students. Losing students in middle grades mathematics can dramatically shift the likelihood of finishing a four-year degree.
Additionally, model strength was more predictive of bachelor degree completion than non-degree completion. NELS participants who completed bachelor degrees were accurately predicted with the model by 3-to-1, yet non-degree completers were accurately predicted only half of the time. Further, when looking at the two NELS populations (typical and all), it would seem that a universal secondary policy on continuous enrollment is not wise. It does not
Jeremy Zelkowski
17
appear to benefit non-four-year degree seekers as much as the typical four-year degree seeking student. Thus, continuous enrollment is more appropriate as a college-readiness policy. It is possible continuous enrollment in mathematics may be better implemented in schools and districts for a college-preparatory diploma or curriculum or from higher education institutions through admissions standards, as was recently implemented in Maryland (Maryland Department of Education, 2010).
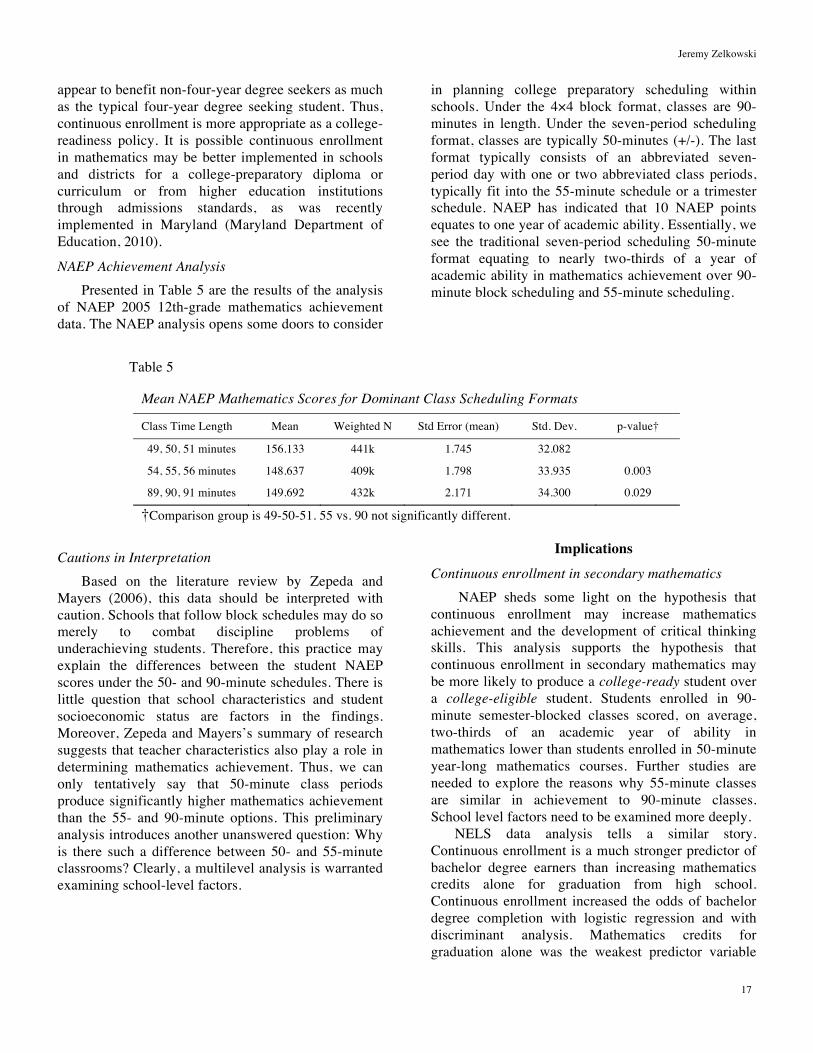
NAEP Achievement Analysis
Presented in Table 5 are the results of the analysis of NAEP 2005 12th-grade mathematics achievement data. The NAEP analysis opens some doors to consider
in planning college preparatory scheduling within schools. Under the 4 4 block format, classes are 90-minutes in length. Under the seven-period scheduling format, classes are typically 50-minutes (+/-). The last format typically consists of an abbreviated seven-period day with one or two abbreviated class periods, typically fit into the 55-minute schedule or a trimester schedule. NAEP has indicated that 10 NAEP points equates to one year of academic ability. Essentially, we see the traditional seven-period scheduling 50-minute format equating to nearly two-thirds of a year of academic ability in mathematics achievement over 90-minute block scheduling and 55-minute scheduling.
Table 5
Mean NAEP Mathematics Scores for Dominant Class Scheduling Formats
Class Time Length Mean Weighted N Std Error (mean) Std. Dev. p-value†
49, 50, 51 minutes 156.133 441k 1.745 32.082
54, 55, 56 minutes 148.637 409k 1.798 33.935 0.003
89, 90, 91 minutes 149.692 432k 2.171 34.300 0.029
†Comparison group is 49-50-51. 55 vs. 90 not significantly different.
Cautions in Interpretation
Based on the literature review by Zepeda and Mayers (2006), this data should be interpreted with caution. Schools that follow block schedules may do so merely to combat discipline problems of underachieving students. Therefore, this practice may explain the differences between the student NAEP scores under the 50- and 90-minute schedules. There is little question that school characteristics and student socioeconomic status are factors in the findings. Moreover, Zepeda and Mayers’s summary of research suggests that teacher characteristics also play a role in determining mathematics achievement. Thus, we can only tentatively say that 50-minute class periods produce significantly higher mathematics achievement than the 55- and 90-minute options. This preliminary analysis introduces another unanswered question: Why is there such a difference between 50- and 55-minute classrooms? Clearly, a multilevel analysis is warranted examining school-level factors.
Implications
Continuous enrollment in secondary mathematics
NAEP sheds some light on the hypothesis that continuous enrollment may increase mathematics achievement and the development of critical thinking skills. This analysis supports the hypothesis that continuous enrollment in secondary mathematics may be more likely to produce a college-ready student over a college-eligible student. Students enrolled in 90-minute semester-blocked classes scored, on average, two-thirds of an academic year of ability in mathematics lower than students enrolled in 50-minute year-long mathematics courses. Further studies are needed to explore the reasons why 55-minute classes are similar in achievement to 90-minute classes. School level factors need to be examined more deeply.
NELS data analysis tells a similar story. Continuous enrollment is a much stronger predictor of bachelor degree earners than increasing mathematics credits alone for graduation from high school. Continuous enrollment increased the odds of bachelor degree completion with logistic regression and with discriminant analysis. Mathematics credits for graduation alone was the weakest predictor variable
Maximizing College-Readiness
18
but significant. NELS is from a time where block period schedules were virtually absent from all high schools in America. The Educational Longitudinal Study (ELS), the current NCES longitudinal study, will shed much more light on college readiness related to secondary mathematics and scheduling formats. That study will be completed in 2012 or 2013 at the earliest for post-secondary attainment examination.
Changing Mathematics to be Socially Acceptable
In the US it is acceptable to say “I am not good at math”, “I hate math” or “Don’t worry honey [parent referring to child], I was not good at math either, so it is ok for you too.” However, you will rarely, if ever, hear someone admit in our society that they cannot read. We would be embarrassed if we could not read, but we are eager at times to admit poor mathematics skills and understanding. If we want society to begin to shift away from the socially accepted norms regarding mathematics and embrace the critical thinking skills that can be enhanced in the mathematics classroom, then we need to parallel policies for English, literacy, and reading. If we require nearly all U.S. high school students to be enrolled continuously in Language Arts, then should we not be doing the same with mathematics? Rather than focus on accumulated credits, we should focus on the continuous development of critical thinking skills through challenging mathematics classes. Students may revolt from fear of a lowered GPA. Parents and teachers may also dislike such a policy. However, the data presented in this paper tells a significant story in support of this position. In the United States, secondary mathematics achievement, college-readiness, and bachelor degree completion rates are not at acceptable levels. This research supports the contention that continuous enrollment in secondary mathematics increases mathematics achievement and the likelihood of bachelor degree completion more so than does the accumulation of high school mathematics credits.
This research paper supports the notion that mathematics in secondary schools, in preparing tomorrow’s college bound students, should parallel English language arts in the continuous development of critical thinking skills through rigorous coursework during all four years of high school. In the future, research is planned using NAEP in a multilevel fashion where school and student level characteristics are considered. NELS and ELS (once completed in 2012-2013) comparisons will provide insight as to how block schedules have changed college readiness for the better or worse over the last two decades.
i Four-by-four block scheduling refers to the school format
of classes where students take a full Carnegie credit in half the school year (semester) typically offered as daily 90-minute classes. Students can complete eight Carnegie credits in one full academic school year. Traditionally, before block scheduling appeared in United States schools, full Carnegie credit courses were completed during an entire school year in daily 45-60 minute classes, referred to as traditional period scheduling formats.
ii ACT, Inc., formerly America College Testing, is one of two predominant “college-readiness” or “college-predictive” tests used in the United States for college entrance. SAT, or the Scholastic Aptitude or Assessment Test, is the other.
iii NAEP-HSTS 2005—National Assessment of Education Progress High School Transcript Study of 2005.
References
ACT, Inc. (2005). Courses count: Preparing students for postsecondary success. Iowa city, IA: Author.
Adams, D. C., & Salvaterra, M. E. (1998). Structural and teacher changes: Necessities for successful block scheduling. High School Journal, 81(2), 98–106.
Adelman, C. (1999). Answers in the toolbox: Academic intensity, attendance patterns, and bachelor's degree attainment. Washington, DC: U.S. Department of Education, Institute of Educational Sciences.
Adelman, C. (2003). Postsecondary attainment, attendance, curriculum, and performance: Selected results from the NELS: 88/2000 postsecondary transcript study (PETS), 2000. Washington, DC: U.S. Department of Education, Institute of Educational Sciences.
Adelman, C. (2004). Principal indicators of student academic histories in postsecondary education, 1972-2000. Washington, DC: U.S. Department of Education, Institute of Educational Sciences.
Adelman, C. (2006). The toolbox revisited: Paths to degree completion from high school through college. Washington, DC: U.S. Department of Education, Institute Educational Sciences.
Aldeman, C. (2010). College- and career-ready: Using outcomes data to hold high schools accountable for student success. Washington, DC: Education Sector.
Attewell, P., Lavin, D., Domina, T., & Levey, T. (2006). New evidence on college remediation. The Journal of Higher Education, 77, 886–924.
Bargman, R.E. (1970). Interpretation and use of a generalized discriminant function. In R.C. Bose et al. (Eds.), Essays in probability and statistics. Chapel Hill: University of North Carolina Press.
Bray, J.H. & Maxwell, S.E. (1985). Multivariate analysis of variance. Sage University paper series on quantitative applications in the social sciences, 07-054. Newbury Park, CA.
Browne, M. N., Haas, P. F., Vogt, K. E., & West, J. S. (1977). Design and implementation of an evaluation procedure for an innovative undergraduate program. College Student Journal, 11(4), 1–10.
Jeremy Zelkowski
19
Buckman, D., King, B., & Ryan, S. (1995). Block scheduling: A means to improve school climate. NASSP Bulletin, 79(571), 1–65.
Cobb, R. B., Abate, S., & Baker, D. (1999). Effects on students of a 4 4 junior high school block scheduling program. Education Policy Analysis Archives, 7(3), 1–23.
Conley, D. (2005). College knowledge: What it really takes for students to succeed and what we can do to get them ready. Indianapolis, IN: Jossey-Bass.
Duel, L. S. (1999). Block scheduling in large, urban high schools: Effects on academic achievement, student behavior, and staff perceptions. High School Journal, 83(1), 14–25.
Education Commission of the States (ECS). (2007). State notes: High school graduation requirements—Mathematics. Retrieved April 29, 2009 from http://mb2.ecs.org/reports/Report.aspx?id=900
Education Commission of the States (ECS). (n.d.). State notes: Standard high school graduation requirements (50-state). Retrieved April 20, 2010 from http://mb2.ecs.org/reports/Report.aspx?id=735
Ennis, R. H. (1993). Critical thinking assessment. Theory Into Practice, 32, 179–186.
Evans, W., Tokarczyk, J., Rice, S., & McCray, A. (2002). Block scheduling: An evaluation of outcomes and impact. Clearing House, 75, 319–323.
Facione, P. A., & Facione, N. C. (1994). The California Critical Thinking Skills Test: Test manual. Millbrae: The California Academic Press.
Fletcher, R. K. (1997). A study of the block scheduling movement in six high schools in the Upper Cumberland Region of Tennessee. Paper presented at the annual meeting of the Tennessee Academy of Science, Sewanee, TN.
Glaser, E. M. (1941). An experiment in the development of critical thinking. New York: Teachers College, Columbia University.
Gruber, C., & Onwuegbuzie, A. J. (2001). Effects of block scheduling on academic achievement among high school students. High School Journal, 84(4), 32–42.
Hamdy, M., & Urich, T. (1998). Perceptions of teachers in South Florida toward block scheduling. NASSP Bulletin, 82(596), 79–82.
Horn, L. (2006). Placing college graduation rates in context: How 4-year college graduation rates vary with selectivity and the size of low-income enrollment (NCES 2007-161). Washington, DC: U.S. Department of Education, NCES.
Hoyt, J.E., & Sorensen, C.T. (2001). High school preparation, placement testing, and college remediation. Journal of Developmental Education, 25(2), 26–34.
Hurley, J.C. (1997). The 4 4 block scheduling model: What do students have to say about it? NASSP Bulletin, 81(593), 53–72.
Jacobson, K.G. (2000, April). Central tensions: A critical framework for examining high school mathematics and mathematics education. Paper presented at the annual meeting of the American Educational Research Association, New Orleans, LA.
Jenkins, E., Queen, A., & Algozzine, B. (2002). To block or not to block: That’s not the question. Journal of Educational Research, 95, 196–202.
Jones, E. A., & Ratcliff, G. (1993). Critical thinking skills for college students. University Park, PA: National Center on Postsecondary Teaching, Learning, and Assessment. (ERIC Document ED358772)
Khazzaka, J. (1998). Comparing the merits of a seven period school day to those of a four period school day. High School Journal, 81(2), 87–97.
Knapp, L. G., Kelly-Reid, J. E., and Ginder, S. A. (2010). Enrollment in postsecondary institutions, Fall 2008; graduation rates, 2002 & 2005 cohorts; and financial statistics, Fiscal Year 2008 (NCES 2010-152). Washington, DC: U.S. Department of Education, NCES. Retrieved May 26, 2010 from http://nces.ed.gov/pubsearch.
Knight, S. L., De Leon, N. J., & Smith, R. G. (1999). Using multiple data sources to evaluate an alternative scheduling model. High School Journal, 83(1), 1–13.
Lare, D., Jablonski, A. M., & Salvaterra, M. (2002). Block scheduling: Is it cost effective? NASSP Bulletin, 86(630), 54–71.
Lawrence, W. W., & McPherson, D. D. (2000). A comparative study of block scheduling and traditional scheduling on academic achievement. Journal of Instructional Psychology, 27, 178–182.
Maryland Department of Education (2010). Maryland Department of Education webpage. Retrieved online April 30, 2010, from http://www.marylandpublicschools.org/MSDE
Michigan Department of Education (2006). Michigan’s K-12 curriculum and standards webpage. Retrieved online October 31, 2009, from http://www.michigan.gov/documents/mde/New_MMC_one_pager_11.15.06_183755_7.pdf
Moses, R.P. (1994). Remarks on the struggle for citizenship and math/science literacy. Journal of Mathematical Behavior, 13, 107–111.
National Center for Education Statistics (NCES). (2009). NAEP web data explorer. Available from the NCES Web site, http://nces.ed.gov/nationsreportcard/naepdata/
National Commission on Excellence in Education. (1983). A nation at risk: The imperative for educational reform. Washington, DC: Author. Retrieved November 30, 2007, from http://www.ed.gov/pubs/NatAtRisk/index.html
Norris, S. P. (1989). Can we test validly for critical thinking? Educational Researcher, 18(9), 16–21.
Norris, S. P. (1990). Effect of eliciting verbal reports of thinking on critical thinking test performance. Journal of Educational Measurement, 27(1), 41–58.
Norris, S. P. (1992). A demonstration of the use of verbal reports of thinking in multiple-choice critical thinking test design. The Alberta Journal of Educational Research, 38, 155–176.
Pisapia, J., & Westfall, A. L. (1997). Alternative high school scheduling: Student achievement and behavior. Richmond, VA: Metropolitan Educational Research Consortium. (ERIC Document Reproduction Services No. ED411337)
Queen, J. A., Algozzine, B., & Eaddy, M. A. (1997). The road we traveled: Scheduling in the 4 4 block. NASSP Bulletin, 81(588), 88–99.
Rech, J. F. & Harrington, J. (2000). Algebra as a gatekeeper: A descriptive study at an urban university. Journal of African American Men, 4(4), 63–71.
Maximizing College-Readiness
20
Salvaterra, M., Lare, D., Gnall, J., & Adams, D. (1999). Block scheduling: Students’ perception of readiness for college math, science, and foreign language. American Secondary Education, 27(4), 13–21.
Silva, C. M. & Moses, R. P. (1990). The algebra project: Making middle school mathematics count. Journal of Negro Education, 59, 375–391.
Snyder, D. (1997). 4-block scheduling: A case study of data analysis of one high school after two years. Paper presented at the annual meeting of the Mid-West Educational Research Association, Chicago.
Sparapani, E.F. (1998). Encouraging thinking in high school and middle school: Constraints and possibilities. Clearing House, 71(5), 274–276.
Stader, D. L. (2001). Block scheduling in small high schools: Perceptions from the field. Rural Educator, 22(3), 37–41.
Tennessee Department of Education. (2009). Tennessee diploma project: Graduation requirements. Retrieved October 31, 2009, from http://www.tennessee.gov/education/gradreq.shtml and http://tennessee.gov/sbe/TDP%201-23-08.pdf (slide 25).
Thomas S. & Heck, H. (2001). Analysis of large-scale secondary data in higher education research: Potential perils associated with complex sampling designs. Research in Higher Education, 42, 517–540.
Thomas, S., Heck, R., & Bauer, K. (2005). Weighting and adjusting for design effects in secondary data analyses. New Directions for Institutional Research, 2005(127), 51–72.
Thompson, G., & Joshua-Shearer, M. (2002). In retrospect: What college undergraduates say about their high school education. High School Journal, 85(4), 15.
Williams, R., & Worth, S. (2001, September 1). The relationship of critical thinking to success in college. Inquiry: Critical Thinking across the Disciplines, 21(1), 5–16.
Zepeda, S. & Mayers, R.S. (2006). An analysis of research on block scheduling. Review of Educational Research, 76(1), 137–170.
Zelkowski, J. (2008, Aug). Important secondary mathematics enrollment factors that influence the completion of a bachelor's degree (Doctoral Dissertation, Ohio University, 2008). Dissertation Abstracts International, 69(01), 3490. (UMI No. AAT 3327152)
Jeremy Zelkowski
21
Appendix
Student SES @ 12th grade – NELS variable code F2SES3, mean-centered 8th grade math achievement – NELS variable code BY2XMSTD, mean-centered Overall academic intensity – NELS PETS code ACLEVEL, reverse coded low to high High math – NELS PETS code HIGH MATH, coded 6-calculus, 5-precalc, 4-trig, 3-algebra2, 2-geometry, 1-algebra1,
0-below algebra1 Continuous enrollment in math – Coded “1” using transcript data if student received a letter grade (A,B,C,D,E,F) each
term of high school on transcript. W or no grade coded “0” Early entry to algebra-1 – Coded “1” if transcript data indicated letter grade received prior to grade nine in algebra-1 Graduation credits in math – NELS variable code F1C70B, recoded 4=4yrs, 3=3yrs, 2=2yrs, 1=1yr, 0=<1yr, -1=none