Embed Size (px)
Citation preview

FINAL VERSION
Section 2: Identification and classification
Obesity: full guidance FINAL VERSION (December 2006) Page 196

FINAL VERSION
Identification and classification
5.1 A: Clinical
5.1.1 Evidence statements
5.1.1.1 Children (Table 5.1)
Table 5.1 Evidence statements and grading No. Evidence statement Grade
Body mass index (BMI)
1 BMI is a widely accepted and practical estimate of
general adiposity in children
2++
2 Different classifications using BMI centile cut-offs have
been proposed for children, but there is no evidence
on which are the most appropriate in practice
2++
3 There is limited evidence on which BMI measure (BMI,
percentage change BMI, BMI z-score or BMI centile)
is best at measuring adiposity change
3
4 Some evidence suggests that the IOTF/Cole and the
WHO BMI-based systems have high specificity which
can lead to fewer non-overweight adolescents being
classified as overweight
3
5 There is no evidence on ethnicity differences in the
association of proxy measures of obesity with
morbidity in children in UK populations
N/A
Obesity: full guidance FINAL VERSION (December 2006) Page 197

FINAL VERSION
No. Evidence statement Grade
Waist circumference
6 There is limited evidence on the utility of waist
circumference compared with BMI in children, but its
use is not widely accepted. Expert consensus is that
waist circumference alone is not recommended in
children, due to problems with measurement validity
and reliability
4 (expert
opinion)
1.1.7 There are no proposed evidence-based cut-offs for
waist circumference measurements in children
2++
Bioimpedance
8 There is no evidence on the utility of bioimpedance
compared with BMI in children
N/A
IOTF, International Obesity Taskforce; NA, not applicable; WHO, World Health Organization.
5.1.1.2 Adults (Table 5.2)
Table 5.2 Evidence statements and grading No. Evidence statement Grade
Body mass index (BMI)
1 BMI is a widely accepted measure of general
adiposity in adults
2++
2 Adults with a BMI of 25 kg/m2 or over are overweight.
Adults with a BMI of 30 kg/m2 or over are obese
2++
3 Further classifications of obesity by BMI in adults are
as follows:
Obesity, class I 30–34.9
Obesity, class II 35–39.9
Obesity, class III ≥40
4
Obesity: full guidance FINAL VERSION (December 2006) Page 198

FINAL VERSION
No. Evidence statement Grade
4 There is no accepted definition for classification using
BMI in older people.
2++
Waist circumference
5 Waist circumference is a useful measure of central
adiposity in adults
3
6 Men with a waist circumference of 94 cm or more are
at increased risk of health problems. If their waist
circumference is 102 cm or more, even at a healthy
weight (BMI 18.5–25 kg/m2) they are at increased risk
2++
7 Women with a waist circumference of 80 cm or more
are at increased risk of health problems. If their waist
circumference is 88 cm or more, even at a healthy
weight (BMI 18.5–25 kg/m2) they are at increased risk
2++
Other measurements
[The Guidance Development Group (GDG) wanted evidence on the diagnostic
accuracy of other anthropometric measurements and bioimpedance compared
with the gold standard of BMI.]
8 Waist-to-hip ratio is a useful measure of central
adiposity in adults, but is more difficult to measure
3
9 There is no evidence on the utility of bioimpedance
compared with BMI in adults
N/A
Opportunistic screening
10 There is no evidence on the effectiveness of
opportunistic screening
N/A
Different cut-offs in different ethnic groups
11 In first generation migrants from Pakistan to the UK, a
given BMI is associated with greater truncal adiposity
than in the white population
3
Obesity: full guidance FINAL VERSION (December 2006) Page 199
FINAL VERSION
No. Evidence statement Grade
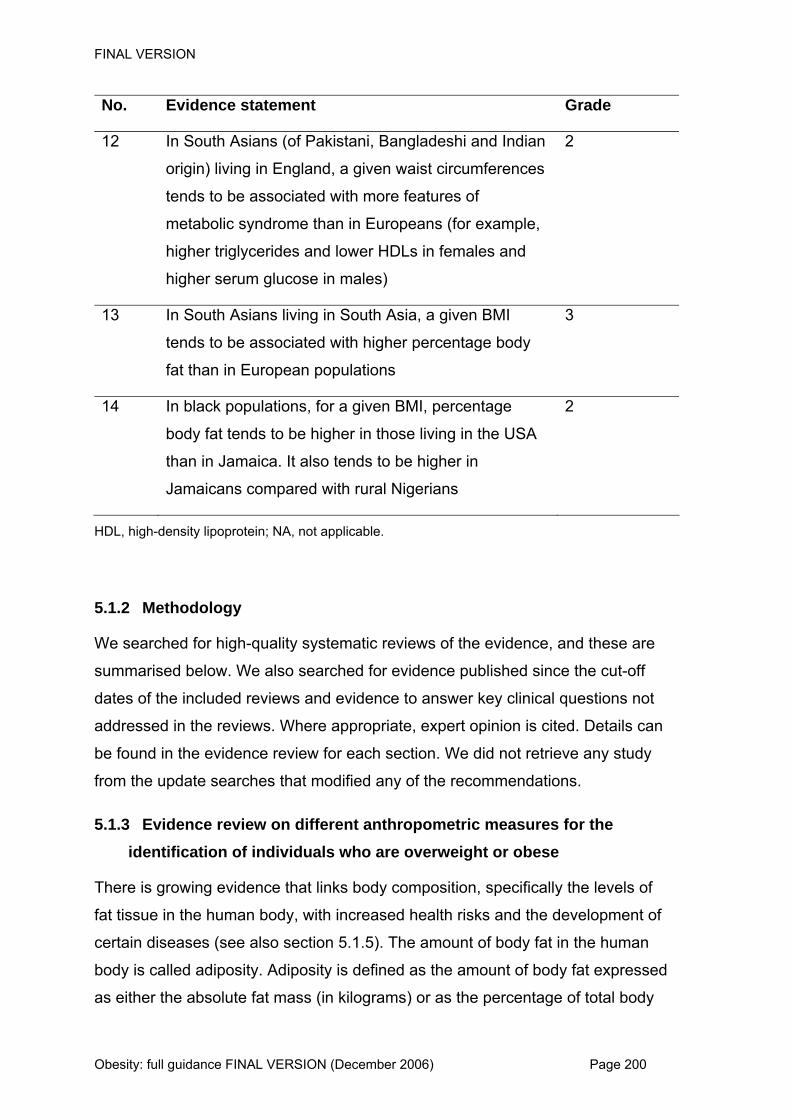
12 In South Asians (of Pakistani, Bangladeshi and Indian
origin) living in England, a given waist circumferences
tends to be associated with more features of
metabolic syndrome than in Europeans (for example,
higher triglycerides and lower HDLs in females and
higher serum glucose in males)
2
13 In South Asians living in South Asia, a given BMI
tends to be associated with higher percentage body
fat than in European populations
3
14 In black populations, for a given BMI, percentage
body fat tends to be higher in those living in the USA
than in Jamaica. It also tends to be higher in
Jamaicans compared with rural Nigerians
2
HDL, high-density lipoprotein; NA, not applicable.
5.1.2
5.1.3
Methodology
We searched for high-quality systematic reviews of the evidence, and these are
summarised below. We also searched for evidence published since the cut-off
dates of the included reviews and evidence to answer key clinical questions not
addressed in the reviews. Where appropriate, expert opinion is cited. Details can
be found in the evidence review for each section. We did not retrieve any study
from the update searches that modified any of the recommendations.
Evidence review on different anthropometric measures for the identification of individuals who are overweight or obese
There is growing evidence that links body composition, specifically the levels of
fat tissue in the human body, with increased health risks and the development of
certain diseases (see also section 5.1.5). The amount of body fat in the human
body is called adiposity. Adiposity is defined as the amount of body fat expressed
as either the absolute fat mass (in kilograms) or as the percentage of total body
Obesity: full guidance FINAL VERSION (December 2006) Page 200

FINAL VERSION
mass. Absolute adiposity is highly correlated with body mass, but percentage
adiposity is relatively uncorrelated with body mass.1
There are many methods of directly measuring the amount of fat in the human
body. These usually involve complicated procedures that can only be carried out
in specialist laboratories.
Indirect methods, based on the relation between height and weight, can be used
in everyday clinical practice to estimate adiposity. The most common and
accepted, at least in adults, measures are those of body mass index (BMI) and
waist circumference.
BMI is calculated as the weight (in kilograms) divided by the height (in metres)
squared. For example, an individual who weighs 95 kg and is 180 cm tall has a
BMI = 95/(1.80 × 1.80) = 95/3.24 = 29.32 kg/m2. So the person’s BMI is
approximately 29 kg/m2.
A simple measure of fat distribution is waist circumference. This can be related to
the overall body shape of the individual by calculating the ratio of the waist to the
hip (waist-to-hip ratio).
Different methods may be appropriate in different circumstances. For example,
waist-to-hip ratio may be the most accurate predictor of risk of myocardial
infarction,2 and waist circumference may be the most accurate predictor of risk of
type 2 diabetes.3
5.1.3.1 Identification and measurement of children who are overweight or
obese
We were not able to find any other systematic reviews that addressed the
accuracy of anthropometric measures or bioimpedance to diagnose obesity
compared with the use of BMI in children.
The National Health and Medical Research Council (Australia) (NHMRC)4 stated
that although there was no evidence to recommend specific cut-offs, it
recommended that BMI should be the standard measure for children. BMI is a
measure of weight adjusted for height and is highly correlated with adiposity.
Obesity: full guidance FINAL VERSION (December 2006) Page 201
FINAL VERSION
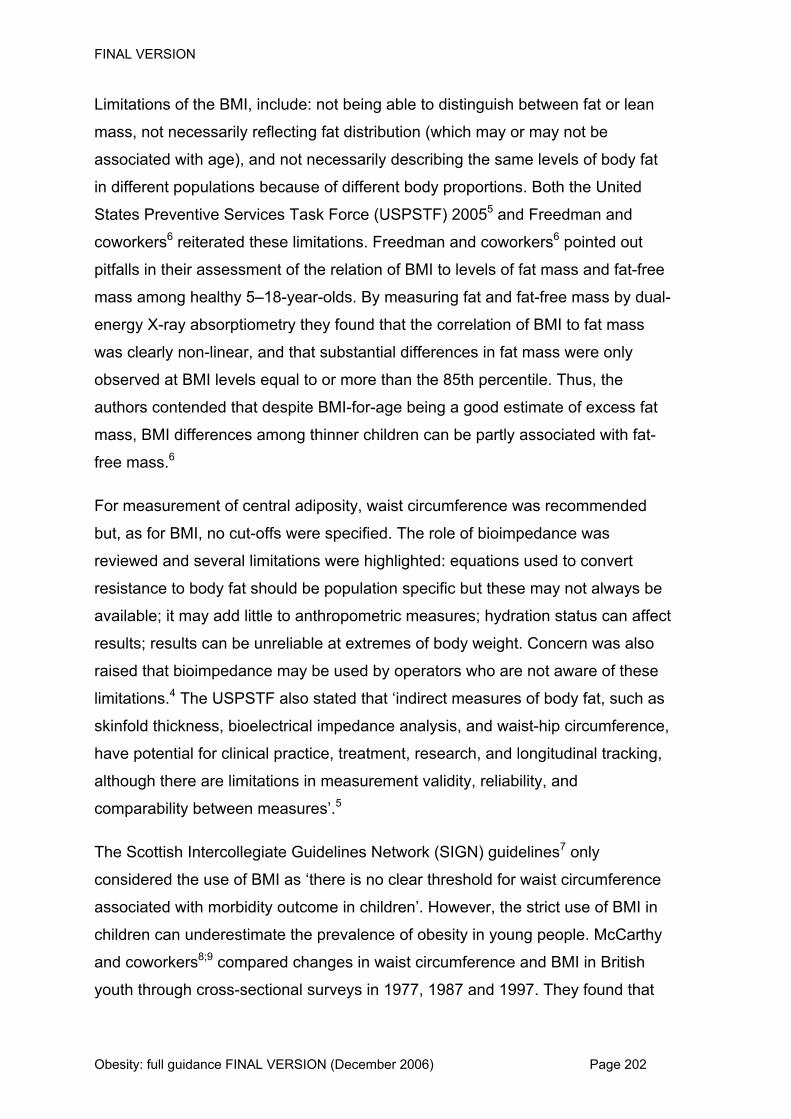
Limitations of the BMI, include: not being able to distinguish between fat or lean
mass, not necessarily reflecting fat distribution (which may or may not be
associated with age), and not necessarily describing the same levels of body fat
in different populations because of different body proportions. Both the United
States Preventive Services Task Force (USPSTF) 20055 and Freedman and
coworkers6 reiterated these limitations. Freedman and coworkers6 pointed out
pitfalls in their assessment of the relation of BMI to levels of fat mass and fat-free
mass among healthy 5–18-year-olds. By measuring fat and fat-free mass by dual-
energy X-ray absorptiometry they found that the correlation of BMI to fat mass
was clearly non-linear, and that substantial differences in fat mass were only
observed at BMI levels equal to or more than the 85th percentile. Thus, the
authors contended that despite BMI-for-age being a good estimate of excess fat
mass, BMI differences among thinner children can be partly associated with fat-
free mass.6
For measurement of central adiposity, waist circumference was recommended
but, as for BMI, no cut-offs were specified. The role of bioimpedance was
reviewed and several limitations were highlighted: equations used to convert
resistance to body fat should be population specific but these may not always be
available; it may add little to anthropometric measures; hydration status can affect
results; results can be unreliable at extremes of body weight. Concern was also
raised that bioimpedance may be used by operators who are not aware of these
limitations.4 The USPSTF also stated that ‘indirect measures of body fat, such as
skinfold thickness, bioelectrical impedance analysis, and waist-hip circumference,
have potential for clinical practice, treatment, research, and longitudinal tracking,
although there are limitations in measurement validity, reliability, and
comparability between measures’.5
The Scottish Intercollegiate Guidelines Network (SIGN) guidelines7 only
considered the use of BMI as ‘there is no clear threshold for waist circumference
associated with morbidity outcome in children’. However, the strict use of BMI in
children can underestimate the prevalence of obesity in young people. McCarthy
and coworkers8;9 compared changes in waist circumference and BMI in British
youth through cross-sectional surveys in 1977, 1987 and 1997. They found that
Obesity: full guidance FINAL VERSION (December 2006) Page 202

FINAL VERSION
trends in waist circumference significantly exceeded the figures for BMI in the
past 10–20 years. Another study published by Rudolf and coworkers,10 followed a
cohort of British schoolchildren for 6 years, and found that both BMI and waist
circumference increased significantly.
The clinical practice guidelines of the Ministry of Health of Singapore
recommended BMI-for-age and gender charts to be used in children.11
A recent study published by Neovius and coworkers12 in which a cross-sectional
analysis was performed in 474 healthy adolescents aged 17 years, showed that
both BMI and waist circumference had strong correlation with percentage body
fatness in both girls and boys, but that the correlation was not so apparent for
waist to hip ratio. Moving on from this the authors contended that for BMI and
waist circumference, sensitive and specific cut-offs of obesity can be derived,
whilst larger trade-offs were required to detect overweight in girls.
5.1.3.2 Identification and measurement of adults who are overweight or
obese
The NHMRC13 reviewed the evidence for different anthropometric measures in
the identification of overweight or obesity in adults.
On the basis of the evidence, the NHMRC concluded that:
BMI was highly, but not perfectly, correlated with adiposity
limitations of the BMI included not being able to distinguish between fat or
lean mass, not necessarily reflecting fat distribution (which may or may not be
associated with age), and not necessarily describing the same levels of body
fat in different populations because of different body proportions.
Because of these limitations, they recommended that:
‘BMI is an acceptable approximation of total body fat at the population level and can be used to estimate the relative risk of disease in most people. However, it is not always an accurate predictor of body fat or fat distribution, particularly in muscular individuals, because of differences in body-fat proportions and distribution.’ 13
Obesity: full guidance FINAL VERSION (December 2006) Page 203

FINAL VERSION
The evidence on waist circumference showed a positive correlation with risk of
disease. However, when the BMI was greater than 35 kg/m2, waist circumference
did not add to the absolute measure of risk. The conclusions reached were:
‘waist circumference is a valid measure of abdominal fat mass and disease risk in individuals with a BMI less than 35. If BMI is 35 or more, waist circumference adds little to the absolute measure of risk provided by BMI.’13
No evidence on the use of bioimpedance was reported.
Similarly, the National Institutes of Health (NIH) guidelines14 found that BMI gave
a reasonable approximation of adiposity in most people and that waist
circumference was the most practical measurement for assessing abdominal fat.
Again, bioimpedance was not considered.14
In older people,15 the evidence was summarised as follows:
‘Primary limitations to use of BMI in diagnosing obesity in the elderly include a lower correlation with percentage body fat in the old than in the young, and a weaker association with cardiovascular mortality, as well as several intermediaries of cardiovascular morbidity than measures of central adiposity (waist circumference or waist-to-hip ratio). While the correlation between BMI and body fat percentage drops with age, most data show a reasonable correlation persists. In addition, body fat percentage is generally more closely correlated with BMI or waist circumference than other common obesity diagnostic tests in the elderly. Likewise, BMI is the diagnostic measure linked with the broadest range of subsequent health states. Some of these outcomes (e.g., incident functional disability) have not been evaluated by waist-to-hip ratio or waist circumference; others (e.g., hip fracture incidence in women) are linked with BMI, but not with waist-to-hip ratio or waist circumference (likely reflecting that generalized, not central, obesity is important in their aetiology).’15
Obesity: full guidance FINAL VERSION (December 2006) Page 204

FINAL VERSION
We were not able to find any other systematic reviews that addressed the
accuracy of anthropometric measures or bioimpedance to diagnose obesity
compared with the gold standard of BMI in adults.
We found several primary studies that assessed the utility of waist circumference
and/or waist-to-hip ratio to classify people as obese or overweight compared with
classification by BMI.16-26
None of the included studies scored highly when quality assessed (using
diagnostic study criteria), as blinding was not done, which was assumed to be a
practical problem with this type of measurement. This may have affected the
accuracy of the measurements, particularly with waist circumference. However,
most studies did report that the assessors were trained, and in some cases, the
results were validated.
Overall, the utility of other measures compared with BMI varied, particularly with
sex and age. In general, the use of measures such as waist circumference or
waist-to-hip ratio only would not classify someone as overweight or obese who
was not. However, the use of these measures would miss a proportion of people
who were at increased risk if assessed using BMI alone. The use of waist-to-hip
ratio appeared to be less useful than waist circumference.
Since we initially reviewed the evidence, the National Guideline Clearing House
has produced a synthesis of guidelines relating to obesity in adults,27 and a
comparison of the different recommendations relating to measurement can be
seen in Table 5.3.
Table 5.3 Comparison of recommendations in the key measures (weight, body mass index (BMI), waist circumference)a
ACP (2005) No recommendations offered. ACP refers to the USPSTF
guidelines for screening for obesity in adults
ACPM
(2001)
Periodic measurement of BMI (weight in kilograms/height in
metres2) is recommended for all adults
Obesity: full guidance FINAL VERSION (December 2006) Page 205
FINAL VERSION
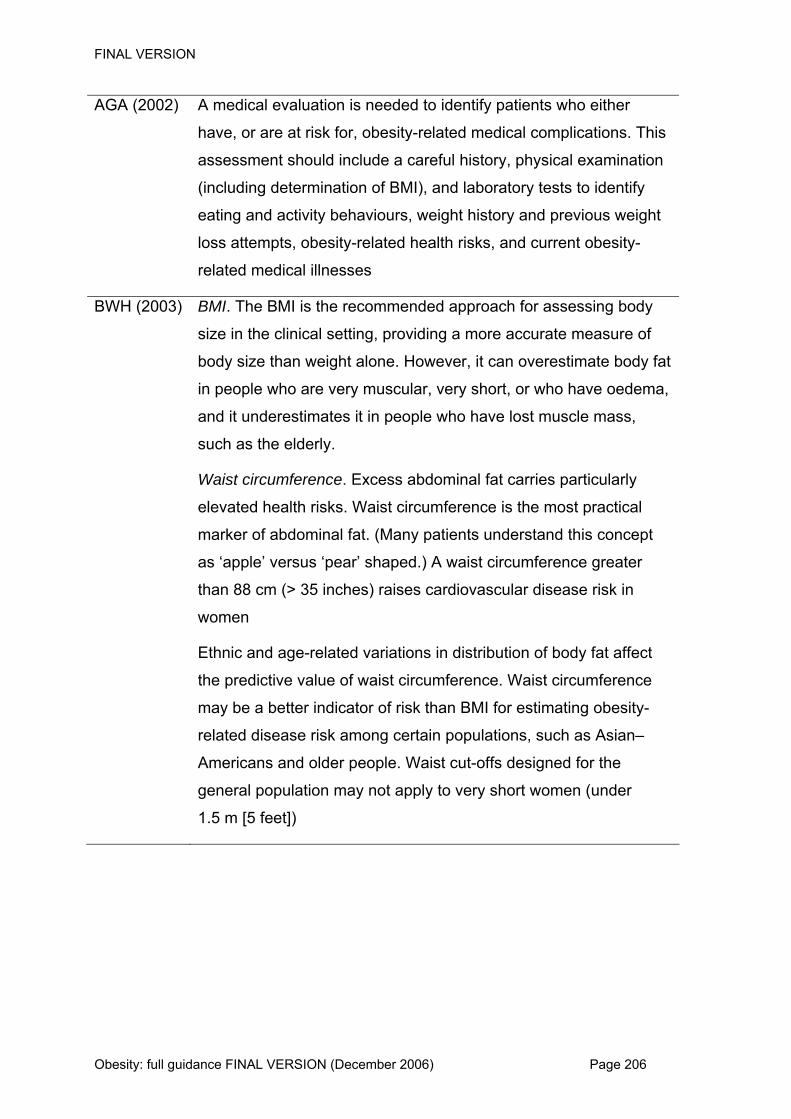
AGA (2002) A medical evaluation is needed to identify patients who either
have, or are at risk for, obesity-related medical complications. This
assessment should include a careful history, physical examination
(including determination of BMI), and laboratory tests to identify
eating and activity behaviours, weight history and previous weight
loss attempts, obesity-related health risks, and current obesity-
related medical illnesses
BWH (2003) BMI. The BMI is the recommended approach for assessing body
size in the clinical setting, providing a more accurate measure of
body size than weight alone. However, it can overestimate body fat
in people who are very muscular, very short, or who have oedema,
and it underestimates it in people who have lost muscle mass,
such as the elderly.
Waist circumference. Excess abdominal fat carries particularly
elevated health risks. Waist circumference is the most practical
marker of abdominal fat. (Many patients understand this concept
as ‘apple’ versus ‘pear’ shaped.) A waist circumference greater
than 88 cm (> 35 inches) raises cardiovascular disease risk in
women
Ethnic and age-related variations in distribution of body fat affect
the predictive value of waist circumference. Waist circumference
may be a better indicator of risk than BMI for estimating obesity-
related disease risk among certain populations, such as Asian–
Americans and older people. Waist cut-offs designed for the
general population may not apply to very short women (under
1.5 m [5 feet])
Obesity: full guidance FINAL VERSION (December 2006) Page 206

FINAL VERSION
Singapore
MOH (2004)
BMI is the recommended index to define overweight and obesity. It
is minimally correlated with height and highly correlated with body
fat percentage and levels of disease risk of comorbidities. Body
weight alone can be used to follow weight loss and to determine
efficacy of therapy (grade B, level III)
Waist circumference is the most practical anthropometric
measurement for assessing a patient's abdominal fat content
before and during weight loss treatment. Gender-specific waist
circumference cut-offs should be used in conjunction with BMI to
identify increased disease risk (grade B, level III)
USPSTF
(2003)
The USPSTF found good evidence that BMI, calculated as weight
in kilograms divided by height in metres squared, is reliable and
valid for identifying adults at increased risk for mortality and
morbidity due to overweight and obesity
Central adiposity increases the risk for cardiovascular and other
diseases independent of obesity. Clinicians may use the waist
circumference as a measure of central adiposity. Men with waist
circumferences greater than 102 cm (> 40 inches) and women with
waist circumferences greater than 88 cm (> 35 inches) are at
increased risk for cardiovascular disease. The waist circumference
thresholds are not reliable for patients with a BMI greater than 35
kg/m2
a Adapted from the National Guideline Clearinghouse guideline synthesis on the assessment and treatment of obesity and overweight in adults.27
ACP, American College of Physicians; ACPM, American College of Preventive Medicine; AGA, American Gastroenterological Association; BWH, Brigham and Women’s Hospital; MOH, Ministry of Health; USPSTF, United States Preventive Services Task Force.
5.1.3.3 Effectiveness of opportunistic screening on health outcomes
We did not find any guidelines that issued recommendations on the effectiveness
of opportunistic screening in the identification of people who are overweight or
obese.
Obesity: full guidance FINAL VERSION (December 2006) Page 207

FINAL VERSION
We identified randomised controlled trials (RCTs) from the Cochrane review28 on
improving management for people who are overweight or obese that may have
had an element of opportunistic screening in the intervention arm of the trial. Only
one was considered relevant, but follow-up was less than our inclusion criteria of
12 months so was subsequently excluded.29 We also searched for RCTs citing a
Little 1998 paper,30 which concluded that measurement of obesity in the general
population was not likely to improve risk assessment or patient knowledge
significantly. Again, no RCTs were identified that evaluated the effectiveness of
opportunistic screening.
Other policy initiatives GMS2 contract
Two indicators in the Quality and Outcomes Framework31 (QOF) of the revised
contract for general practitioners (GMS2) require an assessment of obesity:
OB1: The practice can produce a register of patients aged 16 and over with a BMI
greater than or equal to 30 in the previous 15 months.
DM 2 The percentage of patients with diabetes whose notes record BMI in the
previous 15 months.
The rationale given for DM 2 was that:
‘Weight control in overweight subjects with diabetes is associated with improved glycaemic control. There is little evidence to dictate the frequency of recording but it is general clinical practice that BMI is assessed at least annually.’31
National Service Frameworks
The National Service Framework for Coronary Heart Disease (www.dh.gov.uk)
stated that general practitioners and primary care teams should identify all people
with established cardiovascular disease and offer them appropriate advice and
treatment to reduce their risks.
Obesity: full guidance FINAL VERSION (December 2006) Page 208
FINAL VERSION
The National Service Framework for Diabetes (www.dh.gov.uk) stated that the
opportunistic screening of people with multiple risk factors for diabetes can lead
to the identification of some individuals with previously undiagnosed diabetes.
The rationale given for this was that:
‘People who have multiple risk factors for diabetes – family history, obesity, ethnic background, increasing age – also require advice and support to decrease their risk of developing diabetes and information about the symptoms and signs of diabetes. Moreover, opportunistic screening will identify those who are unaware of their condition. Opportunistic screening can help, although there is the need for a more systematic approach to administer screening.’
National Screening Committee
The National Screening Committee (www.nsc.nhs.uk) does not currently
recommend screening for obesity for children or adults.
5.1.4 Evidence review on the classification of overweight and obesity
[This is intended as a discussion paper to highlight any areas where there is
disagreement or controversy in the defined cut-offs used to classify people who
are overweight/obese. Because the associated key clinical question does not lend
itself easily to an evidence-based approach, we have referred to key references
which are mainly expert opinion and authoritative statements.]
5.1.4.1 Classification of overweight or obesity in children
Despite the rising problem of weight and weight-related problems among children,
there is no universally accepted classification system for childhood obesity. Thus,
the absence of a universally accepted measure causes difficulties in monitoring
the development of the obesity epidemic and for comparing between studies.32
Several attempts have been made to establish BMI-based classification systems,
although such systems are difficult to define with any precision. This problem is
related to children having less obesity-related disease than adults (in the short
term) and that the dose–response curve connecting obesity and outcome is linear
Obesity: full guidance FINAL VERSION (December 2006) Page 209

FINAL VERSION
over a wide range of adiposity in children (Cole and Rolland-Cachera cited by
Neovius et al., p10732).
The evidence reviews below report how BMI and waist measurements can be
used to classify the weights and body shapes of individuals into groups at
increased risk of health problems (Table 5.4).
Table 5.4 Classification of overweight and obese (BMI) from key references Source Classification Definition and notes
Overweight British childhood BMI
charts show 91st, 98th
and 99.6th centile lines
RCPCH/NOF
200233
Obese The 2002 charts show
IOTF cut-offs
corresponding to adult
definitions of
overweight and obesity
‘Body mass index (BMI)
is the most practical
measure of
obesity/overweight,
provided values are
related to reference
standards for age’
Overweight > 85th centile (CDC
2002)
NHMRC
20034
Obese > 95th centile (CDC
2002)
CDC BMI percentile
charts recommended
for use (in the clinical
setting) until local BMI
charts are developed
(Australia)
Overweight ≥ 91st centile (UK
1990)
SIGN 20037
Obese ≥ 98th centile (UK
1990)
‘Despite … limitations,
there is widespread
international support for
the use of BMI to define
obesity in children,
expressed in non-
systematic reviews and
consensus statements’
Obesity: full guidance FINAL VERSION (December 2006) Page 210

FINAL VERSION
Source Classification Definition and notes
At risk of
overweight
BMI between 85th and
95th percentile for age
and sex
AAP 2003*
Overweight or
obese
BMI ≥ 95th percentile
Singapore
MOH 2004
‘BMIs-for-age and gender equivalent to adult WHO BMI cut-offs
for obese and overweight (at ≥ 30.0 or ≥ 25.0 kg/m2) respectively
can be used as thresholds, although BMI cut-offs for action
among Asians of 27.5 kg/m2 and 23.0 kg/m2 respectively may be
eventually used’
AHA 2005 Overweight ≥ 95th percentile (CDC
age- and sex-specific
nomograms for BMI)
‘By late adolescence,
these percentiles
approach those used
for adult definitions; the
95th percentile is
approximately 30 kg/m2’
RNAO 2005 Overweight BMI > 85th percentile
and < 95th percentile
‘Research studies often
use recommended
international cut-offs
corresponding to a BMI
of 25-29.9 used in
adults’
* The AAP 2003, Singapore MOH 2004, AHA 2005, RNAO 2005 and USPSTF 2005 are all adapted from the
National Guideline Clearinghouse guideline synthesis on the assessment and treatment of obesity and
overweight in children and adolescents.
Obesity: full guidance FINAL VERSION (December 2006) Page 211

FINAL VERSION
Source Classification Definition and notes
Obese BMI for age and sex
above 95th percentile
using CDC growth
curves
‘There is no direct
measure of body fat in
childhood that is readily
applicable in the clinical
setting …. A new
international cut-off for
BMI which corresponds
to the adult levels of 25
and 30 for overweight
and obesity respectively
are recommended for
population studies’
At risk of
overweight
BMI between the 85th
and 94th percentile for
age and sex
USPSTF
2005
Overweight Overweight as a BMI
at or above the 95th
percentile for age and
sex
‘BMI percentile for age
and sex is the preferred
measure for detecting
overweight in children
and adolescents
because of its
feasibility, reliability,
and tracking with adult
obesity measures’
AAP, American Academy of Pediatrics; AHA, American Heart Association; CDC, Centers for Disease Control and Prevention; MOH, Ministry of Health; NOF, National Obesity Forum; NHMRC, National Health and Medical Research Council (Australia); RCPCH, Royal College of Paediatrics and Child Health; RNAO, Registered Nurses Association of Ontario; SIGN; Scottish Intercollegiate Guidelines Network; USPSTF, United States Preventive Services Task Force.
In children, weight must be adjusted for height. These adjustments are made by
comparing the child’s measurements with reference standards. BMI varies with
body proportions, age and puberty status. To assess individual children,
measurements need to be adjusted to compare them with those of other children
of the same age.
Obesity: full guidance FINAL VERSION (December 2006) Page 212

FINAL VERSION
There are different ways of making these adjustments and they are all made with
the same aim: to strengthen the relation between weight and adiposity.
Concern surrounding issues of sensitivity and specificity of classification systems
were also explored in Neovius and coworkers’34 assessment of the International
Obesity Taskforce (IOTF/Cole) and the World Health Organization BMI-based
systems. The results were then compared with a national (Swedish) BMI
reference, and BMI cut-offs maximising the sum of sensitivity and specificity were
also derived from the group. The results suggested that, on the one hand the
international classification systems have high specificity, resulting in few cases of
non-overweight adolescents being classified as overweight. On the other hand,
the sensitivity was very low in adolescent girls, thus illustrating how overweight
girls would be missed in intervention programmes that use BMI as inclusion
criteria.
The authors concluded that:
‘an international reference is a compromise to obtain acceptable, comparable prevalence estimates at the global level. At the national level, given the probable population differences in relative risks at certain BMI values, the seriousness of the adolescent obesity problem, and its character as a major cost driver through obesity-related illnesses, customized systems derived from national data are likely to be more efficient’.34
Different growth reference charts can be used to assess the degree of overweight
or obesity of a child. These are calculated to allow for age, sex and height.
The Growth Reference Review Group, a working group convened by the Royal
College of Paediatrics and Child Health concluded that for most clinical purposes
the UK 1990 charts were superior and recommended that:
For children under the age of 2 years, the UK 1990 reference charts are the
only suitable reference charts for weight, length and head circumference.
For children over the age of 2 years, both the UK 1990 and the Buckler–
Tanner references are suitable for assessing cross-sectional height in
Obesity: full guidance FINAL VERSION (December 2006) Page 213

FINAL VERSION
isolation, but the UK 1990 charts should be used where both weight and
height are being evaluated. The UK 1990 BMI reference is the only suitable
reference for assessing weight relative to height.35
The NHMRC guidelines for children4 highlighted several difficulties with the BMI-
for-age percentile cut-offs:
Data are derived from a reference population.
Classifying a child as overweight or obese on the basis of BMI being above a
certain percentile is an arbitrary decision and not based on known medical or
health risk.
These difficulties have resulted in different BMI centiles being used. For example,
the Centres for Disease Control and Prevention define the cut-offs as over 95th
percentile as overweight, the 85–95th percentile as risk of overweight, and under
the 5th percentile as underweight. The NHMRC guidelines4 recommended that
BMI above the 95th percentile (on the CDC charts) is indicative of obesity and a
BMI above the 85th percentile is indicative of overweight. Again, the guidelines
stressed that these classifications are arbitrary. The SIGN guidelines7 used yet
another classification, with obese children with a BMI at the 98th percentile or
over (on the UK 1990 charts), and overweight children with BMI at the 91st
percentile or over. The authors of the evidence review on which these guidelines
were based stated that:
‘A BMI cut off in the upper end of the BMI range (for example, above the 85th centile) was specific for obesity (low false positive rate). This avoids problems associated with stigmatising children or providing unnecessary treatment. When using BMI > 91st centile on the UK 1990 charts for British children, sensitivity is moderately high and specificity high. In practice, clinical assessment of obesity in British children using British BMI centile charts will be robust provided that an appropriate cut off (for example, BMI > 98th centile) is used. Serial measures of BMI, plotted on the chart, can assess changes over time.36 ‘One British study reported improved screening ability (higher sensitivity; high specificity) when national (UK) reference data were
Obesity: full guidance FINAL VERSION (December 2006) Page 214

FINAL VERSION
used, compared to use of the international reference data. Sensitivity of the definition of obesity using the international reference data differed significantly between the sexes, with low sensitivity in girls and extremely low sensitivity in boys. International BMI cut offs for BMI in children have not been related to obesity related morbidity in childhood.’37 ‘They require further testing, with evidence of external validity, before they are adopted.’36
The Growth Reference Review Group, a working group convened by the Royal
College of Paediatrics and Child Health, published a review of growth reference
charts for use in the UK.35 The Group considered the data on which the
references were based and their current validity, and made recommendations
about which reference was to be used in defined settings.
Viner and Nicholls38 made clear their use of the IOTF cut-offs to identify obesity.
As there is no accepted definition of obesity they considered those with a BMI of
greater or equal to 3 standard deviations (SD) above the mean (≥ 99.86th centile)
as extremely obese and at potential high risk. Moreover, they acknowledged the
use of waist circumference as an additional indicator of potentially high risk of
abdominal obesity.38
Cole and coworkers39 aimed to identify the best possible BMI measure for change
(BMI, BMI%, BMI z-score or BMI centile) for children across a range of adiposity.
To do so, they measured BMI three times over a period of 9 months in 135 Italian
preschool children aged 29–68 months.
The authors concluded that BMI centile is (i) useful for classifying children’s
adiposity, although poor at quantifying change in adiposity and (ii) sensitive to
changes in the middle of the adiposity range but insensitive to changes at the
extremes. BMI z-score is also useful for assessing adiposity cross-sectionally,
and, unlike BMI centile it can be summarised across populations for statistical
purposes. Despite these, disadvantages appear as its variability gets
progressively smaller the more obese the child.39
Obesity: full guidance FINAL VERSION (December 2006) Page 215

FINAL VERSION
Cole and co-workers also analysed percentage change in BMI, stating that it
performs better than BMI centile or z-score. They stated that, in practice,
adiposity change over time is virtually equivalent when measured either with
percentage change BMI or BMI. Thus, both can be used interchangeably. To
conclude, Cole and co-workers contended that adiposity change should be
measured in BMI (kg/m2) or BMI (%). Nevertheless they acknowledged that this
should be qualified, as the adiposity measures for change over time are all highly
associated and the advantage of BMI or BMI% over BMI z-score is tenuous.39
In 2002, the ‘Health survey for England’40 focused on the health of children and
young people, and on the health of infants (aged under 1 year) and their mothers.
One of the ‘core topics’, which is included in all health surveys, was
anthropometry.
Emmanuel Stamatakis produced a chapter for ‘Health survey for England’ on the
anthropometric measurement of overweight and obesity in children.41 He
discussed the establishment of a standard definition for child overweight and
obesity using BMI reference data from six different countries around the world.42
This linked childhood and adult obesity/overweight standards using evidence of
clear associations between the adult BMI cut-off values of 25 kg/m2 and 30 kg/m2
and health risk. However, Stamatakis reported that a re-analysis of children’s BMI
data using similar methods to the international classification but UK-only
reference data showed that the international BMI cut-offs exaggerated the
differences in overweight and obesity prevalence between boys and girls by
underestimating prevalence in boys. Other possible limitations of the international
classification included concerns about its sensitivity (ability to identify all obese
children as obese), the limited sample size of the reference population and the
lack of BMI cut-off points for underweight. However, in summary, the report
concluded that ‘the issue of childhood obesity definition is far from resolved and
there is an urgent need for further work’.41
5.1.4.2 Classification of overweight and obesity in adults
This section describes how BMI and waist measurements can be used to classify
the weights and body shapes of individuals into groups at increased risk of health
problems (Tables 5.5 and 5.6).
Obesity: full guidance FINAL VERSION (December 2006) Page 216

FINAL VERSION
Table 5.5 Classification of overweight and obese (body mass index [BMI]a) from key references Source Classification (BMIa) Adult
Overweight ≥ 25 NOF 200243
Obese ≥ 30
Overweight ≥ 25
≥ 30
NHMRC 200313 Obese
(≥ 40 severely obese)
Overweight ≥ 25 NIH 199814
Obese ≥ 30 a BMI unit of measurement: kg/m2.
NOF, National Obesity Forum; NHMRC, National Health and Medical Research Council (Australia); NIH, National Institutes of Health.
Obesity: full guidance FINAL VERSION (December 2006) Page 217

FINAL VERSION
Obesity: full guidance FINAL VERSION (December 2006) Page 218
Table 5.6 Classification of overweight and obese (waist circumference) from key references Source Classification (waist
circumference) Additional comments
Adult Men > 102 cm NOF 200243
Women > 88 cm
Associated with ‘substantially increased health risk’
Men ≥ 102 cm (≥ 94 cm increased risk)
Associated with ‘substantially increased’ risk of metabolic complication Waist circumference is a valid measure of abdominal fat mass and disease risk in individuals with a BMI less than 35 kg/m2. If BMI is 35 or more, waist circumference adds little to the absolute measure of risk provided by BMI
NHMRC 200313
Women ≥ 88 cm (≥ 80 cm increased risk)
Men > 102 cm
Women > 88 cm
NIH 199814
Associated with high risk to health Although waist circumference and BMI are interrelated, waist circumference provides an independent prediction of risk over and above that of BMI. It is particularly useful in patients who are categorised as normal or overweight on the BMI scale
BMI, body mass index; NOF, National Obesity Forum; NHMRC, National Health and Medical Research Council (Australia); NIH, National Institutes of Health.
As for measurement above, the National Guideline Clearing House synthesis of
adult guidelines summarised classification as follows (Table 5.7).

FINAL VERSION
Table 5.7 Classification of obesity in adults ACPM
(2001)
By criteria of the International Obesity Taskforce, overweight is classified as BMI > 25 kg/m2
Obesity is categorised as class I (BMI 30–34.9), class II (BMI 35–39.9) and class III (BMI
≥ 40)
AGA (2002) A BMI of 25.0–29.9 is classified as overweight. Obesity is categorised as class I (BMI 30–
34.9), class II (BMI 35–39.9) and class III (BMI ≥ 40)
BWH (2003) The National Heart, Lung, and Blood Institute Overweight and Obesity Classification by BMI
(in kg/m2):
Normal weight 18.5–24.9
Overweight 25.0–29.9
Obesity class 1 30.0–34.9
Obesity class 2 35.0–39.9
Obesity class 3 ≥ 40.0
Waist circumference. A waist circumference > 88 cm (> 35 inches) raises cardiovascular
disease risk in women.
Waist cut-offs designed for the general population may not apply to very short women
(under 1.5 m [5 feet])
Obesity: full guidance FINAL VERSION (December 2006) Page 219

FINAL VERSION
Obesity: full guidance FINAL VERSION (December 2006) Page 220
Singapore
MOH (2004)
Current World Health Organization and international guidelines recommend BMI cut-offs of
25 kg/m2 and 30 kg/m2 to define overweight and obesity, respectively. Based on body fat
equivalence and comorbid disease risk, BMIs of 23 kg/m2 and 27.5 kg/m2, respectively have
been recommended as cut-off points for public health action in Asians (grade C, level IV).
Note: BMI cut-off points are currently being reviewed in the light of new data
Current international guidelines recommend waist circumference cut-offs of 102 cm and
88 cm to define excess risk in males and females, respectively. Based on an Asian-Pacific
consensus and our national health survey and comorbid disease risk, cut-offs of 90 cm and
80 cm, respectively, are probably more appropriate for Asians (grade C, level IV)
USPSTF
(2003)
The USPSTF found good evidence that BMI, calculated as weight in kilograms divided by
height in metres squared, is reliable and valid for identifying adults at increased risk for
mortality and morbidity due to overweight and obesity
Persons with a BMI between 25 kg/m2 and 29.9 kg/m2 are overweight, and those with a BMI
of > 30 kg/m2 are obese. There are three classes of obesity: class I (BMI 30–34.9), class II
(BMI 35–39.9) and class III (BMI 40 and above).
Men with waist circumferences > 102 cm (> 40 inches) and women with waist
circumferences > 88 cm (> 35 inches) are at increased risk for cardiovascular disease. The
waist circumference thresholds are not reliable for patients with a BMI > 35 kg/m2
ACPM, American College of Preventive Medicine; AGA, American Gastroenterological Association; BMI, body mass index; BWH, Brigham and Women’s Hospital; MOH, Ministry of Health; USPSTF, United States Preventive Services Task Force.

FINAL VERSION
BMI There is little disagreement about the classification of overweight and obese
using BMI in adults; a BMI between 18.5 kg/m2 and under 25 kg/m2 is accepted to
be within normal ranges, whereas a BMI of between 25 kg/m2 and under 30 kg/m2
is classified as overweight and a BMI of 30 kg/m2 and over as obesity. Further
classifications, linked with morbidity, can be seen in Table 5.8.
Table 5.8 Classifications of obesity44 Classification BMI (kg/m2) Risk of co-morbidities
Underweight < 18.5 Lowa
Healthy weight 18.5– 24.9 Average
Overweight (or pre-obese) 25–29.9 Increased
Obesity, class I 30–34.9 Moderate
Obesity, class II 35–39.9 Severe
Obesity, class III ≥ 40- Very severe a Other health risks may be associated with low body mass index (BMI).,
These cut-offs are based on epidemiological evidence of the link between
mortality and BMI in adults.
Waist circumference and waist-to-hip ratio This agreement on classification is also reflected in the cut-offs used for waist
circumference: a waist circumference of 102 cm or over in men and 88 cm or over
in women is associated with substantially increased health risks (Table 5.9).
Table 5.9 Classification using waist-to-hip ratio and waist circumference44;45 At increased risk Men Women
Waist-to-hip ratio > 1.0 > 0.85
Waist circumference (increased risk) ≥ 94 cm ≥ 80 cm
Waist circumference (greatly increased risk) ≥ 102 cm ≥ 88 cm
Obesity: full guidance FINAL VERSION (December 2006) Page 221

FINAL VERSION
BMI and waist circumference The WHO recommended that an individual’s relative risk could be more
accurately classified using both BMI and waist circumference. These can be seen
in Table 5.10.
Table 5.10 Combining body mass index (BMI) and waist measurement to classify the risks of type 2 diabetes and cardiovascular disease13;44 Waist circumference (cm) Classification BMI (kg/m2) Men 94–102 > 102
Women 80–88 > 88
Underweight < 18.5 – –
Healthy weight 18.5–24.9 – Increased
Overweight 25–29.9 Increased High
Obesity > 30 High Very high
The Agency for HealthCare Research and Quality (AHRQ) undertook a
systematic review of the diagnosis and treatment of obesity in older people.15 The
review addressed the following questions:
Are there limitations in diagnosing obesity in the elderly† with BMI?
Should another measurement be used with BMI or in place of BMI for
diagnosing obesity in the elderly?
The review concluded that:
‘Overall, among office-based diagnostic tests for obesity, BMI and WC showed very similar correlation with body fat percentage in men and women.… While WC correlates closely with body fat percentage and aims to measure central adiposity, it showed low sensitivity when used as a single tool to identify older patients with either generalized (by BMI) or central (by WHR) obesity. Gender did not appear to strongly affect these analyses’ diagnostic accuracy, but the utility of diagnostic measures may differ across ethnic/racial groups.’
† Defined as people aged 60 years or older.
Obesity: full guidance FINAL VERSION (December 2006) Page 222

FINAL VERSION
However, no specific cut-offs were suggested for any of the measures evaluated
in this group of people.
One systematic review assessed the link between BMI and risk in older people.46
In studies where an association was found, a BMI of 27 kg/m2 or over was
associated with increased all-cause and cardiovascular mortality among people
aged 65–74 years. For people aged 75 years or over, a BMI of 28 kg/m2 or over
was associated with an increased all-cause mortality. The authors suggested
that future guidelines may wish to consider the evidence for specific groups when
establishing standards for healthy weight.
5.1.5 How do BMI and waist circumference correlate with morbidity and mortality in different ethnic groups?
5.1.5.1 Classification of obesity in children from different ethnic groups
Background BMI, besides not being able to distinguish between fat mass and lean (or muscle)
mass, does not reflect body fat distribution or differences in body fat associated
with different body proportions in different ethnic groups.47
The concept of different cut-offs for different ethnic groups has been proposed by
the WHO, but there is ongoing debate48-51 and at present, there are no commonly
accepted cut-offs or indeed, methods to determine specific cut-offs.52
In the UK, a secondary analysis53 of the 1999 health survey for England found
that Afro-Caribbean and Pakistani girls (aged 2–20 years) were more likely to be
obese than girls in the general population (odds ratio [OR] 2.74, 95% confidence
interval [CI] 1.74 to 4.31 and OR 1.71, 95% CI 1.06 to 2.76, respectively), with
Afro-Caribbean girls also more likely to be overweight (OR 1.73, 95% CI 1.29 to
2.33). Indian and Pakistani boys were more likely to be overweight (OR 1.55,
95% CI 1.12 to 2.17 and OR 1.36, 95% CI 1.01 to 1.83), but not obese.
Conversely, Chinese girls were less likely to be overweight or obese and Chinese
boys less likely to be overweight. The degree of overweight or obesity was
assessed using the IOTF standard definition for international use42(see
International evidence below).53
Obesity: full guidance FINAL VERSION (December 2006) Page 223

FINAL VERSION
In another study of UK adolescents aged 11–14 years,54 the prevalence of
overweight and obesity was found to be highest for black African girls and lowest
for Bangladeshi and Pakistani girls. In boys, the prevalence of overweight and
obesity was highest for Indian boys and lowest for black African and Pakistani
boys. But the differences between ethnic groups were not significant overall.
There were some significant differences between the white British population and
the different ethnic groups. Indian boys were significantly more likely to be
overweight and Pakistani and black African boys were significantly less likely to
be overweight (using the IOTF international cut-offs42). One limitation of this study
is that the survey was not a national one, but restricted to East London. However,
the response rate was high and the authors felt that that sample was
representative.
Studies have found that Asian Indian children have higher body mass adjusted
pressure levels than white children,55 and are predisposed to insulin resistance
syndrome (IRS),56 which is associated with excess body fat, abdominal adiposity,
and excess truncal subcutaneous fat.57 This association between IRS and
ethnicity was also found in a cross-sectional study of 3642 children in the UK.58
However, it is not yet clear how influential maternal nutrition and intergenerational
effects will be on the relation between ethnicity and obesity over time.
Methods The evidence review is based on relevant, identified systematic reviews and
primary studies that assessed whether the association between BMI, waist
circumference and bioelectrical impedance and morbidity is different between
different ethnic groups in UK populations.
Owing to the lack of evidence and ongoing international debate on this topic, we
asked experts‡ in the area to suggest any additional references. These were
scanned and included as appropriate.
‡Professor Philip James and Dr Kamlesh Khunti.
Obesity: full guidance FINAL VERSION (December 2006) Page 224

FINAL VERSION
UK evidence No studies investigating ethnicity differences in the association of proxy measures
of obesity with morbidity in children in UK populations were found. However, there
is evidence that young adult South Asians tend to have greater truncal adiposity
than their European counterparts.
One study developed body mass reference curves based on a representative
sample of the UK population from birth to 23 years.59 However, it was not stated if
ethnicity was considered in ensuring the sample was representative.
International evidence The WHO review of obesity in the Asia-Pacific region published in 2002 stated
that the international standard for BMI-for-age chart42 was unlikely to be
appropriate for Asian and Pacific children.60
Summary Some evidence appears to suggest that Afro-Caribbean and black African girls
might be at greater risk of overweight and obesity. This is also observed in some
Indian boys. Evidence also suggests that Indian children have higher body mass
adjusted pressure levels than white children, and are predisposed to IRS, which
is associated with excess body fat, abdominal adiposity and excess truncal
subcutaneous fat.
5.1.5.2 Classification of obesity in adults from different ethnic groups
Background It is now generally accepted that the different ethnic groups have higher
cardiovascular and metabolic risks at lower BMIs, and this may be because of
differences in body shape and fat distribution.
In 2001, an international meeting of researchers discussed the simplified use of
anthropometry to assess the risk of chronic disease associated with overweight
and body fat distribution in adults.61 The researchers concluded that:
‘for its potentially important role in health promotion and primary health care activities, WC [waist circumference] should be adopted as
Obesity: full guidance FINAL VERSION (December 2006) Page 225

FINAL VERSION
a valuable tool for assessing the health risks of overweight, provided that appropriate cut-off points are established’.61 (Our emphasis)
Although ethnicity was discussed, the main groups were those not directly
applicable to the UK. Although the UK data included in the pooled evidence
presented at the meeting did include people of South Asian ancestry, no detailed
discussion of this group was reported.
The concept of different cut-offs for different ethnic groups has also been
proposed by the WHO, but there is ongoing debate62-66 and at present, there are
no commonly accepted cut-offs or indeed, methods to determine specific cut-
offs.66;67 However, research is currently being undertaken,68 and any update of
this guidance will consider this new evidence as appropriate. For this guidance,
we have therefore looked for evidence on how different cut-offs are associated
with mortality and morbidity in ethnic populations (appropriate to the UK) both in
the UK and in the countries of origin.
The Newcastle Heart project69 compared coronary heart disease (CHD) risk
factors in Indians, Pakistanis and Bangladeshis, and also compared South Asians
(as a group) with people of European origins. The participants were aged
between 20 and 74 years, and lived in Newcastle, UK. Measurements included
biochemical markers (including fasting insulin, lipids, blood glucose) and
anthropometry, and other clinical factors (including blood pressure and
electrocardiograms). Another aim of the project was to determine the association
between ethnic and socioeconomic inequalities, physical activity, social networks
and cardiovascular risk factors.70-74
The authors reported (in several papers) that:
The risk of CHD was not uniform among South Asians but that, overall, South
Asians had a higher level of CHD than Europeans.69
South Asians did not appear to have higher levels of lipoprotein (a) levels
(which, in combination with high insulin resistance, was hypothesised to
explain the increased level of heart disease).74
Obesity: full guidance FINAL VERSION (December 2006) Page 226

FINAL VERSION
South Asians had lower levels of habitual physical activity than Europeans,
and this was likely to contribute to the higher levels of diabetes and
cardiovascular risk.72
The authors suggested that for South Asians living in Newcastle, the European
pattern of inequalities (where social class, education and deprivation were
associated with disease and risk factors) were becoming established, with
different rates of establishment occurring in different ethnic groups.70 When
different models of predicting cardiovascular disease were applied to the different
ethnic groups, a variety of results were seen. However, overall, the authors
concluded that ‘the potential gains from controlling major established risk factors
could be substantial in South Asians and greater than in Europeans’.75
There remains uncertainty about how ethnic, migrant populations may or may not
adapt over time to the patterns of risk of the indigenous population. Lean and co-
workers compared anthropometric measures and behavioural associations in
migrant and British-born South Asians and Italians and the general population of
British women living in the west of Scotland. No differences were found in
anthropometry between the British-born South Asian women and the general
population women. The authors concluded that these results offered ‘hope that
some of the high cardiovascular risks in South Asians in Britain may be overcome
by lifestyle modification, and that the risks may reduce over generations through
acculturation’.76 The influence of maternal nutrition, birth weight and initial weight
gain on future health and risk of obesity in adulthood is also unclear (although
evidence is emerging).77-79
Methods The evidence review was based on relevant, identified systematic reviews and
primary studies assessing whether the association between BMI and waist
circumference and morbidity is different between different ethnic groups in UK
populations. This review considered only Asian and black populations. Due to the
lack of evidence and ongoing international debate on this topic, we asked
Obesity: full guidance FINAL VERSION (December 2006) Page 227

FINAL VERSION
experts§ in the area to suggest any additional references. The suggested
references were scanned and included as appropriate.
Asian population UK evidence
Five studies were identified that investigated the measurement of obesity in
ethnic groups in the UK population. Three of these associated proxy indicators of
obesity with morbidity80-82 and the remaining two investigated the correlation
between BMI and skinfold thickness.83;84 The key findings were as follows:
For equivalent BMIs, Pakistani adult males were found to have significantly
more truncal adiposity and total adiposity than white males as measured by
skinfold thickness.83;84
Significant differences were found in associations between proxy measures of
obesity and features of the metabolic syndrome with regard to:
o waist-to-hip ratio and triglycerides in European and Chinese women
o waist circumference, waist-to-hip ratio and waist-to-height ratio and
triglycerides and HDL cholesterol in European and South Asian (Indian,
Pakistani or Bangladeshi origin) women
o waist circumference and waist-to-hip ratio and serum 2-hour glucose in
European and South Asian males.81
For equivalent waist-to-hip ratios, South Asian males (Sikh, Punjabi Hindu,
Gujarati Hindu and Muslim) were found to have significantly higher diabetes
prevalence and serum insulin (excluding people with diabetes) but not
significantly different HDL cholesterol, triglyceride and systolic blood
pressure.80
However, another study found no relation between central or generalised
adiposity and plasma triacylglycerol (TAG) in Sikh men. Although there was a
§ Professor Philip James and Dr Kamlesh Khunti
Obesity: full guidance FINAL VERSION (December 2006) Page 228

FINAL VERSION
positive association between central body fat and insulin resistance, this was
less strong for Sikh men than for white men.82
Waist circumference and waist-to-height ratio were more consistently
associated with features of metabolic syndrome than waist-to-hip ratio when
comparing across European, Chinese and South Asian groups.81
In another series of papers,85;86 the health and coronary risk of a British Punjabi
population was compared with that of the general population in Glasgow.
However, this was a cross-sectional survey with physical measures, and was not
a study to determine the level of association between the different anthropometric
measures and risk, so was not included in the detailed review.
International evidence
These findings are broadly consistent with studies and reviews of studies of Asian
population groups outside the UK.87-93 In 2004, a WHO expert consultation94
reviewed the scientific evidence relevant to recommending BMI cut-off points for
determining overweight and obesity in Asian populations. Combining 11 data sets
for Asian populations (China, Hong Kong, India, Indonesia, Japan, Republic of
Korea, Malaysia, Philippines, Singapore, Taiwan and Thailand) the consultation
found that for the same age and percentage of body fat, BMI was 1.3 kg/m2 (±0.1)
lower in females and 1.4 kg/m2 in males compared with their European
counterparts. However, these differences varied substantially between different
Asian populations.
‘From the analyses undertaken, Hong Kong Chinese, Indonesians, Singaporeans, urban Thai, and young Japanese had lower BMIs at a given body fat compared with Europeans, whereas Beijing (northern) Chinese and rural Thai had similar values to those of Europeans. These differences across Asian groups might be because of the methods used, but might also reveal real differences among the ethnic groups’94
The key conclusions were that:
Obesity: full guidance FINAL VERSION (December 2006) Page 229

FINAL VERSION
On the basis of available data in Asia, Asians generally have a higher
percentage of body fat than white people of the same age, sex and BMI.
The proportion of Asian people with risk factors for type 2 diabetes and
cardiovascular disease was substantial even below the existing cut-off point of
25 kg/m2.
Current (WHO) cut-off points do not therefore provide an adequate basis for
taking action on risks related to overweight and obesity in many populations in
Asia.
However, the available data do not necessarily indicate one clear BMI cut-off
point for all Asian population groups for overweight or obesity. Cut-offs for
observed risk varied from 22 kg/m2 to 25 kg/m2 and for high risk from 26 kg/m2 to
31 kg/m2.
Two key recommendations were as follows:
Trigger points for public health action should be 23 kg/m2 (increased risk) and
27.5 kg/m2 (high risk).
Where possible, in populations with a predisposition to central obesity and
related increased risk of developing the metabolic syndrome, waist
circumference should also be used to refine action levels on the basis of BMI.
There is some limited evidence that for a given BMI or waist circumference,
morbidity risk in South Asian populations (of Pakistani, Bangladeshi and Indian
origin) resident in the UK may be higher.
Black population UK evidence
Only one UK-based study was found that investigated the measurement of
obesity in the male black population.80 However, the focus of this study was on
differences in the relation of central obesity with cardiovascular risk, insulin
resistance and diabetes prevalence between European and South Asian
populations. The sample size of the Afro-Caribbean group was considerably
Obesity: full guidance FINAL VERSION (December 2006) Page 230

FINAL VERSION
smaller (European = 1515, South Asian = 1421, Afro-Caribbean = 209). Unlike
the European and South Asian groups, data on risk factors for the Afro-Caribbean
group were not controlled for waist-to-hip ratio so it is difficult to say whether the
findings have a bearing on appropriate cut-offs for Afro-Caribbeans. However, a
general comparison of the Afro-Caribbean population sample with the European
population found that:
waist-to-hip ratio was not significantly different but BMI was significantly higher
diabetes prevalence was significantly higher but serum insulin levels were not
significantly different
median systolic and diastolic blood pressures were significantly higher
plasma triglyceride was significantly lower and HDL cholesterol significantly
higher.
International evidence
Elsewhere, a large-scale study95 of the relation between BMI and body fat in
black populations in Nigeria, Jamaica and the USA concluded that within
populations bioelectrical impedance analysis as a measure of percentage body
fat was not a better predictor of blood pressure, or waist or hip circumference.
However, for similar levels of BMI, body fat varied substantially. Nigerians had a
greater fat-free mass than Jamaicans and Jamaicans had a greater proportion
than African Americans. The study did not make comparisons with white
populations.
A smaller-scale study96 set in the USA compared the association between upper
body obesity and cardiovascular and diabetic risk in white and black pre-
menopausal women. This found that upper body obesity (as assessed by waist-
to-hip ratio) is not as potent a risk factor for diabetes and coronary heart disease
in black women as it is in white women. Also, whereas in white women upper
body obesity was associated with significantly greater glucose intolerance,
hyperinsulinaemia and insulin resistance, this was not significant in black women
Obesity: full guidance FINAL VERSION (December 2006) Page 231
FINAL VERSION
(that is, upper body fat distribution has less impact on carbohydrate metabolism).
The sample size for this study was small (black women = 22, white women = 20).
Summary In summary, the evidence base for differences in the association of BMI, waist
circumference and bioimpedance with morbidity is limited, particular in black
ethnic groups. Available evidence for South Asian groups was consistent with
findings from studies in populations living in South Asia. This may not be
surprising as UK studies have focused particularly on first generation migrants.
The findings on South Asian populations in the UK were consistent with those
from the WHO expert consultation which assessed populations living in South
Asia (although these also included a wider range of populations).
Therefore, there is probably insufficient evidence to make any clear
recommendations about separate cut-offs for ethnic groups in the UK, as distinct
to the cut-offs recommended for Asian populations by the WHO.
Obesity: full guidance FINAL VERSION (December 2006) Page 232

FINAL VERSION
5.2 B: Public health
The following is based on an evidence review produced by Cardiff University.
Detailed evidence tables and supporting information are in Appendix 3.
5.2.1 Evidence statements (Table 5.12)
Table 5.12 Evidence statements and grading No. Evidence statement Grade Evidence
Observational longitudinal studies
Children
1 Limited evidence suggests that attempting to identify children at risk of obesity before 2 years of age has poor predictability
3 One longitudinal study (3) (Toschke et al. 200497)
2 Children at risk of becoming overweight or obese may be identified from opportunistic monitoring using growth charts after 2 years of age
3 Two longitudinal studies (both 3) (Guo 2002,98 He and Karlberg 200299)
3 There is some evidence that children at risk of overweight or obesity may be identified by assessing measures of habitual activity levels and diet
3 Two longitudinal studies (both 3) (Barba 2001100 as addition to anthropometric measures, Metcalf et al. 2002101)
4 There is some evidence that measures in addition to BMI – height and waist circumference – may aid the identification of children at risk of overweight and obesity
3 Three longitudinal studies (two of which linked; all 3) (Maffeis et al. 2001,102 Freedman et al. 2001,103 Freedman 2002 et al.104)
5 Based on two studies, schools may provide an opportunity for monitoring the growth and activity levels of children
3 Two longitudinal studies (both 3) (Barba et al. 2001,100 Metcalf et al. 2002101)
Adults
6 There is some evidence that considering an individual’s weight history (for example, previous weight gain or loss, previous attempts at dieting) and monitoring more recent weight gain may help identify adults
3 Two longitudinal studies (both 3) (Kroke et al. 2002,105 St Jeor et al. 1997106)
Obesity: full guidance FINAL VERSION (December 2006) Page 233

FINAL VERSION
No. Evidence statement Grade Evidence
at risk of becoming overweight or obese in the future
Existing guidance and recommendations
UK based
7 There is no existing UK guidance on the identification of children and adults at risk of obesity
N/A N/A
8 There is a lack of consensus in existing UK-based ‘recommendation’ papers on whether to regularly monitor or screen BMI, particularly in children
4
No clear link to evidence or low quality; expert opinion
9 Two of the three UK-based recommendation papers have suggested schools as an appropriate setting if regular monitoring is considered
4 No clear link to evidence or low quality; expert opinion
Non-UK based
10 The majority of non-UK guidance and recommendation documents suggest that periodic monitoring of weight status and BMI and waist circumference measurements should be routinely undertaken
4 No clear link to evidence or low quality; expert opinion
BMI, body mass index; N/A, not applicable.
See Appendix 3 for associated evidence tables.
5.2.2 Methodology
Database searches were carried out in June/July 2005 for papers published
from 1990 onwards (1995 onwards for systematic review level evidence). An
additional range of databases were searched for guidelines (see Appendix 3).
A final update search was completed on 1 December 2005 on a reduced
number of databases. From an initial 1404 hits, 114 papers were assessed in
detail, of which 10 papers met the critical appraisal criteria for inclusion in
Obesity: full guidance FINAL VERSION (December 2006) Page 234

FINAL VERSION
evidence tables. An additional 561 guidelines were identified, of which 44
were assessed in detail and of which 14 met the criteria for inclusion (5 clinical
practice guidelines, 2 recommendation statements, 4 policy statements, 2
reports and 1 briefing paper).
The inclusion and exclusion criteria for the review adhered to the standard
public health review parameters for interventions. In addition, it was agreed
with the Guidance Development Group (GDG) that studies should only be
included in this review if:
the paper reports an intervention to identify adults and/or children who are
potentially at risk for developing obesity and who would benefit from
participation in a prevention/public health intervention to manage weight
the paper is a recommendation or guideline for identifying adults and/or
children who are potentially at risk for developing obesity and who would
benefit from participation in a prevention/public health intervention to
manage weight
the paper concludes that the tools evaluated have the potential for use in
identification interventions.
Tooth et al 2005107 was used to appraise observational longitudinal studies
and the AGREE instrument (www.agreecollaboration.org/instrument) was
used to appraise guidelines and recommendation documents. For the
purposes of this review a clinical or practice guideline was defined as a
document that aimed to identify, summarise and evaluate the best evidence
and was based on a systematic review of the current research evidence.
Public/policy statements and recommendations were defined as documents
that aimed to provide advice or recommendations and were likely to have
been developed based on consensus agreement by an expert panel.
Please note that the Department of Health (DH) has recently issued
‘Measuring childhood obesity: guidance to primary care trusts’. However as
this was published in January 2006 (that is, after the agreed search dates) it
Obesity: full guidance FINAL VERSION (December 2006) Page 235

FINAL VERSION
has not been appraised for this version of the review. The DH guidance will be
appraised before final publication of this NICE guidance.
5.2.3 Identification of individuals who may benefit from participation in public health interventions to manage weight
There is limited evidence on the effectiveness of interventions to identify
children and adults who are likely to become overweight or obese and would
benefit from interventions. This is particularly the case in adults. All studies
had some confounders. Only one study101 was carried out in the UK. No UK-
based corroborative data were identified other than one accelerometer study,
but it is likely that the findings are applicable to the UK. No cost-effectiveness
data were identified.
5.2.3.1 Children
Eight moderate quality observational longitudinal studies in children97–104
suggest that those at risk of becoming overweight or obese may be identified
from opportunistic monitoring of growth charts after 2 years of age (including
larger than expected weight gain and early ‘rebound’),98,99 potentially using
anthropometric measures in addition to BMI (height and waist circumference)
and from assessing measures of habitual activity levels (for example, through
an accelerometer) and diet.101 Attempting to identify children at risk before 2
years of age had poor predictability.97 Of the four studies measuring
anthropometric measures, one102 concluded that measurement of waist
circumference at age 8 may be a promising index to predict overweight at
puberty, and two linked studies103,104 concluded that a measurement of height
at age 7–8 could be used to identify more accurately children who are likely to
become overweight adults, although this may only be true for those children
already overweight. A further study,100 which measured anthropometric
measures and examined lifestyle factors such as diet and physical activity,
concluded that large-scale involvement of primary schools in screening
programmes could identify those children at risk of being overweight and
obese in adulthood and for whom strategies to prevent overweight and obesity
would be most effective. No studies were found which considered identifying
children by their parent’s weight/obesity.
Obesity: full guidance FINAL VERSION (December 2006) Page 236

FINAL VERSION
5.2.3.2 Adults
Two studies with some confounders,105,106 one large retrospective cohort
study and one relatively small ongoing prospective study, examined
interventions to identify adults at risk of overweight and obesity. The results
suggest that considering an individual’s weight history (for example, previous
weight gain or loss, previous attempts at dieting) and monitoring more recent
weight gain (for example over 2.3 kg) may help identify adults at risk of
becoming overweight or obese in future.
5.2.4 Existing guidelines and recommendations
There is currently no available formal guidance in the UK and there is a lack of
consensus in the existing ‘recommendation’ papers on whether to regularly
monitor or screen BMI, particularly in children. No corroborative data were
identified, but it is likely that the findings are applicable to the UK. No cost
data were identified.
5.2.4.1 UK-based guidance and recommendations
No usable UK guidelines were identified. Following the advice of SIGN, the
existing SIGN guidelines for adults108 were not considered due to
methodological problems. These guidelines will be updated in the future.
SIGN guidance for children7 was considered, but excluded as it discussed
identification of overweight and obesity only.
The conclusions of three UK recommendation papers suggest that there is
currently no consensus available for the screening of children for unhealthy
weight gain. A policy statement form the UK’s National Screening Committee
in 2005,109 based on expert consensus opinion, recommended that screening
should not be offered whereas the evidence from a briefing paper prepared by
the Child Growth Foundation110 firmly recommended universal serial BMI
assessments for children at least until the end of primary school. One further
report from the House of Commons Select Committee on Health in 2004,111
supported the guidance suggested by the Child Growth Foundation and
suggested that BMI measures should be recorded annually for school-aged
children.
Obesity: full guidance FINAL VERSION (December 2006) Page 237

FINAL VERSION
The evidence underpinning the identified recommendations is not available or
is of lower-level quality. According to the AGREE instrument for the appraisal
of guidelines only two publications would be recommended (National
Screening Committee 2005,109 Child Growth Foundation 2004110), one with
provisos (National Screening Committee109).
5.2.4.2 Non-UK-based guidance and recommendations
Of the 11 identified non-UK guidance documents, overall evidence from nine
recommendations suggests that periodic monitoring of weight status and BMI
and waist circumference measurements should be routinely undertaken.
Five clinical practice evidence-based guidelines were identified, of which four
recommended recurrent screening for weight gain. Three of these were from
the USA, one from Canada and one from Australia. Of the US-based
recommendations, one recommended that height, weight and BMI
measurements be taken annually for mature adolescents and adults,112 one)
recommended that adults who are not overweight or who have no history of
overweight should be screened for weight, BMI and waist circumference every
2 years,113 and one firmly recommended against screening for obesity for
asymptomatic adults.114 The Canadian guidance, based on expert opinion,
advocated the inclusion of monitoring and surveillance data on nutrition,
physical activity and measures of adiposity for children in public health
policies.115 The Australian guidance recommended recurrent measurement of
height and weight in a nationally representative sample of children and
adolescents.116 Supporting evidence for clinical practice guidelines was
obtained from controlled comparative studies, observational data and expert
judgement from clinical experience. According to the AGREE appraisal criteria
all five clinical practice guidelines would be strongly recommended.
Two recommendation statements, one US-based and one from Canada, gave
conflicting advice. The Canadian evidence-based statement concluded that
there was insufficient evidence to recommend for or against BMI
measurement in the periodic health examination of the general public,39
whereas the US-based statement proposed an algorithm to determine a
Obesity: full guidance FINAL VERSION (December 2006) Page 238

FINAL VERSION
child’s BMI at health visits.117 No supporting evidence for the US statement is
available and the frequency for health visits is not indicated.
Three policy statements all supported serial assessments for weight
monitoring. Two US-based statements recommended recurrent measurement
of BMI, one of which118 recommended annual routine assessments to
calculate and plot BMI measurements for children and the assessment of
eating and activity patterns for excessive weight gain relative to linear growth.
The other US-based statement119 recommended periodic BMI measurement
for all adults, independent of weight or BMI, along with consistent counselling
about healthful dietary and physical activity patterns from general
practitioners. There are no apparent links to supporting evidence for either of
these statements. One evidence-based collaborative policy statement from
Canada suggested that repeated height and weight measurements be part of
scheduled well-baby and well-child health visits and that health maintenance
visits for children be organised according to a child’s immunisation
schedule.120 Continued growth monitoring on an annual basis at primary care
visits for older children and adolescents was also recommended. These
recommendations were based on expert opinion only. BMI-for-age screening
from age 2 onwards to track and predict future risk of being overweight was
also advised.
According to the AGREE appraisal criteria the five recommendation and policy
statements are broadly recommended with provisos although one117 is an
identification algorithm only for children and adolescents and would not be
recommended as a guideline.
One taskforce report from Australia recommended, as part of its national
action agenda, regular tracking of height and weight status in the community
as well as monitoring of knowledge, attitudes, intentions, behaviours and other
indicators of healthy eating and active living.121 The recommendation from this
report is not evidence based.
Obesity: full guidance FINAL VERSION (December 2006) Page 239

FINAL VERSION
5.3 Review limitations
No review level or controlled trial evidence was found for this review question,
resulting in an evidence base of observational longitudinal studies.
Obesity: full guidance FINAL VERSION (December 2006) Page 240

FINAL VERSION
Reference List: (1) Cole TJ, Rolland-Cachera MF. Measurement and definition. In: Burniat W, Cole TJ,
Lissau I, Poskitt EME, editors. Child and Adolescent Obesity. Causes and consequences, prevention and management. Cambridge: Cambridge University Press; 2002. 3-27.
(2) Yusuf S, Hawken S, Ounpuu S, Bautista L, Franzosi MG, Commerford P et al. Obesity and the risk of myocardial infarction in 27,000 participants from 52 countries: a case-control study. Lancet 2005; 366(9497):1640-1649.
(3) Mamtani MR, Kulkarni HR. Predictive performance of anthropometric indexes of central obesity for the risk of type 2 diabetes. Arch Med Res 2005; 36(5):581-589.
(4) Sorensen G, Stoddard A, Peterson K, Cohen N, Hunt MK, Stein E et al. Increasing fruit and vegetable consumption through worksites and families in the treatwell 5-a-day study. AM J PUBLIC HEALTH 1999; 89(1):54-60.
(5) Agency for Healthcare Research and Quality, National Guideline Clearinghouse (NGC) Guideline Synthesis. OVERWEIGHT AND OBESITY IN CHILDREN AND ADOLESCENTS:ASSESSMENT, PREVENTION, AND MANAGEMENT. 2005.
(6) Freedman DS, Wang J, Maynard LM, Thornton JC, Mei Z, Pierson J et al. Relation of BMI to fat and fat-free mass among children and adolescents. International Journal of Obesity 2005; 29(1):1-8.
(7) Scottish Intercollegiate Guidelines Network. Management of obesity in children and young people: a national clinical guideline. 69. 2003.
(8) McCarthy HD, Ellis SM, Cole TJ. Central overweight and obesity in British youth aged 11-16 years: cross-sectional surveys of waist circumference. British Medical Journal 2003; 326.
(9) McCarthy HD, Jarrett KV, Emmett PM, Rogers I. Trends in waist circumferences in young British children: A comparative study. International Journal of Obesity 2005; 29(2):157-162.
(10) Rudolf MCJ, Greenwood DC, Cole TJ, Levine R, Sahota P, Walker J et al. Rising obesity and expanding wasitlines in schoolchildren: a cohort study. Arch Dis Child 2004; 89:235.
(11) Singapore Ministry of health. Obesity. 2004. t
(12) Neovius M, Linne Y, Rossner S. BMI, waist-circumference and waist-hip-ratio as diagnostic tests for fatness in adolescents. International Journal of Obesity 2005; 29(2):163-169.
(13) National Health & Medical Research Council. Clinical practice guidelines for the management of overweight and obesity in adults. 2003. t
(14) Glasgow RE, Terborg JR, Hollis JF, Severson HH, Boles SM. Take heart: results from the initial phase of a work-site wellness program. AM J PUBLIC HEALTH 1995; 85(2):209-216.
(15) Cockcroft A, Gooch C, Ellinghouse C, Johnston M, Michie S. Evaluation of a programme of health measurements and advice among hospital staff. Occup Med (Oxf) 1994; 44(2):70-76.
Obesity: full guidance FINAL VERSION (December 2006) Page 241

FINAL VERSION
(16) Dasgupta S, Hazra SC. The utility of waist circumference in assessment of obesity. Indian Journal of Public Health 1999; 43(4):132-135.
(17) Gill T, Chittleborough C, Taylor A, Ruffin R, Wilson D, Phillips P. Body mass index, waist hip ratio, and waist circumference: Which measure to classify obesity? Sozial- und Praventivmedizin 2003; 48(3):191-198.
(18) Goodman-Gruen D, Barrett-Connor E. Sex differences in measures of body fat and body distribution in the elderly. Am J Epidemiol 1996; 143(9):898-906.
(19) Han TS, Seidell JC, Currall JE, Morrison CE, Deurenberg P, Lean ME. The influences of height and age on waist circumference as an index of adiposity in adults. Int J Obes Relat Metab Disord 1997; 21(1):83-89.
(20) Lean ME, Han TS, Morrison CE. Waist circumference as a measure for indicating need for weight management. British Medical Journal 1995; 311(6998):158-161.
(21) Molarius A, Seidell JC, Sans S, Tuomilehto J, Kuulasmaa K. Varying sensitivity of waist action levels to identify subjects with overweight or obesity in 19 populations of The WHO MONICA Project. Journal of Clinical Epidemiology 1999; 52(12):1213-1224.
(22) Molarius A, Seidell JC, Sans S, Tuomilehto J, Kuulasmaa K. Waist and hip circumferences, and waist-hip ratio in 19 populations of the WHO MONICA Project. Int J Obes Relat Metab Disord 1999; 23(2):116-125.
(23) Molarius A, Seidell JC, Visscher TL, Hofman A. Misclassification of high-risk older subjects using waist action levels established for young and middle-aged adults--results from the Rotterdam Study. Journal of the American Geriatrics Society 2000; 48(12):1638-1645.
(24) Sonmez K, Akcakoyun M, Akcay A, Demir D, Duran NE, Gencbay M et al. Which method should be used to determine the obesity, in patients with coronary artery disease? (body mass index, waist circumference or waist-hip ratio). Int J Obes Relat Metab Disord 2003; 27(3):341-346.
(25) Taylor RW, Keil D, Gold EJ, Williams SM, Goulding A. Body mass index, waist girth, and waist-to-hip ratio as indexes of total and regional adiposity in women: Evaluation using receiver operating characteristic curves. AM J CLIN NUTR 1998; 67(1):44-49.
(26) Logue E, Smucker WD, Bourguet CC. Identification of obesity: waistlines or weight? Nutrition, Exercise, and Obesity Research Group. Journal of Family Practice 1995; 41(4):357-363.
(27) Guideline synthesis: assessment and treatment of obesity and overweight in adults. National Guideline Clearinghouse (NGC) . 2005. t
(28) Harvey EL, Glenny A, Kirk SF, Summerbell CD. Improving health professionals' management and the organisation of care for overweight and obese people. Cochrane Database of Systematic Reviews 2001;(2):CD000984.
(29) Simkin-Silverman LR, Wing RR. Management of obesity in primary care. Obesity Research 1997; 5:603-612.
(30) Gambera PJ, Schneeman BO, Davis PA. Use of the food guide pyramid and US dietary guidelines to improve dietary intake and reduce cardiovascular risk in active-duty Air Force members. J AM DIET ASSOC 1995; 95(11):1268-1273.
(31) Quality and outcomes framework guidance. 2006. London, BMA. t
Obesity: full guidance FINAL VERSION (December 2006) Page 242

FINAL VERSION
(32) Neovius M, Linne Y, Barkeling B, Rossner S, Neovius M, Linne Y et al. Discrepancies between classification systems of childhood obesity. [Review] [58 refs]. Obes Rev 2004; 5(2):105-114.
(33) Gibson P, Edmunds L, Haslam DW, Poskitt E. An approach to weight management in children and adolescents (2-18 years) in primary care. 2002.
(34) Neovius MG, Linne YM, Barkeling BS, Rossner SO, Neovius MG, Linne YM et al. Sensitivity and specificity of classification systems for fatness in adolescents. Am J Clin Nutr 2004; 80(3):597-603.
(35) Wright CM, Booth IW, Buckler JM, Cameron N, Cole TJ, Healy MJ et al. Growth reference charts for use in the United Kingdom. Arch Dis Child 2002; 86(1):11-14.
(36) Reilly JJ, Wilson ML, Summerbell CD, Wilson DC. Obesity: diagnosis, prevention, and treatment; evidence based answers to common questions. Arch Dis Child 2002; 86(6):392-394.
(37) Reilly JJ, Dorosty AR, Emmett PM. Identification of the obese child: adequacy of the body mass index for clinical practice and epidemiology. Int J Obes Relat Metab Disord 2000; 24(12):1623-1627.
(38) Viner R, Nicholls D. Managing obesity in secondary care: a personal practice. Arch Dis Child 2005; 90.
(39) Douketis JD, Feightner JW, Attia J, Feldman WF, Canadian Task Force on Preventive Health Care. Periodic health examination, 1999 update: 1. Detection, prevention and treatment of obesity. CMAJ Canadian Medical Association Journal 1999; 160(4):513-525.
(40) Deverill C, Doyle M, Erens B, Falaschetti E, Hedges B, Malbut K et al. Health Survey for England. Volume 1 The Health of Children and Young People. Sproston K, Primatesta P, editors. 2003. London, The Stationery Office. t
(41) Stamatakis E. Anthropometric measurements, overweight, and obesity. In: Sproston K, Primatesta P, editors. Health Survey for England. Volume 1 The Health of Children and Young People. London: The Stationery Office; 2003.
(42) Cole TJ, Bellizzi MC, Flegal KM, Dietz WH. Establishing a standard definition for child overweight and obesity worldwide: International survey. British Medical Journal 2000; 320(7244):1240.
(43) National Obesity Forum. Guidelines on management of adult obesity and overweight in primary care. 2002. t
(44) Obesity: preventing and managing the global epidemic. Report of a WHO Consultation. WHO Technical Report Series 894[3], i-253. 2000. World Health Organisation.)
(45) Treating and preventing Obesity. 2004.
(46) Heiat A, Vaccarino V, Krumholz HM. An evidence-based assessment of federal guidelines for overweight and obesity as they apply to elderly persons. ARCH INTERN MED 2001; 161(9):1194-1203.
(47) Lipton RB, Drum M, Burnet D, Rich B, Cooper A, Baumann E et al. Obesity at the onset of diabetes in an ethnically diverse population of children: what does it mean for epidemiologists and clinicians? Pediatrics 2005; 115(5):e553-e560.
Obesity: full guidance FINAL VERSION (December 2006) Page 243

FINAL VERSION
(48) Misra A. Revisions of cutoffs of body mass index to define overweight and obesity are needed for the Asian-ethnic groups. Int J Obes Relat Metab Disord 2003; 27(11):1294-1296.
(49) Misra A. Redefining obesity in Asians: more definitive action is required from the WHO. Natl Med J India 2004; 17(1):1-4.
(50) Stevens J. Ethnic-specific cutpoints for obesity vs country-specific guidelines for action. Int J Obes Relat Metab Disord 2003; 27(3):287-288.
(51) Stevens J. Ethnic-specific revisions of body mass index cutoffs to define overweight and obesity in Asians are not warranted. Int J Obes Relat Metab Disord 2003; 27(11):1297-1299.
(52) James WP. Assessing obesity: are ethnic differences in body mass index and waist classification criteria justified? Obes Rev 2005; 6(3):179-181.
(53) Saxena S, Ambler G, Cole TJ, Majeed A, Saxena S, Ambler G et al. Ethnic group differences in overweight and obese children and young people in England: cross sectional survey.[see comment]. Arch Dis Child 2004; 89(1):30-36.
(54) Taylor SJC, Viner R, Booy R, Head J, Tate H, Brentnall SL et al. Ethnicity, socio-economic status, overweight and underweight in east London adolescents. Ethnicity & Health 2005; 10(2):113-128.
(55) Jafar TH, Islam M, Poulter N, Hatcher J, Schmid CH, Levey AS et al. Children in South Asia have higher body mass-adjusted blood pressure levels than white children in the United States: a comparative study. Circulation 2005; 111(10):1291-1297.
(56) Bavdekar A, Yajnik CS, Fall CH, Bapat S, Pandit AN, Deshpande V et al. Insulin resistance syndrome in 8-year-old Indian children: small at birth, big at 8 years, or both? Diabetes 1999; 48(12):2422-2429.
(57) Misra A, Vikram NK, Arya S, Pandey RM, Dhingra V, Chatterjee A et al. High prevalence of insulin resistance in postpubertal Asian Indian children is associated with adverse truncal body fat patterning, abdominal adiposity and excess body fat. Int J Obes Relat Metab Disord 2004; 28(10):1217-1226.
(58) Whincup PH, Gilg JA, Papacosta O, Seymour C, Miller GJ, Alberti KG et al. Early evidence of ethnic differences in cardiovascular risk: cross sectional comparison of British South Asian and white children. BMJ 2002; 324(7338):635.
(59) Cole TJ, Freeman JV, Preece MA. Body mass index reference curves for the UK, 1990. Arch Dis Child 1995; 73(1):25-29.
(60) WHO, International Obesity tasforce and international association for the study of obesity. The Asia-Pacific perspective: redefining obesity and its treatment. 2000. t
(61) Seidell JC, Kahn HS, Williamson DF, Lissner L, Valdez R. Report from a Centers for Disease Control and Prevention Workshop on use of adult anthropometry for public health and primary health care. Am J Clin Nutr 2001; 73(1):123-126.
(62) Misra A. Revisions of cutoffs of body mass index to define overweight and obesity are needed for the Asian-ethnic groups. Int J Obes Relat Metab Disord 2003; 27(11):1294-1296.
(63) Misra A. Redefining obesity in Asians: more definitive action is required from the WHO. Natl Med J India 2004; 17(1):1-4.
Obesity: full guidance FINAL VERSION (December 2006) Page 244

FINAL VERSION
(64) Stevens J. Ethnic-specific revisions of body mass index cutoffs to define overweight and obesity in Asians are not warranted. Int J Obes Relat Metab Disord 2003; 27(11):1297-1299.
(65) Stevens J. Ethnic-specific cutpoints for obesity vs country-specific guidelines for action. Int J Obes Relat Metab Disord 2003; 27(3):287-288.
(66) James WP. Assessing obesity: are ethnic differences in body mass index and waist classification criteria justified? Obes Rev 2005; 6(3):179-181.
(67) Deurenberg P, Deurenberg-Yap M. Validity of body composition methods across ethnic population groups. Forum Nutr 2003; 56:299-301.
(68) Huxley R, Barzi F, Stolk R, Caterson I, Gill T, Lam TH et al. Ethnic comparisons of obesity in the Asia-Pacific region: protocol for a collaborative overview of cross-sectional studies. Obes Rev 2005; 6(3):193-198.
(69) Bhopal R, Unwin N, White M, Yallop J, Walker L, Alberti KG et al. Heterogeneity of coronary heart disease risk factors in Indian, Pakistani, Bangladeshi, and European origin populations: cross sectional study. BMJ 1999; 319(7204):215-220.
(70) Bhopal R, Hayes L, White M, Unwin N, Harland J, Ayis S et al. Ethnic and socio-economic inequalities in coronary heart disease, diabetes and risk factors in Europeans and South Asians. J Public Health Med 2002; 24(2):95-105.
(71) Fischbacher CM, Bhopal R, Blackwell CC, Ingram R, Unwin NC, White M et al. IgG is higher in South Asians than Europeans: does infection contribute to ethnic variation in cardiovascular disease? Arterioscler Thromb Vasc Biol 2003; 23(4):703-704.
(72) Hayes L, White M, Unwin N, Bhopal R, Fischbacher C, Harland J et al. Patterns of physical activity and relationship with risk markers for cardiovascular disease and diabetes in Indian, Pakistani, Bangladeshi and European adults in a UK population. J Public Health Med 2002; 24(3):170-178.
(73) Pollard TM, Carlin LE, Bhopal R, Unwin N, White M, Fischbacher C. Social networks and coronary heart disease risk factors in South Asians and Europeans in the UK. Ethn Health 2003; 8(3):263-275.
(74) Tavridou A, Unwin N, Bhopal R, Laker MF. Predictors of lipoprotein(a) levels in a European and South Asian population in the Newcastle Heart Project. Eur J Clin Invest 2003; 33(8):686-692.
(75) Bhopal R, Fischbacher C, Vartiainen E, Unwin N, White M, Alberti G. Predicted and observed cardiovascular disease in South Asians: application of FINRISK, Framingham and SCORE models to Newcastle Heart Project data. J Public Health (Oxf) 2005; 27(1):93-100.
(76) Lean ME, Han TS, Bush H, Anderson AS, Bradby H, Williams R. Ethnic differences in anthropometric and lifestyle measures related to coronary heart disease risk between South Asian, Italian and general-population British women living in the west of Scotland. Int J Obes Relat Metab Disord 2001; 25(12):1800-1805.
(77) Fall CH, Yajnik CS, Rao S, Davies AA, Brown N, Farrant HJ. Micronutrients and fetal growth. J Nutr 2003; 133(5 Suppl 2):1747S-1756S.
(78) Yajnik CS, Fall CH, Coyaji KJ, Hirve SS, Rao S, Barker DJ et al. Neonatal anthropometry: the thin-fat Indian baby. The Pune Maternal Nutrition Study. Int J Obes Relat Metab Disord 2003; 27(2):173-180.
Obesity: full guidance FINAL VERSION (December 2006) Page 245

FINAL VERSION
(79) Fall CH, Pandit AN, Law CM, Yajnik CS, Clark PM, Breier B et al. Size at birth and plasma insulin-like growth factor-1 concentrations. Arch Dis Child 1995; 73(4):287-293.
(80) McKeigue PM, Shah B, Marmot MG. Relation of central obesity and insulin resistance with high diabetes prevalence and cardiovascular risk in South Asians. Lancet 1991; 337:382-386.
(81) Patel S, Unwin N, Bhopal R, White M, Harland J, Ayis SAM et al. A comparison of proxy measures of abdominal obesity in Chinese, European and South Asian adults. Diabetic Medicine 1999; 16(10):853-860.
(82) Lovegrove JA, Brady LM, Lesauvage SV, Lovegrove SS, Minihane AM, Williams CM. Lack of association between central adiposity and lipaemia in UK Sikh men. Int J Obes Relat Metab Disord 2003; 27(11):1373-1382.
(83) Bose K. A comparative study of generalised obesity and anatomical distribution of subcutaneous fat in adult White and Pakistani migrant males in Peterborough. Journal of the Royal Society of Health 1995; . 115(2).
(84) Bose K. Generalised obesity and regional adiposity in adult white and migrant Muslim males from Pakistan in Peterborough. Journal of the Royal Society of Health 1996; . 116(3).
(85) Williams R, Bhopal R, Hunt K. Health of a Punjabi ethnic minority in Glasgow: a comparison with the general population. J Epidemiol Community Health 1993; 47(2):96-102.
(86) Williams R, Bhopal R, Hunt K. Coronary risk in a British Punjabi population: comparative profile of non-biochemical factors. Int J Epidemiol 1994; 23(1):28-37.
(87) Dudeja V, Misra A, Pandey RM, Devina G, Kumar G, Vikram NK. BMI does not accurately predict overweight in Asian Indians in northern India. Br J Nutr 2001; 86(1):105-112.
(88) Misra A, Athiko D, Sharma R, Pandey RM, Khanna N. Non-obese hyperlipidemic Asian northern Indian males have adverse anthropometric profile. Nutr Metab Cardiovasc Dis 2002; 12(4):178-183.
(89) Misra A, Pandey RM, Sinha S, Guleria R, Sridhar V, Dudeja V. Receiver operating characteristics curve analysis of body fat & body mass index in dyslipidaemic Asian Indians. Indian J Med Res 2003; 117:170-179.
(90) Misra A, Vikram NK. Clinical and pathophysiological consequences of abdominal adiposity and abdominal adipose tissue depots. Nutrition 2003; 19(5):457-466.
(91) Misra A, Vikram NK. Insulin resistance syndrome (metabolic syndrome) and obesity in Asian Indians: evidence and implications. Nutrition 2004; 20(5):482-491.
(92) Vikram NK, Misra A, Pandey RM, Dudeja V, Sinha S, Ramadevi J et al. Anthropometry and body composition in northern Asian Indian patients with type 2 diabetes: receiver operating characteristics (ROC) curve analysis of body mass index with percentage body fat as standard. Diabetes Nutr Metab 2003; 16(1):32-40.
(93) Vikram NK, Pandey RM, Misra A, Sharma R, Devi JR, Khanna N. Non-obese (body mass index < 25 kg/m2) Asian Indians with normal waist circumference have high cardiovascular risk. Nutrition 2003; 19(6):503-509.
(94) WHO Expert Consultation. Appropriate body-mass index for Asian populations and its implications for policy and intervention strategies. Lancet 2004; 363(9403):157-163.
Obesity: full guidance FINAL VERSION (December 2006) Page 246

FINAL VERSION
(95) Luke A, Durazo-Arvizu R, Rotimi C, Prewitt TE, Forrester T, Wilks R et al. Relation between body mass index and body fat in black population samples from Nigeria, Jamaica, and the United States. Am J Epidemiol 1997; . 145(7).
(96) Dowling HJ, Pi-Sunyer FX. Race-dependent health risks of upper body obesity. Diabetes 1993; 42(4):537-543.
(97) Toschke AM GVKBvKR. Identifying children at high risk for overweight at school entry by weight gain during the first 2 years. Archives of Pediatrics & Adolescent Medicine 2004; 258(5):449-452.
(98) Guo SS, Wu W, Chumlea WC, Roche AF. Predicting overweight and obesity in adulthood from body mass index values in childhood and adolescence. AM J CLIN NUTR 2002; 76(3):653-658.
(99) He Q, Karlberg J. Probability of adult overweight and risk change during the BMI rebound period. Obesity Research 2002; 10(3):135-140.
(100) Barba G GRCGVARPGCeal. The BRAVO project: screening for childhood obesity in a primary school setting. Nutrition Metabolism & Cardiovascular Diseases 2001; 11(4 suppl):103-108.
(101) Metcalf BS, Voss LD, Wilkin TJ. Accelerometers identify inactive and potentially obese children (EarlyBird 3). Archives of Disease in Childhood 2002; 87(2):166-167.
(102) Maffeis C GAPAPSTL. Does waist circumference predict fat gain in children? International Journal of Obesity & Related Metabolic Disorders 2001; 25(7):978-983.
(103) Freedman DS KKLSSBGS. BMI rebound, childhood height and obesity among adults: the Bogalusa Heart Study. International Journal of Obesity and Related Metabolic Disorders 2001; 25(4):543-549.
(104) Freedman DS, Khan LK, Mei Z, Dietz WH, Srinavasan SR, Berenson GS. Relation of childhood height to obesity among adults: the Bogalusa Heart Study. Pediatrics 2002; 109(2):E23-E29.
(105) Kroke A, Liese AD, Bergmann MM, Klipstein-Grobusch K, Hoffman K, Boeing H. Recent weight changes and weight cycling as predictors of subsequent two year weight change in a middle-aged cohort. International Journal of Obesity and Related Metabolic Disorders 2002; 26(3):403-409.
(106) St Jeor ST BRHMeal. A classification system to evaluate weight maintainers, gainers, and losers. J AM DIET ASSOC 1997; 97:481-488.
(107) Tooth L, Ware R, Bain C, Purdie DM, Dobson A. Quality of reporting of observational longitudinal research. Am J Epidemiol 2005; 161(3):280-288.
(108) Scottish Intercollegiate Guidelines Network. Obesity in Scotland, integrating prevention with weight management. 1996. Edinburgh, Scotland, Scottish Intercollegiate Guidelines Network. t
(109) National Screening Committee. National Screening Committee - obesity screening. 2005. UK, National Screening Committee.
(110) Child Growth Foundation, Fry T. Identification and assessment & audit of obesity in children: briefing prepared for the NICE Guidance Development Group. 2004. London, Child Growth Foundation.
(111) House of Commons Health Committee. Obesity: third report of session 2003-04. 2004. London, The Stationery Office Limited.
Obesity: full guidance FINAL VERSION (December 2006) Page 247

FINAL VERSION
(112) Institute for Clinical Systems Improvement. Health care guideline: prevention and management of obesity (mature adolescents and adults). 2004. Bloomington Minnesota, Institute for Clinical Systems Improvement.
(113) Expert panel on the identification eatooia. Clinical guidelines on the identification, evaluation, and treatment of overweight and obesity in adults: Executive summary. AM J CLIN NUTR 1998; 68:899-917.
(114) US Preventive Services Task Force. Screening for obesity in adults: recommendations and rationale. ANN INTERN MED 2003; 139:930-932.
(115) Registered Nurses' Association of Ontario. Primary prevention of childhood obesity. 2005. Ontario, Reistered Nurses' Association of Ontario. Nursing Best Practice Guidelines Program.
(116) National Health and Medical Research Council. Clinical practice guidelines for the management of overweight and obesity in children and adolescents. 2003. Canberra Australia, Commonwealth of Australia.
(117) Holcomb SS. Obesity in children and adolescents: guidelines for prevention and management. Nurse Practitioner 2004; 29(8):9-5.
(118) Krebs NF, Jacobson MS, American Academy of Pediatrics Committee on Nutrition. Prevention of pediatric overweight and obesity. Pediatrics 2003; 112(2):424-430.
(119) Nawaz H, Katz DL. American College of Preventive Medicine practice policy statement: weight management counseling of overweight adults. American Journal of Preventive Medicine 2001; 21(1):73-78.
(120) Collaborative statement from the Dieticians of Canada, Canadian Paediatric Society tCoFPoC, Community Health Nurses of Canada. The use of growth charts for assessing and monitoring growth in Canadian infants and children. Canadian Journal of Dietetic Practice & Research 2004; 65(1):22-32.
(121) National Obesity Taskforce Secretariat. Healthy weight 2008, Australia's future: The national action agenda for children and young people and their families. 2003. Canberra Australia, Commonwealth of Australia.
Obesity: full guidance FINAL VERSION (December 2006) Page 248