Embed Size (px)
Citation preview

DEEWR Budget Statements – Budgeted financial statements
141
Section 3: Explanatory tables and budgeted financial statements
Section 3 presents budgeted financial statements which provide a comprehensive snapshot of agency finances for the budget year 2008-09. It explains how budget plans are incorporated into the financial statements and provides further details of movements in administered funds, special accounts and government indigenous expenditure.
3.1 EXPLANATORY TABLES
3.1.1 Reconciliation of total available appropriation and outcomes
The Agency Resource Statement (Table 1.1) details the total available appropriation available to an agency from all sources. For departmental operating appropriations (outputs) this includes carry-forward amounts as well as amounts appropriated at Budget. As agencies incur and are funded for future liabilities, generally depreciation and employee entitlements, the total amount of departmental operating appropriation available to an agency is unlikely to be fully utilised in the Budget year. The difference between the agency resource statement and the sum of all payments made at the departmental outputs level is the expected carry-forward amount of resources for the 2009-10 Budget year, including amounts related to meeting future obligations to maintain the agency’s asset base and to meet employee entitlement liabilities.
Table 3.1.1: Reconciliation of total available appropriation and outcomes $'000
Total available departmental operating appropriation (outputs)
2,099,717 Less estimated payments in 2008-09 1,880,931
Estimated departmental outputs carried forward and available for 2009-10 218,786
DEEWR Budget Statements – Budgeted financial statements
142
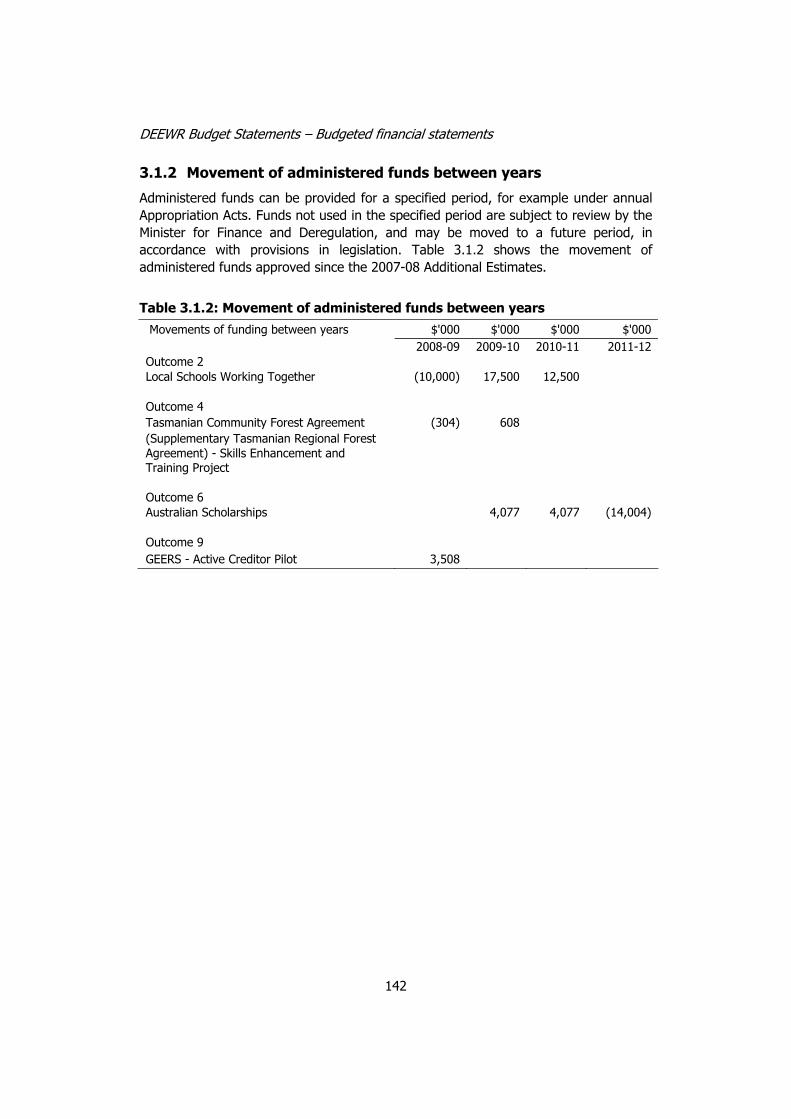
3.1.2 Movement of administered funds between years
Administered funds can be provided for a specified period, for example under annual Appropriation Acts. Funds not used in the specified period are subject to review by the Minister for Finance and Deregulation, and may be moved to a future period, in accordance with provisions in legislation. Table 3.1.2 shows the movement of administered funds approved since the 2007-08 Additional Estimates.
Table 3.1.2: Movement of administered funds between years Movements of funding between years $'000 $'000 $'000 $'000 2008-09 2009-10 2010-11 2011-12 Outcome 2 Local Schools Working Together (10,000) 17,500 12,500 Outcome 4 Tasmanian Community Forest Agreement (304) 608 (Supplementary Tasmanian Regional Forest Agreement) - Skills Enhancement and Training Project
Outcome 6 Australian Scholarships 4,077 4,077 (14,004) Outcome 9 GEERS - Active Creditor Pilot 3,508

DEEWR Budget Statements – Budgeted financial statements
143
3.1.3 Special Accounts
Special accounts provide a means to set aside and record amounts used for specified purposes. Special Accounts can be created by a Finance Minister’s Determination under the Financial Management and Accountability Act 1997 or under separate enabling legislation. Table 3.1.3 shows the expected additions (receipts) and reductions (payments) for each account used by the Department of Education, Employment and Workplace Relations.
Table 3.1.3: Estimates of Special Account cash flows and balances
Opening balance 2008-09 2007-08
$'000
Appropriation Receipts 2008-09 2007-08
$'000
Appropriation Receipts -
other agencies 2008-09 2007-08
$'000
Non-Appropriation
Receipts 2008-09 2007-08
$'000
Payments 2008-09 2007-08
$'000
Adjustments 2008-09 2007-08
$'000
Closing balance 2008-09 2007-08
$'000 Superannuation Productivity Benefits ATAS Tutors - Financial Management and Accountability Act 1997, section 20 (A) 778 35 0 0 5 0 808 748 35 0 0 5 0 778 Students (Financial Supplement) Account - Student Assistance Act 1973 (A) 0 0 0 0 0 0 0 0 0 0 0 0 0 0
Higher Education Endowment Fund Special Account - Higher Education Endowment Fund Act 2007 (A) 0 0 0 443,805 0 (443,805) 0 0 6,000,000 0 254,955 0 (6,254,955) 0 Child Care Centre Capital Replacement and Upgrade Account (A) 0 0 0 0 0 0 0 0 0 0 0 0 0 0 National Youth Affairs Research Scheme Special Account (A) 568 0 0 240 426 382 628 0 0 240 300 0 568 Other Trust Monies - DEST - Financial Management and Accountability Act 1997, section 20D (D) 2,709 0 0 0 0 0 2,709 2,709 0 0 0 0 0 2,709 Other Trust Monies - DEWR - Financial Management and Accountability Act 1997, section 20D (D) 246 0 0 0 0 0 246 246 0 0 0 0 0 246

DEEWR Budget Statements – Budgeted financial statements
144
Table 3.1.3: Estimates of Special Account cash flows and balances (cont)
Opening balance 2008-09 2007-08
$'000
Appropriation Receipts 2008-09 2007-08
$'000
Appropriation Receipts -
other agencies 2008-09 2007-08
$'000
Non-Appropriation
Receipts 2008-09 2007-08
$'000
Payments 2008-09 2007-08
$'000
Adjustments 2008-09 2007-08
$'000
Closing balance 2008-09 2007-08
$'000 Other Trust Monies - DEWR - Financial Management and Accountability Act 1997, section 20D (A) 201 0 0 0 0 0 201 201 0 0 0 0 0 201
Services for Other Government and Non-Government Bodies - DEST - Financial Management and Accountability Act 1997, section 20 (D) 1,418 0 0 0 0 0 1,418 1,418 0 0 0 0 0 1,418
International Marketing of Education Special Account - Financial Management and Accountability Act 1997, section 20 (D) 4,400 6,000 0 2,000 8,000 0 4,400 3,163 5,969 0 1,468 6,200 0 4,400 Total special accounts 2008-09 Budget estimate 10,320 6,035 0 446,045 8,305 (443,805) 10,290 Total special accounts 2007-08 estimate actual 9,113 6,006,004 0 256,663 6,505 (6,254,955) 10,320
(A) = Administered (D) = Departmental
DEEWR Budget Statements – Budgeted financial statements
145
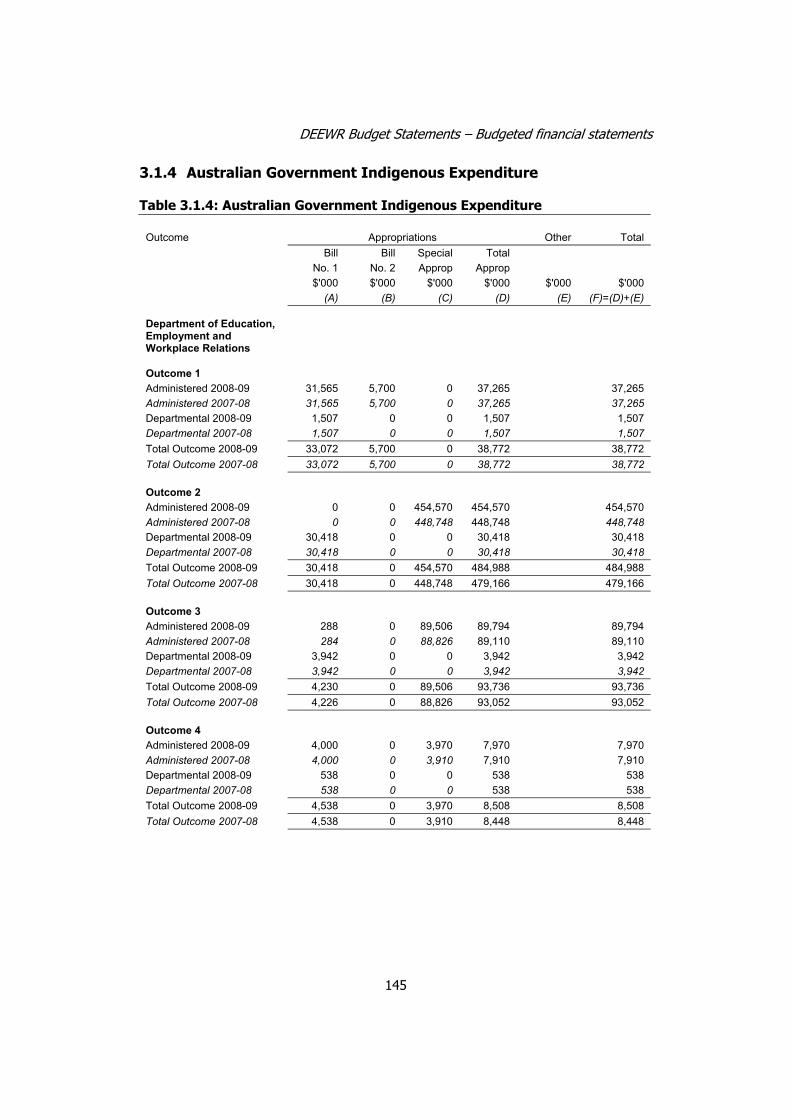
3.1.4 Australian Government Indigenous Expenditure
Table 3.1.4: Australian Government Indigenous Expenditure Outcome Appropriations Other Total
Bill Bill Special Total No. 1 No. 2 Approp Approp
$'000 $'000 $'000 $'000 $'000 $'000 (A) (B) (C) (D) (E) (F)=(D)+(E)
Department of Education, Employment and Workplace Relations
Outcome 1 Administered 2008-09 31,565 5,700 0 37,265 37,265 Administered 2007-08 31,565 5,700 0 37,265 37,265 Departmental 2008-09 1,507 0 0 1,507 1,507 Departmental 2007-08 1,507 0 0 1,507 1,507 Total Outcome 2008-09 33,072 5,700 0 38,772 38,772 Total Outcome 2007-08 33,072 5,700 0 38,772 38,772 Outcome 2 Administered 2008-09 0 0 454,570 454,570 454,570 Administered 2007-08 0 0 448,748 448,748 448,748 Departmental 2008-09 30,418 0 0 30,418 30,418 Departmental 2007-08 30,418 0 0 30,418 30,418 Total Outcome 2008-09 30,418 0 454,570 484,988 484,988 Total Outcome 2007-08 30,418 0 448,748 479,166 479,166 Outcome 3 Administered 2008-09 288 0 89,506 89,794 89,794 Administered 2007-08 284 0 88,826 89,110 89,110 Departmental 2008-09 3,942 0 0 3,942 3,942 Departmental 2007-08 3,942 0 0 3,942 3,942 Total Outcome 2008-09 4,230 0 89,506 93,736 93,736 Total Outcome 2007-08 4,226 0 88,826 93,052 93,052 Outcome 4 Administered 2008-09 4,000 0 3,970 7,970 7,970 Administered 2007-08 4,000 0 3,910 7,910 7,910 Departmental 2008-09 538 0 0 538 538 Departmental 2007-08 538 0 0 538 538 Total Outcome 2008-09 4,538 0 3,970 8,508 8,508 Total Outcome 2007-08 4,538 0 3,910 8,448 8,448
DEEWR Budget Statements – Budgeted financial statements
146
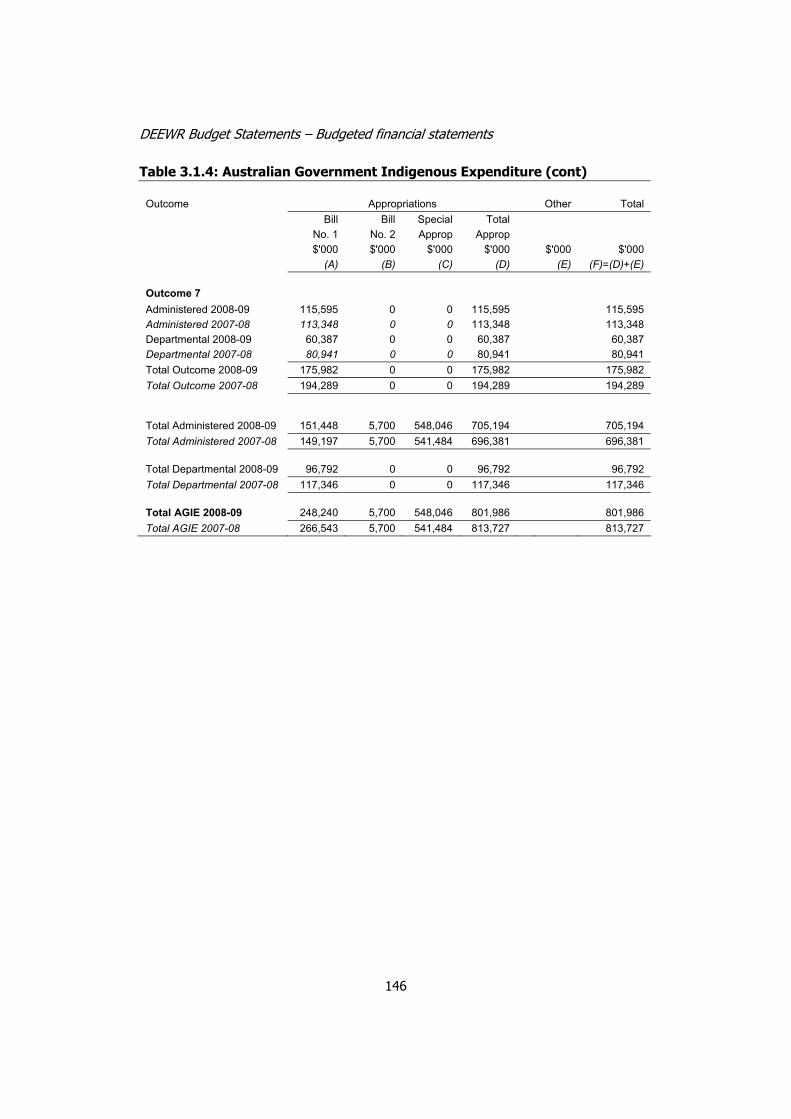
Table 3.1.4: Australian Government Indigenous Expenditure (cont) Outcome Appropriations Other Total
Bill Bill Special Total No. 1 No. 2 Approp Approp
$'000 $'000 $'000 $'000 $'000 $'000 (A) (B) (C) (D) (E) (F)=(D)+(E)
Outcome 7
Administered 2008-09 115,595 0 0 115,595 115,595 Administered 2007-08 113,348 0 0 113,348 113,348 Departmental 2008-09 60,387 0 0 60,387 60,387 Departmental 2007-08 80,941 0 0 80,941 80,941 Total Outcome 2008-09 175,982 0 0 175,982 175,982 Total Outcome 2007-08 194,289 0 0 194,289 194,289 Total Administered 2008-09 151,448 5,700 548,046 705,194 705,194 Total Administered 2007-08 149,197 5,700 541,484 696,381 696,381 Total Departmental 2008-09 96,792 0 0 96,792 96,792 Total Departmental 2007-08 117,346 0 0 117,346 117,346 Total AGIE 2008-09 248,240 5,700 548,046 801,986 801,986 Total AGIE 2007-08 266,543 5,700 541,484 813,727 813,727
DEEWR Budget Statements – Budgeted financial statements
147
3.2 BUDGETED FINANCIAL STATEMENTS
3.2.1 Differences in agency resourcing and financial statements
The Department was established by the Administrative Arrangement Orders of 3 December 2007 and 25 January 2008. The Budget papers provide a part year 2007-08 comparator for the period 3 December 2007 to 30 June 2008 reflecting the establishment of the new Department of Education, Employment and Workplace Relations.
A full year 2007-08 comparator has been provided in financial tables, including the budgeted financial statements, which is made up of:
• all former Department of Education, Science and Training functions from 1 July 2007 to 3 December 2007 (including the science and research functions transferred to the Departments of Industry, Innovation, Science and Research, Resources, Energy and Tourism).
• all former Department of Employment and Workplace Relations functions from 1 July 2007 to 3 December 2007 (including the Community Development and Employment Projects Program and the Disability Support Program transferred to the Department of Families, Housing, Communities and Indigenous Affairs); and
• all functions of the new Department of Education, Employment and Workplace Relations for the period 3 December 2007 to 30 June 2008 (including the child care and youth functions gained from the Department of Families, Housing, Communities and Indigenous Affairs).
The exception is in Tables 2.1 to 2.9 (Total Resources for Outcomes) where science and research functions have not been included as there is no longer an appropriate outcome under which to present this data.
3.2.2 Analysis of budgeted financial statements
An analysis of the Department’s budgeted financial statements, which consists of the budgeted departmental financial statements and administered schedules is provided below. The 2007-08 estimated actual is used as the comparative year for the analysis although some comments on broader trends in the forward estimates are provided.
Departmental financial statements
Income Statement
The Department is budgeting for a break even operating result for 2008-09. Total income and expenses are estimated to be $1,957 million, an increase of $53.7 million. The increase represents the effect of previous budget measures (particularly measures

DEEWR Budget Statements – Budgeted financial statements
148
ceasing and the cumulative impact of efficiency dividends), measures announced in the 2008-09 budget and the impact of Machinery of Government changes.
The estimates for income and expenses decline by an expected $204.9 million from the 2008-09 budget to the 2009-2010 forward estimate. Of this decrease $152.6 million relates to Centrelink payments, $13.7 million reduction in relation to Employment Services purchasing and $21.0 million relates to funding for the Northern Territory Emergency Response.
Balance Sheet
The budgeted net asset position of $182.2 million, represents a $6.4 million increase from the 2007-08 estimated actual. The increase largely reflects investment in office fit-out and internally developed software as a result of the formation of the new department and in support of the delivery of government measures.
The structure of the balance sheet reflects the nature of the organisation. Key assets are office fit-out (included in land and buildings), computer and office machines (included in infrastructure, plant and equipment) and computer software (included in intangibles). The most significant liability relates to employees and the leave provisions that are accrued as a result of their employment.
Administered Schedules
Income and expenses
It is estimated that the department will receive revenue administered on behalf of the Government of $604.4 million, an increase of $200.8 million. The main item and cause of the increase is interest from the HEEF which increases from $255.0 million in 2007-08 to $443.8 million in 2008-09 due to investments in the fund in 2007-08 being made throughout the year so a full year of interest will not be earned.
Administered expenses in 2008-09 are $38,173 million, a decrease of $56.6 million. This decrease is largely a result of:
o $4,806 million of expenses included in the 2007-08 estimated outcome that relate to programs that have transferred to other agencies as a result of machinery of government changes, offset by
o An increase of $2,197 million of expenses due to the part year effect of the transfer of childcare programs to the department as a result of machinery of government changes
o Budget measures of $548.4 million
o Flow through effects and funding patterns associated with previous government measures
o Adjustments due to changes in beneficiary numbers and average rates for income support programs

DEEWR Budget Statements – Budgeted financial statements
149
o Increases reflecting the application of economic parameters to expense estimates.
Assets and Liabilities
Total assets administered on behalf of Government are forecast to increase by $1,121 million to $21,803 million. The increase is mainly due to the:
o increase in the fair value of loans under the HELP as further loans are made
o increase in the value of the HEEF due to interest being accrued and no payments being planned.
Administered liabilities are expected to decline by $157.1 million to $945.6 million due to a reduction in the grants provision for unfunded university superannuation due to payments as costs emerge and changes to the estimated accrued benefits for income support payments as at 30 June 2009.

DEEWR Budget Statements – Budgeted financial statements
150
3.2.3 Budgeted financial statements tables
Table 3.2.1: Budgeted departmental income statement (for the period ended 30 June)
Estimated Budget Forward Forward Forward actual estimate estimate estimate estimate 2007-08 2008-09 2009-10 2010-11 2011-12 $'000 $'000 $'000 $'000 $'000
INCOME Revenue
Revenues from Government 1,810,628 1,883,693 1,678,801 1,682,920 1,707,448 Goods and services 64,857 46,446 46,449 46,447 46,450 Interest 40 0 0 0 0 Other 10,562 9,671 9,670 9,670 9,671
Total revenue 1,886,087 1,939,810 1,734,920 1,739,037 1,763,569 Gains
Other 17,459 17,460 17,462 17,458 17,460 Total gains 17,459 17,460 17,462 17,458 17,460 Total income 1,903,546 1,957,270 1,752,382 1,756,495 1,781,029 EXPENSE
Employees 469,377 435,049 408,862 398,238 402,602 Suppliers 1,356,688 1,441,870 1,260,047 1,273,276 1,288,016 Grants 2,284 2,284 2,284 2,284 2,284 Depreciation and amortisation 75,197 78,067 81,189 82,697 88,127
Total expenses 1,903,546 1,957,270 1,752,382 1,756,495 1,781,029 Surplus (Deficit) before income tax Income tax expense Surplus/(Deficit)
Minority interest in surplus (deficit)
Surplus (deficit) attributable
to the Australian Government 0 0 0 0 0
Surplus (Deficit) before income tax Income tax expense Surplus/(Deficit)
Minority interest in surplus (deficit)
Surplus (deficit) attributable
to the Australian Government 0 0 0 0 0

DEEWR Budget Statements – Budgeted financial statements
151
Table 3.2.2: Budgeted departmental balance sheet (as at 30 June)
Estimated Budget Forward Forward Forward actual estimate estimate estimate estimate 2007-08 2008-09 2009-10 2010-11 2011-12 $'000 $'000 $'000 $'000 $'000 ASSETS Financial assets
Cash and equivalents 7,178 6,809 6,462 5,763 5,763 Trade and other Receivables 177,192 180,213 160,293 159,516 154,937 Other 3,498 3,498 3,498 3,498 3,498
Total financial assets 187,868 190,520 170,253 168,777 164,198 Non-financial assets
Land and buildings 59,456 77,812 114,545 109,881 102,942 Infrastructure, plant and equipment 71,865 67,581 71,947 79,795 85,970 Inventories 1,861 1,861 1,861 1,861 1,861 Intangibles 87,983 98,368 100,417 98,316 100,653 Other 14,532 14,532 14,532 14,532 14,532
Total non-financial assets 235,697 260,154 303,302 304,385 305,958 Assets held for sale
Total assets 423,565 450,674 473,555 473,162 470,156 LIABILITIES Interest bearing liabilities Total interest bearing liabilities 0 0 0 0 0 Provisions
Employees 147,969 150,210 151,195 151,621 151,421 Other 11,110 11,110 11,110 11,110 11,110
Total provisions 159,079 161,320 162,305 162,731 162,531 Payables
Suppliers 64,371 82,845 81,269 79,872 78,470 Other 24,284 24,284 24,284 24,284 24,284
Total payables 88,655 107,129 105,553 104,156 102,754 Liabilities included in disposal
groups held for sale Total liabilities 247,734 268,449 267,858 266,887 265,285 Net assets 175,831 182,225 205,697 206,275 204,871

DEEWR Budget Statements – Budgeted financial statements
152
Table 3.2.2: Budgeted departmental balance sheet (as at 30 June) (cont)
Estimated Budget Forward Forward Forward actual estimate estimate estimate estimate 2007-08 2008-09 2009-10 2010-11 2011-12 $'000 $'000 $'000 $'000 $'000 EQUITY* Parent entity interest
Contributed equity 175,831 182,225 205,697 206,275 204,871 Reserves 0 0 0 0 0 Retained surpluses or
accumulated deficits 0 0 0 0 0 Total parent entity interest 175,831 182,225 205,697 206,275 204,871 Minority interest Total minority interest 0 0 0 0 0 Total equity 175,831 182,225 205,697 206,275 204,871 Current assets 148,248 157,736 165,744 165,607 164,555 Non-current assets 275,317 292,938 307,811 307,555 305,601 Current liabilities 215,529 233,551 233,036 232,192 230,798 Non-current liabilities 32,205 34,898 34,822 34,695 34,487
* 'Equity' is the residual interest in assets after deduction of liabilities. Prepared on Australian Accounting Standards basis.

DEEWR Budget Statements – Budgeted financial statements
153
Table 3.2.3: Budgeted departmental statement of cash flows (for the period ended 30 June)
Estimated Budget Forward Forward Forward actual estimate estimate estimate estimate 2007-08 2008-09 2009-10 2010-11 2011-12 $'000 $'000 $'000 $'000 $'000 OPERATING ACTIVITIES Cash received
Goods and services 64,847 46,446 46,449 46,447 46,450 Appropriations 1,818,326 1,879,272 1,697,321 1,682,297 1,710,627 Interest 40 0 0 0 0 Net GST received 35,609 39,903 39,558 40,023 40,179 Other 10,995 9,671 9,670 9,670 9,670
Total cash received 1,929,817 1,975,292 1,792,998 1,778,437 1,806,926 Cash used
Employees 473,415 432,808 407,877 397,812 402,802 Suppliers 1,356,967 1,405,955 1,244,180 1,257,236 1,271,980 Grants 2,284 2,284 2,284 2,284 2,284 Net GST paid 39,691 39,884 39,539 40,004 40,160
Total cash used 1,872,357 1,880,931 1,693,880 1,697,336 1,717,226 Net cash from or (used by)
operating activities 57,460 94,361 99,118 81,101 89,700 INVESTING ACTIVITIES Cash received
Proceeds from sales of property, plant and equipment
Proceeds from sales of financial instruments
Investments Other
Total cash received 0 0 0 0 0 Cash used
Purchase of property, plant 31,166 59,570 85,522 47,873 49,431 and equipment
Purchase of intangibles 25,784 42,954 38,815 35,907 40,269 Investments Other
Total cash used 56,950 102,524 124,337 83,780 89,700 Net cash from or (used by)
investing activities (56,950) (102,524) (124,337) (83,780) (89,700)

DEEWR Budget Statements – Budgeted financial statements
154
Table 3.2.3: Budgeted departmental statement of cash flows (for the period ended 30 June) (cont)
Estimated Budget Forward Forward Forward actual estimate estimate estimate estimate 2007-08 2008-09 2009-10 2010-11 2011-12 $'000 $'000 $'000 $'000 $'000 FINANCING ACTIVITIES Cash received
Appropriations - contributed equity 6,668 7,794 24,872 1,980 0 Proceeds from issuing financial
instruments Other
Total cash received 6,668 7,794 24,872 1,980 0 Cash used
Repayments of debt Dividends paid Other 0 0 0 0 0
Total cash used 0 0 0 0 0 Net cash from or (used by) 6,668 7,794 24,872 1,980 0
financing activities Net increase or (decrease) 7,178 (369) (347) (699) 0
in cash held Cash at the beginning of
the reporting period 7,178 6,809 6,462 5,763 Effect of exchange rate movements
on cash at the beginning of reporting period
Cash at the end of the reporting period 7,178 6,809 6,462 5,763 5,763
Prepared on Australian Accounting Standards basis

DEEWR Budget Statements – Budgeted financial statements
155
Table 3.2.4: Departmental statement of changes in equity — summary of movement (Budget year 2007-08)
Retained Asset Other Contributed Total earnings revaluation reserves equity/ equity reserve capital $'000 $'000 $'000 $'000 $'000
Opening balance as at 1 July 2008 Balance carried forward from
previous period 0 0 0 175,831 175,831 Adjustment for changes in
accounting policies Adjusted opening balance 0 0 0 175,831 175,831 Income and expense
Income and expenses recognised directly in equity:
Gain/loss on revaluation of property
Sub-total income and expense 0 0 0 0 0
Surplus (deficit) for the period Total income and expenses
recognised directly in equity 0 0 0 175,831 175,831 Transactions with owners
Distribution to owners Returns on capital
Dividends Returns of capital
Restructuring (1,400) (1,400) Other
Contribution by owners Appropriation (equity injection) 7,794 7,794 Other:
Restructuring Sub-total transactions with owners 0 0 0 6,394 6,394
Transfers between equity components
Estimated closing balance
as at 30 June 2009 0 0 0 182,225 182,225 Prepared on Australian Accounting Standards basis

DEEWR Budget Statements – Budgeted financial statements
156
Table 3.2.5: Schedule of budgeted income and expenses administered on behalf of Government (for the period ended 30 June)
Estimated Budget Forward Forward Forward actual estimate estimate estimate estimate 2007-08 2008-09 2009-10 2010-11 2011-12 $'000 $'000 $'000 $'000 $'000 INCOME ADMINISTERED ON
BEHALF OF GOVERNMENT Revenue Taxation
Other taxes, fees and fines 68,080 74,900 82,400 90,610 90,610 Total taxation 68,080 74,900 82,400 90,610 90,610 Non-taxation
Interest 254,955 443,805 457,563 469,002 480,727 Other sources of non-taxation 80,599 85,712 83,707 93,276 93,127
revenues Total non-taxation 335,554 529,517 541,270 562,278 573,854 Total revenues administered
on behalf of Government 403,634 604,417 623,670 652,888 664,464 Total income administered
on behalf of Government 403,634 604,417 623,670 652,888 664,464 EXPENSES ADMINISTERED ON
BEHALF OF GOVERNMENT Grants 16,007,797 17,154,709 18,634,511 19,147,094 20,293,638 Subsidies 720,759 749,865 776,124 804,360 810,666 Personal benefits 18,383,683 16,939,529 17,020,324 17,586,373 18,052,142 Suppliers 2,708,841 2,838,694 2,842,494 2,892,302 2,914,049 Write down and impairment of
assets 275,843 360,488 363,890 371,770 366,662
Deferral costs 133,063 130,128 132,072 122,851 107,467 Total expenses administered
on behalf of Government 38,229,986 38,173,413 39,769,415 40,924,750 42,544,624 Prepared on Australian Accounting Standards basis

DEEWR Budget Statements – Budgeted financial statements
157
Table 3.2.6: Schedule of budgeted assets and liabilities administered on behalf of Government (as at 30 June)
Estimated Budget Forward Forward Forward actual estimate estimate estimate estimate 2007-08 2008-09 2009-10 2010-11 2011-12 $'000 $'000 $'000 $'000 $'000 ASSETS ADMINISTERED ON
BEHALF OF GOVERNMENT Financial assets
Cash and cash equivalents 6,267,995 6,714,485 6,788,721 6,953,723 7,127,173 Receivables 12,434,466 13,108,514 13,995,944 14,858,091 15,563,104 Investments 1,913,871 1,913,871 1,913,871 1,913,871 1,913,871 Other financial assets 196 445 507 528 528
Total financial assets 20,616,528 21,737,315 22,699,043 23,726,213 24,604,676 Non-financial assets
Inventories 216 216 216 216 216 Prepayments 1,308 1,308 1,308 1,308 1,308 Other 64,214 64,101 64,101 64,101 64,101
Total non-financial assets 65,738 65,625 65,625 65,625 65,625 Total assets administered
on behalf of Government 20,682,266 21,802,940 22,764,668 23,791,838 24,670,301
LIABILITIES ADMINISTERED ON BEHALF OF GOVERNMENT
Interest bearing liabilities Loans 16,621 16,621 16,621 16,621 16,621
Total interest bearing liabilities 16,621 16,621 16,621 16,621 16,621
Provisions
Grants provision 3,032,558 2,915,345 2,795,388 2,672,703 2,547,590 Total provisions 3,032,558 2,915,345 2,795,388 2,672,703 2,547,590 Payables
Suppliers 112,473 112,520 112,607 112,607 112,607 Subsidies 25,733 25,733 25,733 25,733 25,733 Personal benefits payable 842,530 695,554 722,075 786,415 852,924 Grants 67,292 57,117 50,440 38,718 22,508 Other payables 54,714 54,714 54,714 54,714 54,714
Total payables 1,102,742 945,638 965,569 1,018,187 1,068,486 Total liabilities administered
on behalf of Government 4,151,921 3,877,604 3,777,578 3,707,511 3,632,697 Prepared on Australian Accounting Standards basis
DEEWR Budget Statements – Budgeted financial statements
158
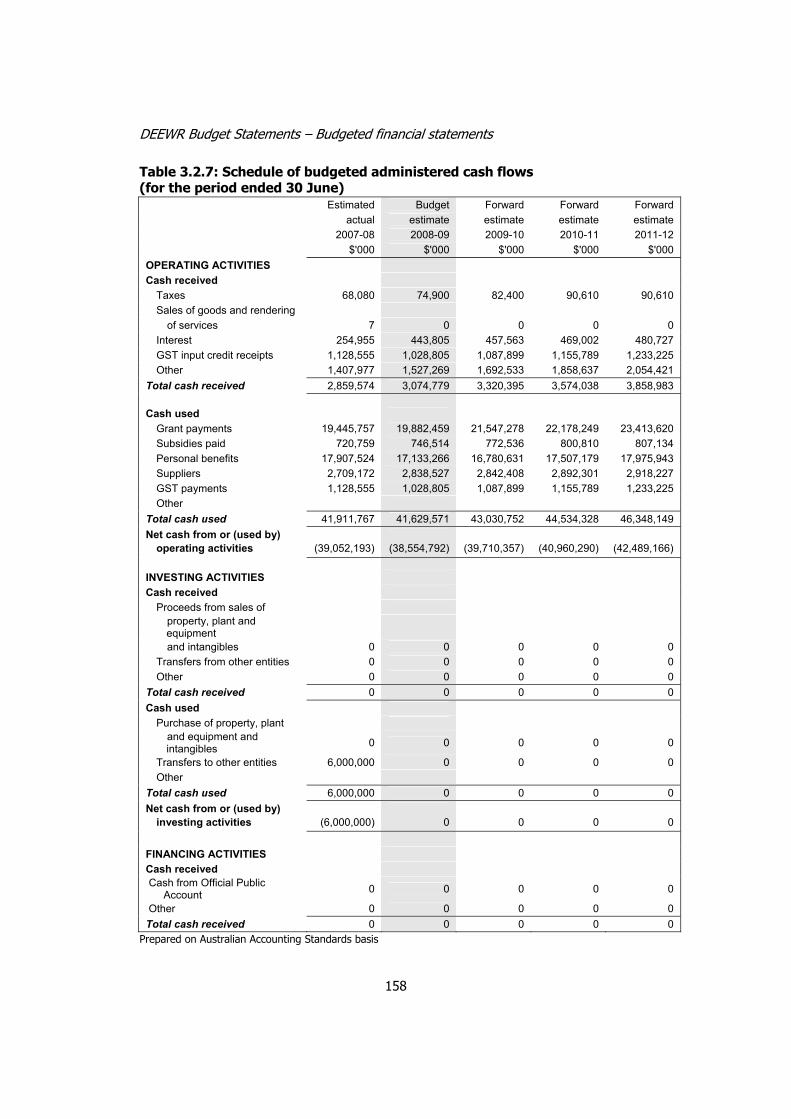
Table 3.2.7: Schedule of budgeted administered cash flows (for the period ended 30 June)
Estimated Budget Forward Forward Forward actual estimate estimate estimate estimate 2007-08 2008-09 2009-10 2010-11 2011-12 $'000 $'000 $'000 $'000 $'000 OPERATING ACTIVITIES Cash received
Taxes 68,080 74,900 82,400 90,610 90,610 Sales of goods and rendering
of services 7 0 0 0 0 Interest 254,955 443,805 457,563 469,002 480,727 GST input credit receipts 1,128,555 1,028,805 1,087,899 1,155,789 1,233,225 Other 1,407,977 1,527,269 1,692,533 1,858,637 2,054,421
Total cash received 2,859,574 3,074,779 3,320,395 3,574,038 3,858,983 Cash used
Grant payments 19,445,757 19,882,459 21,547,278 22,178,249 23,413,620 Subsidies paid 720,759 746,514 772,536 800,810 807,134 Personal benefits 17,907,524 17,133,266 16,780,631 17,507,179 17,975,943 Suppliers 2,709,172 2,838,527 2,842,408 2,892,301 2,918,227 GST payments 1,128,555 1,028,805 1,087,899 1,155,789 1,233,225 Other
Total cash used 41,911,767 41,629,571 43,030,752 44,534,328 46,348,149 Net cash from or (used by)
operating activities (39,052,193) (38,554,792) (39,710,357) (40,960,290) (42,489,166) INVESTING ACTIVITIES Cash received
Proceeds from sales of property, plant and
equipment
and intangibles 0 0 0 0 0 Transfers from other entities 0 0 0 0 0 Other 0 0 0 0 0
Total cash received 0 0 0 0 0 Cash used
Purchase of property, plant and equipment and
intangibles 0 0 0 0 0
Transfers to other entities 6,000,000 0 0 0 0 Other
Total cash used 6,000,000 0 0 0 0 Net cash from or (used by)
investing activities (6,000,000) 0 0 0 0 FINANCING ACTIVITIES Cash received Cash from Official Public Account 0 0 0 0 0
Other 0 0 0 0 0 Total cash received 0 0 0 0 0
Prepared on Australian Accounting Standards basis

DEEWR Budget Statements – Budgeted financial statements
159
Table 3.2.7: Schedule of budgeted administered cash flows (for the period ended 30 June) (cont)
Estimated Budget Forward Forward Forward actual estimate estimate estimate estimate 2007-08 2008-09 2009-10 2010-11 2011-12 $'000 $'000 $'000 $'000 $'000 Cash used Cash to Official Public Account 0 0 0 0 0 Other 0 0 0 0 0 Total cash used 0 0 0 0 0 Net cash from or (used by)
financing activities 0 0 0 0 0 Net increase or (decrease) in
cash held (45,052,193) (38,554,792) (39,710,357) (40,960,290) (42,489,166) Cash at beginning of reporting period
10,357
,267,995 714,485 953,723 1,127,173
Cash from Official Public Account for:
- appropriations 40,774,868 40,628,014 41,574,569 43,100,243 44,834,524 - special accounts 6,000,000 0 0 0 0
Cash to Official Public Account for:
- appropriations (1,465,037) (1,626,732) (1,789,976) (1,974,951) (2,171,908) - special accounts 0 0 0 0 0
Cash at end of reporting period 267,995 714,485 788,721 953,723 1,127,173
Prepared on Australian Accounting Standards basis

DEEWR Budget Statements – Budgeted financial statements
160
3.2.4 Notes to the financial statements
Accounting Policy
The budgeted financial statements have been prepared in accordance with the requirements of the Finance Minister’s Orders issued by the Minister for Finance and Deregulation.
The statements have been prepared:
• on an accrual accounting basis
• in compliance with Australian Accounting Standards and Australian Equivalents to International Financial Reporting Standards (AEIFRS) and other authoritative pronouncements of the Australian Accounting Standards Board and the Consensus Views of the Urgent Issues Group
• having regard to Statements of Accounting Concepts.
Departmental revenue from government
Revenue from government represents the purchase of outputs from the department by the government. The change reflected in the ordinary annual appropriations are a result of those new measures and variations that are explained in Section 1: Agency overview and resources.
Departmental revenue from other sources
Revenue from the sale of goods and services is recognised upon the delivery of the goods or services to the customers.
Departmental gains
Services received free of charge are recognised as gains when a fair value can be reliably determined and the services would have been purchased if they had not been donated. Use of those resources is recognised as an expense.
Departmental expenses – employees
This item represents payments made and net increases or decreases in entitlements owed to employees for their services provided in the financial year.
Departmental expenses – suppliers
This item represents payments to suppliers for goods and services. It includes contracted payments made to Centrelink for services received.
DEEWR Budget Statements – Budgeted financial statements
161
Departmental expenses – depreciation and amortisation
Property, plant and equipment assets are written-off to their estimated residual value over their estimated useful lives to the department using the straight-line method of depreciation. Forward estimates of depreciation expense are made using forecasts of net capital acquisitions over the forward years.
Departmental assets – financial assets – receivables
Receivables represent amounts owing to the department for goods and services it has provided to external parties, cash reserves held in the Official Public Account which are recorded as receivable and prepayments.
Departmental assets – non-financial assets
These items represent future economic benefits that the department will consume in producing outputs. Following initial recognition at cost, Land and Buildings, Infrastructure, Plant and Equipment are carried at fair value less accumulated depreciation. Valuations are conducted with sufficient frequency to ensure that the carrying amount does not differ materially from the assets’ fair values at reporting date.
Computer software, disclosed in the Departmental Balance Sheet as Intangibles, are expensed in the year of acquisition except for purchases of internally developed software costing more than the appropriate threshold which are capitalised at cost.
Departmental liabilities – provisions – employees
Provision has been made for the department’s liability for employee entitlements arising from services rendered by employees to balance date. This liability encompasses wages and salaries, that are yet to be paid, annual and long service leave. No provision is made for sick leave.
Employee entitlements payable are measured as the present value of the estimated future cash outflows to be made in respect of services provided by employees up to the reporting date. Liabilities expected to be settled within twelve months are measured at the nominal amount.
Departmental liabilities – payables – suppliers
Suppliers and other payables are recognised at amortised cost. Liabilities are recognised to the extent that the goods or services have been received (and irrespective of having been invoiced).

DEEWR Budget Statements – Budgeted financial statements
162
Administered revenue – taxation revenue
Black Coal Mining Industry Levy: Since 1993, employers have been required to pay a levy of payroll into a central fund managed by the Coal Mining Industry (Long Service Leave) Corporation.
Administered revenue – interest
This amount comprises interest earned on the Higher Education Endowment Fund which was established under the Higher Education Endowment Fund Act 2007.
Administered revenue - non taxation revenue
Reflects the amounts owed by students under the Student Financial Supplement Scheme (SFSS) being increased through the application of CPI.
Administered expenses – grants
The Grants expenses include funding provided to the schools, vocational education and training and higher education (multi-jurisdictional) sectors.
Administered expenses – subsidies
Subsidies reflect the amount of funding estimated to be provided to employers under the Australian Apprenticeship Scheme and payments under the Indigenous Employment Program and the Coal Mining Industry (Long Service Leave) Payroll Levy Act 1992.
Administered expenses – personal benefits
These include payments made in respect of the Child Care Tax Rebate, Child Care Benefit, New Enterprise Incentive Scheme, General Employee Entitlements and Redundancy Scheme payments, Parenting Payments, Newstart Allowance, Pensioner Education Supplement, Partner Allowance, Widow Allowance, Youth Allowance, ABSTUDY, Sickness Allowance, Mobility Allowance, Mature Age Allowance, Special Employee Entitlements Scheme for Ansett Group Employees, Ex Gratia Payment, Utilities Allowance, Asbestos, Act of Grace and Modified Compliance Framework.
Administered expenses – suppliers
These comprise a range of administered programs the most significant being the Job Network, New Apprenticeship Centres, Workforce Skills Development, New Apprenticeship Access Program, the Language, Literacy and Numeracy Program, Work for the Dole, Rehabilitation Services, and Indigenous Employment.
DEEWR Budget Statements – Budgeted financial statements
163
Administered expenses – deferral cost
This component reflects deferral costs on loans provided to students under HELP. Deferral costs arise due to the income contingent nature of the repayment arrangement and is the cost resulting from payments being received over an extended period.
Administered expenses - write down and impairment of assets
This relates to loans provided to students under HELP and reflects those amounts not expected to be repaid, partially offset by the amounts owed by students increasing due to the application of CPI.
Administered assets - financial assets - cash and cash equivalents
This includes the balance of the HEEF that is managed by the Future Fund Management Agency (FFMA). Pending the development of legislation establishing the Education Investment Fund (EIF), the administered financial schedules in these Portfolio Budget Statements reflect the amounts currently held in the HEEF. Following the establishment of the EIF the amounts currently held in the HEEF, together with the associated interest and payment flows, will be transferred to the new fund.
Administered assets – financial assets – receivables
The main component of the receivable is loans provided to students under HELP and SFSS. The value of these loans are based on a ‘fair value’ which accounts for an estimate of those amounts that are not expected to be repaid as well as the cost of repayments being deferred due to the income contingent nature of the repayment arrangements. The other significant component is receivables relating to personal benefit overpayments.
Administered liabilities
This chiefly comprises a grants provision for the Australian Government share of the unfunded superannuation liability in respect of university employees.