Embed Size (px)
Citation preview
SECTION 3.7
Air Quality
3.7 AIR QUALITY
WATER CONSERVATION AND TRANSFER PROJECT—FINAL EIR/EIS, OCTROBER 2002SFO\SEC_3.7.DOC\022950013 3.7-1
3.7 Air Quality3.7.1 Introduction and SummaryThis section describes the environmental setting and impacts related to air quality in thefollowing geographic subregions: LCR, IID water service area and AAC, and Salton Sea .Regional air quality designations, ambient pollutant concentrations, and meteorologicalconditions, project-related sources of air pollutant emissions, and potential air qualityimpacts are discussed.
Air quality impacts associated with the Proposed Project and Alternatives would resultfrom the construction and operation of new systems and facilities, and from the potentialwind erosion of soil from fallowed fields and/or shoreline sediments exposed by loweredwater levels in the Salton Sea. The pollutants of greatest concern are ozone and the ozoneprecursors, nitrogen oxides (NOx), and volatile organic compounds (VOC), primarily fromequipment exhaust, and fine particulate matter (PM10 and PM2.5) from soil disturbance andwind erosion (fugitive dust). The main impacts would occur in the IID water service areabecause of construction activities and land fallowing, and in the Salton Sea subregion fromexposure of the shoreline.
Neither LCR nor the SDCWA service area is expected to experience significant air qualityimpacts as a result of implementation of the Proposed Project or Alternatives. Becauseconstruction and operation of the on-farm and water delivery system conservation measuresand treatment facilities would not occur in the LCR or SDCWA areas, there would be nosignificant air quality impacts associated with construction or operation of the ProposedProject in these subregions. Due to decreased water levels in the Colorado River betweenParker Dam and Imperial Dam, there is some potential for increased fugitive dust emissionsfrom exposed shoreline. However, the amount of land exposed by decreased water levels isrelatively small, and some of the area will become re-vegetated. Backwaters would bereplaced. The potential increase in windblown dust from exposed areas along the ColoradoRiver would be minimal.
A summary of the impacts to air quality in the four geographic subregions as a result ofimplementation of the Proposed Project or Alternatives is presented in Table 3.7-1.
3.7.2 Regulatory FrameworkRegulatory programs have been established at the national, state, and local levels to addressair quality. These programs are intended to protect air quality in areas of attainment and toimprove air quality in areas where pollutant concentrations exceed health-based criteria.
Air quality regulatory programs characterize the concentration of pollutants within theirarea of jurisdiction, and implement emissions limitations for stationary sources and othermitigation measures necessary to achieve or maintain healthy air quality.
3.7 AIR QUALITY
WATER CONSERVATION AND TRANSFER PROJECT—FINAL EIR/EIS, OCTROBER 20023.7-2 SFO\SEC_3.7.DOC\022950013
TABLE 3.7-1Summary of Air Quality Impacts1
Proposed Project:300 KAFY
All ConservationMeasures
Alternative 1:No Project
Alternative 2:130 KAFY
On-farm IrrigationSystem
ImprovementsOnly
Alternative 3:230 KAFY
All ConservationMeasures
Alternative 4:300 KAFY
Fallowing Only
LOWER COLORADO RIVER
AQ-1: Fugitivedust from exposedriverbank and de-wateredbackwaters: Lessthan significantimpact.
Continuation ofexisting conditions.
Same as AQ-1. Same as AQ-1. Same as AQ-1.
IID WATER SERVICE AREA AND AAC
AQ-2: Emissionsfrom constructionand operation ofon-farm anddelivery systemconservationmeasures fromwaterconservationprogram: Less thansignificant impact.
Continuation ofexisting conditions.
A2-AQ-1:Emissions fromconstruction andoperation of on-farm conservationmeasures fromwaterconservationprogram: Less thansignificant impact.
A3-AQ-1:Emissions fromconstruction andoperation of on-farm and deliverysystemconservationmeasures fromwaterconservationprogram: Less thansignificant impact.
No impact.
AQ-3: Windblowndust from fallowedland: Less thansignificant impactwith mitigation.
Continuation ofexisting conditions.
No impact. A3-AQ-2:Windblown dustfrom fallowedland: Less thansignificant impactwith mitigation.
A4-AQ-1:Windblown dustfrom fallowedland: Less thansignificant impactwith mitigation.
AQ-4: Emissionsfrom constructionand operation ofon-farm anddelivery systemconservationmeasures forcompliance withthe IOP: Less thansignificant impactwith mitigation.
Not applicable. Same as AQ-4. Same as AQ-4. Same as AQ-4.
HCP-IID-AQ-5:Emissions fromconstruction ofmanaged marshand native treehabitat: Less thansignificant impact.
Not applicable. Same asHCP-IID-AQ-5.
Same asHCPIID-AQ-5.
Same asHCP-IID-AQ-5.
3.7 AIR QUALITY
WATER CONSERVATION AND TRANSFER PROJECT—FINAL EIR/EIS, OCTROBER 2002SFO\SEC_3.7.DOC\022950013 3.7-3
TABLE 3.7-1Summary of Air Quality Impacts1
Proposed Project:300 KAFY
All ConservationMeasures
Alternative 1:No Project
Alternative 2:130 KAFY
On-farm IrrigationSystem
ImprovementsOnly
Alternative 3:230 KAFY
All ConservationMeasures
Alternative 4:300 KAFY
Fallowing Only
HCP-SS-AQ-6:Windblown dustfrom fallowing ofapproximately30,500 acres forimplementation ofthe Salton SeaHabitatConservationStrategy: Less thansignificant withmitigation.
Not applicable. A2-HCP-SS-AQ-2-AQ-6: Windblowndust fromfallowing ofapproximately40,600 acres forimplementation ofthe Salton SeaHabitatConservationStrategy: Less thansignificant withmitigation.
A3-HCP-SS-AQ-3:Windblown dustfrom fallowing ofapproximately25,100 to 67,300acres forimplementation ofthe Salton SeaHabitatConservationStrategy: Less thansignificant withmitigation.
A4-HCP-SS-AQ-2:Windblown dustfrom fallowing ofapproximately30,500 acres forimplementation ofthe Salton SeaHabitatConservationStrategy: Less thansignificant withmitigation.
SALTON SEA
AQ-7: Indirect airquality impactsdue to thepotential forwindblown dustfrom exposedshoreline:Potentiallysignificantunavoidable impactwith mitigation.
Continuation ofBaseline conditions.
A2-AQ-3: Indirectair quality impactsdue to thepotential forwindblown dustfrom exposedshoreline:Potentiallysignificantunavoidable impactwith mitigation.
A3-AQ-4: Indirectair quality impactsdue to thepotential forwindblown dustfrom exposedshoreline:Potentiallysignificantunavoidable impactwith mitigation.
A4-AQ-3: Indirectair quality impactsdue to thepotential forwindblown dustfrom exposedshoreline:Potentiallysignificantunavoidable impactwith mitigation.
AQ-8: Potential fordecreased waterflow and quality toincrease odorousimpacts inproximity to theSea: Less thansignificant impact.
Continuation ofBaseline conditions.
A2-AQ-4: Potentialfor decreasedwater flow andquality to increaseodorous impactsin proximity to theSea: Less thansignificant impact.
A3-AQ-5: Potentialfor decreasedwater flow andquality to increaseodorous impactsin proximity to theSea: Less thansignificant impact.
A4-AQ-4: Potentialfor decreasedwater flow andquality to increaseodorous impactsin proximity to theSea: Less thansignificant impact.
SDCWA SERVICE AREA
No impact. Continuation ofexisting conditions.
No impact. No impact. No impact.
3.7.2.1 Federal Regulations and StandardsNATIONAL AMBIENT AIR QUALITY STANDARDSNational air quality policies are regulated through the federal Clean Air Act (CAA) of 1970and its 1977 and 1990 amendments. Pursuant to the CAA, the U.S. Environmental ProtectionAgency (EPA) has established National Ambient Air Quality Standards (NAAQS) for six air
3.7 AIR QUALITY
WATER CONSERVATION AND TRANSFER PROJECT—FINAL EIR/EIS, OCTROBER 20023.7-4 SFO\SEC_3.7.DOC\022950013
pollutants: CO, O3, NO2, SO2, PM10, and lead. These pollutants are referred to as criteriapollutants because numerical health-based criteria have been established for each pollutant,which define acceptable levels of exposure. EPA has revised the NAAQS several times sincetheir original implementation and will continue to do so as the health effects of exposure topollution are better understood. NAAQS, and the California ambient air quality standards(CAAQS) (see Section 3.7.2.2), are summarized in Table 3.7-2.
The standards in Table 3.7-2 reflect recent changes to the ozone and PM10 standards, and thenew PM2.5 standard. The federal 1-hour ozone standard will remain in effect until EPAformally implements the 8-hour ozone standard.
AIR QUALITY DESIGNATIONSUnder the 1977 amendments to the CAA, states with air quality that did not achieve theNAAQS were required to develop and maintain state implementation plans (SIPs). Theseplans constitute a federally enforceable definition of the state’s approach (or “plan”) andschedule for the attainment of the NAAQS. Air quality management areas are designated asattainment, nonattainment, or unclassified for individual pollutants depending on whetheror not they achieve the applicable NAAQS and CAAQS for each pollutant. In addition,California can also designate areas as transitional. It is important to note that because theNAAQS and CAAQS differ in many cases, it is possible for an area to be designated asattainment by EPA (meets the NAAQS) and nonattainment by the California Air ResourcesBoard (CARB) (does not meet the CAAQS) for the same pollutant. Also, an area can bedesignated as attainment for one pollutant (e.g., NO2) and nonattainment for others (e.g.,ozone and PM10).
Areas that were designated as attainment in the past, but have since achieved the NAAQS,are further classified as attainment-maintenance. The maintenance classification remains ineffect for 20 years from the date that the area is determined by EPA to meet the NAAQS.There are numerous classifications of the nonattainment designation, depending on theseverity of nonattainment. For example, the ozone nonattainment designation has sevensubclasses: transitional, marginal, moderate, serious, severe-15, severe-17, and extreme.Areas that lack monitoring data are designated as unclassified areas. Unclassified areas aretreated as attainment areas for regulatory purposes. Air quality designations for eachcounty comprising the geographic subregions are provided in Table 3.7-3.
FEDERAL GENERAL CONFORMITY REQUIREMENTSThe CAA (1977 amendments) (42 USC 7401 et seq.) state that the federal government isprohibited from engaging in, supporting, providing financial assistance for, licensing,permitting, or approving any activity that does not conform to an applicable SIP. Federalactions related to transportation plans, programs, and projects developed, funded, orapproved under 23 USC or the Federal Transit Act (49 USC 1601 et seq) are covered underseparate regulations for transportation conformity.
In the 1990 CAA amendments, EPA included provisions requiring federal agencies toensure that actions undertaken in nonattainment or attainment-maintenance areas areconsistent with applicable SIPs. The process of determining whether or not a federal actionis consistent with applicable SIPs is called conformity.

3.7 AIR QUALITY
WATER CONSERVATION AND TRANSFER PROJECT—FINAL EIR/EIS, OCTROBER 2002SFO\SEC_3.7.DOC\022950013 3.7-5
TABLE 3.7-2National and California Ambient Air Quality Standards
NAAQS2
Pollutant Averaging Time CAAQS1 Primary3 Secondary3
Ozone (O3) 4 1-hour 0.09 ppm(180 µg/m3)
0.12 ppm(235 µg/m3)
0.12 ppm(235 µg/m3)
8-hour (new) - 0.08 ppm(157 µg/m3)
0.08 ppm(157 µg/m3)
Coarse 24-hour 50 µg/m3 150 µg/m3 150 µg/m3
particulate matter Annual AM - 50 µg/m3 50 µg/m3
(PM10) Annual GM 30 µg/m3 - -
Fine particulate 24-hour (new) - 65 µg/m3 65 µg/m3
Matter (PM 2.5)4 Annual AM (new) - 15 µg/m3 15 µg/m3
Carbon monoxide (CO) 1-hour 20 ppm(23 mg/m3)
35 ppm(40 mg/m3)
-
8-hour 9 ppm(10 mg/m3)
9 ppm(10 mg/m3)
-
Nitrogen dioxide (NO2) 1-hour 0.25 ppm(470 µg/m3)
- -
Annual AM - 0.053 ppm(100 mg/m3)
0.053 ppm(100 mg/m3)
Lead (Pb) 30-day 1.5 µg/m3 - -
Calendar Quarter - 1.5 µg/m3 1.5 µg/m3
Sulfur dioxide (SO2) 1-hour 0.25 ppm(655 µg/m3)
- -
3-hour - - 0.5 ppm(1,300 µg/m3)
24-hour 0.04 ppm(105 µg/m3)
0.14 ppm(365 µg/m3)
-
Annual AM - 0.03 ppm(80 µg/m3)
-
Visibility Reducing Particles 8-hour(10 am to 6 pm)
Extinction Coeff. =0.23/km @ < 70% RH
- -
Sulfates 24-hour 25 µg/m3 - -
Hydrogen Sulfide (H2S) 1-hour 0.03 ppm(42 µg/m3)
- -
Source: CARB Fact Sheet 39 (11/91), SCAQMD Bulletin (8/97), and www.arb.ca.gov
Notes:1 California standards for O3, CO, SO2 (1-hour and 24-hour), NO2, PM10, and visibility reducing particles are values not to be
exceeded.2 National standards (other than O3, PM10, and those based on annual periods) are not to be exceeded more than once per
year. The new ozone standard is based on a 3-year average of the fourth highest 8-hour concentrations in each year. ForPM, the 24-hour standard is based on 99 percent (PM10) or 98 percent (PM2.5) of the daily concentrations, averaged over3 years.
3 Equivalent units given in parenthesis are based upon reference conditions of 25°C and 760 mm mercury.4 EPA promulgated new federal 8-hour O3 and PM2.5 standards on July 18, 1997. The federal 1-hour O3 standard continues to
apply in areas that remain in violation of that standard.
3.7 AIR QUALITY
WATER CONSERVATION AND TRANSFER PROJECT—FINAL EIR/EIS, OCTROBER 20023.7-6 SFO\SEC_3.7.DOC\022950013
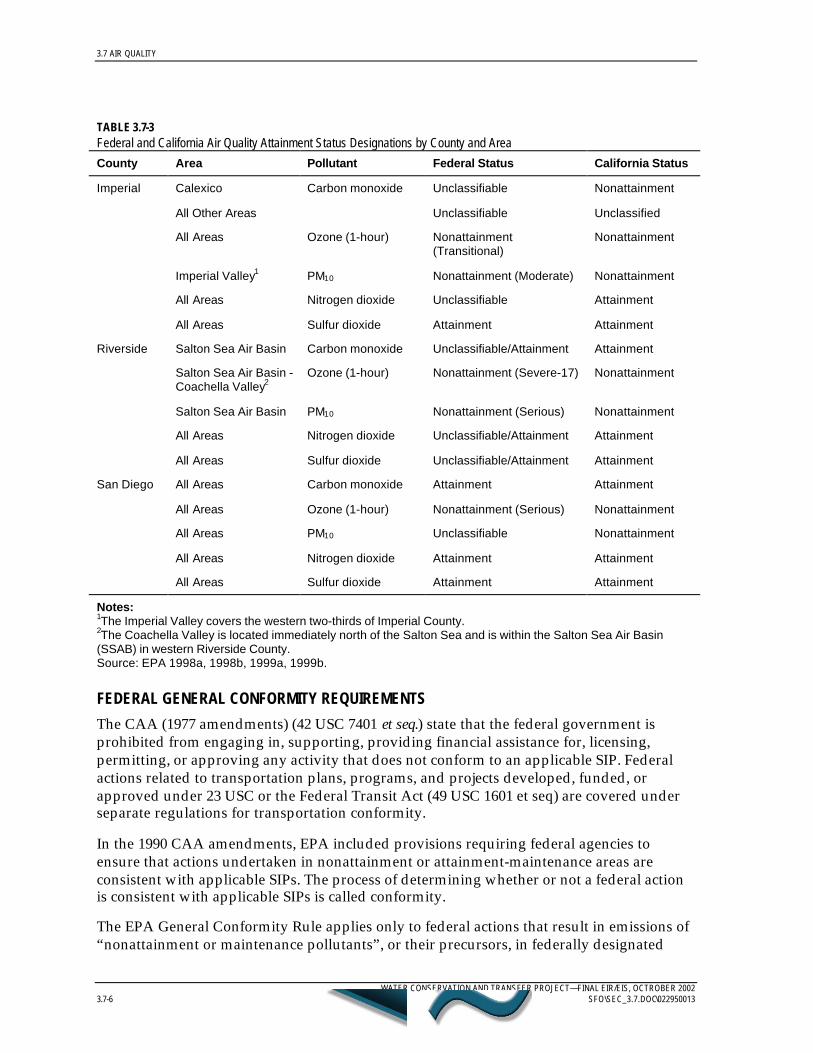
TABLE 3.7-3Federal and California Air Quality Attainment Status Designations by County and Area
County Area Pollutant Federal Status California Status
Imperial Calexico Carbon monoxide Unclassifiable Nonattainment
All Other Areas Unclassifiable Unclassified
All Areas Ozone (1-hour) Nonattainment(Transitional)
Nonattainment
Imperial Valley1 PM10 Nonattainment (Moderate) Nonattainment
All Areas Nitrogen dioxide Unclassifiable Attainment
All Areas Sulfur dioxide Attainment Attainment
Riverside Salton Sea Air Basin Carbon monoxide Unclassifiable/Attainment Attainment
Salton Sea Air Basin -Coachella Valley2
Ozone (1-hour) Nonattainment (Severe-17) Nonattainment
Salton Sea Air Basin PM10 Nonattainment (Serious) Nonattainment
All Areas Nitrogen dioxide Unclassifiable/Attainment Attainment
All Areas Sulfur dioxide Unclassifiable/Attainment Attainment
San Diego All Areas Carbon monoxide Attainment Attainment
All Areas Ozone (1-hour) Nonattainment (Serious) Nonattainment
All Areas PM10 Unclassifiable Nonattainment
All Areas Nitrogen dioxide Attainment Attainment
All Areas Sulfur dioxide Attainment Attainment
Notes:1The Imperial Valley covers the western two-thirds of Imperial County.2The Coachella Valley is located immediately north of the Salton Sea and is within the Salton Sea Air Basin(SSAB) in western Riverside County.Source: EPA 1998a, 1998b, 1999a, 1999b.
FEDERAL GENERAL CONFORMITY REQUIREMENTS
The CAA (1977 amendments) (42 USC 7401 et seq.) state that the federal government isprohibited from engaging in, supporting, providing financial assistance for, licensing,permitting, or approving any activity that does not conform to an applicable SIP. Federalactions related to transportation plans, programs, and projects developed, funded, orapproved under 23 USC or the Federal Transit Act (49 USC 1601 et seq) are covered underseparate regulations for transportation conformity.
In the 1990 CAA amendments, EPA included provisions requiring federal agencies toensure that actions undertaken in nonattainment or attainment-maintenance areas areconsistent with applicable SIPs. The process of determining whether or not a federal actionis consistent with applicable SIPs is called conformity.
The EPA General Conformity Rule applies only to federal actions that result in emissions of“nonattainment or maintenance pollutants”, or their precursors, in federally designated
3.7 AIR QUALITY
WATER CONSERVATION AND TRANSFER PROJECT—FINAL EIR/EIS, OCTROBER 2002SFO\SEC_3.7.DOC\022950013 3.7-7
nonattainment or maintenance areas. The EPA General Conformity Rule establishes aprocess to demonstrate that federal actions would be consistent with applicable SIPs andwould not cause or contribute to new violations of the NAAQS, increase the frequency orseverity of existing violations of the NAAQS, or delay the timely attainment of the NAAQS.The emission thresholds that trigger requirements of the conformity rule for federal actionsemitting nonattainment or maintenance pollutants, or their precursors, are called de minimislevels. The general conformity de minimis thresholds are defined in 40 CFR 93.153(b).
The federal General Conformity Rule does not apply to federal actions in areas designatedas nonattainment of only the CAAQS.
PREVENTION OF SIGNIFICANT DETERIORATION/NEW SOURCE PERFORMANCE STANDARDSThe CAA and amendments also include regulations intended to “prevent significantdeterioration” (PSD) of air quality and to establish emissions performance standards fornew stationary sources or New Source Performance Standards (NSPSs). Federal PSD andNSPS regulations generally apply to major (very large) stationary sources of emissions, andwould not apply to the Proposed Project or Alternatives.
3.7.2.2 State Regulations and StandardsCALIFORNIA AMBIENT AIR QUALITY STANDARDSCARB administers the air quality policy in California. CAAQS were established in 1969pursuant to the Mulford-Carrell Act. These standards, included with the NAAQS inTable 3.7-2, are generally more stringent and apply to more pollutants than the NAAQS. Inaddition to the criteria pollutants, CAAQS have been established for visibility-reducingparticulates, hydrogen sulfide, and sulfates. The California Clean Air Act (CCAA), whichwas approved in 1988, requires each local air district in the state to prepare and maintain anAir Quality Management Plan (AQMP) to achieve compliance with CAAQS. These AQMPsalso serve as the basis for preparation of the SIP for the State of California.
CARB establishes policy and statewide standards and administers the state’s mobile sourceemissions control program. In addition, CARB oversees air quality programs established bystate statute, such as Assembly Bill (AB) 2588, the Air Toxics “Hot Spots” Information andAssessment Act of 1987.
3.7.2.3 Local Regulations and StandardsAIR QUALITY PROGRAMS
In California, regional air pollution control districts have been established to oversee theattainment of air quality standards within air basins, as defined by the state. The districtshave permitting authority over all stationary sources of air pollutants within their districtboundaries, and act as the primary reviewer of environmental documents associated withair quality issues.
Each district has developed its own program and regulations to attain and maintain airquality standards, while integrating federal and state requirements. In addition, the SouthCoast Air Quality Management District (SCAQMD) has developed specific guidelines andcriteria for compliance with CEQA.
3.7 AIR QUALITY
WATER CONSERVATION AND TRANSFER PROJECT—FINAL EIR/EIS, OCTROBER 20023.7-8 SFO\SEC_3.7.DOC\022950013
The following is a list of the air districts associated with each geographic subregion:
• Lower Colorado River. The LCR falls under the jurisdiction of the Mojave Desert AirQuality Management District (MDAQMD) and the Imperial County Air PollutionControl District (ICAPCD). Both agencies have developed rules for implementingfederal and state air quality objectives within their jurisdictions.
• IID Water Service Area and AAC. This area is under the jurisdiction of the ICAPCD.
• Salton Sea. Both the ICAPCD and the SCAQMD have jurisdiction over portions of theSalton Sea geographic subregion.
• SDCWA Service Area. The San Diego Air Pollution Control District (SDAPCD) regulatesthis area.
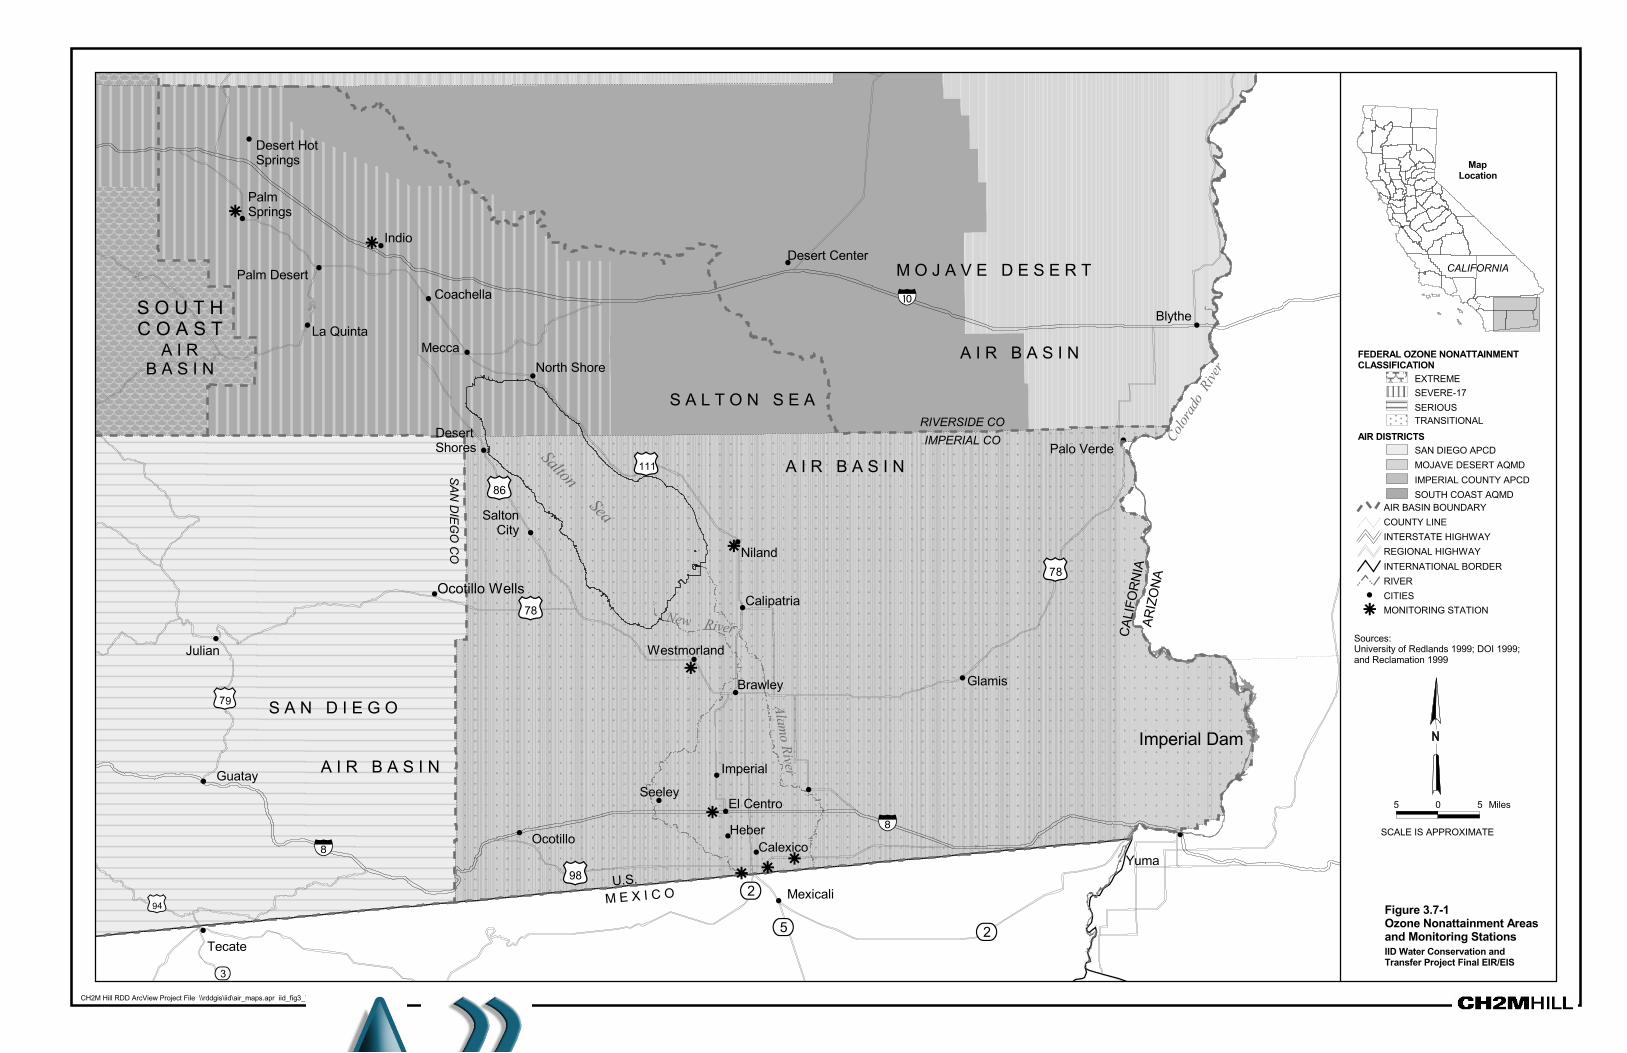
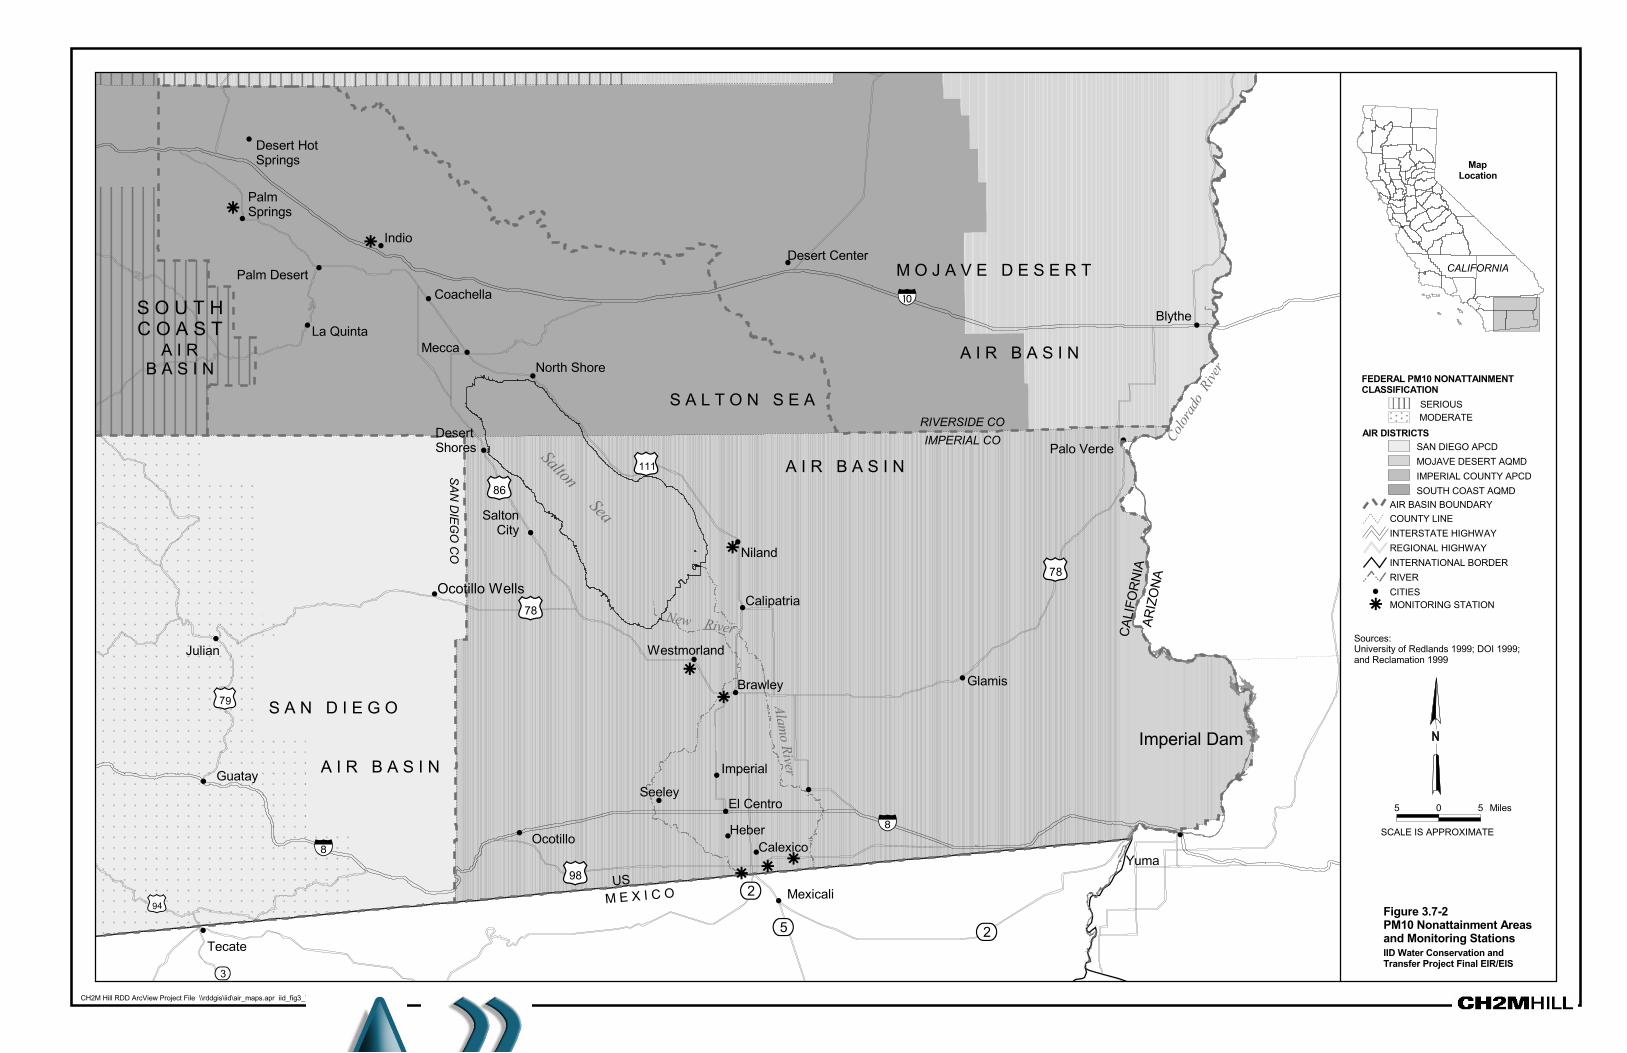
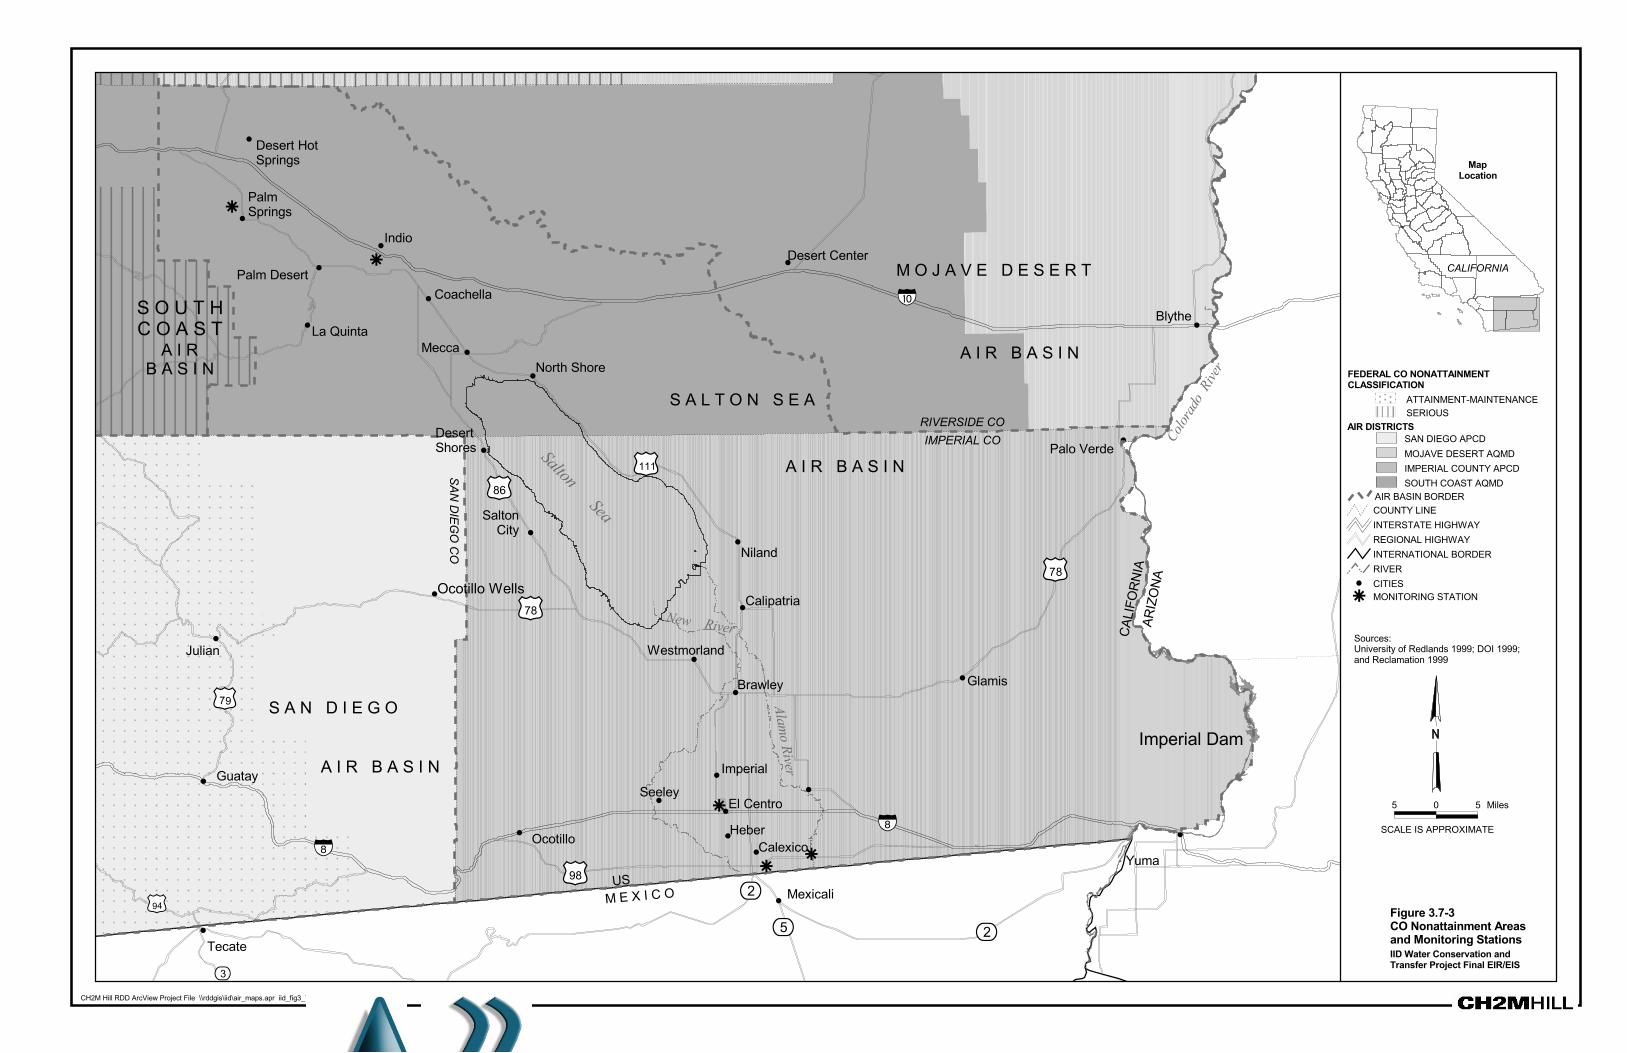
3.7.3 Existing SettingATTAINMENT STATUS DESIGNATIONSCalifornia and federal attainment status designations are listed in Table 3.7-3 for thecounties making up the four geographic subregions. Attainment status designations are notlisted in Table 3.7-3 for the new federal 8-hour ozone and PM2.5 standards because sufficientambient monitoring data are not yet available, pending formal EPA implementation of thesestandards. Federal O3, PM10, and CO attainment classifications are illustrated inFigures 3.7-1, 3.7-2, and 3.7-3, respectively. Each figure shows nonattainment areas forNAAQS and the classification of each nonattainment area.
3.7.3.1 Lower Colorado RiverThe LCR geographic subregion encompasses the LCR and its 100-year floodplain fromParker to Imperial Dams, including the full pool elevation of Lake Havasu. This area fallsunder the jurisdiction of the MDAQMD and the ICAPCD. Both agencies have developedrules for implementing federal and state air quality objectives within their jurisdictions.Only minimal impacts to air quality from the Proposed Project or Alternatives would occurin the LCR geographic subregion (see Section 3.7.4 and Reclamation 2002). Therefore,information on existing air quality and meteorological conditions in this subregion is notprovided.
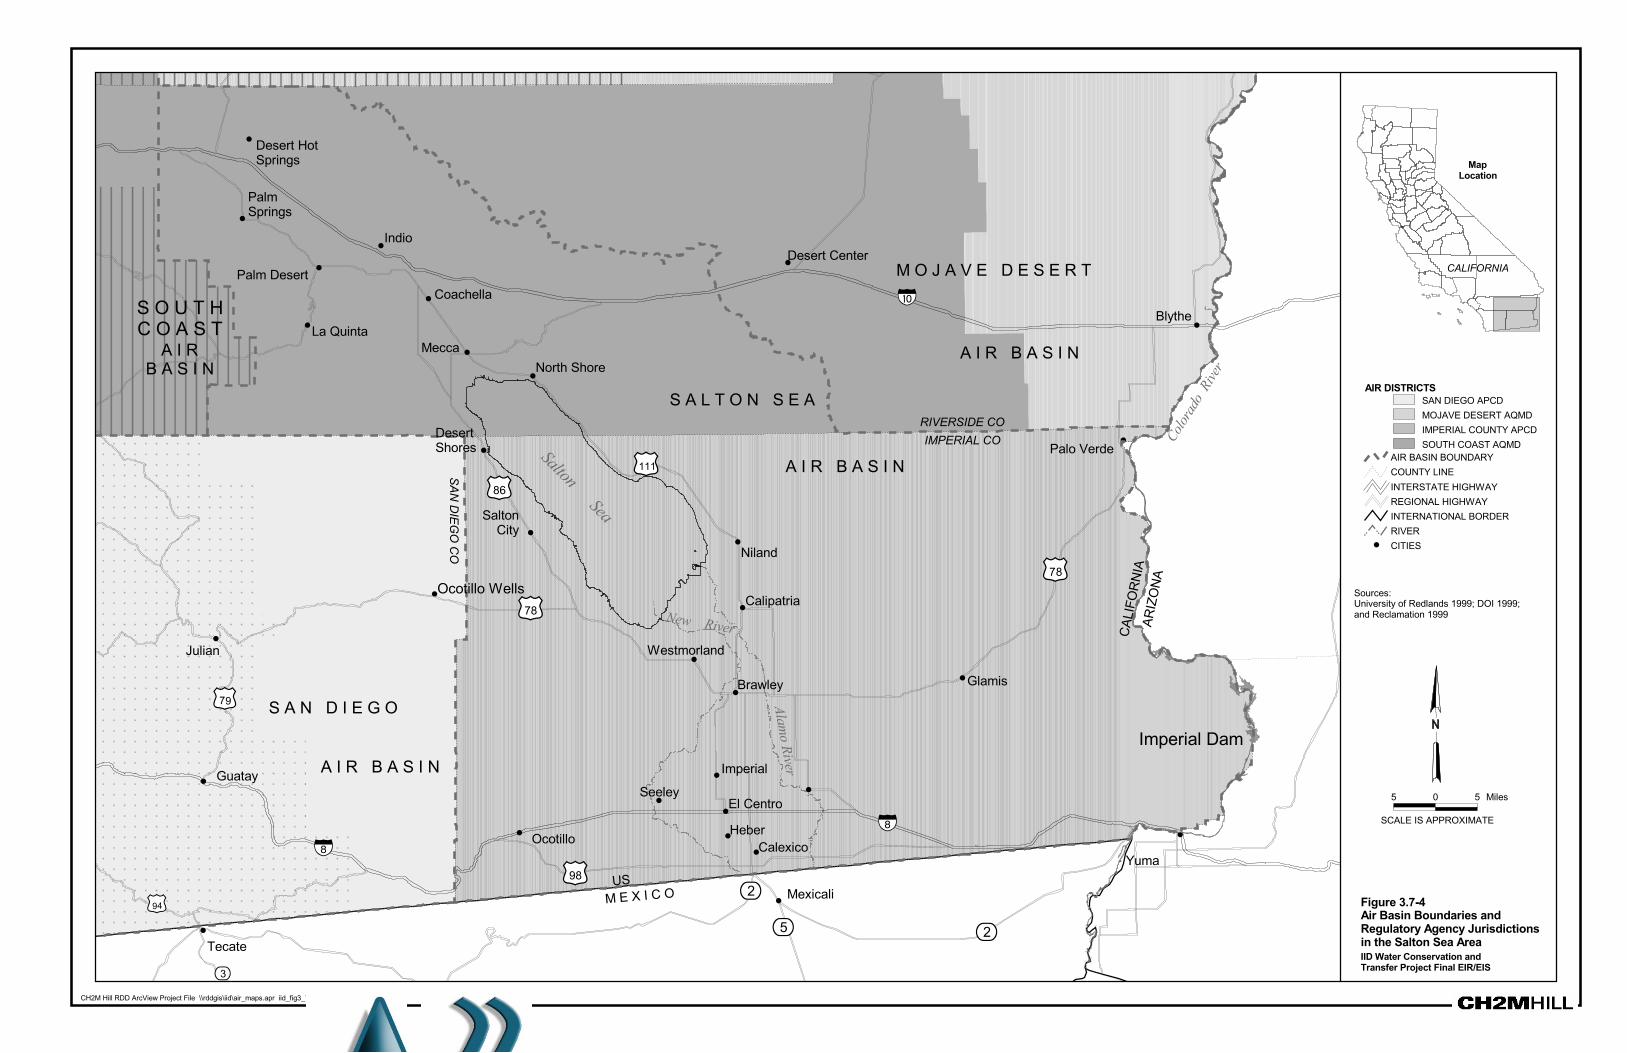
3.7.3.2 IID Water Service Area and AACThe following three geographic subregions are located within the SSAB and the San DiegoAir Basin (SDAB): IID water service area and AAC, Salton Sea , and SDCWA service area.The three geographic subregions are also under the jurisdiction of the following threeregional regulatory agencies: ICAPCD, SCAQMD, and SDAPCD. Each district develops itsown program to attain and maintain air quality standards while integrating federal andstate requirements. Figure 3.7-4 shows the location of each geographic subregion withrespect to air basin and political boundaries.
For the purpose of assessing existing conditions of air quality, the IID water service area andAAC geographic subregion are defined as the portion of the SSAB within Imperial County.This geographic subregion is under the jurisdiction of ICAPCD.
#
#
#
#
#
#
#
#
#
#
#
#
#
#
#
#
#
#
#
#
#
#
#
#
#
#
rrr
r
r
r
r
r
(/94
ARIZ
ONA
A
Imperial Dam
ôó3
IMPERIAL CORIVERSIDE CO
Alamo River
Salton Sea
M E X I C OU.S.
#
#!_
SAN DIEGO CO
Ocotillo
#
#
#
Julian
Guatay
(/78
!̀
ôó2ôó5 ôó2
El CentroHeber
New RiverWestmorland
Seeley
(/111
(/78
(/86
Glamis
Ocotillo Wells
Mecca
SaltonCity
DesertShores
North Shore
Color
ado R
iver
Desert Center
Palo Verde
Blythe
Yuma
Desert HotSprings
(/98
Coachella
Imperial
!_
PalmSprings
Palm Desert
La Quinta
Indio
(/79
CALIF
ORNI
A
Mexicali
Tecate
Niland
Calipatria
Brawley
Calexico
S A N D I E G O
A I R B A S I N
S A L T O N S E A
A I R B A S I N
A I R B A S I N
M O J A V E D E S E R T
S O U T HC O A S T
A I RB A S I N
CH2M Hill RDD ArcView Project File \\rddgis\iid\air_maps.apr iid_fig3_7-1.pdf 2:40 p.m. 10-7-2002
Sources:University of Redlands 1999; DOI 1999; and Reclamation 1999
TRANSITIONALSERIOUSSEVERE-17EXTREME
FEDERAL OZONE NONATTAINMENTCLASSIFICATION
SAN DIEGO APCD
IMPERIAL COUNTY APCDSOUTH COAST AQMD
INTERSTATE HIGHWAYREGIONAL HIGHWAY
COUNTY LINE
CITIES#
INTERNATIONAL BORDERRIVER
AIR BASIN BOUNDARY
AIR DISTRICTS
MOJAVE DESERT AQMD
r MONITORING STATION
SCALE IS APPROXIMATE
IID Water Conservation andTransfer Project Final EIR/EIS
Figure 3.7-1Ozone Nonattainment Areasand Monitoring Stations
5 0 5 Miles
MapLocation
CALIFORNIA
#
#
#
#
#
#
#
#
#
#
#
#
#
#
#
#
#
#
#
#
#
#
#
#
#
#
rrr
r
r
r
r
r
(/94
ARIZ
ONA
A
Imperial Dam
ôó3
IMPERIAL CORIVERSIDE CO
Alamo River
Salton Sea
M E X I C OUS
#
#!_
SAN DIEGO CO
Ocotillo
#
#
#
Julian
Guatay
(/78
!̀
ôó2ôó5 ôó2
El CentroHeber
New RiverWestmorland
Seeley
(/111
(/78
(/86
Glamis
Ocotillo Wells
Mecca
SaltonCity
DesertShores
North Shore
Color
ado R
iver
Desert Center
Palo Verde
Blythe
Yuma
Desert HotSprings
(/98
Coachella
Imperial
!_
PalmSprings
Palm Desert
La Quinta
Indio
(/79
CALIF
ORNI
A
Mexicali
Tecate
Niland
Calipatria
Brawley
Calexico
S A N D I E G O
A I R B A S I N
S A L T O N S E A
A I R B A S I N
A I R B A S I N
M O J A V E D E S E R T
S O U T HC O A S T
A I RB A S I N
CH2M Hill RDD ArcView Project File \\rddgis\iid\air_maps.apr iid_fig3_7-2.pdf 2:52 p.m. 10-7-2002
Sources:University of Redlands 1999; DOI 1999; and Reclamation 1999
SCALE IS APPROXIMATE
IID Water Conservation andTransfer Project Final EIR/EIS
Figure 3.7-2PM10 Nonattainment Areasand Monitoring Stations
5 0 5 Miles
INTERSTATE HIGHWAYREGIONAL HIGHWAY
COUNTY LINE
CITIES#
INTERNATIONAL BORDERRIVER
AIR BASIN BOUNDARY
SAN DIEGO APCD
IMPERIAL COUNTY APCDSOUTH COAST AQMD
MOJAVE DESERT AQMD
AIR DISTRICTS
SERIOUSMODERATE
FEDERAL PM10 NONATTAINMENTCLASSIFICATION
MONITORING STATIONr
MapLocation
CALIFORNIA
CH2M Hill RDD ArcView Project File \\rddgis\iid\air_maps.apr iid_fig3_7-3.pdf 2:55 p.m. 10-7-2002
Sources:University of Redlands 1999; DOI 1999; and Reclamation 1999
SCALE IS APPROXIMATE
IID Water Conservation andTransfer Project Final EIR/EIS
Figure 3.7-3CO Nonattainment Areasand Monitoring Stations
5 0 5 Miles
INTERSTATE HIGHWAYREGIONAL HIGHWAY
COUNTY LINE
CITIES#
INTERNATIONAL BORDERRIVER
AIR BASIN BORDER
SAN DIEGO APCD
IMPERIAL COUNTY APCDSOUTH COAST AQMD
AIR DISTRICTS
MOJAVE DESERT AQMD
ATTAINMENT-MAINTENANCE
FEDERAL CO NONATTAINMENTCLASSIFICATION
SERIOUS
MONITORING STATIONr
#
#
#
#
#
#
#
#
#
#
#
#
#
#
#
#
#
#
#
#
#
#
#
#
#
#
rr
r
r
r
(/94
ARIZ
ONA
A
Imperial Dam
ôó3
IMPERIAL CORIVERSIDE CO
Alamo River
Salton Sea
M E X I C OUS
#
#!_
SAN DIEGO CO
Ocotillo
#
#
#
Julian
Guatay
(/78
!̀
ôó2ôó5 ôó2
El CentroHeber
New RiverWestmorland
Seeley
(/111
(/78
(/86
Glamis
Ocotillo Wells
Mecca
SaltonCity
DesertShores
North Shore
Color
ado R
iver
Desert Center
Palo Verde
Blythe
Yuma
Desert HotSprings
(/98
Coachella
Imperial
!_
PalmSprings
Palm Desert
La Quinta
Indio
(/79
CALIF
ORNI
A
Mexicali
Tecate
Niland
Calipatria
Brawley
Calexico
S A N D I E G O
A I R B A S I N
S A L T O N S E A
A I R B A S I N
A I R B A S I N
M O J A V E D E S E R T
S O U T HC O A S T
A I RB A S I N
MapLocation
CALIFORNIA
SAN DIEGO APCD
IMPERIAL COUNTY APCDSOUTH COAST AQMD
INTERSTATE HIGHWAYREGIONAL HIGHWAY
COUNTY LINE
CITIES#
INTERNATIONAL BORDERRIVER
AIR BASIN BOUNDARY
AIR DISTRICTS
MOJAVE DESERT AQMD
#
#
#
#
#
#
#
#
#
#
#
#
#
#
#
#
#
#
#
#
#
#
#
#
#
#
(/94
ARIZ
ONA
A
Imperial Dam
ôó3
IMPERIAL CORIVERSIDE CO
Alamo River
Salton Sea
M E X I C OUS
#
#!_
SAN DIEGO CO
Ocotillo
#
#
#
Julian
Guatay
(/78
!̀
ôó2ôó5 ôó2
El CentroHeber
New RiverWestmorland
Seeley
(/111
(/78
(/86
Glamis
Ocotillo Wells
Mecca
SaltonCity
DesertShores
North Shore
Color
ado R
iver
Desert Center
Palo Verde
Blythe
Yuma
Desert HotSprings
(/98
Coachella
Imperial
!_
PalmSprings
Palm Desert
La Quinta
Indio
(/79
CALIF
ORNI
A
Mexicali
Tecate
Niland
Calipatria
Brawley
Calexico
S A N D I E G O
A I R B A S I N
S A L T O N S E A
A I R B A S I N
A I R B A S I N
M O J A V E D E S E R T
S O U T HC O A S T
A I RB A S I N
CALIFORNIA
MapLocation
CH2M Hill RDD ArcView Project File \\rddgis\iid\air_maps.apr iid_fig3_7-4.pdf 2:56 p.m. 10-7-2002
Sources:University of Redlands 1999; DOI 1999; and Reclamation 1999
SCALE IS APPROXIMATE
IID Water Conservation andTransfer Project Final EIR/EIS
Figure 3.7-4Air Basin Boundaries and Regulatory Agency Jurisdictionsin the Salton Sea Area
5 0 5 Miles
3.7 AIR QUALITY
WATER CONSERVATION AND TRANSFER PROJECT—FINAL EIR/EIS, OCTROBER 2002SFO\SEC_3.7.DOC\022950013 3.7-17
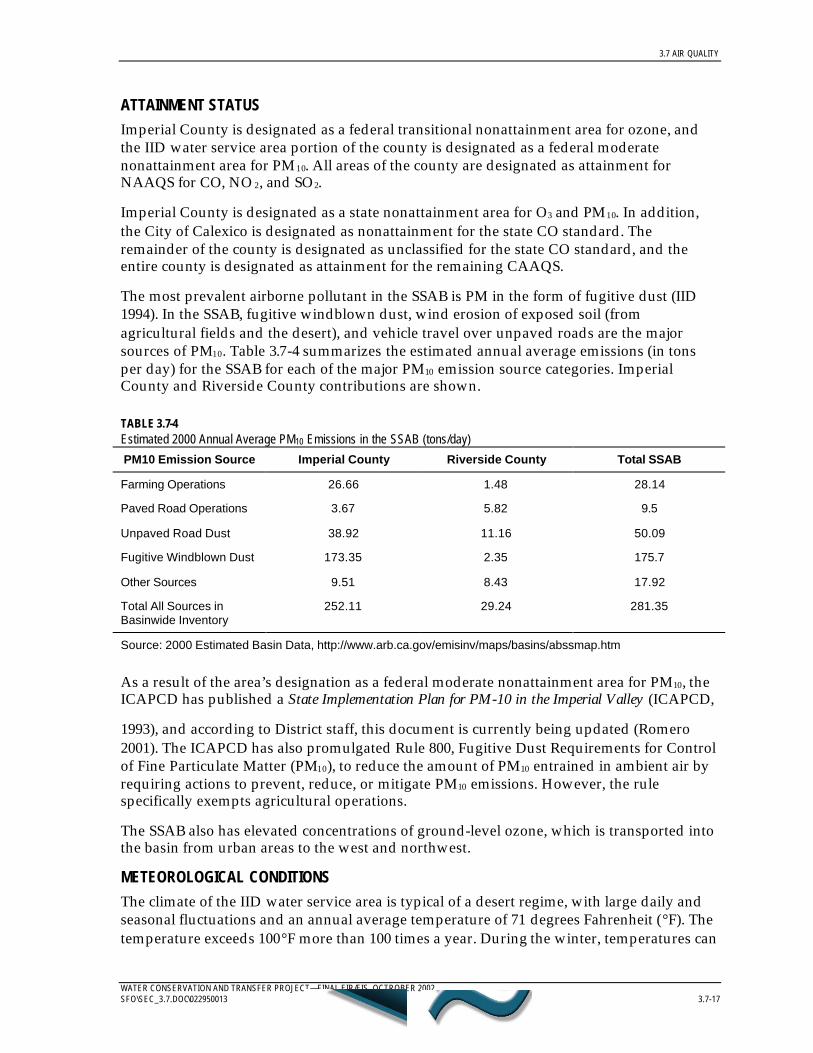
ATTAINMENT STATUSImperial County is designated as a federal transitional nonattainment area for ozone, andthe IID water service area portion of the county is designated as a federal moderatenonattainment area for PM10. All areas of the county are designated as attainment forNAAQS for CO, NO 2, and SO2.
Imperial County is designated as a state nonattainment area for O3 and PM10. In addition,the City of Calexico is designated as nonattainment for the state CO standard. Theremainder of the county is designated as unclassified for the state CO standard, and theentire county is designated as attainment for the remaining CAAQS.
The most prevalent airborne pollutant in the SSAB is PM in the form of fugitive dust (IID1994). In the SSAB, fugitive windblown dust, wind erosion of exposed soil (fromagricultural fields and the desert), and vehicle travel over unpaved roads are the majorsources of PM10. Table 3.7-4 summarizes the estimated annual average emissions (in tonsper day) for the SSAB for each of the major PM10 emission source categories. ImperialCounty and Riverside County contributions are shown.
TABLE 3.7-4Estimated 2000 Annual Average PM10 Emissions in the SSAB (tons/day)
PM10 Emission Source Imperial County Riverside County Total SSAB
Farming Operations 26.66 1.48 28.14
Paved Road Operations 3.67 5.82 9.5
Unpaved Road Dust 38.92 11.16 50.09
Fugitive Windblown Dust 173.35 2.35 175.7
Other Sources 9.51 8.43 17.92
Total All Sources inBasinwide Inventory
252.11 29.24 281.35
Source: 2000 Estimated Basin Data, http://www.arb.ca.gov/emisinv/maps/basins/abssmap.htm
As a result of the area’s designation as a federal moderate nonattainment area for PM10, theICAPCD has published a State Implementation Plan for PM-10 in the Imperial Valley (ICAPCD,
1993), and according to District staff, this document is currently being updated (Romero2001). The ICAPCD has also promulgated Rule 800, Fugitive Dust Requirements for Controlof Fine Particulate Matter (PM10), to reduce the amount of PM10 entrained in ambient air byrequiring actions to prevent, reduce, or mitigate PM10 emissions. However, the rulespecifically exempts agricultural operations.
The SSAB also has elevated concentrations of ground-level ozone, which is transported intothe basin from urban areas to the west and northwest.
METEOROLOGICAL CONDITIONSThe climate of the IID water service area is typical of a desert regime, with large daily andseasonal fluctuations and an annual average temperature of 71 degrees Fahrenheit (°F). Thetemperature exceeds 100°F more than 100 times a year. During the winter, temperatures can

3.7 AIR QUALITY
WATER CONSERVATION AND TRANSFER PROJECT—FINAL EIR/EIS, OCTROBER 20023.7-18 SFO\SEC_3.7.DOC\022950013
drop below freezing. Throughout the year, average daily relative humidity is low, rangingfrom 28 percent to 52 percent. The average rainfall is less than 3 inches a year.
Wind speed and directional frequency data were obtained from the Imperial County AirPollution Control District for the years 2000 and 2001 at Niland, California. Niland is locatedeast of the Salton Sea in Imperial County and is considered representative of the winds thatcould generate dust on the exposed shoreline of the Salton Sea . The anemometer height atthe Niland station is 10 meters. Windrose diagram of conditions at Niland are provided inFigure 3.7-5a and 3.7-5b for 2000 and 2001, respectively. Measurements were obtained for74 percent of all hours in 2000 and 89 percent of all hours in 2001. Southeast winds were themost frequent at this station, with high wind events usually from the west. The windrosesfor Niland show that the average hourly wind speed exceeded 8.5 m/s (19 mph) about 4percent of the time in 2000 and 3 percent of the time in 2001. The wind speed exceeded 11.0m/s (25 mph) about 1 percent of the time in 2000 and 1 percent of the time in 2001.Although the precise wind speed needed to generate windblown dust at the Salton Sea isnot known, research from Owens Lake suggests that wind speeds exceeding 17 mph may besufficient to generate dust.
3.7.3.3 Salton SeaThe Salton Sea geographic subregion, which is also within the SSAB, is located in bothImperial and Riverside Counties. For the purposes of this section of the EIR/EIS, the SaltonSea geographic subregion is defined as the SSAB.
The portion of the Salton Sea geographic subregion within Imperial County is under thejurisdiction of ICAPCD. The remaining portion of this geographic subregion in westernRiverside County is under the jurisdiction of SCAQMD.
ATTAINMENT STATUS
The western Riverside County portion of the SSAB is designated as a federal severe-17nonattainment area for O3 and a federal serious nonattainment area for PM10. All other areasof Riverside County are in attainment of NAAQS. The entire county is designated as a statenonattainment area for both O3 and PM10. All areas of the county are designated as being inattainment for the remaining CAAQS.
METEOROLOGICAL CONDITIONSDiscussion of meteorological conditions for the SSAB, provided below, was obtained fromthe Imperial County General Plan (County of Imperial 1997). The climate of the Salton Seageographic subregion is characterized as a desert regime with a wide range in temperaturefluctuations, low humidity, and thermally driven wind patterns.
Temperature patterns are similar throughout the SSAB. The climatic condition of the area isgoverned by large-scale warming and sinking of air in the semi-permanent subtropicalhigh-pressure center over the Pacific Ocean. The high-pressure ridge blocks most mid-latitude storms, except in the winter when the high-pressure ridge is weakest and farthestsouth. The coastal mountains prevent the intrusion of the cool, damp air found in theCalifornia coastal regions (IID 1994).
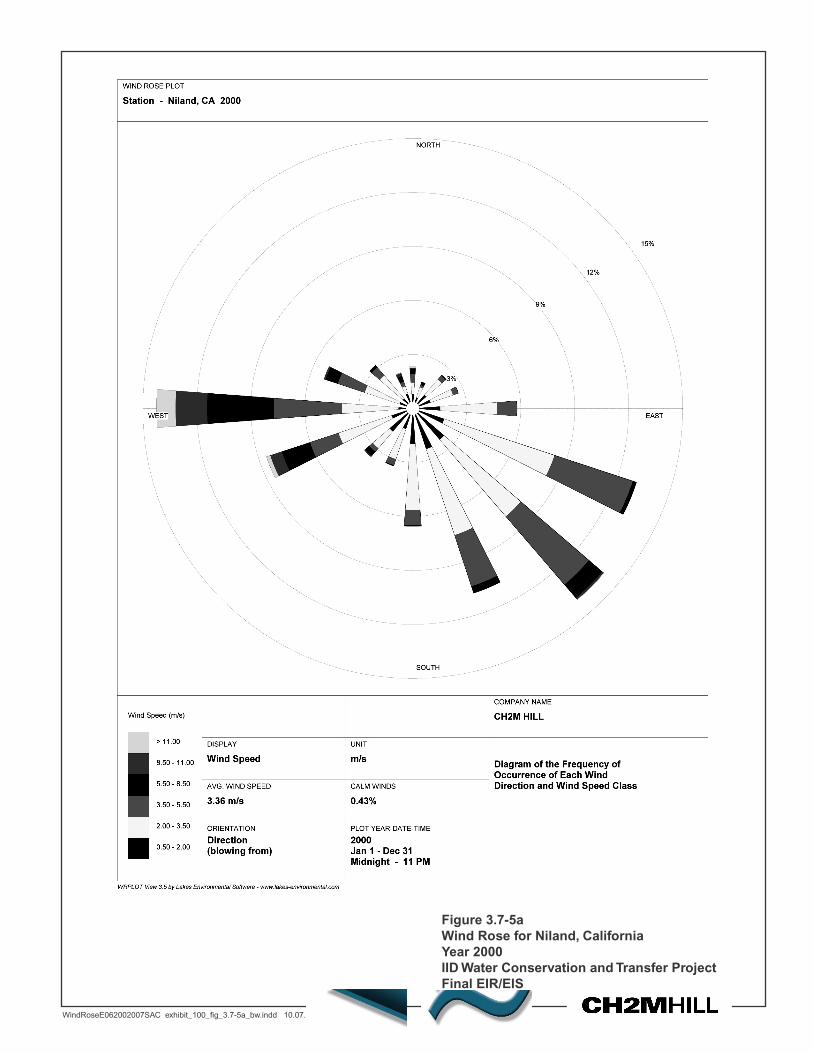
Figure 3.7-5aWind Rose for Niland, CaliforniaYear 2000IID Water Conservation and Transfer ProjectFinal EIR/EIS
WindRoseE062002007SAC exhibit_100_fig_3.7-5a_bw.indd 10.07.02 dfacile
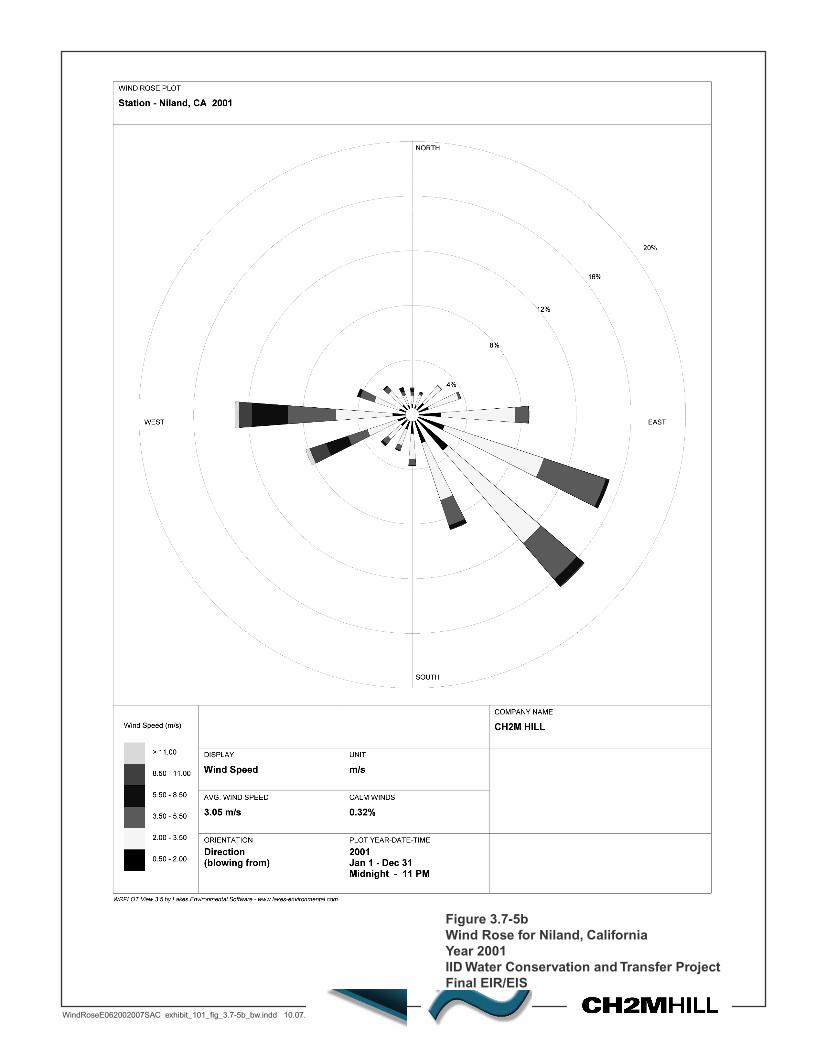
Figure 3.7-5bWind Rose for Niland, CaliforniaYear 2001IID Water Conservation and Transfer ProjectFinal EIR/EIS
WindRoseE062002007SAC exhibit_101_fig_3.7-5b_bw.indd 10.07.02 dfacile

3.7 AIR QUALITY
WATER CONSERVATION AND TRANSFER PROJECT—FINAL EIR/EIS, OCTROBER 2002SFO\SEC_3.7.DOC\022950013 3.7-21
The flat terrain and strong temperature differentials created by intense heating and coolingpatterns produce moderate winds and deep thermal circulation systems. Thus, even thoughthe summers are hot, the general dispersion of local air pollution is greater than in thecoastal basins where polluted inversion layers may remain for long periods (IID 1994).
Daily temperature fluctuations and seasonal variations are generally extreme. Clear skiesand rapid heating and cooling of desert soils create high temperatures by day and quickcooling by night. Daily temperatures range from the mid-40s to low-70s°F during winter,and from the low-70s to mid-100s°F during summer. The average annual rainfall is about3 inches, and the average annual air temperature is about 72°F (IID 1994).
Wind patterns in the area generally align with the long axis of the Salton Sea . The prevailingwind direction during all seasons is from the northwest. During the spring and summer,winds from the east and southeast become a secondary component, while during the falland winter, the secondary component is from the west and southwest. Wind speeds aregenerally moderate throughout the geographic subregion.
3.7.3.4 Ambient Air Quality Monitoring DataNumerous air quality monitoring stations are located throughout the Project region ofinfluence. Monitoring stations are operated and maintained by local air districts (seeFigures 3.7-1 through 3.7-3).
Imperial County operates and maintains air quality monitoring stations in Brawley,Calexico (3), El Centro, Niland, Westmorland, and Winterhaven. Riverside County operatesand maintains air quality monitoring stations in the Coachella Valley in Indio and PalmSprings. San Diego County operates and maintains 10 monitoring stations throughout thewestern two-thirds of the county. Monitoring data from San Diego County are included toallow comparison of pollutant concentrations measured throughout the study region.
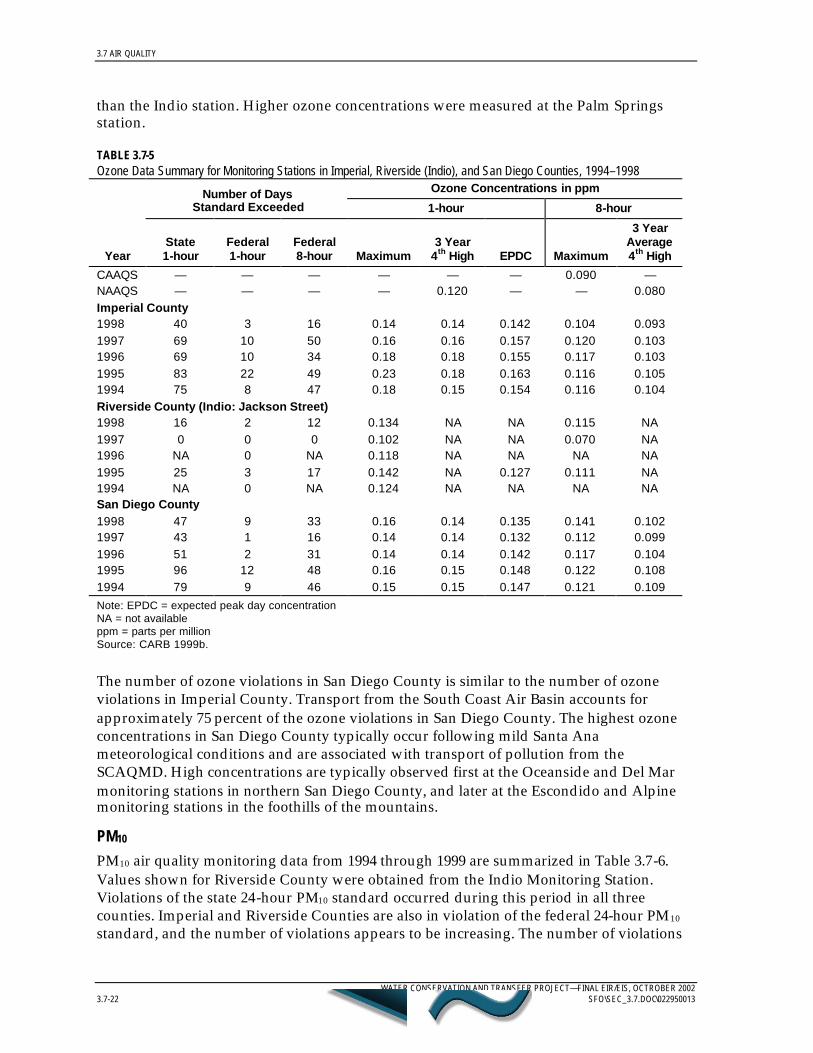
OZONEOzone air quality monitoring data from 1994 through 1998 are summarized in Table 3.7-5.Imperial County is a federal and state nonattainment area for ozone. The number ofviolations of the state and federal ozone standards has decreased since 1994. The increasedstringency of the new 8-hour federal ozone standard is shown by the increased number ofdays during which this standard would have been exceeded relative to the 1-hour ozonestandard. The state ozone standard, which is more stringent, was exceeded more frequentlythan the federal 8-hour standard. The fourth highest ozone concentration during the 3-yearperiod from 1996 and 1998 is listed as 0.14 ppm, which is slightly above the federal 1-hourozone standard of 0.12 ppm.
Values shown for Riverside County were obtained from an Indio (Jackson Street)monitoring station. Violations of the state and federal ozone standards were measured in1995 and 1998, but not in 1997. The state standard was violated most frequently at thisstation. Three-year ozone concentrations for comparison to the federal 8-hour standard werenot available from EPA’s AIRS database. The CARB database also lacked data for 1996 fromthis station. CARB data indicate that 8-hour ozone concentrations remain above the statestandard at this station. Data are also available for the Palm Springs Fire Station monitoringstation in Riverside County, but this station is farther from the Project region of influence
3.7 AIR QUALITY
WATER CONSERVATION AND TRANSFER PROJECT—FINAL EIR/EIS, OCTROBER 20023.7-22 SFO\SEC_3.7.DOC\022950013
than the Indio station. Higher ozone concentrations were measured at the Palm Springsstation.
TABLE 3.7-5Ozone Data Summary for Monitoring Stations in Imperial, Riverside (Indio), and San Diego Counties, 1994–1998
Ozone Concentrations in ppmNumber of DaysStandard Exceeded 1-hour 8-hour
YearState1-hour
Federal1-hour
Federal8-hour Maximum
3 Year4th High EPDC Maximum
3 YearAverage4th High
CAAQS — — — — — — 0.090 —NAAQS — — — — 0.120 — — 0.080Imperial County1998 40 3 16 0.14 0.14 0.142 0.104 0.0931997 69 10 50 0.16 0.16 0.157 0.120 0.1031996 69 10 34 0.18 0.18 0.155 0.117 0.1031995 83 22 49 0.23 0.18 0.163 0.116 0.1051994 75 8 47 0.18 0.15 0.154 0.116 0.104Riverside County (Indio: Jackson Street)1998 16 2 12 0.134 NA NA 0.115 NA1997 0 0 0 0.102 NA NA 0.070 NA1996 NA 0 NA 0.118 NA NA NA NA1995 25 3 17 0.142 NA 0.127 0.111 NA1994 NA 0 NA 0.124 NA NA NA NASan Diego County1998 47 9 33 0.16 0.14 0.135 0.141 0.1021997 43 1 16 0.14 0.14 0.132 0.112 0.0991996 51 2 31 0.14 0.14 0.142 0.117 0.1041995 96 12 48 0.16 0.15 0.148 0.122 0.1081994 79 9 46 0.15 0.15 0.147 0.121 0.109Note: EPDC = expected peak day concentrationNA = not availableppm = parts per millionSource: CARB 1999b.
The number of ozone violations in San Diego County is similar to the number of ozoneviolations in Imperial County. Transport from the South Coast Air Basin accounts forapproximately 75 percent of the ozone violations in San Diego County. The highest ozoneconcentrations in San Diego County typically occur following mild Santa Anameteorological conditions and are associated with transport of pollution from theSCAQMD. High concentrations are typically observed first at the Oceanside and Del Marmonitoring stations in northern San Diego County, and later at the Escondido and Alpinemonitoring stations in the foothills of the mountains.
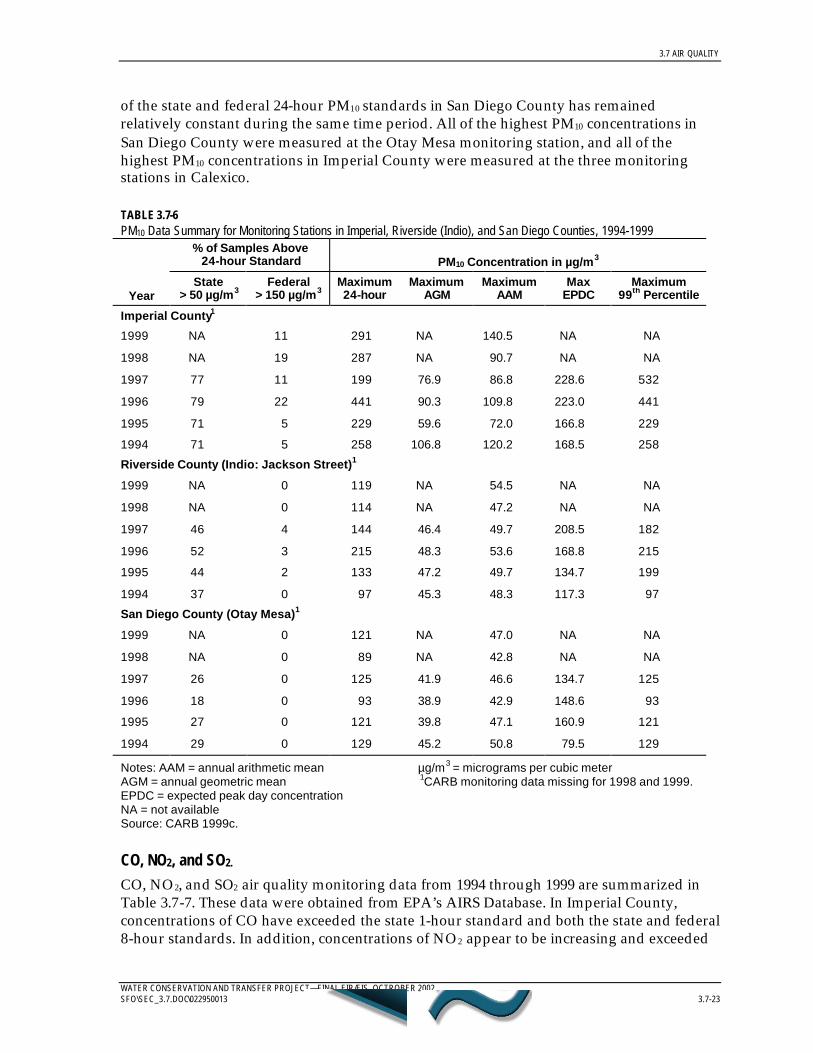
PM10
PM10 air quality monitoring data from 1994 through 1999 are summarized in Table 3.7-6.Values shown for Riverside County were obtained from the Indio Monitoring Station.Violations of the state 24-hour PM10 standard occurred during this period in all threecounties. Imperial and Riverside Counties are also in violation of the federal 24-hour PM10
standard, and the number of violations appears to be increasing. The number of violations
3.7 AIR QUALITY
WATER CONSERVATION AND TRANSFER PROJECT—FINAL EIR/EIS, OCTROBER 2002SFO\SEC_3.7.DOC\022950013 3.7-23
of the state and federal 24-hour PM10 standards in San Diego County has remainedrelatively constant during the same time period. All of the highest PM10 concentrations inSan Diego County were measured at the Otay Mesa monitoring station, and all of thehighest PM10 concentrations in Imperial County were measured at the three monitoringstations in Calexico.
TABLE 3.7-6PM10 Data Summary for Monitoring Stations in Imperial, Riverside (Indio), and San Diego Counties, 1994-1999
% of Samples Above24-hour Standard PM10 Concentration in µg/m3
YearState
> 50 µg/m3Federal
> 150 µg/m3Maximum24-hour
MaximumAGM
MaximumAAM
MaxEPDC
Maximum99th Percentile
Imperial County1
1999 NA 11 291 NA 140.5 NA NA
1998 NA 19 287 NA 90.7 NA NA
1997 77 11 199 76.9 86.8 228.6 532
1996 79 22 441 90.3 109.8 223.0 441
1995 71 5 229 59.6 72.0 166.8 229
1994 71 5 258 106.8 120.2 168.5 258
Riverside County (Indio: Jackson Street)1
1999 NA 0 119 NA 54.5 NA NA
1998 NA 0 114 NA 47.2 NA NA
1997 46 4 144 46.4 49.7 208.5 182
1996 52 3 215 48.3 53.6 168.8 215
1995 44 2 133 47.2 49.7 134.7 199
1994 37 0 97 45.3 48.3 117.3 97
San Diego County (Otay Mesa)1
1999 NA 0 121 NA 47.0 NA NA
1998 NA 0 89 NA 42.8 NA NA
1997 26 0 125 41.9 46.6 134.7 125
1996 18 0 93 38.9 42.9 148.6 93
1995 27 0 121 39.8 47.1 160.9 121
1994 29 0 129 45.2 50.8 79.5 129
Notes: AAM = annual arithmetic meanAGM = annual geometric meanEPDC = expected peak day concentrationNA = not availableSource: CARB 1999c.
µg/m3 = micrograms per cubic meter 1CARB monitoring data missing for 1998 and 1999.
CO, NO2, and SO2.
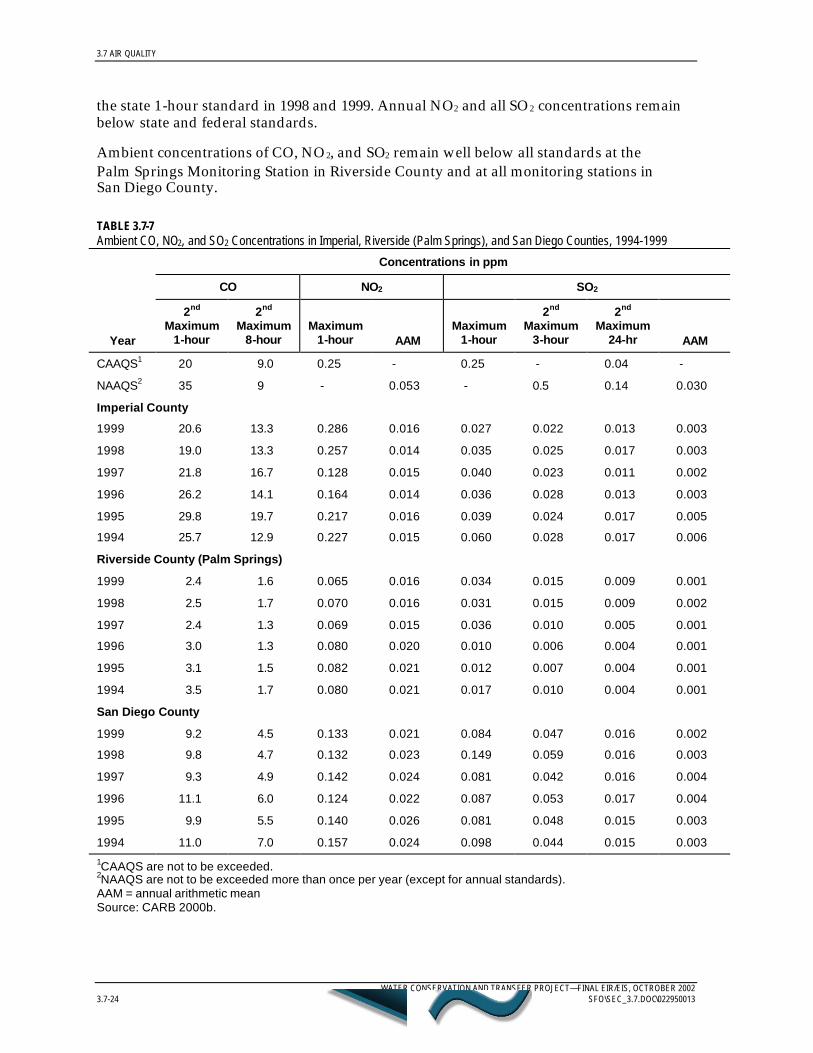
CO, NO2, and SO2 air quality monitoring data from 1994 through 1999 are summarized inTable 3.7-7. These data were obtained from EPA’s AIRS Database. In Imperial County,concentrations of CO have exceeded the state 1-hour standard and both the state and federal8-hour standards. In addition, concentrations of NO2 appear to be increasing and exceeded
3.7 AIR QUALITY
WATER CONSERVATION AND TRANSFER PROJECT—FINAL EIR/EIS, OCTROBER 20023.7-24 SFO\SEC_3.7.DOC\022950013
the state 1-hour standard in 1998 and 1999. Annual NO2 and all SO2 concentrations remainbelow state and federal standards.
Ambient concentrations of CO, NO2, and SO2 remain well below all standards at thePalm Springs Monitoring Station in Riverside County and at all monitoring stations inSan Diego County.
TABLE 3.7-7Ambient CO, NO2, and SO2 Concentrations in Imperial, Riverside (Palm Springs), and San Diego Counties, 1994-1999
Concentrations in ppm
CO NO2 SO2
Year
2nd
Maximum1-hour
2nd
Maximum8-hour
Maximum1-hour AAM
Maximum1-hour
2nd
Maximum3-hour
2nd
Maximum24-hr AAM
CAAQS1 20 9.0 0.25 - 0.25 - 0.04 -
NAAQS2 35 9 - 0.053 - 0.5 0.14 0.030
Imperial County
1999 20.6 13.3 0.286 0.016 0.027 0.022 0.013 0.003
1998 19.0 13.3 0.257 0.014 0.035 0.025 0.017 0.003
1997 21.8 16.7 0.128 0.015 0.040 0.023 0.011 0.002
1996 26.2 14.1 0.164 0.014 0.036 0.028 0.013 0.003
1995 29.8 19.7 0.217 0.016 0.039 0.024 0.017 0.005
1994 25.7 12.9 0.227 0.015 0.060 0.028 0.017 0.006
Riverside County (Palm Springs)
1999 2.4 1.6 0.065 0.016 0.034 0.015 0.009 0.001
1998 2.5 1.7 0.070 0.016 0.031 0.015 0.009 0.002
1997 2.4 1.3 0.069 0.015 0.036 0.010 0.005 0.001
1996 3.0 1.3 0.080 0.020 0.010 0.006 0.004 0.001
1995 3.1 1.5 0.082 0.021 0.012 0.007 0.004 0.001
1994 3.5 1.7 0.080 0.021 0.017 0.010 0.004 0.001
San Diego County
1999 9.2 4.5 0.133 0.021 0.084 0.047 0.016 0.002
1998 9.8 4.7 0.132 0.023 0.149 0.059 0.016 0.003
1997 9.3 4.9 0.142 0.024 0.081 0.042 0.016 0.004
1996 11.1 6.0 0.124 0.022 0.087 0.053 0.017 0.004
1995 9.9 5.5 0.140 0.026 0.081 0.048 0.015 0.003
1994 11.0 7.0 0.157 0.024 0.098 0.044 0.015 0.0031CAAQS are not to be exceeded.2NAAQS are not to be exceeded more than once per year (except for annual standards).AAM = annual arithmetic meanSource: CARB 2000b.

3.7 AIR QUALITY
WATER CONSERVATION AND TRANSFER PROJECT—FINAL EIR/EIS, OCTROBER 2002SFO\SEC_3.7.DOC\022950013 3.7-25
3.7.4 Impacts and Mitigation Measures
3.7.4.1 MethodologyMethods used to quantify potential air quality impacts attributable to implementing theProposed Project and Alternatives are described in this section.
Separate analysis of potential impacts from construction and operation is necessary becausethe nature and duration of emissions from these activities are different.
The methods used to quantify emissions and characterize the significance of impacts fromconstruction activities, subsequent on-going operations, and windblown dust are presentedbelow.
Construction MethodologyConstruction activities result in pollutant emissions from mobile construction equipmentand soil disturbance activities. Emission sources include engine exhaust from constructionequipment, dust generated from the movement of construction equipment, and dustgenerated from soil disturbance activities.
Air quality impacts from construction activities are difficult to quantify because they occuron a temporary basis, are mobile, and fluctuate in relative strength. To the extent possible,air quality impacts from construction activities have been quantified according to themethodology presented below. Construction emissions are compared to the appropriate airquality significance criteria.
Exhaust emissions occur from the operation of mobile construction equipment at each worksite, such as tractors, bulldozers, and backhoes. Emissions are proportional to the amount ofwork performed by each piece of equipment; therefore, emissions were calculated bymultiplying emission factors by the number of hours of operation, and average operatingload for each piece of equipment. For the system measures, emissions estimated forconstruction of the 15 potential lateral interceptor systems varied somewhat due to differentsizes for the various Proposed Project components. Because of this variation, estimatedemissions were averaged to simplify the analysis.
Based on the estimated annual incremental increase in conservation and transfer rate of20 KAFY, approximately 470 80-acre farms (average size) per year would be needed toconstruct and implement some form of conservation measure. Lists of the types ofequipment required and estimates of the length of time the equipment would need tooperate to construct the various on-farm and water delivery system conservation measureswere developed based on experience with construction of similar systems at other locations(Mattingly 2000). Emission factors from the SCAQMD CEQA Air Quality Handbook wereused to estimate exhaust emissions associated with operation of the construction equipment(SCAQMD 1993).
Soil disturbance activities, such as soil grading, excavation, and equipment and vehicletravel on unpaved roads, represent sources of windblown dust. Construction emissionestimates prepared for this air quality analysis did not include fugitive dust emissionsassociated with soil disturbance, because normal operations at farms involve so much soildisturbance that installation of the conservation measures is assumed to be within the range
3.7 AIR QUALITY
WATER CONSERVATION AND TRANSFER PROJECT—FINAL EIR/EIS, OCTROBER 20023.7-26 SFO\SEC_3.7.DOC\022950013
of typical activities. Nor did this air quality impact analysis include exhaust emissions foremployees commuting to the farms for construction of the on-farm measures. Again, normaloperations at farms involve employee and owner vehicle commute activities notsubstantively different than those proposed for construction of the on-farm measures. Forboth the on-farm and system conservation measures, this analysis assumed that anyconstruction-related increases in emissions of fugitive dust and exhaust from employeecommute vehicles would be temporary and localized.
Operation MethodologyOperational impacts include emissions from new stationary sources, operation of mobileequipment, and increased potential for suspension of dust from agricultural areas. Listswere developed of the types of equipment and labor required, and estimates of the length oftime the equipment or laborers would need to work to operate and maintain the various on-farm and water delivery, system conservation measures, based on experience with O&M ofsimilar systems at other locations (Mattingly 2000).
Operation of the on-farm and water-delivery system conservation measures would occurover the lifetime of the Proposed Project, up to 75 years, depending on when the measuresare constructed. The O&M activities expected for the on-farm conservation measures rangefrom an increase in labor over existing practices for narrow border strips and drip irrigationsystems, to some minor amount of equipment use periodically (e.g., use of a scraper every5 years for laser leveling and multi-slope systems), to use of a backhoe once a year forsediment cleanup for cascading tailwater systems, to use of a pump for 24 hours every2 weeks for tailwater return/pumpback systems. The O&M activities expected for the waterdelivery system conservation measures include additional labor for visual inspections,maintenance, and patrolling of systems, as well as a small amount of equipment useperiodically (e.g., use of a backhoe two to three times a year for channel cleanup for lateralinterceptor and conveyance lining systems, and use of a utility truck for monthly pump andmotor service for seepage interceptor systems). This air quality analysis assumes that theseO&M activities are within the range of normal activities in the area. This air quality analysisalso assumes that the O&M activities associated with on-farm irrigation managementmeasures are within the range of normal activities in the area.
Windblown Dust From Exposed Shoreline MethodologyHydrologic modeling of the Salton Sea was performed to determine the effect of reducedinflow volumes on salinity, surface area, and Sea level elevation (Reclamation 2001b). TheProposed Project consists of incremental increases in water conservation of about 25 KAFYper year until the total volume of water conserved for transfer reaches 300 KAFY. Anadditional 59 KAFY would be conserved for compliance with the IOP. This would reducethe volume of water entering the Sea, resulting in a decrease in the surface area and theexposure of areas formerly submerged. The Sea would decrease in elevation and surfacearea at a rate greater than that predicted for Baseline conditions.
Analysis of soils and sediments surrounding the Salton Sea indicates that acceleration of thepredicted decrease in Sea level would also increase the potential for dust suspension. Spatialvariations in sediment characteristics and soil erodibility, temporal variations in windconditions, and variation in factors contributing to the formation of salt crusts prevent anyreasonable quantitative estimate of emissions and associated impacts from the predicted
3.7 AIR QUALITY
WATER CONSERVATION AND TRANSFER PROJECT—FINAL EIR/EIS, OCTROBER 2002SFO\SEC_3.7.DOC\022950013 3.7-27
increase in exposed shoreline. However, a qualitative assessment of the potential for dustsuspension is possible.
Windblown Dust From Fallowed Lands MethodologyFallowing of agricultural lands is one of the conservation methods proposed under theProposed Project and fallowing may also be used to provide mitigation water to implementthe Salton Sea Habitat Conservation Strategy. Baseline conditions include approximately20,000 acres of fallowed lands. The potential maximum fallowed acres that might berequired for all project components for the Proposed Project or Alternatives and the SaltonSea Habitat Conservation Strategy might be as great as 90,300 acres, assuming use offallowing is maximized for conservation and the HCP and the IOP.
It is not possible to quantify emissions and associated impacts from potential increases infallowing of agricultural lands, at a variety of locations over time, for water conservation.On one hand, emissions would decrease because the fallowed land would not be subject toplowing or the other agricultural activities that disturb soil. On the other hand, fallowedlands that are not properly retired or mitigated may be subject to wind erosion, creatingfugitive dust impacts. A qualitative assessment is provided.
Subregions Excluded From Impact Analysis. No impacts to air quality resources would occurin the SDCWA service area geographic subregion because no construction of new facilitiesor changes in operation of existing facilities would occur in this subregion; therefore, thisarea is not discussed in the impact discussions.
3.7.4.2 Significance CriteriaThe Proposed Project or Alternatives would have a significant impact on air quality if totaldirect and indirect emissions from the Proposed Project or Alternatives would:
• Violate any air quality standard or contribute substantially to an existing or projected airquality violation.
• Conflict with or obstruct implementation of an applicable air quality plan.
• Expose sensitive receptors to substantial pollutant concentrations.
• Create objectionable odors affecting a substantial number of people.
• Result in a cumulatively considerable net increase of any criteria pollutant for which theProject region of influence is nonattainment under an applicable federal or state ambientair quality standard.
Significance Criteria During Construction and OperationImpacts would be considered significant if any total direct and/or indirect emissionsresulting from construction and implementation of the Proposed Project or Alternativesexceed the federal general conformity de minimis thresholds. These thresholds apply only topollutants designated as nonattainment or attainment-maintenance.
Compliance with the conformity rule is presumed if the de minimis thresholds are notexceeded. The conformity rule process is intended to demonstrate that the Proposed Project:
3.7 AIR QUALITY
WATER CONSERVATION AND TRANSFER PROJECT—FINAL EIR/EIS, OCTROBER 20023.7-28 SFO\SEC_3.7.DOC\022950013
• Will not cause or contribute to new violations of federal air quality standards.• Will not increase the frequency or severity of existing violations of federal air quality
standards.
• Will not delay the timely attainment of federal air quality standards.If the de minimis thresholds would be exceeded, compliance with the general conformity rulemust be demonstrated before the Proposed Project can continue. This is accomplished bymeans of a formal conformity determination process involving dispersion modeling,comparison to SIP requirements, and, possibly, emission offsetting or revisions to the SIP toaccommodate emissions.
Significance thresholds for toxic air contaminants are also defined by some air districts.Emissions of toxic air contaminants would be significant if the emissions exceed the cancerrisk, cancer burden, or health hazard indexes. MDAQMD and ICAPCD have not establishedsignificance criteria for toxic air contaminant emissions.
Colorado River Area –MDAQMD and ICAPCD Jurisdiction. Other than the general conformityde minimis thresholds, the MDAQMD and ICAPCD have not established significance criteriafor projects in the Colorado River area.
The MDAQMD is designated as a serious federal PM10 nonattainment area. The generalconformity de minimis threshold for serious PM10 nonattainment areas is 70 tons per year.Projects in the MDAQMD with emissions of PM10 in excess of 70 tons per year would beconsidered significant.
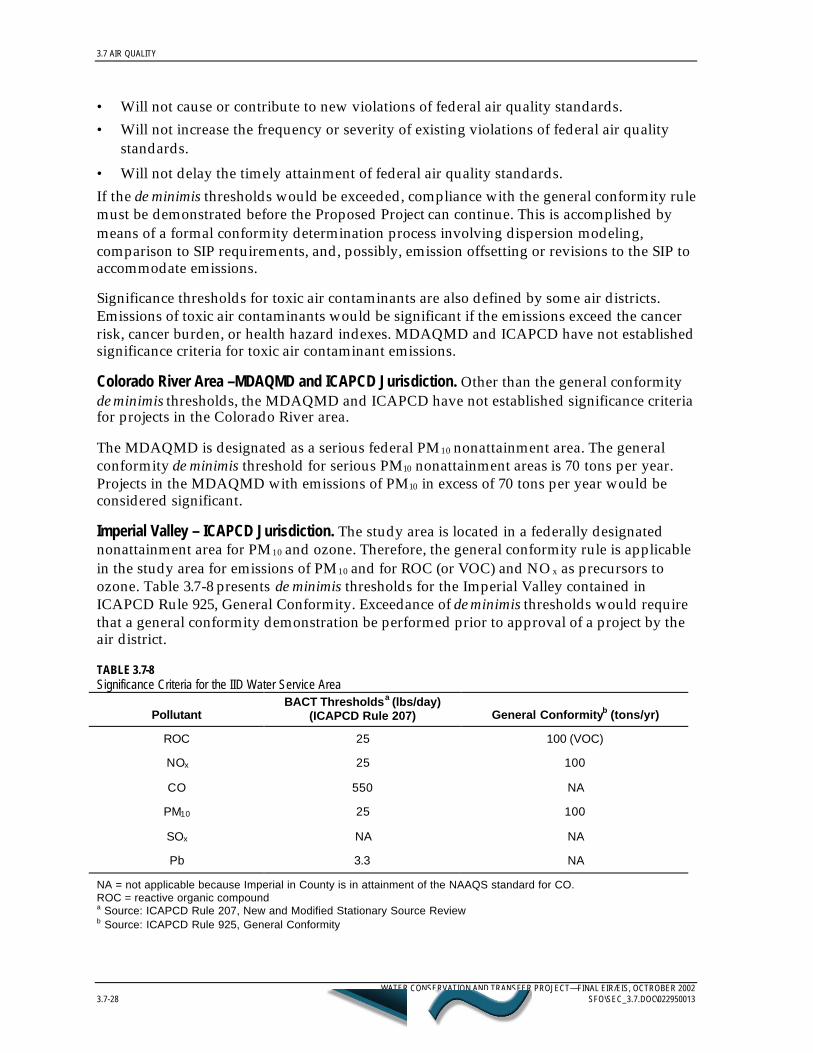
Imperial Valley – ICAPCD Jurisdiction. The study area is located in a federally designatednonattainment area for PM10 and ozone. Therefore, the general conformity rule is applicablein the study area for emissions of PM10 and for ROC (or VOC) and NO x as precursors toozone. Table 3.7-8 presents de minimis thresholds for the Imperial Valley contained inICAPCD Rule 925, General Conformity. Exceedance of de minimis thresholds would requirethat a general conformity demonstration be performed prior to approval of a project by theair district.
TABLE 3.7-8Significance Criteria for the IID Water Service Area
PollutantBACT Thresholdsa (lbs/day)
(ICAPCD Rule 207) General Conformityb (tons/yr)
ROC 25 100 (VOC)
NOx 25 100
CO 550 NA
PM10 25 100
SOx NA NA
Pb 3.3 NA
NA = not applicable because Imperial in County is in attainment of the NAAQS standard for CO.ROC = reactive organic compounda Source: ICAPCD Rule 207, New and Modified Stationary Source Reviewb Source: ICAPCD Rule 925, General Conformity
3.7 AIR QUALITY
WATER CONSERVATION AND TRANSFER PROJECT—FINAL EIR/EIS, OCTROBER 2002SFO\SEC_3.7.DOC\022950013 3.7-29
The ICAPCD follows the requirements set forth by its planning division, which tend tofollow the state’s CEQA guidelines. For Imperial County, air quality impacts from proposedprojects are evaluated on a case-by-case basis. There are two types of operationalsignificance criteria in the Imperial Valley: criteria related to New Source Review (NSR) andcriteria related to general conformity. The NSR criteria only apply to stationary sources.Both types are listed in Table 3.7-8.
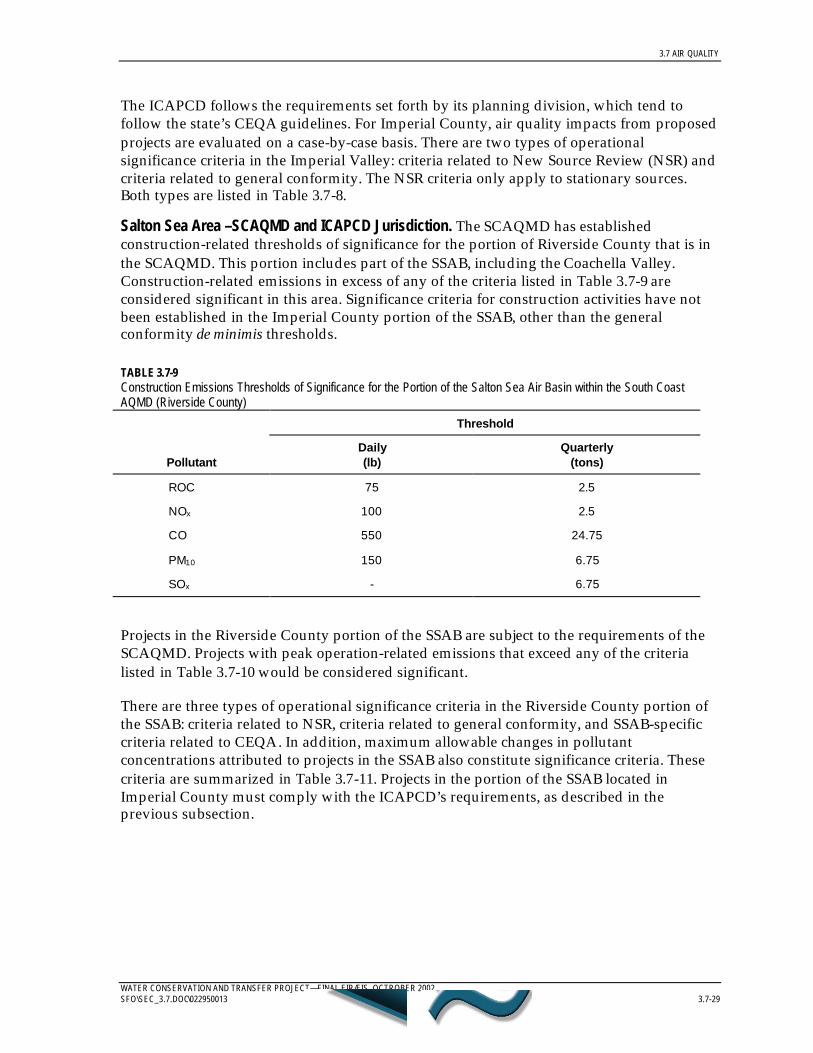
Salton Sea Area –SCAQMD and ICAPCD Jurisdiction. The SCAQMD has establishedconstruction-related thresholds of significance for the portion of Riverside County that is inthe SCAQMD. This portion includes part of the SSAB, including the Coachella Valley.Construction-related emissions in excess of any of the criteria listed in Table 3.7-9 areconsidered significant in this area. Significance criteria for construction activities have notbeen established in the Imperial County portion of the SSAB, other than the generalconformity de minimis thresholds.
TABLE 3.7-9Construction Emissions Thresholds of Significance for the Portion of the Salton Sea Air Basin within the South CoastAQMD (Riverside County)
Threshold
PollutantDaily(lb)
Quarterly(tons)
ROC 75 2.5
NOx 100 2.5
CO 550 24.75
PM10 150 6.75
SOx - 6.75
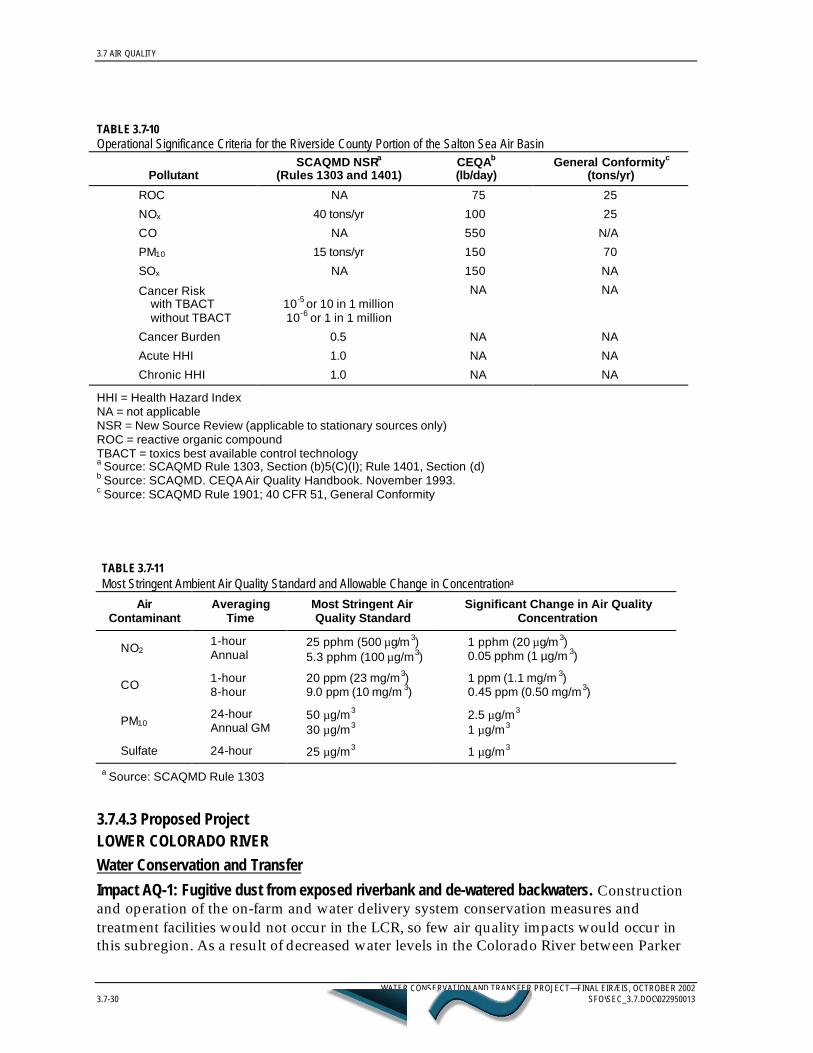
Projects in the Riverside County portion of the SSAB are subject to the requirements of theSCAQMD. Projects with peak operation-related emissions that exceed any of the criterialisted in Table 3.7-10 would be considered significant.
There are three types of operational significance criteria in the Riverside County portion ofthe SSAB: criteria related to NSR, criteria related to general conformity, and SSAB-specificcriteria related to CEQA. In addition, maximum allowable changes in pollutantconcentrations attributed to projects in the SSAB also constitute significance criteria. Thesecriteria are summarized in Table 3.7-11. Projects in the portion of the SSAB located inImperial County must comply with the ICAPCD’s requirements, as described in theprevious subsection.
3.7 AIR QUALITY
WATER CONSERVATION AND TRANSFER PROJECT—FINAL EIR/EIS, OCTROBER 20023.7-30 SFO\SEC_3.7.DOC\022950013
TABLE 3.7-10Operational Significance Criteria for the Riverside County Portion of the Salton Sea Air Basin
PollutantSCAQMD NSRa
(Rules 1303 and 1401)CEQAb
(lb/day)General Conformityc
(tons/yr)
ROC NA 75 25
NOx 40 tons/yr 100 25
CO NA 550 N/A
PM10 15 tons/yr 150 70
SOx NA 150 NA
Cancer Riskwith TBACTwithout TBACT
10-5 or 10 in 1 million10-6 or 1 in 1 million
NA NA
Cancer Burden 0.5 NA NA
Acute HHI 1.0 NA NA
Chronic HHI 1.0 NA NA
HHI = Health Hazard IndexNA = not applicableNSR = New Source Review (applicable to stationary sources only)ROC = reactive organic compoundTBACT = toxics best available control technologya Source: SCAQMD Rule 1303, Section (b)5(C)(I); Rule 1401, Section (d)b Source: SCAQMD. CEQA Air Quality Handbook. November 1993.c Source: SCAQMD Rule 1901; 40 CFR 51, General Conformity
TABLE 3.7-11Most Stringent Ambient Air Quality Standard and Allowable Change in Concentrationa
AirContaminant
AveragingTime
Most Stringent AirQuality Standard
Significant Change in Air QualityConcentration
NO21-hourAnnual
25 pphm (500 µg/m3)5.3 pphm (100 µg/m3)
1 pphm (20 µg/m3)0.05 pphm (1 µg/m 3)
CO 1-hour8-hour
20 ppm (23 mg/m3)9.0 ppm (10 mg/m 3)
1 ppm (1.1 mg/m 3)0.45 ppm (0.50 mg/m3)
PM1024-hourAnnual GM
50 µg/m3
30 µg/m32.5 µg/m3
1 µg/m3
Sulfate 24-hour 25 µg/m3 1 µg/m3
a Source: SCAQMD Rule 1303
3.7.4.3 Proposed ProjectLOWER COLORADO RIVERWater Conservation and Transfer
Impact AQ-1: Fugitive dust from exposed riverbank and de-watered backwaters. Constructionand operation of the on-farm and water delivery system conservation measures andtreatment facilities would not occur in the LCR, so few air quality impacts would occur inthis subregion. As a result of decreased water levels in the Colorado River between Parker
3.7 AIR QUALITY
WATER CONSERVATION AND TRANSFER PROJECT—FINAL EIR/EIS, OCTROBER 2002SFO\SEC_3.7.DOC\022950013 3.7-31
Dam and Imperial Dam, there is some potential for increased fugitive dust emissions fromexposed shoreline. However, the amount of land exposed by decreased water levels isrelatively small, and some of the area will become re-vegetated. Backwaters would bereplaced. The potential increase in windblown dust from exposed areas along the ColoradoRiver would be minimal. (Less than significant impact.)
Biological Conservation Measures in USFWS’ Biological Opinion
Air quality impacts from implementation of biological conservation measures would resultfrom combustion emissions due to the use of fossil fuel-fired construction equipment andfugitive dust emissions due to ground-disturbing activities. The proposed conservationmeasures that would produce the most emissions would include the restoration ofbackwaters and creation of willow flycatcher habitat. No specific locations or designs havebeen formulated for these measures. Some of the activities needed to implement thesemeasures could include dredging, grading, vegetation clearing, and channel deepening. It isexpected that the impact of combustion emissions from these activities would not be largeenough in a localized area to cause an exceedance of an ambient air quality standard, asmost emission sources would be mobile and intermittent in nature. Fugitive dust emissionscould be substantial from activities that disturb large amounts of soil. However,implementation of fugitive dust control measures outlined in the IA EIS would effectivelyminimize PM10 emissions from proposed construction activities (Reclamation 2002).
Impacts resulting from the implementation of the biological conservation measures in USFWS’Biological Opinion would be the same for Alternatives 2, 3, and 4; therefore, they are not discussedunder each Alternative.
IID WATER SERVICE AREA AND AACWater Conservation and Transfer
Impact AQ-2: Emissions from construction and operation of on-farm and delivery systemconservation measures from water conservation program. Because the IID water service areasubregion, and in particular, the IID water service area, is where most of the constructionactivities for on-farm and system conservation measures would occur, this subregion hasthe greatest potential for construction–related air quality impacts from the Proposed Project.
Potential annual equipment exhaust emissions from construction activities for on-farmconservation measures are summarized in Table 3.7-12. Each column in the table presentsemissions estimated for construction of the indicated conservation measure at five hundred80-acre farms, to conserve an estimated 20 KAFY of water. (The actual number of 80-acrefarms would be approximately 470, so 500 is being used for a conservative estimate ofemissions). This amount represents the maximum construction level anticipated in anygiven year over the life of the Proposed Project for construction of on-farm conservationmeasures for transfer. Emissions for the measures, therefore, should not be summed, butcan be compared from measure to measure to determine a range of annual emissions thathave the potential to occur with construction of on-farm conservation measures.
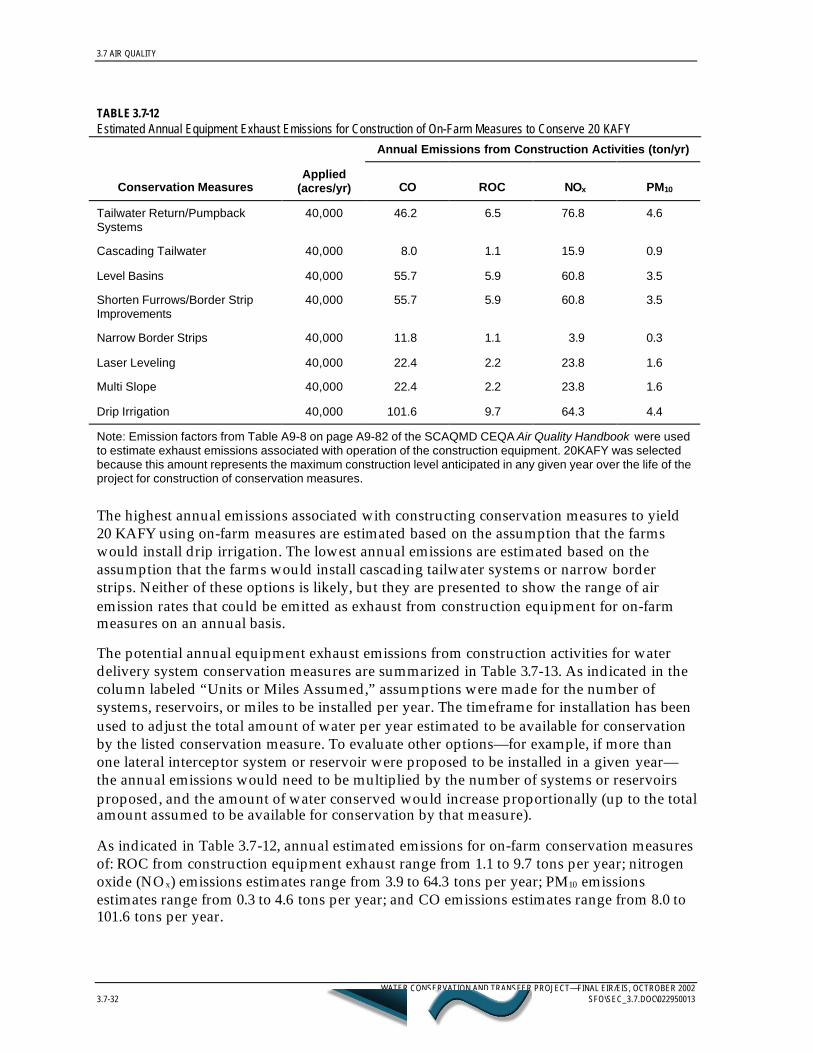
3.7 AIR QUALITY
WATER CONSERVATION AND TRANSFER PROJECT—FINAL EIR/EIS, OCTROBER 20023.7-32 SFO\SEC_3.7.DOC\022950013
TABLE 3.7-12Estimated Annual Equipment Exhaust Emissions for Construction of On-Farm Measures to Conserve 20 KAFY
Annual Emissions from Construction Activities (ton/yr)
Conservation MeasuresApplied
(acres/yr) CO ROC NOx PM10
Tailwater Return/PumpbackSystems
40,000 46.2 6.5 76.8 4.6
Cascading Tailwater 40,000 8.0 1.1 15.9 0.9
Level Basins 40,000 55.7 5.9 60.8 3.5
Shorten Furrows/Border StripImprovements
40,000 55.7 5.9 60.8 3.5
Narrow Border Strips 40,000 11.8 1.1 3.9 0.3
Laser Leveling 40,000 22.4 2.2 23.8 1.6
Multi Slope 40,000 22.4 2.2 23.8 1.6
Drip Irrigation 40,000 101.6 9.7 64.3 4.4
Note: Emission factors from Table A9-8 on page A9-82 of the SCAQMD CEQA Air Quality Handbook were usedto estimate exhaust emissions associated with operation of the construction equipment. 20KAFY was selectedbecause this amount represents the maximum construction level anticipated in any given year over the life of theproject for construction of conservation measures.
The highest annual emissions associated with constructing conservation measures to yield20 KAFY using on-farm measures are estimated based on the assumption that the farmswould install drip irrigation. The lowest annual emissions are estimated based on theassumption that the farms would install cascading tailwater systems or narrow borderstrips. Neither of these options is likely, but they are presented to show the range of airemission rates that could be emitted as exhaust from construction equipment for on-farmmeasures on an annual basis.
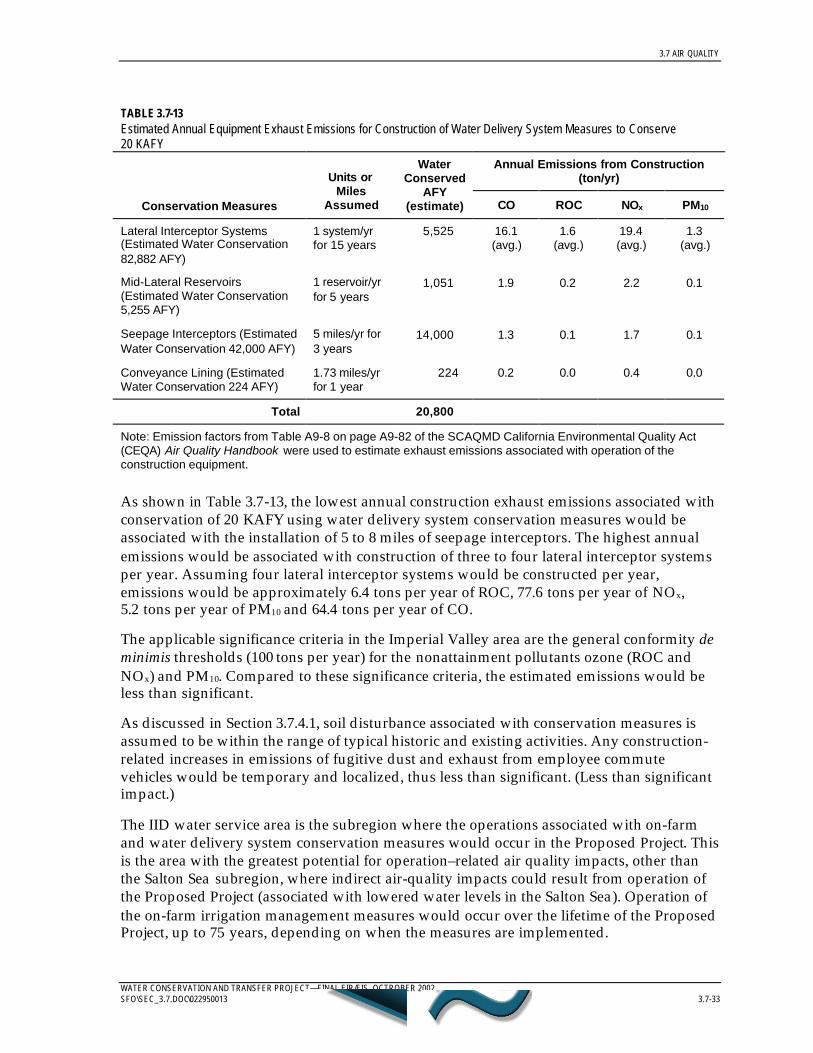
The potential annual equipment exhaust emissions from construction activities for waterdelivery system conservation measures are summarized in Table 3.7-13. As indicated in thecolumn labeled “Units or Miles Assumed,” assumptions were made for the number ofsystems, reservoirs, or miles to be installed per year. The timeframe for installation has beenused to adjust the total amount of water per year estimated to be available for conservationby the listed conservation measure. To evaluate other options—for example, if more thanone lateral interceptor system or reservoir were proposed to be installed in a given year—the annual emissions would need to be multiplied by the number of systems or reservoirsproposed, and the amount of water conserved would increase proportionally (up to the totalamount assumed to be available for conservation by that measure).
As indicated in Table 3.7-12, annual estimated emissions for on-farm conservation measuresof: ROC from construction equipment exhaust range from 1.1 to 9.7 tons per year; nitrogenoxide (NOx) emissions estimates range from 3.9 to 64.3 tons per year; PM10 emissionsestimates range from 0.3 to 4.6 tons per year; and CO emissions estimates range from 8.0 to101.6 tons per year.
3.7 AIR QUALITY
WATER CONSERVATION AND TRANSFER PROJECT—FINAL EIR/EIS, OCTROBER 2002SFO\SEC_3.7.DOC\022950013 3.7-33
TABLE 3.7-13Estimated Annual Equipment Exhaust Emissions for Construction of Water Delivery System Measures to Conserve20 KAFY
Annual Emissions from Construction(ton/yr)
Conservation Measures
Units orMiles
Assumed
WaterConserved
AFY(estimate) CO ROC NOx PM10
Lateral Interceptor Systems(Estimated Water Conservation82,882 AFY)
1 system/yrfor 15 years
5,525 16.1(avg.)
1.6(avg.)
19.4(avg.)
1.3(avg.)
Mid-Lateral Reservoirs(Estimated Water Conservation5,255 AFY)
1 reservoir/yrfor 5 years
1,051 1.9 0.2 2.2 0.1
Seepage Interceptors (EstimatedWater Conservation 42,000 AFY)
5 miles/yr for3 years
14,000 1.3 0.1 1.7 0.1
Conveyance Lining (EstimatedWater Conservation 224 AFY)
1.73 miles/yrfor 1 year
224 0.2 0.0 0.4 0.0
Total 20,800
Note: Emission factors from Table A9-8 on page A9-82 of the SCAQMD California Environmental Quality Act(CEQA) Air Quality Handbook were used to estimate exhaust emissions associated with operation of theconstruction equipment.
As shown in Table 3.7-13, the lowest annual construction exhaust emissions associated withconservation of 20 KAFY using water delivery system conservation measures would beassociated with the installation of 5 to 8 miles of seepage interceptors. The highest annualemissions would be associated with construction of three to four lateral interceptor systemsper year. Assuming four lateral interceptor systems would be constructed per year,emissions would be approximately 6.4 tons per year of ROC, 77.6 tons per year of NOx,5.2 tons per year of PM10 and 64.4 tons per year of CO.
The applicable significance criteria in the Imperial Valley area are the general conformity deminimis thresholds (100 tons per year) for the nonattainment pollutants ozone (ROC andNOx) and PM10. Compared to these significance criteria, the estimated emissions would beless than significant.
As discussed in Section 3.7.4.1, soil disturbance associated with conservation measures isassumed to be within the range of typical historic and existing activities. Any construction-related increases in emissions of fugitive dust and exhaust from employee commutevehicles would be temporary and localized, thus less than significant. (Less than significantimpact.)
The IID water service area is the subregion where the operations associated with on-farmand water delivery system conservation measures would occur in the Proposed Project. Thisis the area with the greatest potential for operation–related air quality impacts, other thanthe Salton Sea subregion, where indirect air-quality impacts could result from operation ofthe Proposed Project (associated with lowered water levels in the Salton Sea). Operation ofthe on-farm irrigation management measures would occur over the lifetime of the ProposedProject, up to 75 years, depending on when the measures are implemented.
3.7 AIR QUALITY
WATER CONSERVATION AND TRANSFER PROJECT—FINAL EIR/EIS, OCTROBER 20023.7-34 SFO\SEC_3.7.DOC\022950013
As discussed in Section 3.7.4.1, other than a substantial increase in fallowing, theconstruction and O&M activities are within the range of typical activities in the area, and theair quality impacts of construction and operation of the on-farm and water delivery systemconservation measures would be negligible. (Less than significant impact.)
Mitigation Measure AQ-2: Although impacts are less than significant, implementation ofBMPs during construction and site restoration and operation following construction wouldhelp to minimize PM10 emissions. BMPs could include, but are not limited to, the following:
• Equip diesel powered construction equipment with particulate matter emission controlsystems, where feasible.
• Use paved roads to access the construction sites when possible.
• Minimize the amount of disturbed area, and apply water or soil stabilization chemicalsperiodically to areas undergoing ground-disturbing activities. Limit vehicular access todisturbed areas, and minimize vehicle speeds.
• Reduce ground disturbing activities as wind speeds increase. Suspend grading andexcavation activities during windy periods (i.e., surface winds in excess of 20 miles perhour).
• Limit vehicle speeds to 10 mph on unpaved roads.
• Cover trucks that haul soils or fine aggregate materials.
• Enclose, cover, or water excavated soil twice daily.
• Cover stockpiles of excavated soil at all times when the stockpile is not in use. Secure thecovers.
• Replant vegetation in disturbed areas where water is available, following the completionof grading and/or construction activities.
• Designate personnel to monitor dust control measures to ensure effectiveness inminimizing fugitive dust emissions.
Impact AQ-3: Windblown dust from fallowed lands. Fallowing of agricultural lands is one ofthe potential water conservation methods for the Proposed Project. Baseline conditionsinclude approximately 20,000 acres of fallowed lands per year. The potential maximumfallowed acres that might be required each year under the Proposed Project would include50,000 acres to create 300 KAFY for transfer, 30,500 acres to create mitigation water for theSalton Sea Habitat Conservation Strategy, and 9,800 acres for the IOP, totaling 90,300 acres.It is not possible to quantify emissions and associated impacts from potential increases infallowing of agricultural lands, at a variety of locations over time, for water conservation.On one hand, emissions would decrease because the fallowed land would not be subject toplowing or the other agricultural activities that disturb soil. On the other hand, fallowedlands that are not properly retired or mitigated may be subject to wind erosion, resulting infugitive dust impacts.
Depending on the amount of land that is fallowed, and the way the land is managed beforeand during fallowing, the potential exists for fugitive dust impacts. On occasion, existing
3.7 AIR QUALITY
WATER CONSERVATION AND TRANSFER PROJECT—FINAL EIR/EIS, OCTROBER 2002SFO\SEC_3.7.DOC\022950013 3.7-35
concentrations of PM10 in the IID water service area violate national and state ambient airquality standards. To be conservative, this analysis concludes that the fugitive windblowndust emissions associated with additional exposed areas due to fallowing would bepotentially significant. (Potentially significant impact.)
Mitigation Measure AQ-3: As lands are fallowed, at least one of the following BMPs tominimize PM10 emissions must be implemented. BMPs could include, but are not limited to,the following:
• Implement conservation cropping sequences and wind erosion protection measures asoutlined by the US Department of Agriculture Natural Resources Conservation Service,such as:
− Plan ahead to start with plenty of vegetation residue, and maintain as much residueon fallowed fields as possible. Residue is more effective for wind erosion protectionif left standing.
− If residues are not adequate, small grain can be seeded about the first of the year totake advantage of the winter rains and irrigated with a light irrigation if needed toget adequate growth.
− Avoid any tillage if possible.− Avoid any traffic or tillage when fields are extremely dry to avoid pulverization.
• Apply soil stabilization chemicals to fallowed lands.
• Re-apply drain water to allow protective vegetation to be established.
• Reuse irrigation return flows to irrigate windbreaks across blocks of land includingmany fields to reduce wind fetch and reduce emissions from fallowed, farmed, andother lands within the block. Windbreak species, management, and layout would beoptimized to achieve the largest feasible dust emissions reduction per unit wateravailable for their irrigation. Windbreak corridors would provide ancillary aesthetic andhabitat benefits.
With implementation of one or more of the above BMPs, impacts would be less thansignificant. (Less than significant impact with mitigation.)
Inadvertent Overrun and Payback Policy (IOP)Impact AQ-4. Emissions from construction and operation of on-farm and delivery systemconservation measures for compliance with the IOP. In the worst case scenario for air qualityimpacts, conservation of an average 59 KAFY for the IOP would be generated byconstructing on-farm and system based conservation measures. This scenario is highlyunlikely because IID is required to payback overruns within 1-3 years and it would beonerous to construct sufficient conservation measures as quickly as the payback would berequired. A more likely scenario is that IID would fallow lands on a rotational basis tocomply with the IOP. However, IID could potentially elect to construct conservationmeasures to comply with the IOP and in the worst case if they constructed conservationmeasures to generate 59 KAFY it could result in an annual emissions rate approximately3 times as high as the emissions presented in Table 3.7-12 or 3.7-13, indicating the potentialfor significant air quality impacts. Comparison to the general conformity de minimisthresholds (100 tons per year) for the nonattainment pollutants ozone (ROC and NOx) and
3.7 AIR QUALITY
WATER CONSERVATION AND TRANSFER PROJECT—FINAL EIR/EIS, OCTROBER 20023.7-36 SFO\SEC_3.7.DOC\022950013
PM10 would indicate the potential for significant emission rates to occur, if construction ofcertain on-farm measures is undertaken to conserve more than about 25 to 30 KAFY in anygiven year. (Potentially significant impact.)
Mitigation Measure AQ-4: If construction of sufficient magnitude is proposed for anygiven year, assuming construction emissions are determined to be the direct or indirec tresult of a federal action, a general conformity determination for that federal action wouldbe required. General conformity requirements in the IID water service area are outlined inRule 925 of the ICAPCD and the EPA General Conformity Rule. However, the only projectcomponent that could involve the construction of conservation measures that is consideredto be a federal action is implementation of the Salton Sea Habitat Conservation Strategy. Theselection of conservation measures for transfer or for compliance with the IOP is not afederal action.
If general conformity requirements are triggered, the federal agency must conduct a full-scale conformity analysis, culminating in a conformity determination. Opportunity forreview and comment by the public and other interested federal, state, and local agenciesmust be provided. The analysis must demonstrate that the project satisfies the criteria in theICAPCD Rule and 40 CFR 93.158 and 93.159. If the action does not satisfy the criteria, thefederal agency must take mitigation measures to arrive at a positive conformitydetermination. Methods for determining conformity include the following:
• The proposed emissions are specifically identified and accounted for in the applicableSIP.
• The proposed emissions are fully offset through reductions elsewhere in the same non-attainment or maintenance area.
• Air quality modeling demonstrates emissions would not cause or contribute to newviolations of air quality standards, increase the frequency or severity of existingviolations, or delay the timely attainment of the NAAQS.
• Emissions would not exceed the emissions budgets available for this type of emissionsource in the applicable SIP.
• State would sign a commitment to revise the SIP to include the proposed action.
(Less than significant impact with mitigation.)
Impacts resulting from the implementation of the IOP would be the same for Alternatives 2, 3, and 4;therefore, they are not discussed under each Alternative.
Habitat Conservation Plan (HCP-IID) (IID Water Service Area Portion)Impact HCP-IID-AQ-5: Emissions from construction of the managed marsh and native treehabitat. Construction would result in a temporary increase in PM10 (dust) emissions,temporary increases in soil erosion potential, and increase in traffic and transportationimpacts resulting from construction activities. Most of these impacts would be temporaryand could be reduced substantially with implementation of BMPs during construction andsite restoration following construction. Further, these impacts would be offset by the long-term benefit to air quality by converting areas that would potentially be barren, orcultivated every year, into more stable habitats. (Less than significant impact.)
3.7 AIR QUALITY
WATER CONSERVATION AND TRANSFER PROJECT—FINAL EIR/EIS, OCTROBER 2002SFO\SEC_3.7.DOC\022950013 3.7-37
Mitigation Measure AQ-5: Implement BMPs as listed under Mitigation Measure AQ-2, above,during construction and site restoration following construction. (Less than significant.)
Operation of the elements of the HCP will not result in emissions in the IID water servicearea, and no impacts to air quality would occur.
Impacts resulting from the implementation of the IID Water Service Area Portion of the HCP wouldbe the same for Alternatives 2, 3 and 4; therefore, they are not discussed under those Alternatives.
Salton Sea Habitat Conservation Strategy (HCP-SS)
Impact HCP-SS-AQ-6 Windblown dust from fallowed lands. As described in Section 2.2.6.7, theSalton Sea Habitat Conservation Strategy has been evaluated in this final EIR/EIS with theassumption that mitigation water would be generated by fallowing within the IID water-service area. Other sources of water could be used, but they have not been evaluated in thisEIR/EIS.
Additionally, under the Proposed Project, the implementation of the Salton Sea HabitatConservation Strategy in concert with the on-farm irrigation system improvement approachto conserving water for transfer was determined not to be feasible because of the number oftotal acres that would be needed. This is because the “efficiency conservation” measuresrequire a 1 to 1 ratio of mitigation water to the Sea. Therefore, the combination of only on-farm and/or delivery system efficiency conservation measures required to produce 300KAFY for transfer plus fallowing within the IID water service area as the sole method ofproviding the mitigation water associated with the Salton Sea Habitat Conservation Strategyhas not been assessed in this final EIR/EIS.
Additional details of the Salton Sea Habitat Conservation Strategy can be found in Section2.2.6.7.
If fallowing is implemented, impacts would be similar in type to those described underImpact AQ-3. Conservation for the Salton Sea Habitat Conservation Strategy would be inaddition to the up to 300 KAFY for transfer and the 59 KAFY for the IOP. If fallowing is thesole mitigation water source for the Salton Sea Habitat Conservation Strategy,approximately 30,500 fallowed acres would be required. This acreage is in addition to thefallowed acreage required to generate conserved water for transfer. The total fallowedacreage under the Proposed Project would be about 90,300 acres as discussed under ImpactAQ-3. (Potentially significant impact.)
Mitigation Measure PP-HCP-SS-AQ-6. This impact would be less than significant withimplementation of Mitigation Measures AQ-2 and AQ-3. (Less than significant impact withmitigation.)
SALTON SEAWater Conservation and TransferConstruction of the on-farm and water delivery system conservation measures would notoccur in the Salton Sea subregion. There would be no air quality impacts associated withconstruction of the Proposed Project in this subregion.
3.7 AIR QUALITY
WATER CONSERVATION AND TRANSFER PROJECT—FINAL EIR/EIS, OCTROBER 20023.7-38 SFO\SEC_3.7.DOC\022950013
No direct air quality impacts would be associated with operation of the Proposed Project inthe Salton Sea subregion. Operation of the on-farm conservation measures would not occurin this subregion.
Impact AQ-7: Indirect air quality impacts from potential for windblown dust from exposedshoreline. Implementation of the Proposed Project would result in the conservation of up to300 KAFY for transfer and a reduction in the volume of water discharged to the Salton Sea .The amount of water conserved is expected to increase at a rate of approximately 25 KAFYas conservation measures are implemented incrementally, until the full amount ofconservation is reached. The effect of the conservation measures and reduced inflowvolumes on the Sea would not be noticeable in the short-term. The water level and the totalsurface area of the Salton Sea would, however, decrease in the long term.
Under the Proposed Project, if on-farm and/or system based conservation measures areimplemented to conserve water for transfer, the elevation of the Salton Sea would decreasefrom the Baseline level of –235 feet msl to –250 feet msl by the year 2077, a decrease of15 feet. The total surface area of the Sea would decrease exposing about 49,500 more acres ofcurrently submerged bottom sediments or playa, compared to the Baseline. If fallowing isimplemented to conserve water for transfer, the elevation of the Sea is projected to decline to–241 feet msl by 2077, exposing 15,800 acres more than under the Baseline. Withimplementation of the Salton Sea Habitat Conservation Strategy the elevation of the Sea ispredicted to be –240 feet msl in 2077, exposing 15,100 acres more than under the Baseline.
As described in Section 2.2.6.7, the Salton Sea Habitat Conservation Strategy has beenevaluated in this final EIR/EIS with the assumption that mitigation water would begenerated by fallowing within the IID water service area. Other sources of water could beused, but they have not been evaluated in this EIR/EIS.
Additional details of the Salton Sea Habitat Conservation Strategy can be found inSection 2.2.6.7.
The predicted decrease in Sea level and increase in exposed area would increase thepotential for dust suspension. Spatial variations in sediment characteristics and soilerodibility, temporal variations in wind conditions, and variation in factors contributing tothe formation of salt crusts prevent any reasonable quantitative estimate of emissions andassociated impacts from the exposed shoreline. Therefore, a qualitative assessment of thepotential for dust suspension is provided in this EIR/EIS.
Several conditions at the Salton Sea currently exist or would be expected to exist in thefuture as a result of lowered Sea levels. Qualitatively, it is anticipated that the combinationof moisture present in the unsaturated zone beneath the exposed playa, the probableformation of dried algal mats and stable efflorescent salt crusts consisting of chloride andsulfate salts, and the relatively low frequency of high wind events at the Salton Sea wouldinhibit the suspension of dust. It is likely, however, that these assumptions would not applyto all areas of exposed playa or shoreline at all times, so dust events could potentially occur.
Based on the factors influencing emissions at the Salton Sea as discussed above, the extent ofany increases in dust emissions and associated increases in ambient concentrations of thenonattainment pollutant PM10 in the future, as shoreline conditions change, is unknown. Onoccasion, existing concentrations of PM10 in the Salton Sea area violate national and state
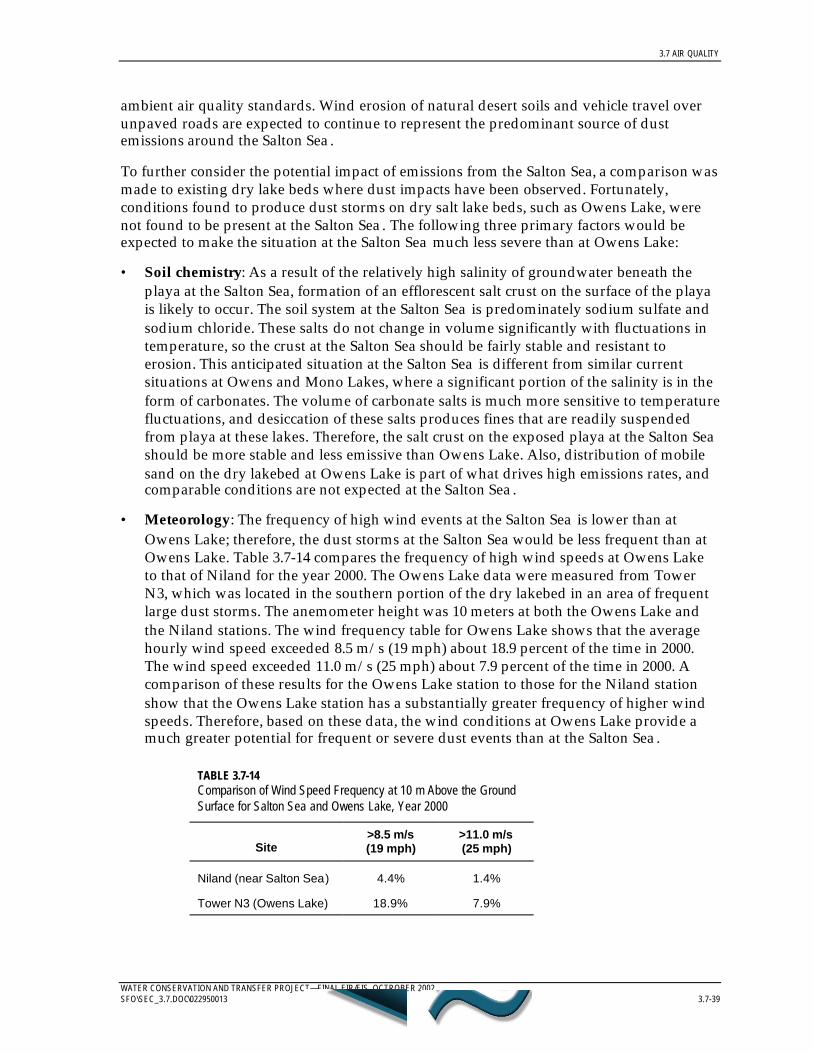
3.7 AIR QUALITY
WATER CONSERVATION AND TRANSFER PROJECT—FINAL EIR/EIS, OCTROBER 2002SFO\SEC_3.7.DOC\022950013 3.7-39
ambient air quality standards. Wind erosion of natural desert soils and vehicle travel overunpaved roads are expected to continue to represent the predominant source of dustemissions around the Salton Sea .
To further consider the potential impact of emissions from the Salton Sea, a comparison wasmade to existing dry lake beds where dust impacts have been observed. Fortunately,conditions found to produce dust storms on dry salt lake beds, such as Owens Lake, werenot found to be present at the Salton Sea . The following three primary factors would beexpected to make the situation at the Salton Sea much less severe than at Owens Lake:
• Soil chemistry: As a result of the relatively high salinity of groundwater beneath theplaya at the Salton Sea, formation of an efflorescent salt crust on the surface of the playais likely to occur. The soil system at the Salton Sea is predominately sodium sulfate andsodium chloride. These salts do not change in volume significantly with fluctuations intemperature, so the crust at the Salton Sea should be fairly stable and resistant toerosion. This anticipated situation at the Salton Sea is different from similar currentsituations at Owens and Mono Lakes, where a significant portion of the salinity is in theform of carbonates. The volume of carbonate salts is much more sensitive to temperaturefluctuations, and desiccation of these salts produces fines that are readily suspendedfrom playa at these lakes. Therefore, the salt crust on the exposed playa at the Salton Seashould be more stable and less emissive than Owens Lake. Also, distribution of mobilesand on the dry lakebed at Owens Lake is part of what drives high emissions rates, andcomparable conditions are not expected at the Salton Sea .
• Meteorology: The frequency of high wind events at the Salton Sea is lower than atOwens Lake; therefore, the dust storms at the Salton Sea would be less frequent than atOwens Lake. Table 3.7-14 compares the frequency of high wind speeds at Owens Laketo that of Niland for the year 2000. The Owens Lake data were measured from TowerN3, which was located in the southern portion of the dry lakebed in an area of frequentlarge dust storms. The anemometer height was 10 meters at both the Owens Lake andthe Niland stations. The wind frequency table for Owens Lake shows that the averagehourly wind speed exceeded 8.5 m/s (19 mph) about 18.9 percent of the time in 2000.The wind speed exceeded 11.0 m/s (25 mph) about 7.9 percent of the time in 2000. Acomparison of these results for the Owens Lake station to those for the Niland stationshow that the Owens Lake station has a substantially greater frequency of higher windspeeds. Therefore, based on these data, the wind conditions at Owens Lake provide amuch greater potential for frequent or severe dust events than at the Salton Sea .
TABLE 3.7-14Comparison of Wind Speed Frequency at 10 m Above the GroundSurface for Salton Sea and Owens Lake, Year 2000
Site>8.5 m/s(19 mph)
>11.0 m/s(25 mph)
Niland (near Salton Sea) 4.4% 1.4%
Tower N3 (Owens Lake) 18.9% 7.9%
3.7 AIR QUALITY
WATER CONSERVATION AND TRANSFER PROJECT—FINAL EIR/EIS, OCTROBER 20023.7-40 SFO\SEC_3.7.DOC\022950013
• Recession Rate: The anticipated decline in water levels at the Salton Sea is predicted tobe significantly slower than what occurred at Owens Lake (only about 20 percent asfast). Natural processes may contribute more to controlling dust emissions at the SaltonSea than they have at Owens. These natural processes could include (a) the enabling ofvegetation through development of soil conditions favorable to plant growth (includingimprovement in natural drainage); (b) development of native plant communities;(c) sequestration of sand into relatively stable dunes; and (d) formation of relativelystable crusts.
As discussed in Section 3.1, Hydrology and Water Quality, a reduction of the Salton Seasurface elevation, and resulting exposure of playa, is expected even in the absence of theProposed Project, but it would be accelerated when the Proposed Project or Alternatives areimplemented. It should be noted that the model projections included throughout thedocument for the Proposed Project reflect the worst-case scenario for the Proposed Project.The projections for the Salton Sea assume a maximum level of conservation of 300 KAFYaccomplished via on-farm irrigation improvements and water delivery systemimprovements with no fallowing. This scenario also includes the additional 59 KAFYconservation required to comply with the IOP. As described in Section 2, the ProposedProject could be implemented with lesser amounts of conservation and using fallowing,both of which would result in lesser impacts to the Salton Sea as described in Alternative 4.
To be conservative, this analysis concludes that windblown dust from exposed shorelinemay result in potentially significant air quality impacts. (Potentially significant impact.)
Mitigation Measure AQ-7: Implementation of the Salton Sea Habitat Conservation Strategywould maintain the elevation of the Salton Sea at Baseline levels until the year 2035. Thisapproach would also maintain the amount of exposed shoreline at Baseline levels until theyear 2035. Beyond year 2035 the elevation of the Sea would decline to approximately –240feet msl, exposing approximately 15,100 acres by the year 2077.
Rather than focusing on site-specific and costly dust control mitigation for an undefined andfuture potential problem, a phased approach is proposed to detect, locate, assess, andresolve this potentially significant impact. The following 4-step plan would be implementedto mitigate significant PM10 emissions and incremental health effects (if any) from Salton Seasediments exposed by the Proposed Project:
(1) Restrict Access. Public access, especially off-highway vehicle access, would be limited,to the extent legally and practicably feasible, to minimize disturbance of natural crustsand soils surfaces in future exposed shoreline areas. Prevention of crust and soildisturbance is viewed as the most important and cost-effective measure available toavoid future dust impacts. IID or other governmental entities own or control most of thelands adjacent to and under the Salton Sea. Fencing and posting would be installed onthese lands in areas adjacent to private lands or public areas to limit access.
(2) Research and Monitoring. A research and monitoring program would be implementedincrementally as the Sea recedes. The research phase would focus on development ofinformation to help define the potential for problems to occur in the future as the Seaelevation is reduced slowly over time. Research would:
(a) Study historical information on dust emissions from exposed shoreline areas.
3.7 AIR QUALITY
WATER CONSERVATION AND TRANSFER PROJECT—FINAL EIR/EIS, OCTROBER 2002SFO\SEC_3.7.DOC\022950013 3.7-41
(b) Determine how much land would be exposed over time and who owns it.
(c) Conduct sampling to determine the composition of “representative” shorelinesediments and the concentrations of ions and minerals in salt mixtures at the Sea.Review results from prior sampling efforts. Identify areas of future exposedshoreline with elevated concentrations of toxic substances relative to background.
(d) Analyze to predict response of Salton Sea salt crusts and sediments to environmentalconditions, such as rainfall, humidity, temperature, and wind.
(e) Implement a meteorological, PM10, and toxic air contaminant monitoring program tobegin under existing conditions and continue as the Proposed Project isimplemented. Monitoring would take place both near the sources (exposed shorelinecaused by the Project) and near the receptors (populated areas) in order to assess thesource-receptor relationship. The goal of the monitoring program would be toobserve PM10 problems or incremental increases in toxic air contaminantconcentrations associated with the Proposed Project and to provide a basis formitigation efforts.
(f) If incremental increases in toxic air contaminants (such as arsenic or selenium, forexample) are observed at the receptors and linked to emissions from exposedshoreline caused by the Project, conduct a health risk assessment to determinewhether the increases exceed acceptable thresholds established by the governing airdistricts and represent a significant impact.
(g) If potential PM10 or health effects problem areas are identified through research andmonitoring and the conditions leading to PM10 emissions are defined, studypotential dust-control measures specific to the identified problems and theconditions at the Salton Sea .
(3) Create or Purchase Offsetting Emission Reduction Credits. This step would requirenegotiations with the local air pollution control districts to develop a long-term programfor creating or purchasing offsetting PM10 emission reduction credits. Credits would beused to offset emissions caused by the Proposed Project, as determined by monitoring(see measure 2, above). IID proposes negotiation of an offset program that would allowpurchase of credits available under banking programs, such as Imperial County AirPollution Control District Rule 214 for agricultural burning. Other means of dust controland PM10 emissions reductions available for application to agricultural operations in theIID service area would also be pursued for credit banking opportunities (e.g., managingvacant lands, improving farming practices to reduce PM10, and paving roads). This stepwould not be used to mitigate toxic air contaminants (if any); Step 4 would be necessaryif toxic air contaminants pose a significant health issue.
(4) Direct Emission Reductions at the Sea. If sufficient offsetting emission reduction creditsare not available or feasible, Step 4 of this mitigation plan would be implemented. Itwould include either, or a combination of:
(a) Implementing feasible dust mitigation measures. This includes the potentialimplementation of new (and as yet unknown or unproven) dust control technologiesthat may be developed at any time during the term of the Proposed Project; and/or
3.7 AIR QUALITY
WATER CONSERVATION AND TRANSFER PROJECT—FINAL EIR/EIS, OCTROBER 20023.7-42 SFO\SEC_3.7.DOC\022950013
(b) If feasible, supplying water to the Sea to re-wet emissive areas exposed by theProposed Project, based on the research and monitoring program (Step 2 of thisplan). This approach could use and extend the duration of the Salton Sea HabitatConservation Strategy.
If, at any time during the Project term, additional feasible dust mitigation measures areidentified, these could be implemented in lieu of other dust mitigation measures or theprovision of mitigation water to the Sea. Thus, it is anticipated that the method orcombination of methods could change from time to time over the Project term.
The success of the proposed mitigation plan is dependent on coordination and cooperationof the involved parties and the air quality regulatory agencies. Coordination,communication, staff commitment, and funding will be required in each phase of theproposed research, monitoring, and emissions reduction program.
The proposed mitigation is potentially sufficient to avoid or suppress PM10 emissions to lessthan significant levels. However, a level of uncertainty remains regarding whether short-term and long-term impacts can be mitigated to a less-than-significant level, as describedbelow. Therefore, the conservative conclusion—that these impacts are potentially significantand cannot be mitigated—has been retained in this Final EIR/EIS.
The mitigation plan described above works in concert with the Salton Sea HabitatConservation Strategy and is expected to reduce air quality impacts and PM10-related healtheffects. However, problem assessment and mitigation implementation would occursubsequent to the development of potential dust emissions. Therefore, interim impactscould be significant.
It is uncertain what the conditions in the Salton Sea Air Basin will be as of 2035 when Projectimpacts may begin to occur. The Imperial Valley portion of the Salton Sea Air Basin iscurrently a moderate nonattainment area and the Riverside County/Coachella Valleyportion is currently a serious nonattainment area for the National Ambient Air QualityStandard for PM10. The attainment status of the Basin in 2035 cannot be ascertained;however, the Clean Air Act requires a plan for attainment well in advance of that date.
Impact AQ-8: Potential for decreased water flow and quality to increase odorous impacts inproximity to the Sea. Decreased water flow and quality in the Salton Sea could contribute tothe premature death of flora or fauna and/or increase the summertime algae blooms, eitheror both of which would contribute to odorous emissions. However, as a result of lowpopulation levels around the Sea, it is not likely that “objectionable odors would affect asubstantial number of people.” This impact is expected to be less than significant.
3.7.4.4 Alternative 1: No ProjectLOWER COLORADO RIVERWater Conservation and TransferImplementation of the No Project would result in no air quality impacts in the LCRsubregion.
3.7 AIR QUALITY
WATER CONSERVATION AND TRANSFER PROJECT—FINAL EIR/EIS, OCTROBER 2002SFO\SEC_3.7.DOC\022950013 3.7-43
IID WATER SERVICE AREA AND AACWater Conservation and Transfer
Implementation of the No Project would result in no air quality impacts in the IID waterservice area and AAC subregion.
SALTON SEAWater Conservation and TransferWith the No Project Alternative, water levels and surface area in the Salton Sea woulddecline. Water levels are projected to decline from an existing level of –228 to –235 msl (adecline of 7 feet) and total surface area is projected to decline from approximately 233,000 toapproximately 217,000 acres, exposing about 16,000 acres over the next 75 years. Theexposure of this previously inundated area may result in windblown dust as described inImpact AQ-7.
3.7.4.5 Alternative 2 (A2): Water Conservation and Transfer of Up To 130 KAFY to SDCWA (On-farm Irrigation System Improvements as Exclusive Conservation Measure)IID WATER SERVICE AREA AND AACWater Conservation and TransferImpact A2-AQ-1: Emissions from construction and operation of on-farm conservation measuresfrom the water conservation program. As discussed above for the Proposed Project, annualestimated construction emissions for on-farm conservation measures for 130 KAFY wouldbe 1.1 to 9.7 tons per year of ROC, 3.9 to 64.3 tons per year NOx, 0.3 to 4.6 tons per yearPM10, and 8.0 to 101.6 tons per year CO. These levels are less than the de minimis thresholds[100 tons per year] for the nonattainment pollutants ozone [ROC and NOx] and PM10 in theImperial Valley area. Impacts from the estimated emissions would be less than significant.
As discussed in Section 3.7.4.1, soil disturbance associated with the construction ofconservation measures is assumed to be within the realm of typical activities. Anyconstruction-related increases in emissions of fugitive dust and exhaust from employeecommute vehicles would be temporary and localized, thus, less than significant.
Overall construction emissions from Alternative 2 would be expected to be similar to theProposed Project however they would likely occur over a shorter duration because only130KAFY would be conserved for transfer compared to 300 KAFY for transfer for theProposed Project.
As discussed in Section 3.7.4.1, construction and O&M activities are within the realm oftypical activities in the area, and the air quality impacts of construction and operation of theon-farm conservation measures would be negligible. (Less than significant impact.)
Mitigation Measure A2-AQ-1: Although impacts are less than significant, implementation ofBMPs, as described under Mitigation Measure AQ-2 above, during construction and siterestoration and operation following construction would help to minimize PM10 emissions.(Less than significant impact.)
3.7 AIR QUALITY
WATER CONSERVATION AND TRANSFER PROJECT—FINAL EIR/EIS, OCTROBER 20023.7-44 SFO\SEC_3.7.DOC\022950013
Salton Sea Habitat Conservation Strategy (HCP-SS)
Impact A2-HCP-SS-AQ-2: Windblown dust from fallowed lands. Mitigation water for the SaltonSea Habitat Conservation Strategy could be generated via fallowing, although other sourcesof water could be used as described in Section 2.2.6.7. If fallowing is implemented, impactswould be similar in type to those described under Impact AQ-3. Conservation for the SaltonSea Habitat Conservation Strategy would be in addition to the up to 130 KAFY for transferand the 59 KAFY for the IOP. If fallowing is implemented for the Salton Sea HabitatConservation Strategy under Alternative 2, a maximum of approximately 40,600fallowed acres (for a total of approximately as 50,400 acres, including the IOP) would berequired. (Potentially significant impact.)
Mitigation Measure A2-HCP-SS-AQ-2. This impact would be less than significant withimplementation of Mitigation Measures AQ-2 and AQ-3. (Less than significant impact withmitigation.)
SALTON SEAWater Conservation and TransferConstruction of the on-farm and water delivery system conservation measures would notoccur in the Salton Sea subregion. No air quality impacts would be associated withconstruction of the Alternative 2 in this subregion.
No direct air quality impacts would be associated with operation of Alternative 2 in theSalton Sea subregion. Operation of the on-farm conservation measures would not occur inthis subregion.
Impact A2-AQ-3: Indirect air quality impacts from potential for windblown dust from exposedshoreline. As described above, the impacts and potential for impacts would increase becauseimplementation of the proposed water conservation measures would reduce the volume ofwater discharged to the Salton Sea . Alternative 2 would result in a decline in elevation of theSea from the Baseline condition of -235 to –242 feet msl (a decline of 7 feet) and a reductionin surface area, exposing about 21,700 acres of shoreline more than the Baseline. Withimplementation of the Salton Sea Habitat Conservation Strategy, the elevation of the SaltonSea at the end of the Project term (2077) would be approximately –242 feet msl, leavingapproximately 21,200 acres of shoreline exposed compared to the Baseline.
As described above and in Section 2.2.6.7, the Salton Sea Habitat Conservation Strategy hasbeen evaluated in this final EIR/EIS with the assumption that mitigation water would begenerated by fallowing within the IID water service area. Other sources of water could beused but they have not been evaluated in this EIR/EIS.
Additional details of the Salton Sea Habitat Conservation Strategy can be found in Section2.2.6.7.
It is anticipated that the Salton Sea level would decrease over time and expose the shorelineeven in the absence of implementation of the Proposed Project or its Alternatives.Implementation of Alternative 2 would accelerate the shoreline exposure, and result inapproximately 42 percent more exposed area compared to the Baseline. The predictedincrease in exposed area would increase the potential for dust suspension. The extent of any
3.7 AIR QUALITY
WATER CONSERVATION AND TRANSFER PROJECT—FINAL EIR/EIS, OCTROBER 2002SFO\SEC_3.7.DOC\022950013 3.7-45
potential increases in dust emissions and ambient PM10 concentrations in the future isunknown. The impacts from Alternative 2 in the Salton Sea area would be expected to besimilar to, but less than for the Proposed Project, because the Sea would recede at a slowerrate, and substantially less area would ultimately be exposed. To be conservative, thisanalysis concludes that windblown dust from exposed shoreline may still result inpotentially significant impacts. (Potentially significant, unavoidable impact).
Mitigation Measure A2-AQ-3: The same mitigation measures described in AQ-7 would beimplemented for Alternative 2. (Potentially significant, unavoidable impact withmitigation.)
Impact A2-AQ-4: Potential for decreased water flow and quality to increase odorous impacts inproximity to the Sea. Decreased water flow and quality in the Salton Sea could contribute tothe premature death of flora or fauna and/or increase the summertime algae blooms, eitheror both of which would contribute to odorous emissions. However, due to low populationlevels around the Sea, it is not likely that “objectionable odors would affect a substantialnumber of people.” This impact is expected to be less than significant (Less than significantimpact.)
3.7.4.6 Alternative 3 (A3): Water Conservation and Transfer of Up To 230 KAFY to SDCWA,CVWD, and/or MWD (All Conservation Measures)IID WATER SERVICE AREA AND AACWater Conservation and Transfer
Impact A3-AQ-1: Emissions from construction and operation of on-farm and delivery systemconservation measures from the water conservation program. As discussed above for theProposed Project, annual estimated construction emissions for on-farm conservationmeasures or water delivery system conservation measures would be less than the applicablede minimis thresholds [100 tons per year] for the nonattainment pollutants ozone [ROC andNOx] and PM10 in the IID water service area. Impacts from the estimated emissions would beless than significant.
As discussed in Section 3.7.4.1, soil disturbance associated with conservation measures isassumed to be within the realm of typical activities. Any construction-related increases inemissions of fugitive dust and exhaust from employee commute vehicles would betemporary and localized, and thus less than significant.
Overall construction and operation emissions from Alternative 3 would be expected to besimilar to the Proposed Project; however, they would likely occur over a shorter durationbecause only 230 KAFY would be conserved for transfer compared to 300 KAFY for transferfor the Proposed Project. As discussed in Section 3.7.4.1, construction and O&M activitiesare within the range of typical activities in the area, and the air quality impacts ofconstruction and operation of the on-farm and delivery system conservation measureswould be negligible. (Less than significant impact.)
Mitigation Measure A3-AQ-1. Although impacts are less than significant, implementation ofBMPs, as described under Mitigation Measure AQ-2, during construction and siterestoration and operation following construction will help to minimize PM10 emissions.(Less than significant impact.)
3.7 AIR QUALITY
WATER CONSERVATION AND TRANSFER PROJECT—FINAL EIR/EIS, OCTROBER 20023.7-46 SFO\SEC_3.7.DOC\022950013
Impact A3-AQ-2: Windblown dust from fallowed lands. Fallowing of agricultural lands is oneof the potential water conservation methods for Alternative 3. Baseline conditions includeapproximately 20,000 acres of fallowed lands per year. The potential maximumfallowed acres that might be required each year for Alternative 3 would be approximately67,300 acres to create mitigation water for the Salton Sea Habitat Conservation Strategy (iffallowing is the sole source of mitigation water) and 9,800 acres for the IOP, totaling77,100 acres if on-farm conservation measures are used to create water for transfer. A lesseramount of total fallowing (73,200) would be required if fallowing is used to generate waterfor transfer. It is not possible to quantify emissions and associated impacts from potentialincreases in fallowing of agricultural lands at a variety of locations over time for waterconservation. On one hand, emissions would decrease because the fallowed land would notbe subject to plowing or the other agricultural activities that disturb soil. On the other hand,fallowed lands that are not properly retired or mitigated may be subject to wind erosion,resulting in fugitive dust impacts.
Depending on the amount of land that is fallowed, and the way the land is managed beforeand during fallowing, the potential exists for fugitive dust impacts. On occasion, existingconcentrations of PM10 in the IID water service area violate national and state ambient airquality standards. To be conservative, this analysis concludes that the fugitive windblowndust emissions associated with additional exposed areas resulting from fallowing would bepotentially significant. (Potentially significant impact.)
Mitigation Measure A3-AQ-2: Implement BMPs, as described in Mitigation Measure AQ-3.With implementation of one or more of the BMPs, impacts would be less than significant.(Less than significant impact with mitigation.)
Salton Sea Habitat Conservation Strategy (HCP-SS)
Impact A3-HCP-SS-AQ-3: Windblown dust from fallowed lands. As described above and inSection 2.2.6.7, the Salton Sea Habitat Conservation Strategy has been evaluated in this finalEIR/EIS with the assumption that mitigation water would be generated by fallowing withinthe IID water service area. Other sources of water could be used, but they have not beenevaluated in this EIR/EIS.
Additional details of the Salton Sea Habitat Conservation Strategy can be found inSection 2.2.6.7.
If fallowing were implemented for the Salton Sea Habitat Conservation Strategy withAlternative 3 the quantity of acres required would depend on the method of conservationused to generate water for transfer. If on-farm conservation measures are used to generate230 KAFY for transfer, then an additional 67,300 acres would be required to be fallowed tomeet the requirements of the Salton Sea Habitat Conservation Strategy for a total of 77,100acres (including the 9,800 acres for the IOP), if fallowing is the sole source of mitigationwater. However, if fallowing is used to generate 230 KAFY for transfer (approximately38,300 acres) then 25,100 would be required to meet the requirements of the Salton SeaHabitat Conservation Strategy for a total of 73,200 acres (including the 9,800 acres for theIOP). If fallowing is implemented, impacts would be similar in type to those describedunder Impact A3-AQ-2 and AQ-3. (Potentially significant impact.)
3.7 AIR QUALITY
WATER CONSERVATION AND TRANSFER PROJECT—FINAL EIR/EIS, OCTROBER 2002SFO\SEC_3.7.DOC\022950013 3.7-47
Mitigation Measure A3-HCP-SS-AQ-3. This impact would be less than significant withimplementation of Mitigation Measures AQ-2 and AQ-3. (Less than significant impact withmitigation.)
SALTON SEAWater Conservation and TransferConstruction of the on-farm and water delivery system conservation measures would notoccur in the Salton Sea subregion. No air quality impacts would be associated withconstruction of the Alternative 3 in this subregion.
No direct air quality impacts would be associated with operation of Alternative 3 in theSalton Sea subregion. Operation of the on-farm conservation measures would not occur inthis subregion.
Impact A3-AQ-4: Indirect air quality impacts from the potential for windblown dust fromexposed shoreline. As described above, the impacts and potential for impacts wouldincrease because implementation of the proposed water conservation measures wouldreduce the volume of water discharged to the Salton Sea. If on-farm and/or system-basedconservation measures are implemented to generate water for transfer, Alternative 3 wouldresult in a decline in elevation of the Sea to –247 feet msl (a decline of 12 feet compared tothe Baseline) and expose about 39,000 acres of shoreline. If fallowing is implemented togenerate water for transfer, Alternative 3 would result in a decline in elevation of the Sea to–239 feet (a decline of 4 feet compared to the Baseline) and expose about 11,600 acres ofshoreline. With implementation of the Salton Sea Habitat Conservation Strategy, if on-farmor system-based conservation measures are used to generate water for transfer, the elevationof the Sea is projected to decline to –246 feet msl. If fallowing is used to generate water fortransfer, with implementation of the Salton Sea Habitat Conservation Strategy, the Sea isprojected to decline to –239 feet msl.
As described above and in Section 2.2.6.7, the Salton Sea Habitat Conservation Strategy hasbeen evaluated in this final EIR/EIS with the assumption that mitigation water would begenerated by fallowing within the IID water service area. Other sources of water could beused, but they have not been evaluated in this EIR/EIS.
Additional details of the Salton Sea Habitat Conservation Strategy can be found inSection 2.2.6.7.
It is anticipated that the Salton Sea level would decrease over time and expose the shorelineeven in the absence of implementation of the Proposed Project or its Alternatives.Implementation of Alternative 3 would accelerate the shoreline exposure, and result inalmost 3.5 times as much exposed area compared to the Baseline. The predicted increase inexposed area would increase the potential for dust suspension. The extent of any potentialincreases in dust emissions and ambient PM10 concentrations in the future is unknown. Theimpacts from Alternative 3 in the Salton Sea area would be expected to be similar to, but lessthan for the Proposed Project, because the Sea would be receding at a slower rate, and lessarea would be exposed. To be conservative, this analysis concludes that windblown dustfrom exposed shoreline may still result in potentially significant impacts. (Potentiallysignificant and unavoidable impact.)
3.7 AIR QUALITY
WATER CONSERVATION AND TRANSFER PROJECT—FINAL EIR/EIS, OCTROBER 20023.7-48 SFO\SEC_3.7.DOC\022950013
Mitigation Measure A3-AQ-4: The same mitigation measures described in AQ-7 would beimplemented for Alternative 3. (Potentially significant and unavoidable with mitigation.)
Impact A3-AQ-5: Potential for decreased water flow and quality to increase odorous impacts inproximity to the Sea. Decreased water flow and quality in the Salton Sea could contribute tothe premature death of flora or fauna and/or increase the summertime algae blooms, eitheror both of which would contribute to odorous emissions. However, as a result of lowpopulation levels around the Sea, it is not likely that “objectionable odors would affect asubstantial number of people.” This impact is expected to be less than significant. (Less thansignificant impact.)
3.7.4.7 Alternative 4 (A4): Water Conservation and Transfer of Up To 300 KAFY to SDCWA,CVWD, and/or MWD (Fallowing As Exclusive Conservation Measure)IID WATER SERVICE AREA AND AACWater Conservation and TransferBecause conservation would be achieved exclusively through fallowing, no constructionactivities would be required, and no construction-related air emissions would occur. Inaddition, no air emissions from operation and maintenance of conservation facilities wouldoccur because no facilities for conservation would be constructed.
Impact A4-AQ-1: Windblown dust from fallowed lands. Fallowing of agricultural lands is thewater conservation method proposed for Alternative 4. Baseline conditions includeapproximately 20,000 acres of fallowed lands per year. The potential maximumfallowed acres that might be required each year would include 50,000 acres to create300 KAFY for transfer, 30,500 acres to create mitigation water for the Salton Sea HabitatConservation Strategy, and 9,800 acres for the IOP, totaling 90,300 acres. Impacts forAlternative 4 would be similar to those discussed for the Proposed Project. (Potentiallysignificant impact.)
Mitigation Measure A4-AQ-1: Implement BMPs, as described in Mitigation Measure AQ-3.With implementation of one or more of the BMPs, impacts would be less than significant.(Less than significant impact with mitigation.)
Salton Sea Habitat Conservation Strategy (HCP-SS)
Impact A4-HCP-SS-AQ-2: Windblown dust from fallowed lands. As described above and inSection 2.2.6.7, the Salton Sea Habitat Conservation Strategy has been evaluated in this finalEIR/EIS with the assumption that mitigation water would be generated by fallowing withinthe IID water service area. Other sources of water could be used, but they have not beenevaluated in this EIR/EIS.
Additional details of the Salton Sea Habitat Conservation Strategy can be found inSection 2.2.6.7.
If fallowing were implemented, impacts would be similar in type to those described underImpact AQ-3. Fallowing to create water for the Salton Sea Habitat Conservation Strategywould be in addition to the up to 300 KAFY for transfer and the 59 KAFY for the IOP. UnderAlternative 4 approximately 50,000 acres could be required to create water for transfer,
3.7 AIR QUALITY
WATER CONSERVATION AND TRANSFER PROJECT—FINAL EIR/EIS, OCTROBER 2002SFO\SEC_3.7.DOC\022950013 3.7-49
30,500 acres for the Salton Sea Habitat Conservation Strategy, and 9,800 for the IOP, for atotal of approximately 90,300 acres. (Potentially significant impact.)
Mitigation Measure A4-HCP-SS-AQ-2. This impact would be less than significant withimplementation of Mitigation Measures AQ-2 and AQ-3. (Less than significant impact withmitigation.)
SALTON SEAWater Conservation and TransferConservation measures would not be implemented in the Salton Sea subregion. No airquality impacts would be associated with construction of Alternative 4 in this subregion.
No direct air quality impacts would be associated with operation of Alternative 4 in theSalton Sea subregion. Operation of the on-farm conservation measures would not occur inthis subregion.
Impact A4-AQ-3: Indirect air quality impacts due to the potential for windblown dust fromexposed shoreline. As described above, the impacts and potential for impacts wouldincrease because implementation of the proposed water conservation measures wouldreduce the volume of water discharged to the Salton Sea. Alternative 4 would result in aprojected decline in elevation of the Sea to –241 feet msl, compared to the Baseline elevationof –235 feet msl (a decline of about 5 feet), and expose about 15,800 acres of shoreline. It isanticipated that the Salton Sea level would decrease over time and expose the shorelineeven in the absence of implementation of the Proposed Project or its Alternatives.Implementation of Alternative 4 would accelerate the shoreline exposure and result inapproximately 50 percent more exposed area compared to the Baseline. Withimplementation of the Salton Sea Habitat Conservation Strategy, the elevation of the SaltonSea at the end of the Project term (2077) would be about –240 feet msl exposing about 15,100acres of shoreline compared to the Baseline.
The predicted increase in exposed area would increase the potential for dust suspension.The extent of any potential increases in dust emissions and ambient PM10 concentrations inthe future is unknown. The impacts from Alternative 4 in the Salton Sea area would beexpected to be similar to, but less than for the Proposed Project, because the Sea would bereceding at a slower rate, and substantially less area would be exposed. To be conservative,this analysis concludes that windblown dust from exposed shoreline may still result inpotentially significant impacts. (Potentially significant and unavoidable impact.)
Mitigation Measure A4-AQ-3. The same mitigation measures described in AQ-7 would beimplemented for Alternative 4. (Significant and unavoidable impact with mitigation.)
Impact A4-AQ-4: Potential for decreased water flow and quality to increase odorous impacts inproximity to the Sea. Decreased water flow and quality in the Salton Sea could contribute tothe premature death of flora or fauna and/or increase the summertime algae blooms, eitheror both of which would contribute to odorous emissions. However, because of lowpopulation levels around the Sea, it is not likely that “objectionable odors would affect asubstantial number of people.” This impact is expected to be less than significant. (Less thansignificant impact.)