Embed Size (px)
Citation preview

www.paiz.gov.plwww.paiz.gov.pl
R&DR&DSector in Poland
Photo by: nicolasjoseschirado-Fotolia.com, Dmitry Sunagatov-Fotolia.com, Petr Kurgan-Fotolia.com, AA+W-Fotolia.com


The Research & Development Sector in Poland
Sector Profile

2
CONTENTS
Did you know that ..................................................................................................................... 3
Executive summary ................................................................................................................... 3
Human Capital .......................................................................................................................... 4
Employment .............................................................................................................................. 5
Research & Development Activities in Poland .......................................................................... 6
Research and Development Units in Poland ........................................................................... 12
Research and Development in Sectors .................................................................................. 13
Incentives Offer to the R+D Sector ......................................................................................... 15
Selected Innovation Supporting Institutions ............................................................................ 18

3
Did you know that
▪ human resources are the main factor supporting research and development (R+D) activities in Poland with the high rate of young scientists, large share of university graduates in the 30-34 age group and the high rate of at least secondary education in the 20-24 age group;
▪ the main R+D activities in Polish companies are: development and implementing new products in the market, patenting inventions and developing staff initiatives;
▪ entrepreneurs will have access to almost 10 times higher support for innovation and research in the EU per-spective 2014-2020 against the previous perspective;
▪ entrepreneurs will be the main beneficiaries of aid with major focus on increasing the rate of commercialisa-tion in research works and strengthening cooperation between enterprises and research institutions;
▪ in 2014 Polish entities made 45% of all patent applications to the European Patent Office (EPO) originating from Central and Eastern Europe;
▪ in 2014, 47% of all outlays on R+D activities in Poland made by the public and private sector were made by entrepreneurs.
Executive Summary
The expansion of the research and development sector is one of the priorities of Polish economy for the upcoming years. This is reflected in many strategic documents such as the National Development Strategy Poland 2020 with the innovativeness and increasing our country’s competitiveness pointed out as key factors. However, outlays on research and development in Poland still amount to only 0.94% of the GDP in 2014 which is 16% more than in 2013, but continues to be below the EU countries average.
In the European Commission innovation ranking Innovation Union Scoreboard, in 2014 Poland was classified as the moderate innovation country which means an improvement against 2013. An improvement in the number of patent applications to the Patent Office of the Republic of Poland by domestic entities is also visible (an increase from 2 392 in 2007 to 3 941 in 2014)1 .
Companies undertaking research and development works, developing know-how and most importantly, commer-cialising the results of research works may count on unprecedented amounts of funding. Available support mech-anisms include the EU grants, national funds or tax relief.
EU FundsEntrepreneurs will have access to almost 10 times higher support for innovation and research in the EU perspec-tive 2014-2020 against the previous perspective. Over PLN 20 billion is earmarked for supporting innovativeness and advanced technologies in only in the Smart Growth Operational Programme. The change in accents distribution in funds allocation is observed – entrepreneurs will be the main beneficiaries of aid with major focus on increasing the rate of commercialisation in research works and strengthening cooperation between enterprises and research institutions.
National FundsThe support for research and development activities in Poland is offered by various institutions including the Na-tional Centre for Research and Development, the National Science Centre, the National Fund for Environmental Protection and Water Management, the Ministry of Economy, the Ministry of Finance.The investors have access to numerous programs such as CuBR, Gekon, technology relief, InnoMed, InnoLot.
1 Crido Taxand, The R+D+I Market in Poland, 2015.

4
Tax ExemptionVarious amendments are implemented in the national legislation in order to stimulate enterprises to R+D works. Further amendments in the law are announced allowing for deducting from company income tax (CIT) the ex-penses on research, development and implementation activities. This mechanism will encourage entrepreneurs investing in development and innovations to take the risk.
On 1 January 2016, the entry into force of an Act on amending certain acts in connection with supporting innova-tiveness, amending e.g. the Acts on PIT and on CIT, introducing tax solutions beneficial for entrepreneurs. The pro-posed amendments should remove a number of major legal obstacles encountered by Polish research institutions as well as increase the tax incentives for enterprises encouraging them to undertake higher risk.
Human Capital
The growing potential of the research and development sector are mainly related to the easy access to highly qualified academic staff and students. There are 434 universities in Poland, with 400 graduates leaving them each year2. In addition, over 1.4 million students currently studying at Universities attend STEM (science, technology, engineering, maths) faculties. Many of them reach high places in prestigious contests.
Their achievements include: • 15 gold medals with special jury rewards, 30 gold medals, 19 silver medals and one bronze as well as nume-
rous awards and distinctions won by Polish scientists and inventors brought from the 64th International Fairs BRUSSELS INNOVA 20153;
▪ The 1st place in the CanSat Competition organised by NASA was awarded to the team from the AGH Univer-sity of Science and Technology for constructing and presenting the capabilities of a planetary probe;
▪ There were no less than 7 teams from Poland in the first ten of best rovers in the European Rover Challenge. The best of these teams – #next from the Białystok University of Technology received 420.2 points and took the second place;
▪ The 1st place in the Google Online Marketing Challenge 2014 – a victory of the Warsaw School of Economics for performing the most effective online marketing campaign using Google AdWords;
▪ The 38th place of Prometheus, the supercomputer from the AGH on the TOP500 list of the most powerful computers on the globe.
Also the results of research comparing the knowledge and abilities of teenagers, such as the PISA tests organised by the OECD classify Poland very high. The test included mathematical skills, competence in life sciences and the abilities of reading comprehension.
Polish junior high school graduates took 11th place in the world in the OECD PISA 2015 research on knowledge and skills of fifteen-year-olds. Polish students were ranked among the best of the European Union states and were much better than their peers from France, Germany, United States of America or Great Britain. Also, a significant improvement was visible in all areas subject to the research against 2012, although Poland also had quiet high results then4.
Polish students, both studying in Poland as well as those more and more often studying in foreign universities are very successful internationally. For example, a Polish student from the Cambridge University became the student of the year in Great Britain according to Rolls Royce in 2014.
2 Central Statistical Office, Universities and their Finances 2014 3 Polish Press Agency, 2015. 4 Universal Basic Skills: What Countries Stand to Gain, OECD, 2015.

5
2010 2011 2012 2013 2014
Personnel in R+D per 1000 employed 8.3 8.6 8.9 9.3 9.6
Research and development staff per 1000 employed 6.3 6.2 6.6 7.0 7.2
Excellent results of Polish students and scientists or engineers are not accidental. Poland has for many years attempted to enter the path of economic growth based on innovation, advanced technologies and production structure of high added value. Creating the economy based on innovations and advanced technologies is also the main objective of the new government.
The successes of Polish producers of computer games enjoy high recognition in the world (Wiedźmin – CD Pro-ject), as well as the acquisition technology of large pieces of graphene patented by the Electronic Materials Tech-nology (ITME) in Warsaw.
In summary, the government specified the importance of investing in advanced processes and technologies to stimulate the export and modern industry in the wider sense. The long-term objective is to move Poland upwards in terms of added value in sectors such as nanotechnology, biotechnology or electrical engineering. A lot of signif-icance is also given to the defence sector, space sector and in ICT.
Employment
In 2014, the number of personnel in the research and development activity amounted to 153.5 thousand people, including 60.3 thousand women which is respectively 5.4% and 4.0% more than last year. The employment in the R+D activities measured in the full time employment equivalents in 2014 reached 98.6 thousand FTE and increased by 5.1% against the previous year.
Graph 1. Personnel in the R+D Activities in 2013-2014 (in thousand)
Source: Research and Development Activities in Poland in 2014, GUS, 2015.
In 2014, the rate of personnel involved in scientific research and development works per 1 000 employed persons increased by 0.3 percentage points per year, while the rate of research employees per 1000 employed people increased by 0,2 p.p.5.
Table 1. Chosen Indicators regarding R+D Personnel in 2010-2014.
Source: Research and Development Activities in Poland in 2014, GUS, 2015.
5 Research and Development Activities in Poland in 2014, GUS, 2015.
– 5 –
Graph 1. Personnel in the R+D Activities in 2013-2014 (in thousand)
Source: Research and Development Activities in Poland in 2014, GUS, 2015.
In 2014, the rate of personnel involved in scientific research and development works per 1 000
employed persons increased by 0.3 percentage points per year, while the rate of research
employees per 1000 employed people increased by 0,2 p.p.5.
Table 1. Chosen Indicators regarding R+D Personnel in 2010-2014.
2010 2011 2012 2013 2014
Personnel in R+D per 1000 employed 8.3 8.6 8.9 9.3 9.6
Research and development staff per 1000 employed 6.3 6.2 6.6 7.0 7.2
Source: Research and Development Activities in Poland in 2014, GUS, 2015.
In 2014, the share of researchers (research and development employees) in the total number
of employees engaged in the research and development amounted to 75.2%. The number
of research and development staff in 2014 increased against the previous year by 5.3%, with
14.5% growth in the enterprises sector. This sector observed also the increase in general
number of R+D staff numbers by 13.7%. The number of technicians and equal level
employees working on R+D increased by 5.8% against 20136.
5Research and Development Activities in Poland in 2014, GUS, 2015. 6 Ibid.
0 20 40 60 80 100 120 140 160
2013
2014
145,6
153,5
93,8
98,6
FTE's Number of employees

6
In 2014, the share of researchers (research and development employees) in the total number of employees en-gaged in the research and development amounted to 75.2%. The number of research and development staff in 2014 increased against the previous year by 5.3%, with 14.5% growth in the enterprises sector. This sector ob-served also the increase in general number of R+D staff numbers by 13.7%. The number of technicians and equal level employees working on R+D increased by 5.8% against 20136.
Research & Development Activities in Poland
Development of competitive economy is strictly connected with developing and implementing new inventions, utility models and industrial designs, as well as trademarks. These values should be protected but the protection cannot limit the market functioning nor the research and development activities.In the current finance perspective of the EU, for 2014-2020, entrepreneurs will be main beneficiaries of EU aid programmes and their role in building knowledge-based economy will systematically increase its significance. In 2014, entrepreneurs increased the share of its own funds in financing R+D by 19%, up to 47% of total expenses on R+D in Poland.
The level of innovation may be analysed on the basis of various measures. One of the basic indicators of innova-tion level is the number of patent applications and received patents.
A dynamic growth in the number of patent applications to the UPRP (Patent Office of the Republic of Poland) has been observed since 2008 in Poland. According to the data of the World Intellectual Property Organisation (WIPO), Poland is currently listed on 17th place globally with regards to the number of national patent applications, and on 15th place regarding the total number of granted patents7.
Since 2008, the systematic growth in the number of patent applications to the Patent Office of the Republic of Poland by domestic entities is also visible (an increase from 2 392 in 2007 to 3 941 in 2014)8. Also, the number of patents granted by the UPRP to Polish entities increases – in 2010 there were 1385 patents granted and 449 protection rights to utility models, while in 2014 this value amounted respectively to 2490 and 586.
Main statistical data on patenting in Poland▪ 20 126 - the number of inventions, utility models and industrial designs submitted in 2014 under the national
procedure;▪ 14 566 - the number of patents, protection rights and registration rights for industrial ownership granted in
2014 under the national procedure;▪ 205 068 – the number of exclusive rights to industrial ownership valid in Poland as of 31 December 20149; ▪ 10 626 – the number of rights from industrial designs valid in Poland (as of 31 December 2014).
6 Ibid.7 Annual Report 2014, UPRP, 2015.8 Ibid.9 Ibid.

7
Graph 2. Inventions and utility models applications filled in the UPRP by Polish entities under the national and international procedure in 2010-2014.
Source: Annual Report 2014, UPRP, 2015.
Graph 3. Inventions and utility models applications filled in the UPRP by foreign entities under the national and international procedure in 2010-2014.
Source: Annual Report 2014, UPRP, 2015.
– 7 –
• 10 626 – the number of rights from industrial designs valid in Poland (as of 31
December 2014).
Graph 2. Inventions and utility models applications filled in the UPRP by Polish entities under the national and international procedure in 2010-2014.
Source: Annual Report 2014, UPRP, 2015. Graph 3. Inventions and utility models applications filled in the UPRP by foreign entities under the national and international procedure in 2010-2014.
Source: Annual Report 2014, UPRP, 2015.
3203
3878 4410 4237
3941
879 940 941 986 913
0
1000
2000
3000
4000
5000
2010 2011 2012 2013 2014 Patent applications filled by domestic entities Utility model applications filled by domestic entities
227 245 247
174 155
66 63 56 67 48
0
50
100
150
200
250
300
2010 2011 2012 2013 2014
Patent applications filled by foreign entities
Utility model applications filled by foreign entities

8
Graph 4. Inventions and utility models applications filled in the UPRP by Polish entities under the national and international procedure by submitting entities.
Source: Annual Report 2014, UPRP, 2015.
Graph 5. Inventions and utility models applications filled in the UPRP by Polish entities under the national and international procedure by the divisions of the International Patent Classification.
Source: Annual Report 2014, UPRP, 2015.
Graph 6. Inventions and utility models applications filled in the UPRP by foreign entities under the national and international procedure by the divisions of the International Patent Classification.
Source: Annual Report 2014, UPRP, 2015.
– 8 –
Graph 4. Inventions and utility models applications filled in the UPRP by Polish entities under the national and international procedure by submitting entities.
Source: Annual Report 2014, UPRP, 2015. Graph 5. Inventions and utility models applications filled in the UPRP by Polish entities under the national and international procedure by the divisions of the International Patent Classification.
Source: Annual Report 2014, UPRP, 2015.
45%
29%
13%
2% 11%
Business entities
Higher education institutions
Natural persons
Polish Academy of Sciences scientific units
Research centres
13%
14%
16%
1%
9% 10%
8%
5%
24%
Human necessities
Various industrial processes; transport Chemistry; metallurgy
Textiles; paper
Civil engineering; mining;
Mechanical engineering; lighting; heating; weapons; blasting Physics
Electrical engineering
Other
– 9 –
Graph 6. Inventions and utility models applications filled in the UPRP by foreign entities under the national and international procedure by the divisions of the International Patent Classification.
Source: Annual Report 2014, UPRP, 2015. Table 2. TOP 10 Polish entities with the largest number of inventions and utility models applications filled in the UPRP by Polish entities under the national and international procedure in 2014.
Subject Number of inventions
Wrocław University of Technology 153
West Pomeranian University of Technology in Szczecin 114
AGH University of Science and Technology in Kraków 93
Wrocław University of Environmental and Life Sciences 74
Łódź University of Technology 70
Lublin University of Technology 68
Silesian University of Technology 66
Warsaw University of Technology 75
Gdańsk University of Technology 54
T. Kościuszko University of Technology in Kraków 44 Source: Annual Report 2014, UPRP, 2015.
14%
13%
10%
0%
22%
19%
8% 9% 5%
Human necessities
Various industrial processes; transport
Chemistry; metallurgy
Textiles; paper
Civil engineering; mining;
Mechanical engineering; lighting; heating; weapons; blasting Physics
Electrical engineering
Other

9
Table 2. TOP 10 Polish entities with the largest number of inventions and utility models applications filled in the UPRP by Polish entities under the national and international procedure in 2014.
Source: Annual Report 2014, UPRP, 2015.
Graph 7. Patents and protection rights for utility models granted by the UPRP to Polish entities in 2010-2014.
Source: Annual Report 2014, UPRP, 2015.
Subject Number of inventions
Wrocław University of Technology 153
West Pomeranian University of Technology in Szczecin 114
AGH University of Science and Technology in Kraków 93
Wrocław University of Environmental and Life Sciences 74
Łódź University of Technology 70
Lublin University of Technology 68
Silesian University of Technology 66
Warsaw University of Technology 75
Gdańsk University of Technology 54
T. Kościuszko University of Technology in Kraków 44
– 10 –
1619
1123
636 465 362
35 26 38 33 34 0
200 400 600 800
1000 1200 1400 1600 1800
2010 2011 2012 2013 2014
Patents granted to foreign entities
Rights of protection for utility models granted to foreign entities
Graph 7. Patents and protection rights for utility models granted by the UPRP to Polish entities in 2010- 2014.
Source: Annual Report 2014, UPRP, 2015. Graph 8. Patents and protection rights for utility models granted by the UPRP to international entities in 2010-2014.
Source: Annual Report 2014, UPRP, 2015.
1385
1989 1848
2339 2490
449 498 514 621 586
0
500
1000
1500
2000
2500
3000
2010 2011 2012 2013 2014
Patents granted to domestic entities
Rights of protection for utility models granted to domestic entities

10
Graph 8. Patents and protection rights for utility models granted by the UPRP to international entities in 2010-2014.
Source: Annual Report 2014, UPRP, 2015.
Graph 9. Inventions and utility models applications filled in the UPRP by foreign entities under the national and international procedure by countries.
Source: Annual Report 2014, UPRP, 2015.
– 10 –
1619
1123
636 465 362
35 26 38 33 34 0
200 400 600 800
1000 1200 1400 1600 1800
2010 2011 2012 2013 2014
Patents granted to foreign entities
Rights of protection for utility models granted to foreign entities
Graph 7. Patents and protection rights for utility models granted by the UPRP to Polish entities in 2010- 2014.
Source: Annual Report 2014, UPRP, 2015. Graph 8. Patents and protection rights for utility models granted by the UPRP to international entities in 2010-2014.
Source: Annual Report 2014, UPRP, 2015.
1385
1989 1848
2339 2490
449 498 514 621 586
0
500
1000
1500
2000
2500
3000
2010 2011 2012 2013 2014
Patents granted to domestic entities
Rights of protection for utility models granted to domestic entities
– 11 –
Graph 9. Inventions and utility models applications filled in the UPRP by foreign entities under the national and international procedure by countries. Source: Annual Report 2014, UPRP, 2015.
Graph 10. Patents and protection rights for utility models granted by the UPRP to international entities by countries.
Source: Annual Report 2014, UPRP, 2015.

11
Graph 10. Patents and protection rights for utility models granted by the UPRP to international entities by countries.
Source: Annual Report 2014, UPRP, 2015.
In addition, Polish companies also submit applications to the European Patent Office (EPO). In 2014, Polish enti-ties submitted 475 applications to the EPO10. But most importantly, the trend is growing. At the time of joining the EU, Polish entities filled only slightly above 100 patent application to the EPO per annum.
Graph 11. The applications submitted to the European Patent Office (EPO) by Polish entities and European pat-ents granted by the EPO to Polish entities in 2010-2014.
Source: EPO, 2015
10 Ibid.
– 11 –
Graph 9. Inventions and utility models applications filled in the UPRP by foreign entities under the national and international procedure by countries. Source: Annual Report 2014, UPRP, 2015.
Graph 10. Patents and protection rights for utility models granted by the UPRP to international entities by countries.
Source: Annual Report 2014, UPRP, 2015.
– 12 –
In addition, Polish companies also submit applications to the European Patent Office (EPO). In
2014, Polish entities submitted 475 applications to the EPO10. But most importantly, the trend is
growing. At the time of joining the EU, Polish entities filled only slightly above 100 patent
application to the EPO per annum.
Graph 11. The applications submitted to the European Patent Office (EPO) by Polish entities and European patents granted by the EPO to Polish entities in 2010-2014.
Source: EPO, 2015
While reviewing patent applications to PCT (the Patent Cooperation Treaty)11, the majority of
applications from Poland were filled by International Tobacco Machinery (10), AGH in Krakow
(8), the Jagiellonian University (8), Adamed (6), Wrocław Research Centre EIT+ (6), as well as
by the Foundry Institute (5) and the Industrial Institute of Agricultural Engineering (5)12.
Globally, these numbers are quite symbolic because e.g. Siemens makes over 1 300 patent
applications per annum.
10 Ibid. 11 The PCT is an international treaty with more than 145 Contracting States. The PCT makes it possible to seek patent protection for an invention simultaneously in a large number of countries by filing a single “international” patent application instead of filling several separate national or regional patent applications. 12 Report on Patenting Status in Poland, Crido Taxand, 2015.
163 143 175 168 251 282
343 399
525 577
701
14 15 17 27 26 33 44 45 80 95 108
0
100
200
300
400
500
600
700
800
2004 2005 2006 2007 2008 2009 2010 2011 2012 2013 2014
Applications filled with the EPO by Polish applicants
European patents granted by the EPO to Polish entities

12
While reviewing patent applications to PCT (the Patent Cooperation Treaty)11, the majority of applications from Poland were filled by International Tobacco Machinery (10), AGH in Krakow (8), the Jagiellonian University (8), Adamed (6), Wrocław Research Centre EIT+ (6), as well as by the Foundry Institute (5) and the Industrial Institute of Agricultural Engineering (5)12. Globally, these numbers are quite symbolic because e.g. Siemens makes over 1 300 patent applications per annum.
Research and Development Units in Poland
Research, development and implementation centres are created in Poland both as a result of foreign investments and investments by local companies and universities.The scientific potential of the research and development sector is based e.g. on 936 scientific units (according to the parametric evaluation performed in 2014)13.With regards to the research infrastructure, the direction of changes is indicated by the Polish Roadmap of Re-search Infrastructure prepared by the Ministry of Science and Higher Education. In 2014, 53 projects were listed there which is 20 more than in the 2011 version. The Map is the basis of investment projects with regards to strategic research infrastructure and it aims at increasing the innovativeness of Polish economy through scientific research with active participation of enterprises. In 2014, category A+ was assigned to 45 scientific institutions in Poland, i.e. by 8 units more than in the previous year14.
As mentioned above, the expenditures on research and development works in the public and private sector in Poland amounted to a total of 0.94% of the GDP in 2014 (including the private sector expenditures – 0.38%, the governmental expenditures – 0.23%, expenditures by universities – 0.25%). In comparison, the average in the European Union was 2.01% of the GDP in 2014.
Importantly, a constant growth in internal expenditures on R+D has been observed since 2004 and in 2010-2014 the value increased by 64%15 and in 2014 it amounted to PLN 16.2 billion. This was the highest growth observed among Visegrad countries16 . Moreover, 80% of entrepreneurs intend to increase their outlays on R+D in short or medium term17.
Table 3. Expenditure on R+D in Poland.
Source: The CRIDO Study based on GUS data.
Against past years this indicates certain increase in the R+D expenditures, however, these expenditures are sig-nificantly below the 2020 objective which is 1.7%.
11 The PCT is an international treaty with more than 145 Contracting States. The PCT makes it possible to seek patent protection for an invention simultaneously in a large number of countries by filing a single “international” patent application instead of filling several separate national or regional patent applications.12 Report on Patenting Status in Poland, Crido Taxand, 2015.13 COMMUNICATION OF THE MINSITER OF SCIENCE AND HIGHER EDUCTATION of 4 July 2014 on scientific categories assigned to scientific institu-tions. 14 The R+D centres in the category A+ the Ministry of Science and Higher Education are the centres offering the highest standard in terms of scientific research work and research and development activities with the highest potential and prestige with regards to the levels of performed research and development works.15 Research and Development Activities in Poland in 2014, GUS, 2015. 16 Ibid. 17 Profitability of Investing in Research and Development, NCBiR, PwC, 2015.
Indicator 2011 2012 2013 2014 Objective 2020
GERD, Gross Domestic Expenditure on R&D 0,77 0,89 0,87 0,94 1,7
Business Expenditures on R&D 0,23 0,33 0,38 n/a 0.6-0.8

13
Also, an increase of the entrepreneurs’ share in the total investment expenditures is expected. This rate may signif-icantly grow in the upcoming years mainly through the stimulating programmes offered by the Polish government. The suggested solutions include, e.g. the use of the NBP for introducing the LTRO (Long Term Refinancing Op-eration) mechanism applicable to commercial banks offering low interest loans to companies wanting to develop their business.
Research and Development in Sectors
Internal expenditures on R+D include two main categories – current expenditures and capital expenditures on fixed assets used in the R+D activities. In 2014, the value of current expenditures grew against 2014 (by 10.3%) and the same applies to the capital expenditure in fixed assets (the growth by 17.9%)18.
In 2013, the highest internal expenditures on R+D were made in engineering and technical sciences – PLN 7.6 bil-lion, natural science – PLN 3.1 billion and medical and health science – PLN 1.5 billion, the share of expenditures assigned to these scientific and technical disciplines in internal expenditures on R+D in total amounted to 52.9%, 21.3% and 10.5%, respectively.
Among the particular sectors, the largest amounts were spent on research and development by the IT profile enter-prises (30% of all expenditures in 2014), followed by producers of vehicles and machines (26% of expenditures). R+D activities are undertaken visibly more frequently in industry than in trade and services. Around 65% of the industry sector entities and 49% of the trade and services sector are engaged in R+D projects19.
The majority of new research and development centres are created by companies from: the industrial machines and means of transport sectors;
• the petrochemical, chemical, pharmaceutical, rubber, plastics, mineral /glass sectors;• production and supply of power, gas, water vapour, hot water;• professional scientific and technical activities;• information and communications industry.
Innovativeness in Enterprises
Innovativeness in the SME sector is ranked rather high. According to the Polish Agency for Enterprise Develop-ment (PARP), over 60% of Polish enterprises have implemented innovations over the last three years. Taking into account the scale of implemented innovations, business innovations have the majority at 38%, with 16.6% rate of innovations at the national level, and 8% globally20.
The most popular innovations implemented in 1/3 micro enterprises were product innovations. Process innova-tions were implemented in every fifth enterprise. The least popular were organisational innovations (13.6%)21.
The Market Potential of R&D Works
According to the research by PwC and the National Centre for Research and Development no less than 41% of new products introduced to the Polish market in 2014 resulted from R+D works, a significant increase against 2013 when the rate amounted to 30%. This indicates large effectiveness of implemented research and development works as well as their effective commercialisation.
18 Research and Development Activities in Poland in 2014, GUS, 2015.19 KPMG. 20 PAED, Innovative Entrepreneurship in Poland. 21 Ibid.
14
The electric and electronic production sectors were the most active ones in implementing new products with its traders introducing 18 new products on average. As indicated by the analyses performed on data from the British market, the profitability of R+D investments amounts to 20-30% return rate on the expenditures incurred22.
Foreign Investments into R+D Activities
Increasing interest in setting up R+D centres has been observed over the recent years both in the manufacturing industry (for instance: Delphi in Kraków and Rockwell Automation in Katowice), as well as in the business services sector. According to the information from the Polish Information and Foreign Investment Agency (PAIiIZ), over 659 centres were created out of which around 73 are R+D centres. In addition, R+D processes in the described sector have already provided employment to 15.3 thousand people, while the average employment in a single enterprise equals to 209 employees.
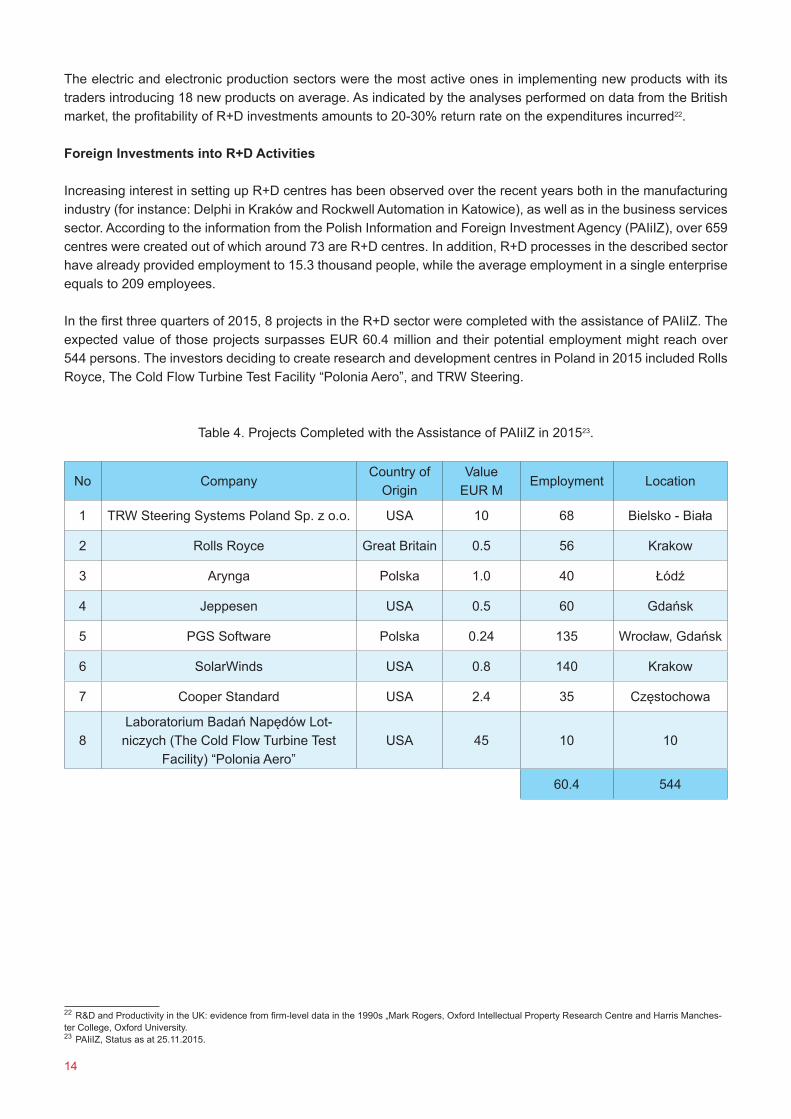
In the first three quarters of 2015, 8 projects in the R+D sector were completed with the assistance of PAIiIZ. The expected value of those projects surpasses EUR 60.4 million and their potential employment might reach over 544 persons. The investors deciding to create research and development centres in Poland in 2015 included Rolls Royce, The Cold Flow Turbine Test Facility “Polonia Aero”, and TRW Steering.
Table 4. Projects Completed with the Assistance of PAIiIZ in 201523.
22 R&D and Productivity in the UK: evidence from firm-level data in the 1990s „Mark Rogers, Oxford Intellectual Property Research Centre and Harris Manches-ter College, Oxford University.23 PAIiIZ, Status as at 25.11.2015.
No CompanyCountry of
OriginValue
EUR MEmployment Location
1 TRW Steering Systems Poland Sp. z o.o. USA 10 68 Bielsko - Biała
2 Rolls Royce Great Britain 0.5 56 Krakow
3 Arynga Polska 1.0 40 Łódź
4 Jeppesen USA 0.5 60 Gdańsk
5 PGS Software Polska 0.24 135 Wrocław, Gdańsk
6 SolarWinds USA 0.8 140 Krakow
7 Cooper Standard USA 2.4 35 Częstochowa
8Laboratorium Badań Napędów Lot-niczych (The Cold Flow Turbine Test
Facility) “Polonia Aero”USA 45 10 10
60.4 544

15
Map: Chosen Research & Development Investments in Poland
Source: Crido Taxand, 2014
Incentives Offer to the R+D Sector
The forthcoming years will bring a wide range of programmes, both national and European, stimulating increase in the level of innovativeness in Poland. Available incentives will allow a financial stimulus throughout the complex process of innovation: from the initial research activities, through prototype, to implementation and commerciali-sation of the results.
The main institution supporting the growth of the R+D sector is supposedly the National Centre for Research and Development (NCRD). A basic source of finance shall be the Smart Development Operational Programme, financed from the European Fund for Regional Development. Additionally, each voivodship manages a Regional Operational Programme.Large variety of financial sources and support mechanisms (grants, loans, tax exemptions) guarantee, that each enterprise will be able to obtain a necessary funding for its innovation-driven activities.
Horizontal aid is aid granted to among others for research, development and innovation activities. This is a support aimed at specific objectives, whose intensity and application are not restricted to an exact region or region, within which a beneficiary operates. Regional aid is related to investment projects, including R+D infrastructure improvement. Its intensity is deter-mined by certain factors such as the location of the investment project, and its maximum level is determined by the regional aid map.
– 17 –
Map: Chosen Research & Development Investments in Poland
Source: Crido Taxand, 2014
Incentives Offer to the R+D Sector
The forthcoming years will bring a wide range of programmes, both national and European,
stimulating increase in the level of innovativeness in Poland. Available incentives will allow a
financial stimulus throughout the complex process of innovation: from the initial research
activities, through prototype, to implementation and commercialisation of the results.
The main institution supporting the growth of the R+D sector is supposedly the National Centre
for Research and Development (NCRD). A basic source of finance shall be the Smart
Development Operational Programme, financed from the European Fund for Regional
Development. Additionally, each voivodship manages a Regional Operational Programme.
Large variety of financial sources and support mechanisms (grants, loans, tax exemptions)
guarantee, that each enterprise will be able to obtain a necessary funding for its innovation-
driven activities.
.

16
Table 5: Selected sources of financial support for R+D+I
Government Grants – investors planning to commence their operations in the R+D sector may apply for the gov-ernment grants, both for investment grants and for employment grants. In order to apply for an investment grant, a company must employ at least 35 people, with the capital expenditures of at least PLN 10 million. On the other hand, the grant for creating new jobs requires the employment of at least 35 people and the capital expenditures of at least PLN 1 million.
From 1st July 2014, there is a new regional Aid Map in operation in Poland for years 2014-2020. In accordance with the Map, basic maximum aid intensity of regional state aid, that is a percentage share of aid to the costs eli-gible for the aid, is presented in the following map
Research stage supportImplementation of the
R+D results
Setting up/enlargement of the research and de-velopment centre (RDC)
Horizontal aid Smart Growth: Axis I: R+D projects including Fast Track (1.1.1. SG OP),▪ Industrial research and development work implemented by enterprises (1.1.2 SG OP), and sectoral R+D programmes (1.2. SG OP)▪ SG OP: Axis IV▪ Sub-measure 4.1.4.▪ ROP: R+D projects▪ Strategic programmes NCBiR (Strategmed, Biostrateg, Techmatrateg) – at the research stage
Regional aid ▪ SG OP: Axis III: Supporting innovations within enterprises/imple-menting the R+D results▪ Eastern Poland OP: Implementing the innovations by SME’s/implementing the results of R+D▪ ROP: Implementing the R+D results▪ SEZ
▪ SG OP: Activity 2.1. Sup-porting enterprises’ R+D infrastructure investments▪ Activity 4.2. Developing modern research infrastructure of the science sector▪ ROP: Setting up/enlarge-ment RDC▪ Governmental grants▪ SEZ
OTHER ▪ Horizon 2020: SME’s instrument. Fast track for innovations
▪ SG OP: • Bridge Alfa and Bridge Venture Capital • Supporting the development of open
innovations • Support for the industrial intellectual
rights of enterprises • Innovation vouchers for SMEs▪ Axis IV: Increasing the R+D potential▪ Technology tax relief▪ Strategic programmes NCBiR (Strategmed,
Biostrateg, Techmastrateg) – pre-commer-cialization stage
▪ GO_GLOBAL.PL

17
A new regional aid Map for 2014 - 2020
Source: PAIiIZ.
Venture capital and private equity funds; business angels networksVenture capital (VC) funds offer capital support to small but already successful businesses (undertakings on early stage of development are subject to the interest of business angels and seed funding).
For instance, ARP Venture is one of the companies within the Capital Group of the Industrial Development Agen-cy. It has been established in connection to the implementation of the new strategy whose goal is to increase the innovativeness of Polish economy and enhance technology transfer to the industry. ARP Venture uses the “smart money” model and invests in projects with high market potential, whose development will positively influence na-tional or regional economy.
ARP Venture operates in the industry sector of SME’s and invests in innovative projects in the phase of developing mass production and in the product expansion phase.
Another example is AIP Seed Capital, with 104 successful investments in start-ups on early stage. AIP Seed Capital is a seed funding company operating with the Academic Enterprise Incubators network and Business Ling from July 2009. The strategy of AIP Seed Capital concentrates on supporting start-ups in the innovative sectors, including: IT, ICT, biotechnology, chemistry, medicine, renewable energy sources and environment protection.
Business Angels Network – one of the best examples of traditional businesses in which a business angel in-vested is “W biegu Cafe” – a coffee shop chain opening in the largest towns. Polisdea, a company specialising in services including developing applications and transferring content to mobile devices is the second example of an investment by business angels in a company operating in the modern technologies sector. The company was establish in mid 2009 as a result of investments by two Business Angels: Tomasz Grzybowski and Krzysztof Gawrysiak who invested less than PLN 100 thousand in this business. In return, they subscribed 40% shares in the Network.The next form of financing of business with good prospects is financing through New Connect at the GPW (War-saw Stock Exchange) – this is a stock exchange platform for young, dynamic companies, interested in the first listing on the stock exchange but failing to meet the high criteria of entering the main market of the Warsaw Stock Exchange. The fact that the Polish capital market very much needed such platform is evidenced by the number of 131 companies quoted there only three years from its establishing.
– 20 –
A new regional aid Map for 2014 - 202025
Source: PAIiIZ.
Venture capital and private equity funds; business angels networks
Venture capital (VC) funds offer capital support to small but already successful businesses
(undertakings on early stage of development are subject to the interest of business angels
and seed funding).
For instance, ARP Venture is one of the companies within the Capital Group of the Industrial
Development Agency. It has been established in connection to the implementation of the
new strategy whose goal is to increase the innovativeness of Polish economy and enhance
technology transfer to the industry. ARP Venture uses the “smart money” model and invests in
projects with high market potential, whose development will positively influence national or
regional economy.
ARP Venture operates in the industry sector of SME’s and invests in innovative projects in the
phase of developing mass production and in the product expansion phase.
Another example is AIP Seed Capital, with 104 successful investments in start-ups on early
stage. AIP Seed Capital is a seed funding company operating with the Academic Enterprise
Incubators network and Business Ling from July 2009. The strategy of AIP Seed Capital
concentrates on supporting start-ups in the innovative sectors, including: IT, ICT,
biotechnology, chemistry, medicine, renewable energy sources and environment protection.
25 For more information see: www.paiz.gov.pl/strefa_inwestora/zachety_inwestycyjne_w_sse#.

18
Selected Innovation Supporting Institutions
The National Centre for Research and Development is the executive agency of the Minister of Science and Higher Education, implementing the tasks within national policies of science, research and development and in-novation. It is the mediation institution in three operational programmes: Human Capital, Innovative Economy and Infrastructure and Environment, as well as one of the greatest innovation centres in Poland.
The Information Processing Centre – the National Research Institute gathers and provides access to the current and comprehensive Polish science information. It performs research regarding operations of scientific institutions, universities and organisations supporting transfer of technologies.
The GreenEvo Program – Green Technology Accelerator is an innovative project of Ministry of Environment ear-marked for the Polish entrepreneurs. The Program is designated for Polish SMEs operating in the environment friendly technologies sector. Its participants may notify about their new solutions in 8 categories, e.g. renewable energy sources, technologies supporting climate protection, low-emission transport technologies and many others.
The Innovation Centre of the Chief Technical Organisation – since 2005 it has organised contests for subsidies for targeted projects for SMEs on the basis of an agreement with the Minister of Science and Higher Education, under which it will subsidise industrial research and development works aiming at the implementation of a product and/or technology. 933 agreements for subsidy of targeted projects had been concluded until 2013 with their total value of PLN 641 870 024.
Science and technology parks – created in order to promote the local and regional economy by supporting entrepreneurship, innovation and transfer of technologies. They help in creating new enterprises and support the development of the existing SMEs. As a result of the performed verification of science and technology parks activ-ities in 2014, the activity of 42 parks was established.


www.paiz.gov.plwww.paiz.gov.pl
Polish Information and Foreign Investment Agencyul. Bagatela 12, 00-585 Warsaw
Tel.: 00 48 22 334 98 75E-mail: [email protected]
Warsaw, 2015 ISBN: 978-83-63371-23-4
This publication has been financed by the Ministry of Economy of the Republic of Poland