Embed Size (px)
Citation preview
Louisiana State UniversityLSU Digital Commons
LSU Master's Theses Graduate School
2014
Sediment patterns in relation to vegetativecommunity shifts at Catahoula Lake, LouisianaKaren Doerr LatusoLouisiana State University and Agricultural and Mechanical College, [email protected]
Follow this and additional works at: https://digitalcommons.lsu.edu/gradschool_theses
Part of the Environmental Sciences Commons
This Thesis is brought to you for free and open access by the Graduate School at LSU Digital Commons. It has been accepted for inclusion in LSUMaster's Theses by an authorized graduate school editor of LSU Digital Commons. For more information, please contact [email protected].
Recommended CitationLatuso, Karen Doerr, "Sediment patterns in relation to vegetative community shifts at Catahoula Lake, Louisiana" (2014). LSUMaster's Theses. 4189.https://digitalcommons.lsu.edu/gradschool_theses/4189
SEDIMENT PATTERNS IN RELATION TO VEGETATIVE COMMUNITY
SHIFTS AT CATAHOULA LAKE, LOUISIANA
A Thesis
Submitted to the Graduate Faculty of the
Louisiana State University and
Agricultural and Mechanical College
in partial fulfillment of the
requirements for the degree of
Master of Science
in
The School of Renewable Natural Resources
by
Karen Doerr Latuso
A.A., Florida State College at Jacksonville, 1997
B.S., University of Florida, 2001
May 2014

ii
Acknowledgements
First and foremost, I want to thank my adviser, Dr. Richard Keim, for his guidance and
support during this process. None of this would have been possible without him, and I am
eternally grateful to him for the opportunity to change my path. I’m really glad I sent you that
email a few years ago when I thought I might go back to school.
To my other three committee members — Dr. David Weindorf, Dr. Sammy King and Dr.
Maud Walsh — thank you for taking me under your wings as a student. I really appreciate your
assistance, guidance and shared resources. I couldn’t have picked a better committee.
I also greatly appreciate the assistance from Louisiana Department of Wildlife and
Fisheries, particularly Steve Smith, and Larry Reynolds.
For his insight and guidance and for paving the way at Catahoula Lake, I want to thank
Frank Willis.
For his technical assistance and advice, many thanks go to Dr. Ronald DeLaune of LSU
School of the Coast and Environment. Thanks also go to Thomas Blanchard, LSU School of the
Coast and Environment Analytical Services manager, for use of his lab and his assistance with
CHN analysis. I also want to thank Dr. Syam Dodla in the Central Analytical Instruments
Research Laboratory for his assistance with ICP data.
To my wonderful, understanding and patient husband, Steven: Thank you for all you
have done and just for being who you are. Going through this experience with you by my side
has been a little easier than it was alone, and I love you for that.
My mom, dad and brother, John, also have been an integral part of this process, helping
me work in the soil lab and listening patiently over many telephone calls as I wrung my hands

iii
over all the excruciating details. Also, as I write this, John has been accepted to nursing school. I
am so very proud of you, little brother.
I also want to thank my new family members — Markaye, Larry, Lori, Ryan and Kayla
Latuso — for sending food, taking care of me and being supportive.
Special thanks go to all my fellow graduate students in Renewable Natural Resources and
Soil Morphology: April Newman, Yu-Hsin Hsueh, Erin Johnson, Lincoln Dugué, Sanjeev Joshi
and Noura Bakr. For going above and beyond the call of duty and coming to the field with me,
extra special thanks go to Wes Cochran, Drew Fowler, Scott Allen and Brandon Edwards. I want
to give special thanks to Samantha Swanhart for being my soil buddy, fellow Gator and all-
around sweetheart. Special thanks also goes to Dr. Mike Kaller for his help with statistics,
printing posters, and all the other nice things you do for any student who wanders by your office
looking lost. And I want to thank Maggie Whitsell and Clay Lovelace for their time and effort in
drying, grinding and sieving 500 soil samples.
I have to give a hearty thank you to my Advocate family, who supported me knowing
that it meant their lives would be more difficult and that I eventually would leave. You are
amazing people, and I always will cheer for you. Thanks to John Ballance, Mike Dunlap, Karin
Devendorf and all the photographers, editors and writers I worked with. To Carl Redman:
Thanks for believing in me and cheering me on.
Finally, I want to thank my support group of friends outside of LSU — especially Mandy
Hay, Julie Bennett, Christy Futch, Kay Gervais and Beth Colvin. Thanks for the support, ladies.
iv
Table of Contents
Acknowledgements…………………………………………………………………………..........ii
Abstract……..………………………..…..…………………………………………………….… v
Chapter 1. Introduction ……..………………………………………………………….…….…... 1
Chapter 2. Rates, and Patterns of Woody Expansion at Catahoula Lake, Louisiana….……....…. 6
Chapter 3. Sediment Deposition Amounts and Rates at Catahoula Lake, Louisiana ……..….…. 22
Chapter 4. Sediment Chemistry at Catahoula Lake, Louisiana ……...………………….….…… 36
Chapter 5. Conclusions ………………………..……..…………….....…………………….…... 63
Appendix A. Particle size fractions with depth by profile …………...……...….......................... 71
Appendix B. Linear regressions between PXRF and ICP elemental concentration data ……..... 74
Appendix C. Photographs of individual profiles ……………………………………………….. 76
Vita ………………………………………………………………………………………….….. 79
v
Abstract
The processes that control species composition and structure in wetland ecosystems are
complex and controlled by many factors including seasonality, depth and duration of flooding,
and nutrient dynamics. Catahoula Lake is a floodplain lake that has existed with seasonally
fluctuating water levels for at least 4,000 years. The herbaceous vegetation that attracts these
waterfowl is slowly being outcompeted by woody vegetation, most notably water-elm (Planera
aquatica). Our general goal is to understand the processes that cause this shift, focusing on the
role of sediments. Our first objective was to use historical aerial imagery to detect historical
changes in plant communities at Catahoula Lake, focusing on timing and rates of expansion of
woody vegetation. Aerial imagery indicated woody vegetation has been encroaching into the
lake bed and the rate of this expansion has increased 249% since major hydrologic alterations in
the 1960s. There are three local patterns to this expansion: continuous expansion of woody
vegetation, long-term stability of the tree line, and complex patterns of tree establishment.
Second, we used 137Cs in lakebed sediments to calculate rates of sedimentation. Results indicated
sedimentation was 0.26 cm yr-1, which is increased 225% from the pre-settlement rate of 0.08 cm
yr-1. Peaks of 137Cs were muted and deposition rates were similar around the lake, suggesting
redistribution of sediments is common. Third, we investigated elemental concentrations in
sediment which revealed little spatial variation in recent sediment, but a shift from mixed
coastal-plain and Mississippi Alluvial Valley sediments to dominance by acidic, coastal-plain
sediments in the past ~60 yr. Sediments are low in organic matter, and carbon and nitrogen
concentrations decrease with depth and are being sequestered at low rates (840 t yr-1 and 120 t
yr-1, respectively). Compared to its condition prior to hydrologic alterations beginning in the
1920s, Catahoula Lake is about 15 cm shallower and the chemical composition of sediments is

vi
more acidic. Although these results are not sufficient to link these differences directly to
ecological changes, it is likely the altered sedimentary and hydrologic environment is
contributing to the increased dominance of woody vegetation.
1
Chapter 1. Introduction
The processes that control species composition and structure in wetland ecosystems are
complex and include seasonality (Nilsson, Svedmark 2002), depth, and duration of flooding
(Casanova, Brock 2000); nutrient dynamics (Bedford et al 1999); and other sediment chemistry.
Catahoula Lake near Alexandria, Louisiana has remained a seasonally inundated lake for about
4,000 years (Tedford 2009) and has been experiencing an advancing front of woody, terrestrial
vegetation into the lake bed for at least the last 60 years. It has become increasingly important to
understand the processes that determine where the tree line ends and the more diverse
herbaceous vegetation begins as important waterfowl habitat is lost. Processes controlling this
expansion of woody vegetation are largely unknown but sedimentation may be playing a role
(Shafroth et al 2002, Reisinger et al 2013). Anthropogenic alterations to watersheds including
dam construction, levees, water control structures, and conversion of wetlands to agricultural
lands through draining alter hydrology and sediment loads, threatening many of these
ecosystems. (Toner, Keddy 1997; Nilsson, Berggren 2014). For example, more than 400,000 ha
of Wisconsin wetlands are dominated by reed canarygrass (Phalaris arundinacea) due in large
part to increased sediment input from erosion of agricultural lands filling in and flattening the
heterogeneous topography of tussock sedge meadows (Zedler, Kercher 2004).
Catahoula Lake is a seasonally inundated lake where water levels fluctuate annually
about 6 meters and the flooded area of the lake varies by about 90%, resulting in an herbaceous
community of moist-soil plants that serves as high energy food for migrating waterfowl. The
habitat for shore birds and waterfowl at Catahoula Lake is so important that it has been
designated internationally as a wetland of importance under the Ramsar treaty (Gardner,
Connolly 2007). However, decreases in herbaceous vegetation in response to expansion of
2
several woody species into the lake bed have concerned managers for decades (Wills 1965,
Bruser 1995, Lotz 1996, Willis 2007, Tedford 2009.)
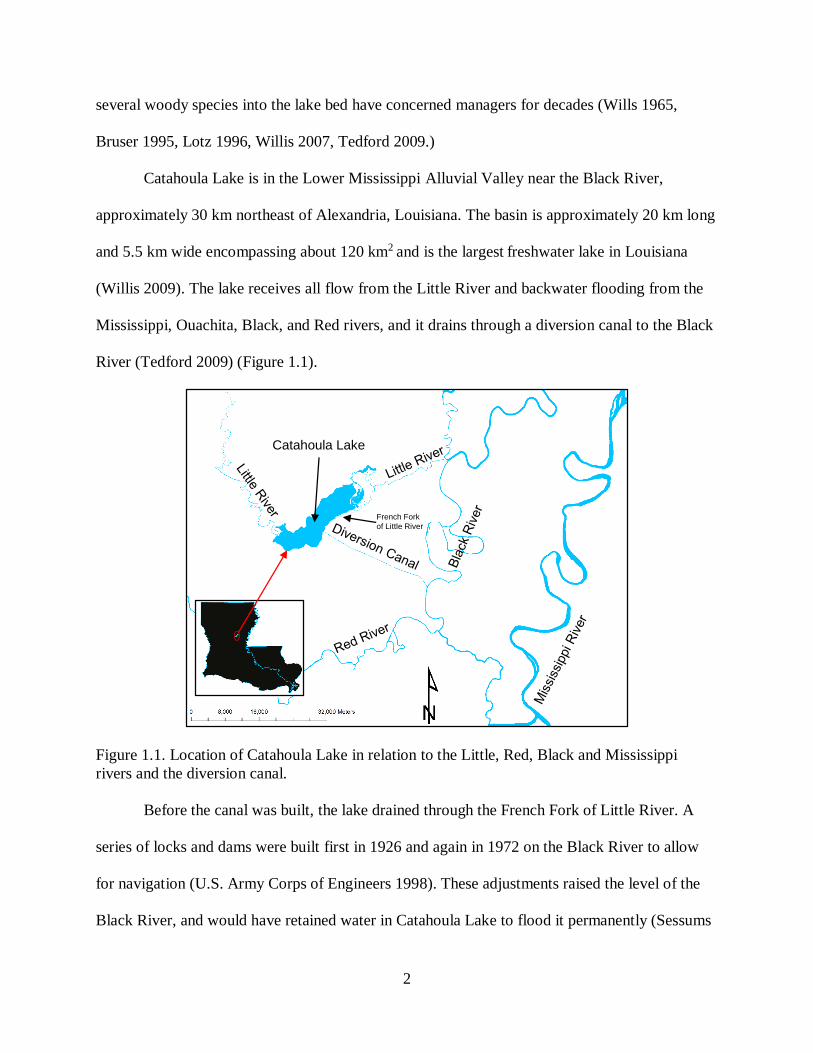
Catahoula Lake is in the Lower Mississippi Alluvial Valley near the Black River,
approximately 30 km northeast of Alexandria, Louisiana. The basin is approximately 20 km long
and 5.5 km wide encompassing about 120 km2 and is the largest freshwater lake in Louisiana
(Willis 2009). The lake receives all flow from the Little River and backwater flooding from the
Mississippi, Ouachita, Black, and Red rivers, and it drains through a diversion canal to the Black
River (Tedford 2009) (Figure 1.1).
Figure 1.1. Location of Catahoula Lake in relation to the Little, Red, Black and Mississippi
rivers and the diversion canal.
Before the canal was built, the lake drained through the French Fork of Little River. A
series of locks and dams were built first in 1926 and again in 1972 on the Black River to allow
for navigation (U.S. Army Corps of Engineers 1998). These adjustments raised the level of the
Black River, and would have retained water in Catahoula Lake to flood it permanently (Sessums
Catahoula Lake
French Fork
of Little River
3
1954). To prevent this and mimic the natural, seasonal drawdown, the Corps of Engineers built
the diversion canal to the Black River (U.S. Army Corps of Engineers 1998). Today water is
managed through opening and closing a check dam on the Little River near Archie and through
opening and closing the water control structure on the diversion canal.
The highly variable water levels at Catahoula Lake have been known for a long time.
Dunbar reported in his findings from the expedition of the lower Louisiana Purchase that the lake
experienced a dry season from July to November with the exception of the Little River channel
(Jefferson 1806). Brown (1943) mentioned lake levels experiencing seasonal variation of more
than 7.6 meters (25 feet). Tedford (2009) found that fluctuating water levels have been occurring
at least since 4,000 BP. When flooded from November to June, the lake encompasses about 80
km2 and acts as a limnetic system. In July the lake begins to drain until October, leaving most of
the bed dry with a shallow permanent pool of about 8 km2. Today this fluctuation is managed in
a manner that attempts to mimic the natural fluctuations pre-alteration.
Woody vegetation has been expanding into the lake since at least 1952 and the causes are
not well understood. Water-elm (Planera aquatica) and swamp-privet (Forestiera acuminata)
are the main woody species expanding into the bed of the lake. They outcompete important
waterfowl food sources, most notably chufa (Cyperus esculentus), Walter’s millet (Echinochloa
walteri), and sprangletop (Leptochloa fascicularis).
Vegetative communities at Catahoula Lake are at least partially controlled by depth,
duration of flooding and hydrologic regime (Brown 1943, Wills 1965, Bruser 1995). Brown
(1943) and Wills (1965) described the correlation between lake levels and vegetative
communities. Bruser’s (1995) post-modification study found that decreases in variability of lake
levels between August and November may be driving the decrease in herbaceous vegetation.
4
Amount and composition of lakebed sediments may affect vegetative communities.
Sedimentation from outside sources is believed to be low (Wills 1965; Peters, Afton 1993), but
previous sediment studies (Meriwether 2007, Tedford 2009) have been inconclusive in regards to
recent changes in sedimentation. Increased sediment would lead to a decrease in depth and
duration of flooding by changing the topography. Excessive sediment could bury seeds and
prevent germination of some plant species (Gleason et al 2003). A change in sediment texture or
nutrients could change competitive dynamics among species (Hillel 2004, Havlin et al 2005).
Our overall objective is to better understand the processes that cause vegetation shifts at
this complicated, floodplain lake. We have three specific objectives to accomplish this. First, we
use historical aerial imagery to quantify historical changes in plant communities at Catahoula
Lake, focusing on timing and rates of expansion of woody vegetation. Second, we use 137Cs
concentration in sediments to determine rate of recent sedimentation. Third, we investigate
sediment composition with emphasis on particle size and elemental concentration to determine
whether sediment sources and depositional patterns may have changed recently.
References – Chapter 1.
Brown, C. A., 1943, Vegetation and lake level correlations at Catahoula Lake, Louisiana: The
Geographical review, v. 33, p. 435-445.
Bruser, J. F., 1995, Ecology of Catahoula Lake Plant Communities in Relation to an
Anthropogenic Water Regime, Louisiana State University, Baton Rouge.
Gardner, R., Connolly, K.D., 2007, The Ramsar Convention on Wetlands: Assessment of
International Designations Within the United States: Environmental Law Reviewer ELR
10089, ed. 2, v. 37, p. 1-25.
Gleason, R., Euliss, N., Hubbard, D., Duffy, W., 2003, Effects of Sediment Load on Emergence
of Aquatic Invertebrates and Plants from Wetland Soil Egg and Seed Banks: Wetlands, v.
23, p. 26-34.
Havlin, J., Beaton, J.D., Tisdale, S.L., Nelson, W.L, 2005, Soil Fertility and Fertilizers: An
Introduction to Nutrient Management, Seventh Edition, Pearson Education Inc.
5
Hillel, D., 2004, Introduction to Environmental Soil Physics, Elsevier Academic Press.
Jefferson, T., 1806, Message from the President of the United States, Communicating
Discoveries Made in Exploring the Missouri, Red River, and Washita, by Captains Lewis
and Clark, Doctor Sibley, and Mr. Dunbar; with a Statistical Account of the Countries
Adjacent, New York: Printed by Hopkins and Seymour, 1806,
www.americanjourneys.org/aj-090/.
Lotz, B.A., 2000, Growth Rates of Water-elm and Swamp-Privet at Catahoula Lake, Louisiana,
Louisiana State University, Baton Rouge.
Meriwether, J.R., 2007, Cesium Core Study at Catahoula Lake, Report to U.S. Geological
Survey, National Wetlands Research Center. Unpublished data.
Peters, M. S. Afton, A.D., 1993, Effects of deep tillage on redistribution of lead shot and chufa
flatsedge at Catahoula Lake, Louisiana: Wildlife Society Bulletin, v. 21, p. 471-479.
Reisinger, A.J., Blair, J.M., Rice, C.W., Dodds, W.K., 2013, Woody Vegetation Removal
Stimulates Riparian and Benthic Denitrification in Tallgrass Prairie: Ecosystems, v. 16, p.
547-560.
Sessums, R. T., 1954, Catahoula Lake area report, presented to Governor Robert F. Kennon and
the Louisiana Legislature in compliance with Act no. 598, 1952 Legislature, p. 84.
Shafroth, P.B., Friedman, J.M., Auble, G.T., Scott, M.L., Braatne, J.H., 2002, Potential
Responses of Riparian Vegetation to Dam Removal: BioScience, v. 52, p. 703 – 712.
Tedford, R. A., 2009, A multi-proxy approach to investigating the latest Holocene (~4,500 yrs.
BP) vegetational history of Catahoula Lake, Louisiana, Louisiana State University, Baton
Rouge, La.
U.S. Army Corps of Engineers. 1998. Water Resources Development in Louisiana. Saucier, M.H
ed., U.S. Army Corps of Engineers New Orleans District. 177p.
Willis, F. L., 2009, A Multidisciplinary Approach for Determining the Extents of the Beds of
Complex Natural Lakes in Louisiana, University of New Orleans, New Orleans.
Wills, D.W., 1963, An investigation of some factors affecting waterfowl and waterfowl habitat
on Catahoula Lake, Louisiana, Louisiana State University, Baton Rouge.
6
Chapter 2. Rates, and Patterns of Woody Expansion at Catahoula Lake, Louisiana
Introduction
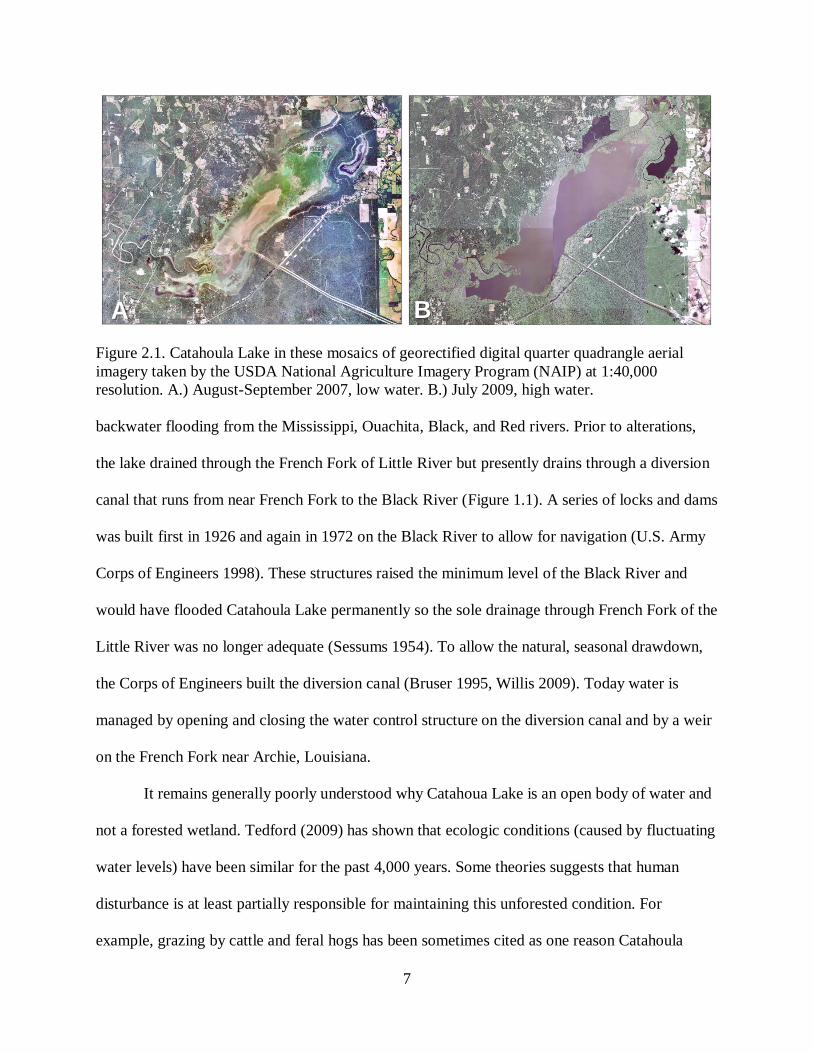
Catahoula Lake, near Alexandria, Louisiana, is a backswamp lake in the Lower
Mississippi Alluvial Valley that is experiencing a shift in vegetation. It is seasonally inundated
and palustrine over much of its basin but with a permanent pool in the center. Lake levels
fluctuate about 6 m each year, going almost completely dry beginning in July to about November
(USGS 2002). This annual variation promotes growth of wetland plants like sprangletop
(Leptochloa fascicularis), Walter’s millet (Echinochloa walteri) and chufa (Cyperus esculentus),
which are sources of carbohydrates for wintering waterfowl and migratory birds using the lake as
a stop along their route (Reinecke et al. 1989; Woolington, Emfinger 1989; Peters, Afton 1993).
For several decades the lake has been experiencing a shift from these herbaceous plants toward
woody vegetation, especially water-elm (Planera aquatica) and swamp-privet (Forestiera
acuminata).
The variability of Catahoula Lake water levels has been long known. Tedford (2009)
found that lake water levels have been fluctuating at least since 4,000 BP. Dunbar reported in his
findings from the expedition of the lower Louisiana Purchase that the lake experienced a dry
season from July to November with the exception of the Little River channel (Jefferson 1806).
Brown (1943) mentioned lake levels experiencing seasonal variation of more than 25 feet (7.6
meters). When flooded from November to June, the lake encompasses about 80 km2 and acts as a
limnetic system (See B in Figure 2.1). In July the lake begins to drain until October, leaving most
of the bed dry with a shallow permanent pool (See A in Figure 2.1) of about 8 km2.
Hydrologic alterations to Catahoula Lake and the surrounding rivers have been occurring
since at least the early 1920s. Catahoula Lake receives inputs from the Little River and
7
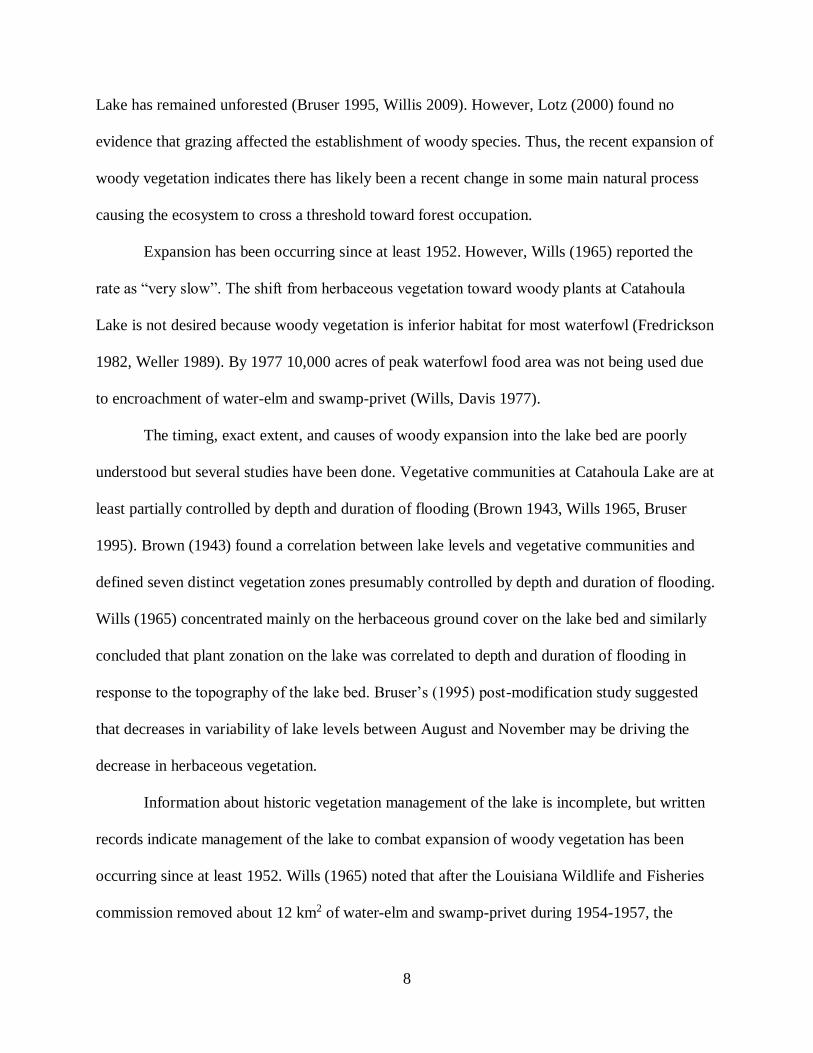
Figure 2.1. Catahoula Lake in these mosaics of georectified digital quarter quadrangle aerial
imagery taken by the USDA National Agriculture Imagery Program (NAIP) at 1:40,000
resolution. A.) August-September 2007, low water. B.) July 2009, high water.
backwater flooding from the Mississippi, Ouachita, Black, and Red rivers. Prior to alterations,
the lake drained through the French Fork of Little River but presently drains through a diversion
canal that runs from near French Fork to the Black River (Figure 1.1). A series of locks and dams
was built first in 1926 and again in 1972 on the Black River to allow for navigation (U.S. Army
Corps of Engineers 1998). These structures raised the minimum level of the Black River and
would have flooded Catahoula Lake permanently so the sole drainage through French Fork of the
Little River was no longer adequate (Sessums 1954). To allow the natural, seasonal drawdown,
the Corps of Engineers built the diversion canal (Bruser 1995, Willis 2009). Today water is
managed by opening and closing the water control structure on the diversion canal and by a weir
on the French Fork near Archie, Louisiana.
It remains generally poorly understood why Catahoua Lake is an open body of water and
not a forested wetland. Tedford (2009) has shown that ecologic conditions (caused by fluctuating
water levels) have been similar for the past 4,000 years. Some theories suggests that human
disturbance is at least partially responsible for maintaining this unforested condition. For
example, grazing by cattle and feral hogs has been sometimes cited as one reason Catahoula
A B
8
Lake has remained unforested (Bruser 1995, Willis 2009). However, Lotz (2000) found no
evidence that grazing affected the establishment of woody species. Thus, the recent expansion of
woody vegetation indicates there has likely been a recent change in some main natural process
causing the ecosystem to cross a threshold toward forest occupation.
Expansion has been occurring since at least 1952. However, Wills (1965) reported the
rate as “very slow”. The shift from herbaceous vegetation toward woody plants at Catahoula
Lake is not desired because woody vegetation is inferior habitat for most waterfowl (Fredrickson
1982, Weller 1989). By 1977 10,000 acres of peak waterfowl food area was not being used due
to encroachment of water-elm and swamp-privet (Wills, Davis 1977).
The timing, exact extent, and causes of woody expansion into the lake bed are poorly
understood but several studies have been done. Vegetative communities at Catahoula Lake are at
least partially controlled by depth and duration of flooding (Brown 1943, Wills 1965, Bruser
1995). Brown (1943) found a correlation between lake levels and vegetative communities and
defined seven distinct vegetation zones presumably controlled by depth and duration of flooding.
Wills (1965) concentrated mainly on the herbaceous ground cover on the lake bed and similarly
concluded that plant zonation on the lake was correlated to depth and duration of flooding in
response to the topography of the lake bed. Bruser’s (1995) post-modification study suggested
that decreases in variability of lake levels between August and November may be driving the
decrease in herbaceous vegetation.
Information about historic vegetation management of the lake is incomplete, but written
records indicate management of the lake to combat expansion of woody vegetation has been
occurring since at least 1952. Wills (1965) noted that after the Louisiana Wildlife and Fisheries
commission removed about 12 km2 of water-elm and swamp-privet during 1954-1957, the
9
species was very slow to re-invade. This launched an aggressive campaign to remove the woody
vegetation that continued through the late 1970s. Joshi (2012) discovered about 73% of the
water-elm sampled were established after the canal was built in 1972. However the oldest trees
were 131 years old, pre-dating any hydrologic changes to the lake. Today managers use mowing,
burning, and herbicide to eliminate young water-elm and swamp-privet on the bed of the lake.
These techniques are both costly and inefficient.
Improved understanding of the timing and extent of historic expansion of woody
vegetation is needed to better understand the reasons for expansion and to design appropriate
management. The objective of this research is to quantify the amount, rate, and location of
woody expansion into the lake and better understand patterns of expansion. To do this, we used
aerial imagery in combination with tree ages obtained from tree rings by Joshi (2012).
Methods
We examined U.S.D.A. aerial imagery from 1940 (See A in Figure 2.2), 1966 (See B in
Figure 2.2) and 2007 (See A in Figure 2.1) and Wills’ (1965) map of plant types (See C in Figure
2.2) to quantify the extent and amount of expansion of woody vegetation. Imagery was selected
by considering time of year, age, resolution, and water level. We scanned the 1940 and 1966
imagery and imported it into ARCMap 9.3.1 where it was georeferenced to the 2007 USDA
imagery from the National Agriculture Imagery Program (NAIP). The imagery was then rectified
to the Universal Transverse Mercator (UTM) coordinate system and mosaicked using ERDAS
Imagine 2010. To establish our area of interest, we also scanned and georeferenced Wills’ (1965)
vegetation map and delineated the outer boundary as the outer extent of the water-elm and
swamp-privet zone. We analyzed the aerial imagery from 1940, 1966 and 2007 using air photo
interpretation and ARCMap. We used the density classifications by Paine (1981) to delineate
10
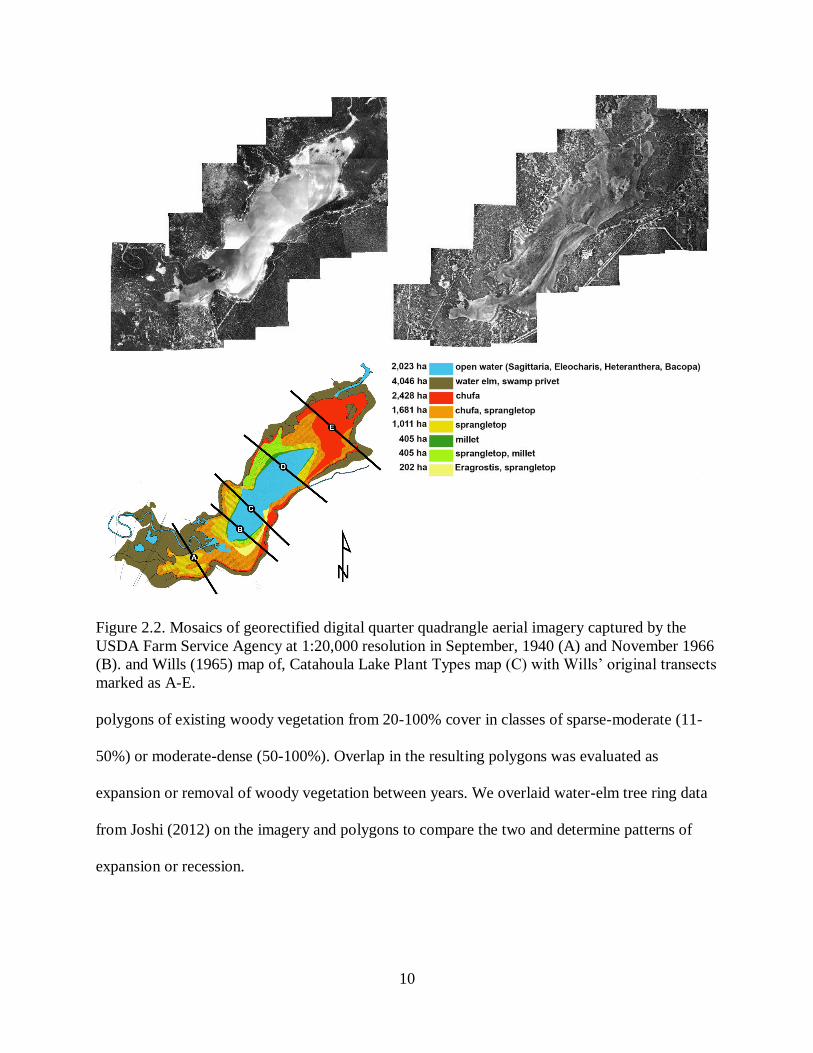
Figure 2.2. Mosaics of georectified digital quarter quadrangle aerial imagery captured by the
USDA Farm Service Agency at 1:20,000 resolution in September, 1940 (A) and November 1966
(B). and Wills (1965) map of, Catahoula Lake Plant Types map (C) with Wills’ original transects
marked as A-E.
polygons of existing woody vegetation from 20-100% cover in classes of sparse-moderate (11-
50%) or moderate-dense (50-100%). Overlap in the resulting polygons was evaluated as
expansion or removal of woody vegetation between years. We overlaid water-elm tree ring data
from Joshi (2012) on the imagery and polygons to compare the two and determine patterns of
expansion or recession.
C
open water (sagittaria, eleocharis, heteranthera, bacopa)
water elm, swamp privet
chufa
chufa, sprangletop
sprangletop
millet
sprangletop, millet
eragrostis, sprangletop
2,023 ha
4,046 ha
2,428 ha
1,681 ha
1,011 ha
405 ha
405 ha
202 ha
11
Results
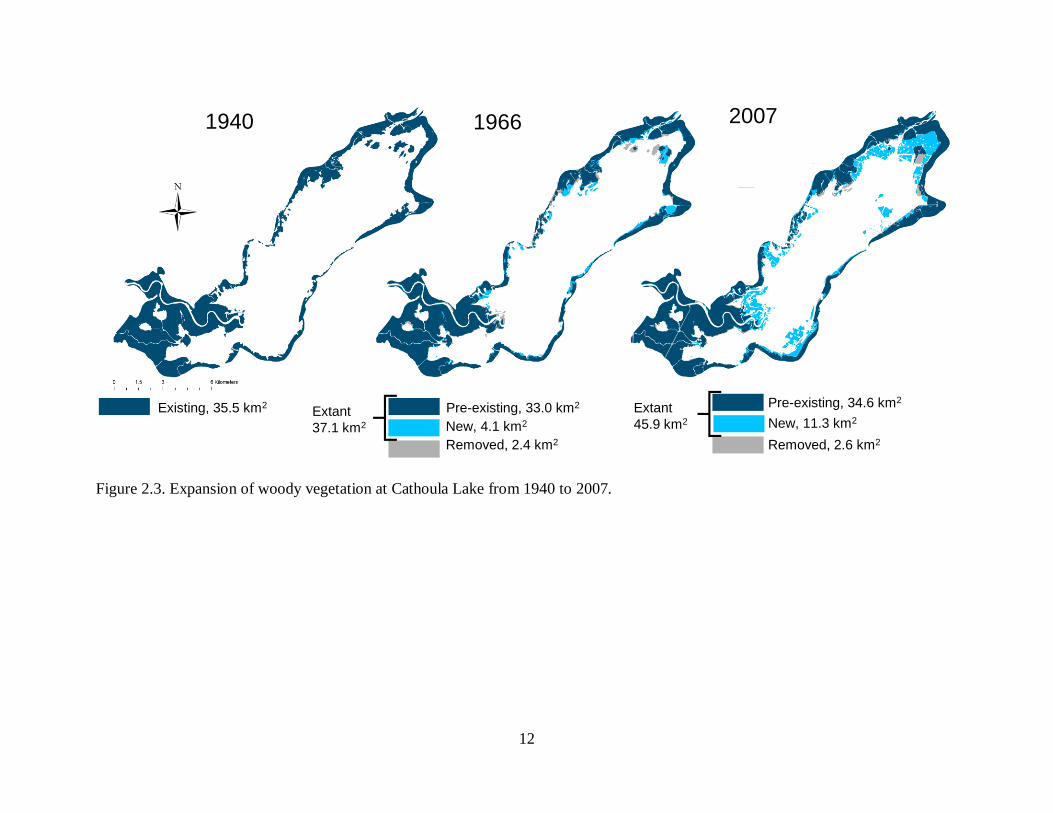
Aerial imagery indicated woody vegetation is expanding into the lakebed and the rate of
expansion has increased since 1966. Between 1940 and 1966 about 1.6 km2 of woody expansion
occurred, which is 0.17% of formerly-herbaceous lakebed per year. Between 1966 and 2007 the
coverage by woody plants increased 8.8 km2, or 0.58% per year. Between 1940 and 2007 the
lake experienced expansion of 10.4 km2, or 29.3% overall.
In 1940 there was a total of 35.5 km2 of woody vegetation in the water-elm zone, which
was 29.1% of the lake bed (Figure 2.3). The 1966 imagery showed 33.0 km2 of pre-existing
woody vegetation indicating removal of 2.4 km2. In addition 4.l km2 of new woody vegetation
expanded into the lake between 1940 and 1966.
In 1966 there was a total of 37.1 km2 of woody vegetation in the water-elm zone, which
was 30.4% of the lake bed (Figure 2.3). The 2007 imagery showed 34.6 km2 of pre-existing
woody vegetation indicating removal of 2.6 km2. In addition 11.3 km2 of new woody vegetation
expanded into the lake between 1966 and 2007. In 2007 there was a total of 45.9 km2 of woody
vegetation in the water-elm zone, which was 37.6% of the lake bed.
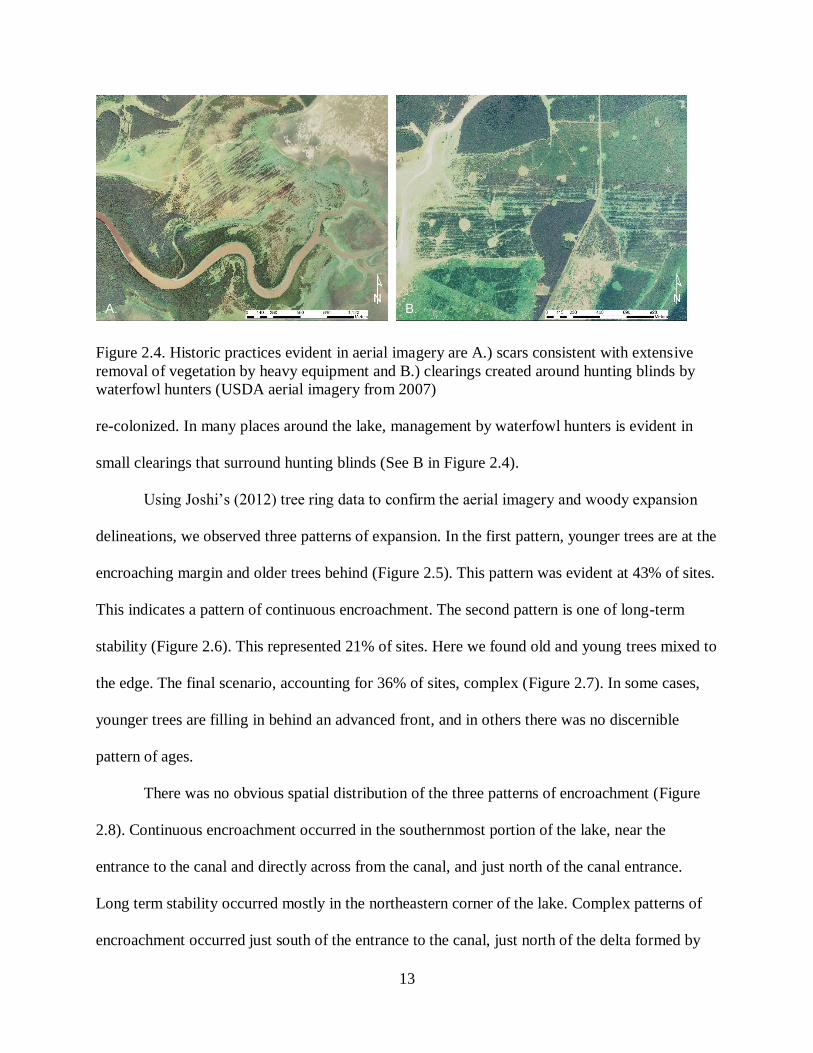
Some historic practices to remove woody vegetation are evident in aerial images of the
water-elm zone. Removals have been concentrated in three places: the northeast end of the lake,
south of the diversion canal and the delta of Little River. A large portion of the isolated group of
trees that existed in the northeast portion of the lake in 1966 has been removed, contributing the
most to the 2.6 km2 of removed woody vegetation. In the southwestern part of the lake, north of
the entrance of the Little River, are scars consistent with extensive removal of vegetation by
heavy equipment (See A in Figure 2.4). These practices likely occurred in the 1950s-1970s and
are reflected in the 1966 imagery. Subsequent to removal, this location is not becoming
12
Figure 2.3. Expansion of woody vegetation at Cathoula Lake from 1940 to 2007.
200719661940
Pre-existing, 34.6 km2
New, 11.3 km2
Removed, 2.6 km2
Pre-existing, 33.0 km2
New, 4.1 km2
Removed, 2.4 km2
Existing, 35.5 km2Extant
37.1 km2
Extant
45.9 km2
13
Figure 2.4. Historic practices evident in aerial imagery are A.) scars consistent with extensive
removal of vegetation by heavy equipment and B.) clearings created around hunting blinds by
waterfowl hunters (USDA aerial imagery from 2007)
re-colonized. In many places around the lake, management by waterfowl hunters is evident in
small clearings that surround hunting blinds (See B in Figure 2.4).
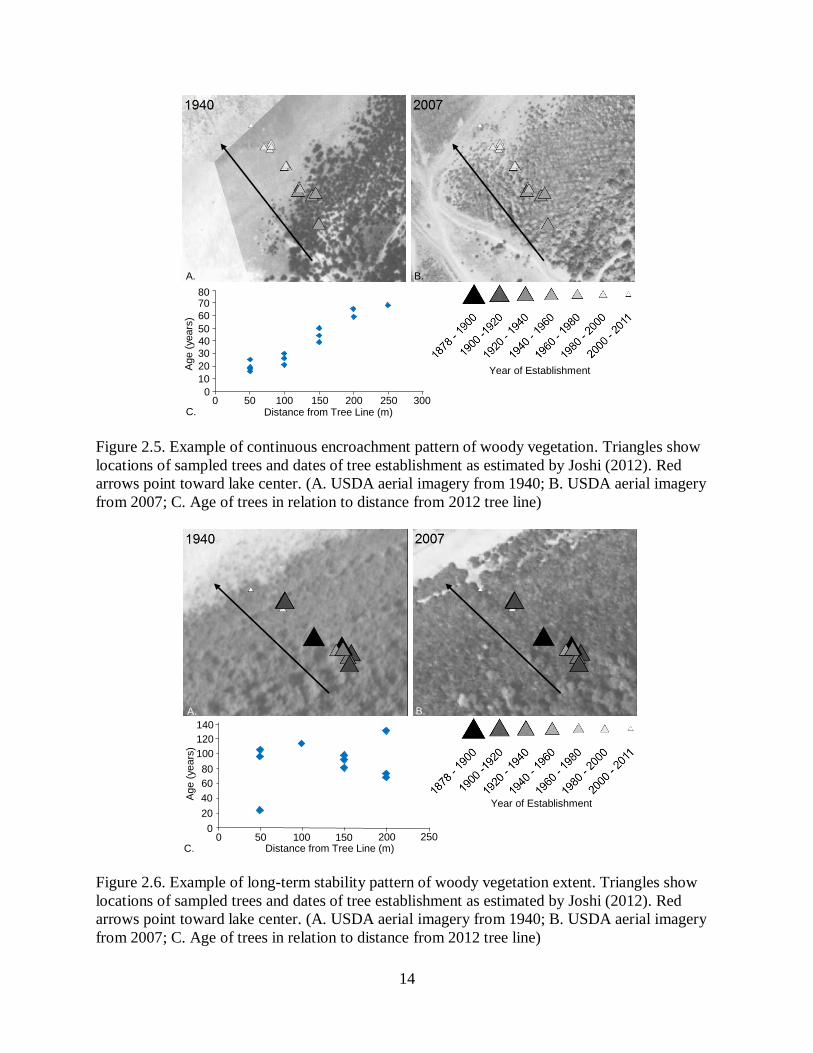
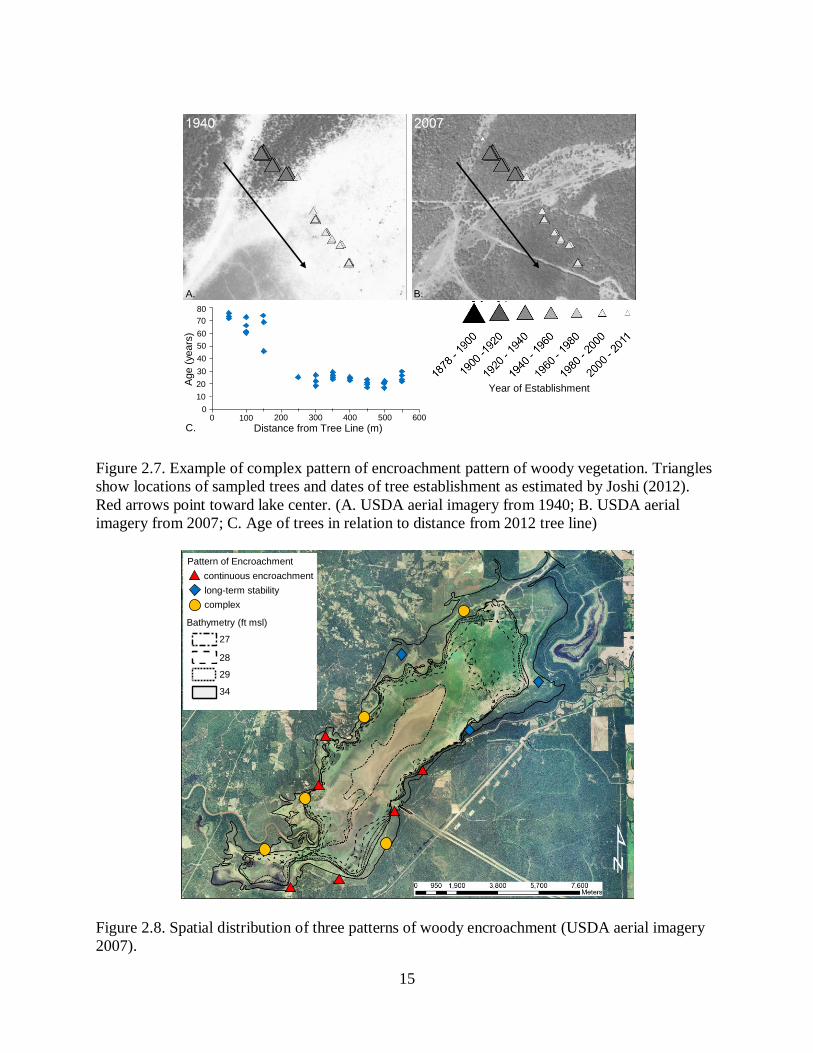
Using Joshi’s (2012) tree ring data to confirm the aerial imagery and woody expansion
delineations, we observed three patterns of expansion. In the first pattern, younger trees are at the
encroaching margin and older trees behind (Figure 2.5). This pattern was evident at 43% of sites.
This indicates a pattern of continuous encroachment. The second pattern is one of long-term
stability (Figure 2.6). This represented 21% of sites. Here we found old and young trees mixed to
the edge. The final scenario, accounting for 36% of sites, complex (Figure 2.7). In some cases,
younger trees are filling in behind an advanced front, and in others there was no discernible
pattern of ages.
There was no obvious spatial distribution of the three patterns of encroachment (Figure
2.8). Continuous encroachment occurred in the southernmost portion of the lake, near the
entrance to the canal and directly across from the canal, and just north of the canal entrance.
Long term stability occurred mostly in the northeastern corner of the lake. Complex patterns of
encroachment occurred just south of the entrance to the canal, just north of the delta formed by
A. B.
14
Figure 2.5. Example of continuous encroachment pattern of woody vegetation. Triangles show
locations of sampled trees and dates of tree establishment as estimated by Joshi (2012). Red
arrows point toward lake center. (A. USDA aerial imagery from 1940; B. USDA aerial imagery
from 2007; C. Age of trees in relation to distance from 2012 tree line)
Figure 2.6. Example of long-term stability pattern of woody vegetation extent. Triangles show
locations of sampled trees and dates of tree establishment as estimated by Joshi (2012). Red
arrows point toward lake center. (A. USDA aerial imagery from 1940; B. USDA aerial imagery
from 2007; C. Age of trees in relation to distance from 2012 tree line)
Distance from Tree Line (m)
Year of Establishment
#*
1878
- 19
00
#*
1900
-192
0
#*
1920
- 19
40
#*
1940
- 19
60
#*
1960
- 19
80
#*
1980
- 20
00
#*
2000
- 20
11
8070
60
50
40
30
20
10
00 50 100 150 200 250 300
Age (
years
)
A. B.
Year of Establishment
C.
Year of Establishment
#*
1878
- 19
00
#*
1900
-192
0
#*
1920
- 19
40
#*
1940
- 19
60
#*
1960
- 19
80
#*
1980
- 20
00
#*
2000
- 20
11
A. B.
140
120
100
80
60
40
20
00 50 100 150 200 250
Age (
years
)
Distance from Tree Line (m)
Year of Establishment
C.
15
Figure 2.7. Example of complex pattern of encroachment pattern of woody vegetation. Triangles
show locations of sampled trees and dates of tree establishment as estimated by Joshi (2012).
Red arrows point toward lake center. (A. USDA aerial imagery from 1940; B. USDA aerial
imagery from 2007; C. Age of trees in relation to distance from 2012 tree line)
Figure 2.8. Spatial distribution of three patterns of woody encroachment (USDA aerial imagery
2007).
Year of Establishment
#*
1878
- 19
00
#*
1900
-192
0
#*
1920
- 19
40
#*
1940
- 19
60
#*
1960
- 19
80
#*
1980
- 20
00
#*
2000
- 20
11
80
A.
Year of Establishment
B.
70
60
50
40
30
20
10
00 100 200 300
Age (
years
)
Distance from Tree Line (m)400 500 600
C.
continuous encroachment
long-term stability
complexCatLake_Bathymetry
Elevation
27
27.5
28
28.5
29
29.5
34
CatLake_Bathymetry
Elevation
27
27.5
28
28.5
29
29.5
34
CatLake_Bathymetry
Elevation
27
27.5
28
28.5
29
29.5
34
CatLake_Bathymetry
Elevation
27
27.5
28
28.5
29
29.5
34
27
28
29
34
Bathymetry (ft msl)
Pattern of Encroachment
16
encroachment occurred just south of the entrance to the canal, just north of the delta formed by
the entrance of Little River, and at the northern end of the lake on the north side of the lake.
Discussion
The paucity of quality aerial imagery obtained at low water conditions affected estimates
of the extent of tree cover. Because most of the aerial imagery available was
collected by the USDA during the early growing season, it was difficult to find imagery of the
lake bed at low water (in the fall). The aerial imagery from 1940 was the earliest, highest quality,
complete imagery we found prior to construction of the canal. However, water levels were higher
than ideal for delineation.
The high water in the 1940 imagery means that small trees are not visible beneath the
water. Therefore estimates of the extent of woody vegetation from this imagery are low. The
effect of this bias is to decrease the estimated rate of woody vegetation expansion in the 1940-
1966 period, which would be consistent with Wills (1965) statement that the rate of expansion
was “low.” Thus, while we estimated the rate of expansion from 1966-2007 was ~2.5 times that
of the 1940-1966 period, it is likely the real rate of increase was higher. Our estimates of the rate
of expansion of woody plants into the bed of Catahoula Lake are lower than the simple rate of
colonization because of extensive and aggressive control efforts. In addition to institutional
programs, informal clearings are evidence of widespread efforts by hunters to modify vegetation
conditions.
Bruser (1995) concluded that water-elm expansion increased as a result changed variation
of fall water levels after the construction of the diversion canal. Our results between 1940 and
1966 demonstrate that expansion of woody vegetation was occurring before the canal was added.
17
The three patterns of encroachment we discerned could be indicative of processes
occurring at the lake. Gradual, constant encroachment could be evidence of change like sediment
deposition. Ongoing sediment deposition could be causing steadily decreasing depth and
duration of flooding. Long-term stability suggests the opposite: no change is ocurring. Stability
may also signify that changes are occurring that prohibit tree seedling establishment, but not
survival of existing tress. Water-elm seedlings are not as tolerant of changes to depth or duration
of flooding in the growing season or canopy density as established trees (Rayner 1976).
Expansion that is more chaotic may be caused by widespread, lake-wide changes toward
conditions that favor establishment, but with stochastic and episodic failure and success of
cohorts that interact with minor disturbances. One of these minor disturbances may be wave
action, which could be disturbing seedlings and preventing establishment. Another may be
localized inputs of chemically different sediments.
Spatial distribution of the three patterns of encroachment indicate more stability at the
north end of the lake than the south end (Figure 2.8) but management efforts may be masking the
actual encroachment. A pattern of stability suggests no change is ocurring to drive encroachment
or changes are ocurring that prohibit seedling establishment, however there is a long history of
removal of water-elm and swamp-privet in this area. This is evidenced by scarring in the USDA
aerial imagery from 1966 and known management attempts by the Louisiana Department of
Wildlife and Fisheries (personal communication, Steve Smith, Larry Reynolds, LDWF, 2012).
The majority of continuous encroachment patterns are located near the diversion canal
and the input of Little River. These areas may be experiencing a seasonally constant rate of
sedimentation that is determined by the seasonal drawdown and flooding of the lakebed.
18
There are areas of complex patterns of encroachment scattered around the lake indicating
that localized disturbances are affecting expansion across the lakebed with no obvious patterns.
Several of these occur near the input of Little River where the flow may drive scour, which
affects seedling recruitment and establishment in turn. Another complex pattern occurs to the
north of the lake where the inputs of several small creeks may be responsible for similar
processes.
Elevation may also be affecting the patterns we found at each site because the sites we
analyzed were based on Joshi’s (2012) tree age data, which was most often collected at the 34
foot contour. However, the available bathymetric data does not have fine resolution and there is a
large gap in it between 29 and 34 feet.
Woody encroachment has occurred at other wetlands where anthropogenic changes have
altered hydrology. Reelfoot Lake in Tennessee has experienced expansion of woody species and
less coverage of giant cutgrass (Zizaniopsis miliacea) due to stabilized water levels (Winstead,
King 2006). In urban and suburban wetlands in several watersheds of northwestern Indiana,
encroachment of the woody species Salix spp. and Populus deltoides occurs in drained wetlands
or those with significant litter accumulation, which are both symptoms of altered hydrology
(Choi, Bury 2003).
Conclusions
Woody vegetation has been encroaching into the lake bed of Catahoula Lake and
outcompeting herbaceous vegetation. Although encroachment has been occurring for at least 80
years, the rate of expansion is faster in recent decades than it was more than 50 years ago. Why
exactly expansion is occurring is largely unknown but there are three patterns. Continuous
expansion, which suggests an ongoing process, is occurring near the major inputs and outputs of
19
the lake. Long term stability of water-elm and swamp-privet are more common in the north end
of the lake, but management attempts may be masking the real patterns of expansion there. The
rest of the lake is experiencing complex patterns of expansion that are possibly being affected by
minor, localized disturbances.
References – Chapter 2
Brown, C. A., 1943, Vegetation and lake level correlations at Catahoula Lake, Louisiana: The
Geographical review, v. 33, p. 435-445.
Bruser, J. F., 1995, Ecology of Catahoula Lake Plant Communities in Relation to an
Anthropogenic Water Regime, Louisiana State University, Baton Rouge, p. 1-100.
Choi, Y.D., Bury, C., 2003, Process of floristic degradation in urban and suburban wetlands in
Northwestern Indiana, USA: Natural Areas Journal, v. 23, p. 320-331.
De Selm, H.R., Shanks, R.E., 1967, Vegetation and Floristic Changes on a Portion of White Oak
Lake Bed: Ecology, v. 48, p. 419-425.
Fredrickson, L.H, Taylor, T.S., 1982, Management of Seasonally Flooded Impoundments for
Wildlife: U.S. Department of the Interior Fish and Wildlife Service, Resource publication
148.
Jefferson, T., 1806, Message from the President of the United States, Communicating
Discoveries Made in Exploring the Missouri, Red River, and Washita, by Captains Lewis
and Clark, Doctor Sibley, and Mr. Dunbar; with a Statistical Account of the Countries
Adjacent, New York: Printed by Hopkins and Seymour, 1806,
www.americanjourneys.org/aj-090/.
Joshi, S., 2012, Evaluation of Growth Rates and Establishment Patterns of Water-elm (Planera
Aquatica) and Baldcypress (Taxodium Distichum) in Response to Hydrologic and
Climatic Conditions at Catahoula Lake, Louisiana. Louisiana State University, Baton
Rouge, p. 1-58.
Lotz, B.A., 2000, Growth Rates of Water-elm and Swamp-Privet at Catahoula Lake, Louisiana,
Louisiana State University, Baton Rouge.
Paine, D. P., 1981, Aerial photography and image interpretation for resource management,
Wiley, New York.
20
Peters, M. S., Afton, A.D., 1993, Effects of deep tillage on redistribution of lead shot and chufa
flatsedge at Catahoula Lake, Louisiana: Wildlife Society Bulletin, v. 21, p. 471-479.
Rayner, D.A., 1976, A Monograph Concerning the Water-Elm, Planera Aquatica (Walt.) J.F.
Gmelin (Ulmaceae), University of South Carolina, Columbia, p. 1-163.
Reinecke, K.J., Kaminski, R.M., Moorhead, D.J., Hodges, J.D., Nassar, J.R., 1989, Mississippi
Alluvial Valley, in, Habitat Management for Migrating and Wintering Waterfowl in
North America, Smith, L.M., Pederson, R.L., and Kaminski, R.M., eds., Texas Tech
University Press, p. 203-247.
Russell, R.J., 1942, The Elevation of the Shore Line of Catahoula Lake, LaSalle Parish,
Louisiana, p. 40.
Sessums, R. T., 1954, Catahoula Lake area report, presented to Governor Robert F. Kennon and
the Louisiana Legislature in compliance with Act no. 598, 1952 Legislature, p. 84.
Tedford, R. A., 2009, A multi-proxy approach to investigating the latest Holocene (~4,500 yrs.
BP) vegetational history of Catahoula Lake, Louisiana, Louisiana State University, Baton
Rouge, La, p. 1-382.
U.S. Army Corps of Engineers. 1998. Water Resources Development in Louisiana. Saucier, M.H
ed., U.S. Army Corps of Engineers New Orleans District. 177p.
USGS, 2002, Modeling the bathymetry of Catahoula Lake specialized technology for wetland
management, U.S. Geological Survey Fact Sheet, U.S. Dept. of the Interior.
Weller, M.W., 1989, Plant and Water-Level Dynamics in an East Texas Shrub Hardwood
Bottomland Wetland: Wetlands, v. 9, p. 73-88.
Willis, F. L., 2009, A Multidisciplinary Approach for Determining the Extents of the Beds of
Complex Natural Lakes in Louisiana, University of New Orleans, New Orleans, p. 1-182.
Wills, D.W., 1965, An investigation of some factors affecting waterfowl and waterfowl habitat
on Catahoula Lake, Louisiana, Louisiana State University, Baton Rouge, p. 1-97.
Wills, D.W., Davis, F., The Catahoula Contract: Louisiana Conservationist, v. 29, p. 8-11.
Winstead, N.A., King, S.L., 2006, Least Bittern Distribution Among Structurally Different
Vegetation Types in Managed Wetlands of Northwest Tennessee, USA: Wetlands, v. 26,
p. 619-623.

21
Woolington, D.W., Emfinger, J.W., 1989, Trends in Canvasback Populations at Catahoula Lake,
Louisiana: Proceedings of the Annual Conference of the Southeast Association of Fish
and Wildlife Agencies, v. 43, p. 396-403.
22
Chapter 3. Sediment Deposition Amounts and Rates at Catahoula Lake, Louisiana
Introduction
Sedimentation is an important process responsible for wetland ecosystems. For example,
sediment can carry with it nutrients for plant growth, increasing productivity of the wetland
(Kummu et al 2008). Sediment burial of seeds can reduce seedling emergence (Gleason et al
2003). As sediment settles it may cover photosynthetic substrates and seed banks that may alter
plant communities by impeding photosynthesis and the re-colonization process of plants.
(Rybicki, Carter 1986, Hartleb et al. 1993, Jurik et al. 1994, Wang et al. 1994). Sedimentation
can reduce the number of species and the total number of individuals recruited from the seed
bank (Jurik et al. 1994). Increased sediment decreases depth and duration of flooding through
changing the topography of the lake bed. These changes in topography therefore indirectly affect
the length of the growing period.
The processes that control species composition and structure in wetland ecosystems are
complex and include seasonality (Nilsson, Svedmark 2002), depth, and duration of flooding
(Casanova, Brock 2000); nutrient dynamics (Bedford et al 1999); and other sediment chemistry.
Catahoula Lake near Alexandria, Louisiana has remained a seasonally inundated lake for about
4,000 years (Tedford 2009) and has been experiencing an advancing front of woody, terrestrial
vegetation into the lake bed for at least the last 60 years. It has become increasingly important to
understand the processes that determine where the tree line ends and the more diverse
herbaceous vegetation begins as important waterfowl habitat is lost. Processes controlling this
expansion of woody vegetation are largely unknown but sedimentation may be playing a role
(Shafroth et al 2002, Reisinger et al 2013). Anthropogenic alterations to watersheds including
dam construction, levees, water control structures, and conversion of wetlands to agricultural
23
lands through draining alter hydrology and sediment loads, threatening many of these
ecosystems. (Toner, Keddy 1997; Nilsson, Berggren 2014). For example, more than 400,000 ha
of Wisconsin wetlands are dominated by reed canarygrass (Phalaris arundinacea) due in large
part to increased sediment input from erosion of agricultural lands filling in and flattening the
heterogeneous topography of tussock sedge meadows (Zedler, Kercher 2004).
Current and historic sedimentation and erosion patterns are largely unknown at Catahoula
Lake but several studies have reported on the state of sediments at the lake. Russell (1942) as
reported by Willis (2009), Brown (1943), Bruser (1995), and Willis (2009), refer to
sedimentation as being negligible throughout most of the lakebed. Russell (1942), as reported by
Willis (2009), found sedimentation occurring in areas where tributaries have produced natural
levees and deltas as has occurred at Devil’s Creek and Hemphill Creek that enter the lake from
the north. Brown (1943) photographed baldcypress trees at French Fork with exposed roots
indicative of erosion of sediment that must have been higher at the time of establishment.
Tedford (2009) used 210Pb and 14C dating to estimate sedimentation rates at Catahoula Lake
increasing from ~0.02 – 0.03 cm yr-1 about 4000 ybp to ~0.14-0.48 cm yr-1 about 1800 AD-2004
and attributed this increase in sedimentation to anthropogenic impacts for the past 200 years.
There have been two previous efforts to quantify deposition rates at Catahoula Lake, but
neither is sufficient to determine whether deposition is related to recent changes in ecology.
Meriwether (2007) and Tedford (2009) both used radioisotopes to calculate sedimentation rates.
However, both studies collected profiles from near the center of the lake, which is not the
location of the woody expansion zone. They both used 137Cs, which is a fallout product deposited
over North America during nuclear testing in the 1950s and 1960s and is a useful tracer for
dating sediments in lakes and wetlands (DeLaune et al 1978; Ritchie, McHenry 1990; Callaway
24
et al 1996). Sediment accretion is determined by locating the depths in the sediment horizon
where the first significant 137Cs deposition, or peak 137Cs fallout occurred in 1954 or 1963,
respectively (Pennington 1973; Ritchie, McHenry 1990).
Our general objective is to determine whether sedimentation is an important process
controlling ecologic processes in the lake. Here, the specific objectives are to use 137Cs to
calculate the amount of sediment deposited and the rate at which it has occurred in recent
decades during the period of most rapid ecologic change, and to examine the spatial variability of
recent deposition around the lake for evidence of controlling processes.
Methods
137Cesium Analysis
We collected 14 sediment profiles to test for the presence of 137Cesium. Profiles were
sampled in the zone of expansion of water-elm, near, elevation 10.4 m (34 ft.) to a depth of 0.5
m. These depths of sampling correspond to approximately 167 years of deposition according to
sedimentation rates estimated by Tedford (2009). Profiles were collected by hammering 10 cm
diameter aluminum tubes to a depth of about 50 cm and digging them out to retrieve them. A
wooden cap was placed on top of the tube to lessen the impact of the blow and prevent
compaction (See A in Figure 3.1). After collection, rubber caps were placed on the ends of the
tubes to maintain the integrity of the samples during transport. Any extra space in tubes was
filled with plastic bags to prevent movement of the sample in the tube. For the few samples that
still became slightly compacted or disaggregated inside the pipe, we corrected later analysis by
indexing to marks made on the pipe during collection to indicate the ground surface.
In the laboratory, tubes were cut in half lengthwise with a jigsaw to remove the sample
(See B in Figure 3.1). Profiles were divided into 3 cm increments, oven-dried to 105° C,
25
weighed, and ground with a Humboldt soil grinder and disaggregated to pass an ASTM number
10 sieve.
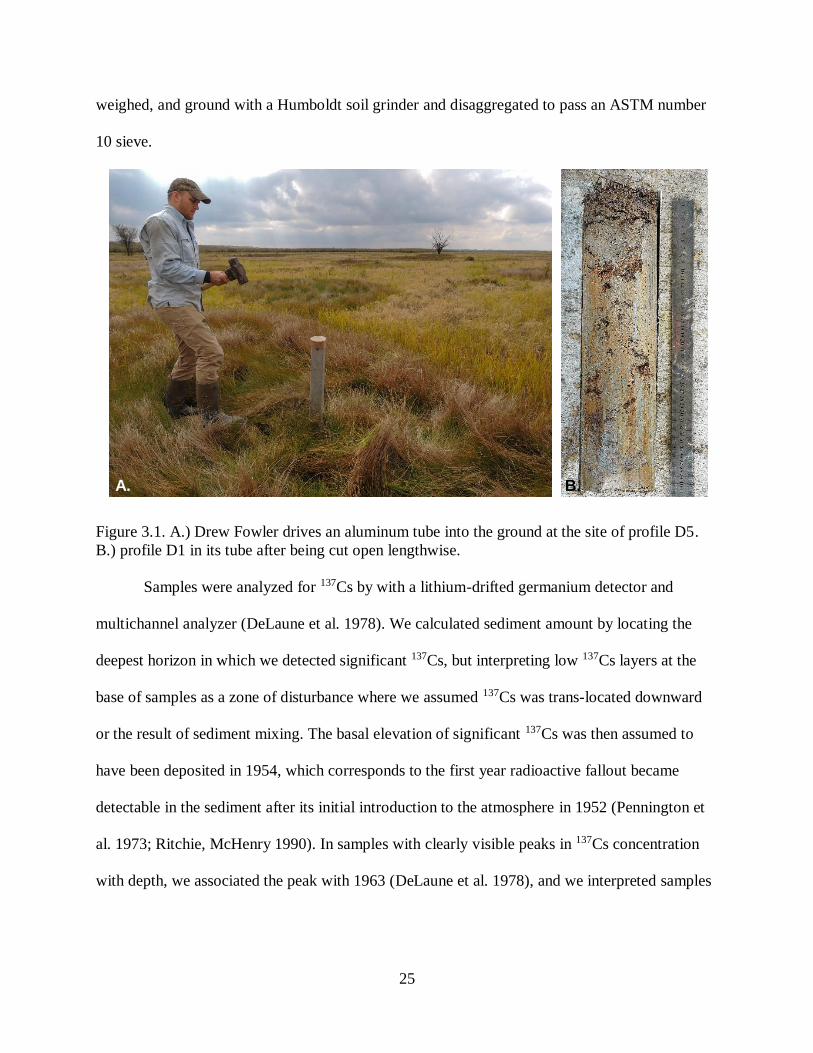
Figure 3.1. A.) Drew Fowler drives an aluminum tube into the ground at the site of profile D5.
B.) profile D1 in its tube after being cut open lengthwise.
Samples were analyzed for 137Cs by with a lithium-drifted germanium detector and
multichannel analyzer (DeLaune et al. 1978). We calculated sediment amount by locating the
deepest horizon in which we detected significant 137Cs, but interpreting low 137Cs layers at the
base of samples as a zone of disturbance where we assumed 137Cs was trans-located downward
or the result of sediment mixing. The basal elevation of significant 137Cs was then assumed to
have been deposited in 1954, which corresponds to the first year radioactive fallout became
detectable in the sediment after its initial introduction to the atmosphere in 1952 (Pennington et
al. 1973; Ritchie, McHenry 1990). In samples with clearly visible peaks in 137Cs concentration
with depth, we associated the peak with 1963 (DeLaune et al. 1978), and we interpreted samples
A. B.
26
without clear peaks as being subject to sediment mixing subsequent to deposition (Brenner and
Kenney 2013).
Particle Size Analysis
We collected 38 total sediment profiles for particle size analysis: the 13 collected to 0.5
m for 137Cs analysis, 12 profiles to a depth of 1 m collected with a Giddings Probe and later
divided into 5 cm increments, and 12 profiles collected by digging pits and cutting 5 cm portions
out of the profile. All samples were then oven-dried to 105° C, ground with a Humboldt soil
grinder and disaggregated to pass an ASTM number 10 sieve.
All samples were analyzed for particle size on a 25 g subsample using the pipette method
(Gee, Bauder 1986). We analyzed the top 15 cm of each profile for organic matter using the loss
on ignition method which removes organic matter in a subsample by combusting it in a muffle
furnace at 400°C for 16 hours. (Nelson, Sommers 1996). Organic matter in excess of 5% can
cause aggregation of clay particles that cannot be disaggregated easily during particle size
analysis (Gee, Bauder 1986), so to prevent that those samples were treated with H2O2 and heated
until effervescence no longer occurred. We added 20 ml 50 g/L sodium hexametaphosphate
(NaPO3)6 to the samples and 150 ml of water and placed them in a shaker overnight. Sand
particles were collected by washing the sample in a 53 µm sieve. The sand was then dried in an
oven at 105°C and weighed. The remaining sample was agitated in a 1000 ml graduated cylinder
and left to settle for approximately 8 hours. Next, a subsample of 25 ml was taken by pipette,
dried and weighed, and this subsample used to estimate the clay fraction.
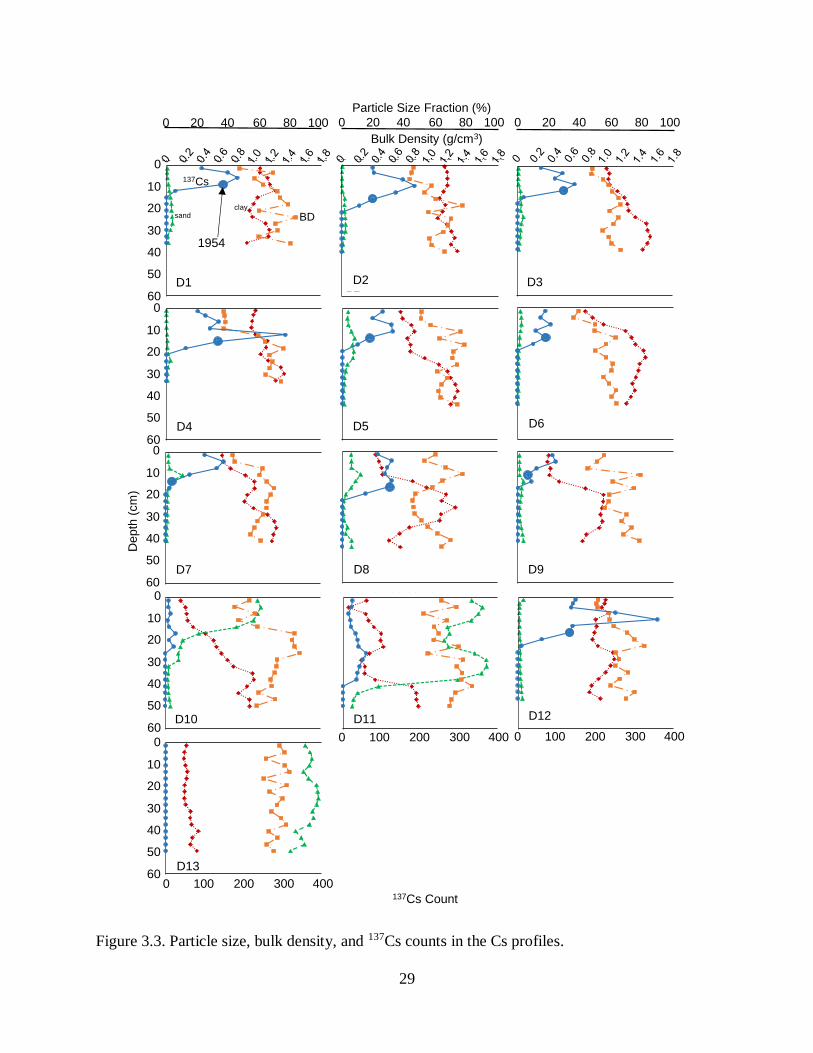
Results
Presence of 137Cs indicated 10.0-18.0 (14.8 ± 0.16) cm of sediment deposited at
Catahoula Lake between 1954 and 2012 (Table 3.1). These overall rates correspond to annual
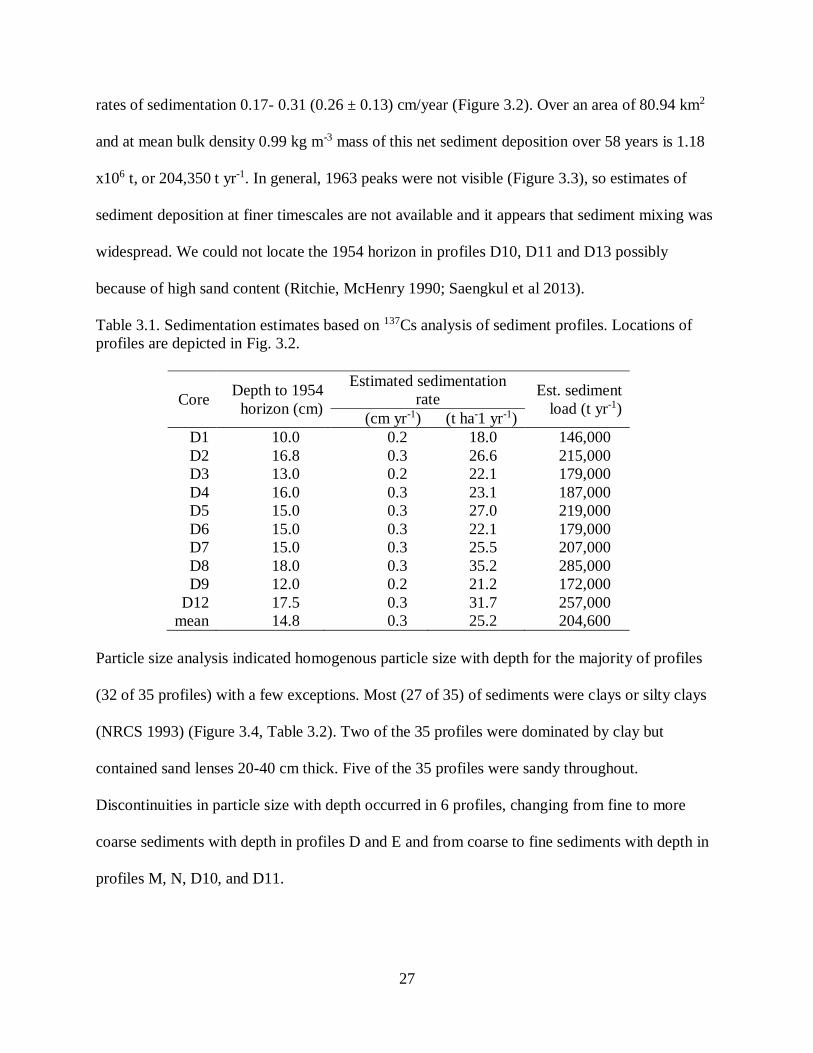
27
rates of sedimentation 0.17- 0.31 (0.26 ± 0.13) cm/year (Figure 3.2). Over an area of 80.94 km2
and at mean bulk density 0.99 kg m-3 mass of this net sediment deposition over 58 years is 1.18
x106 t, or 204,350 t yr-1. In general, 1963 peaks were not visible (Figure 3.3), so estimates of
sediment deposition at finer timescales are not available and it appears that sediment mixing was
widespread. We could not locate the 1954 horizon in profiles D10, D11 and D13 possibly
because of high sand content (Ritchie, McHenry 1990; Saengkul et al 2013).
Table 3.1. Sedimentation estimates based on 137Cs analysis of sediment profiles. Locations of
profiles are depicted in Fig. 3.2.
Core Depth to 1954
horizon (cm)
Estimated sedimentation
rate Est. sediment
load (t yr-1) (cm yr-1) (t ha-1 yr-1)
D1 10.0 0.2 18.0 146,000
D2 16.8 0.3 26.6 215,000
D3 13.0 0.2 22.1 179,000
D4 16.0 0.3 23.1 187,000
D5 15.0 0.3 27.0 219,000
D6 15.0 0.3 22.1 179,000
D7 15.0 0.3 25.5 207,000
D8 18.0 0.3 35.2 285,000
D9 12.0 0.2 21.2 172,000
D12 17.5 0.3 31.7 257,000
mean 14.8 0.3 25.2 204,600
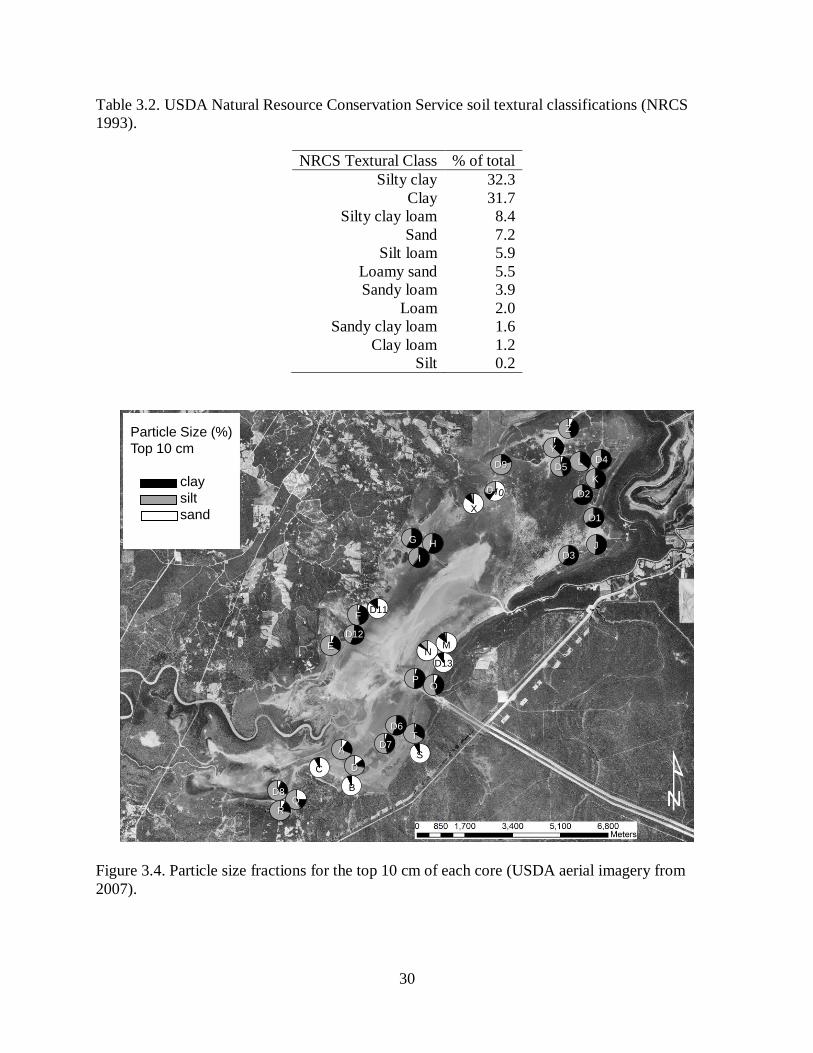
Particle size analysis indicated homogenous particle size with depth for the majority of profiles
(32 of 35 profiles) with a few exceptions. Most (27 of 35) of sediments were clays or silty clays
(NRCS 1993) (Figure 3.4, Table 3.2). Two of the 35 profiles were dominated by clay but
contained sand lenses 20-40 cm thick. Five of the 35 profiles were sandy throughout.
Discontinuities in particle size with depth occurred in 6 profiles, changing from fine to more
coarse sediments with depth in profiles D and E and from coarse to fine sediments with depth in
profiles M, N, D10, and D11.
28
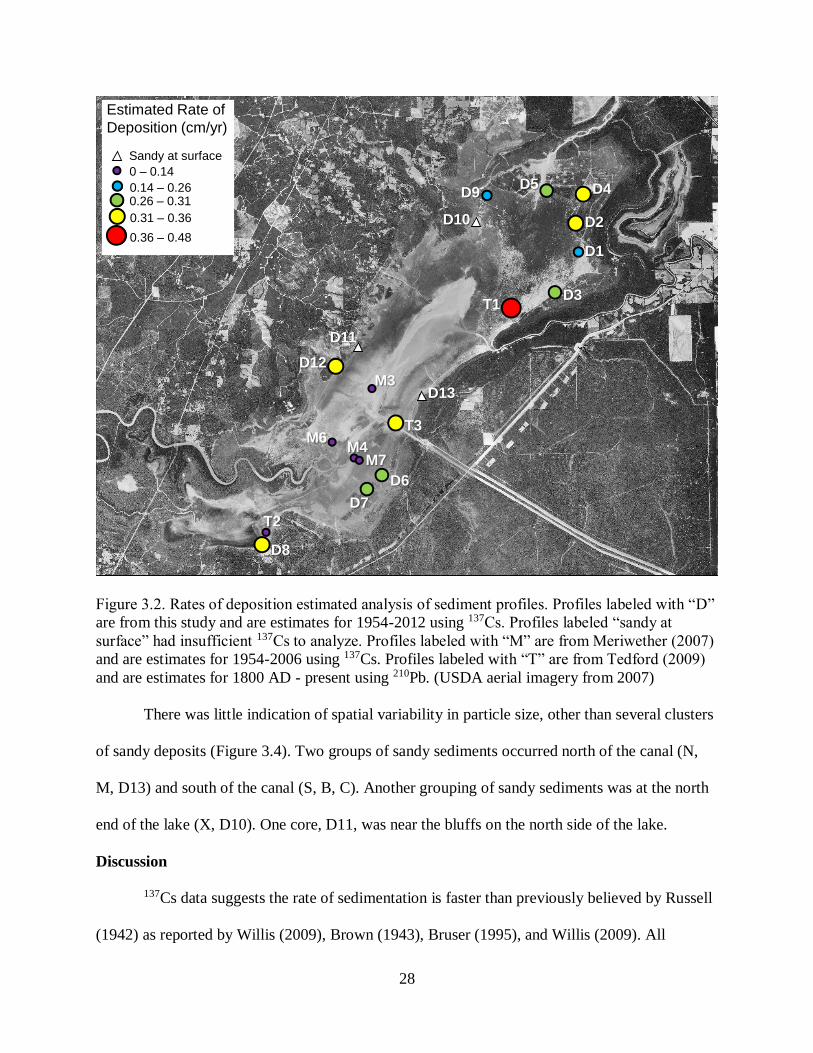
Figure 3.2. Rates of deposition estimated analysis of sediment profiles. Profiles labeled with “D”
are from this study and are estimates for 1954-2012 using 137Cs. Profiles labeled “sandy at
surface” had insufficient 137Cs to analyze. Profiles labeled with “M” are from Meriwether (2007)
and are estimates for 1954-2006 using 137Cs. Profiles labeled with “T” are from Tedford (2009)
and are estimates for 1800 AD - present using 210Pb. (USDA aerial imagery from 2007)
There was little indication of spatial variability in particle size, other than several clusters
of sandy deposits (Figure 3.4). Two groups of sandy sediments occurred north of the canal (N,
M, D13) and south of the canal (S, B, C). Another grouping of sandy sediments was at the north
end of the lake (X, D10). One core, D11, was near the bluffs on the north side of the lake.
Discussion
137Cs data suggests the rate of sedimentation is faster than previously believed by Russell
(1942) as reported by Willis (2009), Brown (1943), Bruser (1995), and Willis (2009). All
Sandy at surface
Estimated Rate of
Deposition (cm/yr)
0.14 – 0.26
0 – 0.14
0.26 – 0.31
0.31 – 0.36
0.36 – 0.48
D12
D11
D8
T2
T3
T1
M6M4
M7
D6
D7
M3D13
D3
D1
D2
D4D5D9
D10
29
Figure 3.3. Particle size, bulk density, and 137Cs counts in the Cs profiles.
0
10
20
30
40
50
60
0 20 40 60 80 100
0
10
20
30
40
50
60
0.0 0.2 0.4 0.6 0.8 1.0 1.2 1.4 1.6 1.8
0
10
20
30
40
50
60
0 20 40 60 80 100
Particle Size Fraction (%)
Bulk Density (g/cm3)
0
10
20
30
40
50
60
0.0 0.2 0.4 0.6 0.8 1.0 1.2 1.4 1.6 1.8
137Cs Count
De
pth
(cm
)
0
10
20
30
40
50
60
0 100 200 300 400
D13
0
10
20
30
40
50
60
0 100 200 300 400
0
10
20
30
40
50
60
0 20 40 60 80 100
0
10
20
30
40
50
60
0.0 0.2 0.4 0.6 0.8 1.0 1.2 1.4 1.6 1.8
0
10
20
30
40
50
60
0 20 40 60 80 100
0
10
20
30
40
50
60
0 100 200 300 400
Particle Size Fraction (%)
Bulk Density (g/cm3)
0
10
20
30
40
50
60
0.0 0.2 0.4 0.6 0.8 1.0 1.2 1.4 1.6 1.8
137Cs Count
De
pth
(cm
)
D12
0
10
20
30
40
50
60
0 100 200 300 400
0
10
20
30
40
50
60
0 20 40 60 80 100
0
10
20
30
40
50
60
0 20 40 60 80 100
0
10
20
30
40
50
60
0 100 200 300 400
Particle Size Fraction (%)
Bulk Density (g/cm3)
0
10
20
30
40
50
60
0.0 0.2 0.4 0.6 0.8 1.0 1.2 1.4 1.6 1.8
137Cs Count
Depth
(cm
)
0
10
20
30
40
50
60
0 100 200 300 400
0
10
20
30
40
50
60
0.0 0.2 0.4 0.6 0.8 1.0 1.2 1.4 1.6 1.8
D11
0
10
20
30
40
50
60
0 20 40 60 80 1000
10
20
30
40
50
60
0.0 0.2 0.4 0.6 0.8 1.0 1.2 1.4 1.6 1.8
0
10
20
30
40
50
60
0 20 40 60 80 100
0
10
20
30
40
50
60
0 100 200 300 400
Particle Size Fraction (%)
Bulk Density (g/cm3)
0
10
20
30
40
50
60
0.0 0.2 0.4 0.6 0.8 1.0 1.2 1.4 1.6 1.8
137Cs Count
Depth
(cm
)
D10
0
10
20
30
40
50
60
0 100 200 300 400
0
10
20
30
40
50
60
0 20 40 60 80 1000
10
20
30
40
50
60
0.0 0.2 0.4 0.6 0.8 1.0 1.2 1.4 1.6 1.8
0
10
20
30
40
50
60
0 100 200 300 400
0
10
20
30
40
50
60
0 20 40 60 80 100
Particle Size Fraction (%)
Bulk Density (g/cm3)
0
10
20
30
40
50
60
0.0 0.2 0.4 0.6 0.8 1.0 1.2 1.4 1.6 1.8
137Cs Count
De
pth
(cm
)
D9
0
10
20
30
40
50
60
0 100 200 300 400
0
10
20
30
40
50
60
0 20 40 60 80 1000
10
20
30
40
50
60
0.0 0.2 0.4 0.6 0.8 1.0 1.2 1.4 1.6 1.8
0
10
20
30
40
50
60
0 20 40 60 80 100
0
10
20
30
40
50
60
0 100 200 300 400
Particle Size Fraction (%)
Bulk Density (g/cm3)
0
10
20
30
40
50
60
0.0 0.2 0.4 0.6 0.8 1.0 1.2 1.4 1.6 1.8
137Cs Count
Depth
(cm
)
D8
0
10
20
30
40
50
60
0 100 200 300 400
0
10
20
30
40
50
60
0 20 40 60 80 1000
10
20
30
40
50
60
0.0 0.2 0.4 0.6 0.8 1.0 1.2 1.4 1.6 1.8
0
10
20
30
40
50
60
0 20 40 60 80 100
0
10
20
30
40
50
60
0 100 200 300 400
Particle Size Fraction (%)
Bulk Density (g/cm3)
0
10
20
30
40
50
60
0.0 0.2 0.4 0.6 0.8 1.0 1.2 1.4 1.6 1.8
137Cs Count
De
pth
(cm
)
D7
0
10
20
30
40
50
60
0 100 200 300 400
0
10
20
30
40
50
60
0 20 40 60 80 100
0
10
20
30
40
50
60
0.0 0.2 0.4 0.6 0.8 1.0 1.2 1.4 1.6 1.8
0
10
20
30
40
50
60
0 20 40 60 80 100
0
10
20
30
40
50
60
0 100 200 300 400
Particle Size Fraction (%)
Bulk Density (g/cm3)
0
10
20
30
40
50
60
0.0 0.2 0.4 0.6 0.8 1.0 1.2 1.4 1.6 1.8
137Cs Count
De
pth
(cm
)
D6
0
10
20
30
40
50
60
0 100 200 300 400
0
10
20
30
40
50
60
0 20 40 60 80 100
0
10
20
30
40
50
60
0.0 0.2 0.4 0.6 0.8 1.0 1.2 1.4 1.6 1.8
0
10
20
30
40
50
60
0 20 40 60 80 100
0
10
20
30
40
50
60
0 100 200 300 400
Particle Size Fraction (%)
Bulk Density (g/cm3)
0
10
20
30
40
50
60
0.0 0.2 0.4 0.6 0.8 1.0 1.2 1.4 1.6 1.8
137Cs Count
Depth
(cm
)
D5
0
10
20
30
40
50
60
0 100 200 300 400
0
10
20
30
40
50
60
0 20 40 60 80 100
0
10
20
30
40
50
60
0.0 0.2 0.4 0.6 0.8 1.0 1.2 1.4 1.6 1.8
0
10
20
30
40
50
60
0 20 40 60 80 100
0
10
20
30
40
50
60
0 100 200 300 400
Particle Size Fraction (%)
Bulk Density (g/cm3)
0
10
20
30
40
50
60
0.0 0.2 0.4 0.6 0.8 1.0 1.2 1.4 1.6 1.8
137Cs Count
De
pth
(cm
)
D4
0
10
20
30
40
50
60
0 100 200 300 400
0
10
20
30
40
50
60
0 20 40 60 80 100
0
10
20
30
40
50
60
0.0 0.2 0.4 0.6 0.8 1.0 1.2 1.4 1.6 1.8
0
10
20
30
40
50
60
0 20 40 60 80 100
0
10
20
30
40
50
60
0 100 200 300 400
Particle Size Fraction (%)
Bulk Density (g/cm3)
0
10
20
30
40
50
60
0.0 0.2 0.4 0.6 0.8 1.0 1.2 1.4 1.6 1.8
137Cs Count
Depth
(cm
)
D3
0
10
20
30
40
50
60
0 100 200 300 400
0
10
20
30
40
50
60
0 20 40 60 80 100
0
10
20
30
40
50
60
0.0 0.2 0.4 0.6 0.8 1.0 1.2 1.4 1.6 1.8
0
10
20
30
40
50
60
0 20 40 60 80 100
0
10
20
30
40
50
60
0 100 200 300 400
Particle Size Fraction (%)
Bulk Density (g/cm3)
0
10
20
30
40
50
60
0.0 0.2 0.4 0.6 0.8 1.0 1.2 1.4 1.6 1.8
137Cs CountD
epth
(cm
)
D2
0
10
20
30
40
50
60
0 100 200 300 400
0
10
20
30
40
50
60
0 20 40 60 80 100
0
10
20
30
40
50
60
0.0 0.2 0.4 0.6 0.8 1.0 1.2 1.4 1.6 1.80
10
20
30
40
50
60
0 100 200 300 400
0
10
20
30
40
50
60
0 20 40 60 80 100
Particle Size Fraction (%)
Bulk Density (g/cm3)
0
10
20
30
40
50
60
0.0 0.2 0.4 0.6 0.8 1.0 1.2 1.4 1.6 1.8
137Cs Count
Depth
(cm
)
D1
0
10
20
30
40
50
60
0 100 200 300 400
0
10
20
30
40
50
600
10
20
30
40
50
600
10
20
30
40
50
600
10
20
30
40
50
600
10
20
30
40
50
60
0 20 40 60 80 100 0 20 40 60 80 100 0 20 40 60 80 100
Particle Size Fraction (%)
Bulk Density (g/cm3)D
ep
th (
cm
)
0 100 200 300 400
0 100 200 300 400 0 100 200 300 400
137Cs Count
D1 D2 D3
D4 D5 D6
D7 D8 D9
D12
D13
D10 D11
BD
137Cs
sandclay
1954
30
Table 3.2. USDA Natural Resource Conservation Service soil textural classifications (NRCS
1993).
NRCS Textural Class % of total
Silty clay 32.3
Clay 31.7
Silty clay loam 8.4
Sand 7.2
Silt loam 5.9
Loamy sand 5.5
Sandy loam 3.9
Loam 2.0
Sandy clay loam 1.6
Clay loam 1.2
Silt 0.2
Figure 3.4. Particle size fractions for the top 10 cm of each core (USDA aerial imagery from
2007).
K
L
J
Z
Y
D1
D2
D4D5
Particle Size (%)
Top 10 cm
clay
silt
sand
D9
X
D3
H
I
G
D8Q
R
C
B
D
A
D12
E
FD11
D7S
TD6
PO
D13
MN
31
described sedimentation as negligible as a result of decreased connectivity with Mississippi
River sediments. The results of this work suggest elevated sedimentation rates post-settlement
but not increased sedimentation since the era of hydrologic alteration of the lake 40-60 years ago.
The sedimentation rates for ~1800 AD – 2004 estimated by Tedford (2009) using 210Pb dating
are similar to those we obtained using 137Cs (Table 3.3) with mean sedimentation rate of 0.32 cm
yr-1 as compared to our 0.26 cm yr-1. If this difference is insignificant, it may be because
sedimentation has indeed been reduced by loss of connectivity to the Mississippi River, or it
could be that sedimentation decreased in the past 58 years as farming practices and soil
conservation have lessened sedimentation from the Little River.
Spatial variability of deposition was low, and variability among measurements did reveal
a few interpretable spatial patterns in deposition (Figure 3.2). The highest deposition rates were
at the southernmost part of the lake at the location of a historic ferry landing, and the lowest
deposition rates were at the north end of the lake.
Table 3.3. Comparison of this study with two other studies of Catahoula Lake that also estimated
sediment deposition rates.
Study Time Period
Mean
Sedimentation
Rate (cm yr-1)
Mean
Sedimentation
Rate (t ha-1 yr-1)
Mean Sediment
Load (t yr-1)
This Study ~1954 – 2012 0.3 25.2 204,000
Meriwether
2007
~1963 – 2004 0.1 14.9 121,000
Tedford 2003
~1800 AD – 2004 0.3 33.4 270,000
~2535 YBP - ~1800 0.1 8.4 68,000
~3900 YBP - ~2730 0.1 6.3 51,000
~4100 YBP - ~3900 0.0 2.1 17,000
The presence of turbation from wave action, boats, grazing animals, vehicles, and even
ducks complicates interpretation of 137Cs horizons. Wave action, frequently re-suspending
sediments and creating escarpments of varying elevations around the lake has been long known
32
(Brown 1943, Fisk 1944, Willis 2009, Tedford 2009). Cattle grazing occurred until 2001 (Willis
2009, Horst 2012) and bioturbation from wild hogs is also locally severe. Ducks foraging for
tubers further disturbs sediments (Peters, Afton 1993). Catahoula Lake also experiences
vehicular traffic in association with waterfowl hunting season. In 2000 a dredging operation
between the canal and the input of the Little River disturbed the lake sediments, moving them to
the side of the channel. This process displaced sediments and re-suspended them only to settle
out later, which would possibly remove the horizons where 137Cs was present and distribute the
137Cs elsewhere. In general this activity may broaden the 137Cs peaks, but will not likely change
the position of the major 137Cs horizons (Pennington et al. 1973; Ritchie, McHenry 1990). Our
analysis was conservative in identifying 1954 as the basal horizon with substantial 137Cs and
assuming trace amounts below that were from turbation.
The lack of spatial pattern in deposition rates suggests that turbation redistributes
sediment from its sources. For example, we did not find systematically different sediment
deposition near the inlet of Little River, nor near other flowing waterways such as the diversion
canal or the French Fork outlet. Therefore, it is difficult to ascribe the sources of sediment to
either Little River (coastal plain), small tributaries to the west (coastal plain) or connection to the
east (Mississippi River alluvial valley). Because the Little River is captive to the lake, its
sediments are likely mostly deposited except during times of high flow or due to re-suspension.
The Little River is likely the source of all sand in the current hydrologic regime, because only
backwater flooding occurs from the LMAV side. Unfortunately, redistribution prevents a
process-based conclusion about the sources of sediment or likely causes for elevated recent rates.
It is possible that the rate of sedimentation at Catahoula Lake could be a significant factor
driving changes in vegetative community composition and structure. Sedimentation at Catahoula
33
Lake could be affecting water quality, plants, invertebrates, and wildlife in turn. Sediment may
be burying the seeds of herbaceous plants, reducing total seedling emergence (Gleason et al
2003) and altering plant communities by impeding the re-colonization process of plants.
(Rybicki, Carter 1986; Hartleb et al. 1993; Jurik et al. 1994; Wang et al. 1994). The heartier,
woody vegetation is likely better adapted to deal with sediment. Increased sediment means a
decrease in lake depth and duration of flooding through changing the topography of the lake bed,
and as a result, the length of the growing period could change with increased sediment. These
changes in depth also effect the amount of invertebrates present, an additional source of food to
waterfowl.
Conclusions
Sedimentation at Catahoula Lake has been about 0.26 cm yr-1 for the past 60 years but
may have decreased slightly after a peak sometime in the past about 200 years. Sedimentation is
at a fairly uniform depth across the lakebed, suggesting redistribution after initial deposition.
References – Chapter 3
Bedford, B.L., Walbridge, M.R., Aldous, A., 1999, Patterns in Nutrient Availability and Plant
Diversity of Temperate North American Wetlands: Ecology, v. 80, p. 2151-2169.
Brenner, M., Kenney, F., 2013. Dating Wetland Sediment Cores, in DeLaune, R.D., Reddy,
K.R., Richardson, C.J., Megonigal, J.P. eds., Methods of Biogeochemistry of Wetlands,
Soil Science Society of America, p. 879-900.
Brown, C. A., 1943, Vegetation and lake level correlations at Catahoula Lake, Louisiana: The
Geographical review, v. 33, p. 435-445.
Bruser, J. F., 1995, Ecology of Catahoula Lake Plant Communities in Relation to an
Anthropogenic Water Regime, Louisiana State University, Baton Rouge, p. 1-100.
Callaway, J.C., DeLaune, R.D., Patrick, W.H., Jr., 1996, Chernobyl 137Cs used to determine
sediment accretion rates at selected northern European coastal wetlands: Limnology and
Oceanography, ed. 41, v. 3, p. 444-450.
34
Casanova, M.T., Brock, M.A., 2000, How do depth, duration and frequency of flooding
influence the establishment of wetland plant communities?: Plant Ecology, v. 147, p.
237-250.
DeLaune, R. D., Patrick, W.H., Buresh, R.J., 1978, Sedimentation rates determined by Cs-137
dating in a rapidly accreting salt marsh: Nature, v. 275, p. 532-533.
Fisk, H.N., 1944, Geological Investigation of the Alluvial Valley of the Lower Mississippi River
Conducted for the Mississippi River Commission, War Department, Corps of Engineers,
U.S. Army, p. 28-29.
Gee, G. W., Bauder, J.W., 1986, Particle-size Analysis, in Klute, E.A., ed., Methods of Soil
Analysis: Part 1 - Physical and Mineralogical Methods. Soil Science Society of America,
p. 383-411.
Gleason, R., Euliss, N., Hubbard, D., Duffy, W., 2003, Effects of Sediment Load on Emergence
of Aquatic Invertebrates and Plants from Wetland Soil Egg and Seed Banks: Wetlands, v.
23, p. 26-34.
Hartleb, C. F., Madswen, J.D., Boylen, C.W., 1993, Environmental Factors Affecting Seed
Germination in Myriophyllum spicatum L.: Aquatic Botany, v. 45, p. 15-25.
Horst, J., 2012, Defining Catahoula Lake: Louisiana Sportsman, December 01, 2012,
http://www.louisianasportsman.com/details.php?id=4612.
Jurik, T. W., Wang, S.C., van der Valk, A., 1994, Effects of Sediment Load on Seedling
Emergence From Wetland Seed Banks: Wetlands, v. 14, p. 159-165.
Kummu, M., Penny, D., Sarkkula, J., Koponen, J., 2008, Sediment: Curse or Blessing for Tonle
Sap Lake?: AMBIO: A Journal of the Human Environment, ed. 37, v. 3, p. 158-163.
Meriwether, J.R., 2007, Cesium Core Study at Catahoula Lake, Report to U.S. Geological
Survey, National Wetlands Research Center. Unpublished data.
Nelson, D.W., Sommers, L.E., 1996, Total Carbon, Organic Carbon, and Organic Matter, in
Sparks, D.L., Page, A.L., Helmke, P.A., and Loeppert, R.H., eds., Methods of Soil
Analysis: Part 3 – Chemical Methods. Soil Science Society of America, p. 961-1010.
Nilsson, C., Berggren, K, 2014, Alterations of Riparian Ecosystems Caused by River Regulation:
BioScience, v. 9, p. 783 – 792.
35
Nilsson, C., Svedmark, M., 2002, Basic Principles and Ecological Consequences of Changing
Water Regimes: Riparian Plant Communities: Environmental Management, v. 30, p. 468-
480.
NRCS Soil Survey Division Staff, 1993, Soil survey manual, Soil Conservation Service, U.S.
Department of Agriculture Handbook 18.
Pennington, W., Tutin, T.G., Cambray, R.S., Fisher, E.M., 1973, Observations on Lake
Sediments using Fallout 137Cs as a Tracer: Nature, v. 242, p. 324-326.
Peters, M. S., Afton, A.D., 1993, Effects of deep tillage on redistribution of lead shot and chufa
flatsedge at Catahoula Lake, Louisiana: Wildlife Society Bulletin, v. 21, p. 471-479.
Ritchie, J.C., McHenry, J.R., 1990, Application of radioactive fallout cesium-137 for measuring
soil erosion and sediment accumulation rates and patterns: a review: Journal of
Environmental Quality, ed. 19, v. 2, p. 215-233.
Rybicki, N. B., Carter, V., 1986, Effect of Sediment Depth and Sediment Type on the Survival of
Vallisneria americana Michx grown from tubers: Aquatic Botany, v. 24, p. 233-240.
Saengkul, C., Pakkong, P., Sawangwong, P., 2013, Effect of sediment characteristics on sorption
of 137Cs at the sediment-water interface: IOSR Journal of Environmental Science,
Toxicology and Food Technology, ed. 4, v. 5, p. 122-125.
Tedford, R. A., 2009, A multi-proxy approach to investigating the latest Holocene (~4,500 yrs.
BP) vegetational history of Catahoula Lake, Louisiana, Louisiana State University, Baton
Rouge, La, p. 1-382.
Toner, M., Keddy, P., 1997, River Hydrology and Riparian Wetlands: A Predictive Model for
Ecological Assembly: Ecological Applications, v. 7, p. 236-246.
Wang, S.C., Jurik, T.W., van der Valk, A.G., 1994, Effects of Sediment Load on Various Stages
in the Life and Death of Cattail (Typha x Glauca): Wetlands, v. 14, p. 166-173.
Willis, F. L., 2009, A Multidisciplinary Approach for Determining the Extents of the Beds of
Complex Natural Lakes in Louisiana, University of New Orleans, New Orleans, p. 1-182.
Wills, D.W., 1963, An investigation of some factors affecting waterfowl and waterfowl habitat
on Catahoula Lake, Louisiana, Louisiana State University, Baton Rouge, p. 1-97.
Zedler, J.B., Kercher, S., 2004, Causes and Consequences of Invasive Plants in Wetlands:
Opportunities, Opportunists, and Outcomes: Critical Reviews in Plant Sciences, v. 23, p.
431-452.
36
Chapter 4. Sediment Chemistry at Catahoula Lake, Louisiana
Introduction
The processes that control species composition and structure in wetland ecosystems are
complex and include seasonality (Nilsson, Svedmark 2002), depth, and duration of flooding
(Casanova, Brock 2000); nutrient dynamics (Bedford et al 1999); and other sediment chemistry.
Catahoula Lake near Alexandria, Louisiana has remained a seasonally inundated lake for about
4,000 years (Tedford 2009) and has been experiencing an advancing front of woody, terrestrial
vegetation into the lake bed for at least the last 60 years. It has become increasingly important to
understand the processes that determine where the tree line ends and the more diverse
herbaceous vegetation begins as important waterfowl habitat is lost. Processes controlling this
expansion of woody vegetation are largely unknown but sedimentation may be playing a role
(Shafroth et al 2002, Reisinger et al 2013). Anthropogenic alterations to watersheds including
dam construction, levees, water control structures, and conversion of wetlands to agricultural
lands through draining alter hydrology and sediment loads, threatening many of these
ecosystems. (Toner, Keddy 1997; Nilsson, Berggren 2014). For example, more than 400,000 ha
of Wisconsin wetlands are dominated by reed canarygrass (Phalaris arundinacea) due in large
part to increased sediment input from erosion of agricultural lands filling in and flattening the
heterogeneous topography of tussock sedge meadows (Zedler, Kercher 2004). As a substrate for
plant growth, the chemical and physical composition of sediments can determine plant
community structure and composition and changes in sediment sources can dramatically alter the
ecosystem (Briggs et al 2005, Reisinger et al 2013).
Catahoula Lake is a complex wetland of international importance that is experiencing a
shift in vegetation. Woody vegetation is encroaching into the lake bed and the rate of this
expansion has increased since anthropogenic changes to the hydrology of the lake and nearby
37
rivers (Chapter 2). Concurrently, sedimentation has increased relative to pre-settlement rates
(Tedford 2009, Chapter 3), which suggests it may be playing a role in the shifting lake
ecosystem. If the sources of sediment are different now than historically, differences in their
chemical and physical nature may be contributing to changes in the ecosystem beyond simply
raising the lakebed elevation. In addition, any differences in the composition of surficial and
buried sediments may reveal shifts in sources that may be related to woody expansion.
There are three likely major sources of sediment entering Catahoula Lake, with distinct
differences among them that can aid in tracing sources: the Western Coastal Plain, Southern
Mississippi River Alluvium, and Red River Alluvium (Weindorf 2008). The Western Coastal
Plain is composed of tertiary and cretaceous mixed marine and alluvial sediments that are loamy
or clayey with smectitic or mixed smectitic and kaolinitic mineralogy (Autin, Aslan 2001;
Weindorf 2008) and are acidic due to weathering and leaching of basic cations (Autin, Aslan
2001). Southern Mississippi River Alluvium is composed of sandy to clayey fluvial Holocene
deposits with smectitic mineralogy and high base saturation (Weindorf 2008). Red River
Alluvium is composed of sandy to clayey fluvial deposits of Holocene to late Pleistocene
floodplains and terraces with smectitic mineralogy (Weindorf 2008), but lower in
montmorillonite than Mississippi River alluvium (Taggart, Kaiser 1960). These varying
compositions are useful as tracers of source material for sediments deposited at Catahoula Lake.
Aside from usefulness as tracers of origin, the chemical nature of sediments may be
important for ecosystem processes. Changes in macronutrients-- nitrogen, phosphorus, and
potassium-- in the sediments at Catahoula Lake could be particularly influential in plant
communities (Koerselman, Meuleman 1996; Bedford et al 1999). Land-use practices such as
38
fertilization are frequent causes of increased nutrient loading in agricultural landscapes
(Saunders, Kalff 2001).
The overall objective is to understand the elemental composition of sediments at
Catahoula Lake and determine whether there are any patterns that indicate physical processes
controlling the lake or chemistry affecting the ecosystem. The first specific objective is to use the
chemistry, particle size, and pH of sediments to evaluate whether sediment sources may have
changed in the recent past in association with changing land use and with hydrologic
management. The second specific objective is to investigate the plant active elements to
determine whether changes in nutrient status may be related to ecosystem changes.
Methods
Field Methods
We collected 37 sediment profiles for elemental analysis. The first 12 profiles were
collected to a depth of 1 meter with a Giddings Probe soil corer in fall 2011. Another 25 profiles
were collected to a depth of 0.50 meters in 2012. Twelve of these were collected by digging pits
and cutting slices out of the profile, and 13 were collected in 10 cm diameter aluminum tubes.
Profiles were sampled in the zone of expansion of water-elm, near, elevation 10.4 m. These
depths of sampling correspond to approximately 167 years of deposition according to
sedimentation rates estimated by Tedford (2009).
Laboratory Methods
In the laboratory, the Giddings probe and pit profile samples were divided into 5 cm
increments and the aluminum tube profiles were divided into 3 cm increments (for 137Cs
analysis, Chapter 3). All samples were then oven-dried to 105° C, disaggregated with a
Humboldt soil grinder or mortar and pestle and passed through an ASTM number 10 sieve.
39
The samples from the top 15 cm of each profile were tested for elemental analysis using
inductively coupled plasma atomic emission spectrometry (ICP-AES) by the LSU Soil Testing
and Plant Analysis Lab. We prepared the samples using EPA method 3050B for acid digestion.
This method uses HNO3- and HCl with heat to dissolve almost all recoverable elements other
than those bound in silicate structures (Chen, Ma 1998). We included a blank in every other
digested batch of 16 samples to correct for any contamination that may have occurred during
digestion. The ICP analysis provided concentrations of aluminum, boron, barium, beryllium,
calcium, cobalt, chromium, copper, iron, potassium, magnesium, manganese, sodium, nickel,
phosphorus, lead, sulfur, silicon, titanium, vanadium, and zirconium.
Another elemental analysis was run on all samples at all depths using portable x-ray
fluorescence (PXRF) spectrometry, a non-destructive technique that requires minimal
preparation (oven-dry, disaggregated sediment samples). Samples were scanned with the
DELTA Handheld PXRF Analyzer with a tantalum tube. Every ten scans we calibrated the
machine and scanned two NIST standards (NIST 2781, NIST 2702). The PXRF analyzer
provided concentrations of silver, arsenic, barium, cadmium, calcium, chlorine, cobalt,
chromium, copper, iron, mercury, iodine, potassium, manganese, molybdenum, nickel,
phosphorus, rubidium, lead, antimony, selenium, tin, strontium, sulfur, titanium, zinc, and
zirconium. However, for some elements the PXRF reported large errors or produced data that
were poorly correlated with ICP. Therefore, we did not use elemental data for which the error
reported by the instrument exceeded the concentration, or for which correlation with ICP was
less than R2 = 0.40 (Appendix B). The remaining, high-quality data were for barium, calcium,
cobalt, chromium, iron, potassium, manganese, lead, rubidium, strontium, titanium, and
zirconium.
40
Total carbon and nitrogen were determined by the LSU Wetland Biogeochemistry
Analytical Services using a Costech 1040 CHNOS Elemental Combustion system. Sediment
profile samples were combined and mixed to make representative 9-10 cm samples, depending
on whether the profiles were originally divided into 3 or 5 cm increments. Approximately 8-9 mg
of sample was weighed into a tin capsule, which was crimped and sealed for maximum
combustion.
Sediment pH was measured using 6-9g samples from every 10 cm of each profile to a
depth of 0.50 m using a Thermo Scientific 3-Star Plus bench-top pH meter. Samples were made
into a 1:1 slurry with deionized water and measured after 15 minutes as described by Thomas
(1996).
Statistical Methods
The goal of the first set of analyses was to determine whether natural groupings of
elements and physical properties existed in samples, which could be indicative of sediment
sources. We analyzed the elemental concentrations and physical characteristics using principle
component (PCA) and hierarchical cluster analyses (PROC FACTOR and PROC CLUSTER in
SAS 9.3). Variables in both analyses were depth, total nitrogen, total carbon, percent sand,
percent clay, pH, barium, calcium, cobalt, chromium, iron, potassium, manganese, lead,
rubidium, strontium, titanium, and zirconium concentrations for all profile samples to 0.50
meters (n = 420). Prior to analysis, all variables were standardized (value less the mean of all
values, divided by standard deviation of all values) to ensure consistent scales and Euclidean
distance was used in all multivariate procedures. For the PCA, we used the scree plot and broken
stick criterion (McCune, Grace 2002) to test for significance of components. For the cluster
analysis, we used peaks in the pseudo-F statistic to determine how many clusters existed.
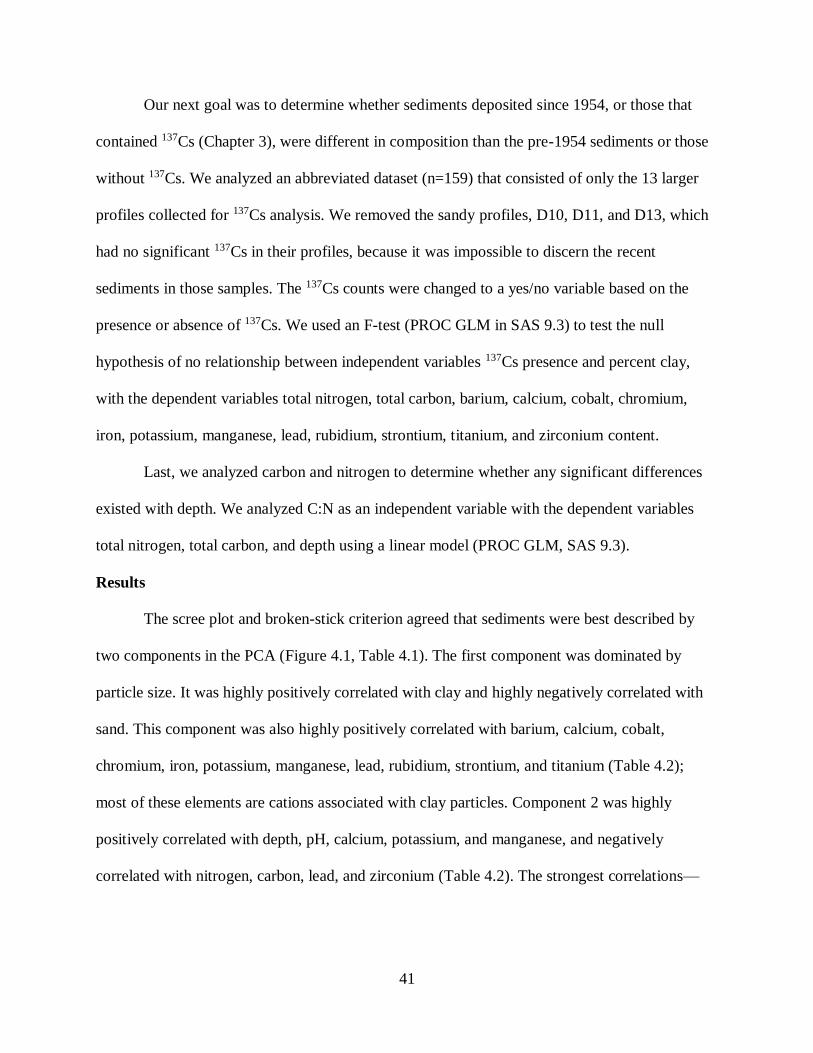
41
Our next goal was to determine whether sediments deposited since 1954, or those that
contained 137Cs (Chapter 3), were different in composition than the pre-1954 sediments or those
without 137Cs. We analyzed an abbreviated dataset (n=159) that consisted of only the 13 larger
profiles collected for 137Cs analysis. We removed the sandy profiles, D10, D11, and D13, which
had no significant 137Cs in their profiles, because it was impossible to discern the recent
sediments in those samples. The 137Cs counts were changed to a yes/no variable based on the
presence or absence of 137Cs. We used an F-test (PROC GLM in SAS 9.3) to test the null
hypothesis of no relationship between independent variables 137Cs presence and percent clay,
with the dependent variables total nitrogen, total carbon, barium, calcium, cobalt, chromium,
iron, potassium, manganese, lead, rubidium, strontium, titanium, and zirconium content.
Last, we analyzed carbon and nitrogen to determine whether any significant differences
existed with depth. We analyzed C:N as an independent variable with the dependent variables
total nitrogen, total carbon, and depth using a linear model (PROC GLM, SAS 9.3).
Results
The scree plot and broken-stick criterion agreed that sediments were best described by
two components in the PCA (Figure 4.1, Table 4.1). The first component was dominated by
particle size. It was highly positively correlated with clay and highly negatively correlated with
sand. This component was also highly positively correlated with barium, calcium, cobalt,
chromium, iron, potassium, manganese, lead, rubidium, strontium, and titanium (Table 4.2);
most of these elements are cations associated with clay particles. Component 2 was highly
positively correlated with depth, pH, calcium, potassium, and manganese, and negatively
correlated with nitrogen, carbon, lead, and zirconium (Table 4.2). The strongest correlations—
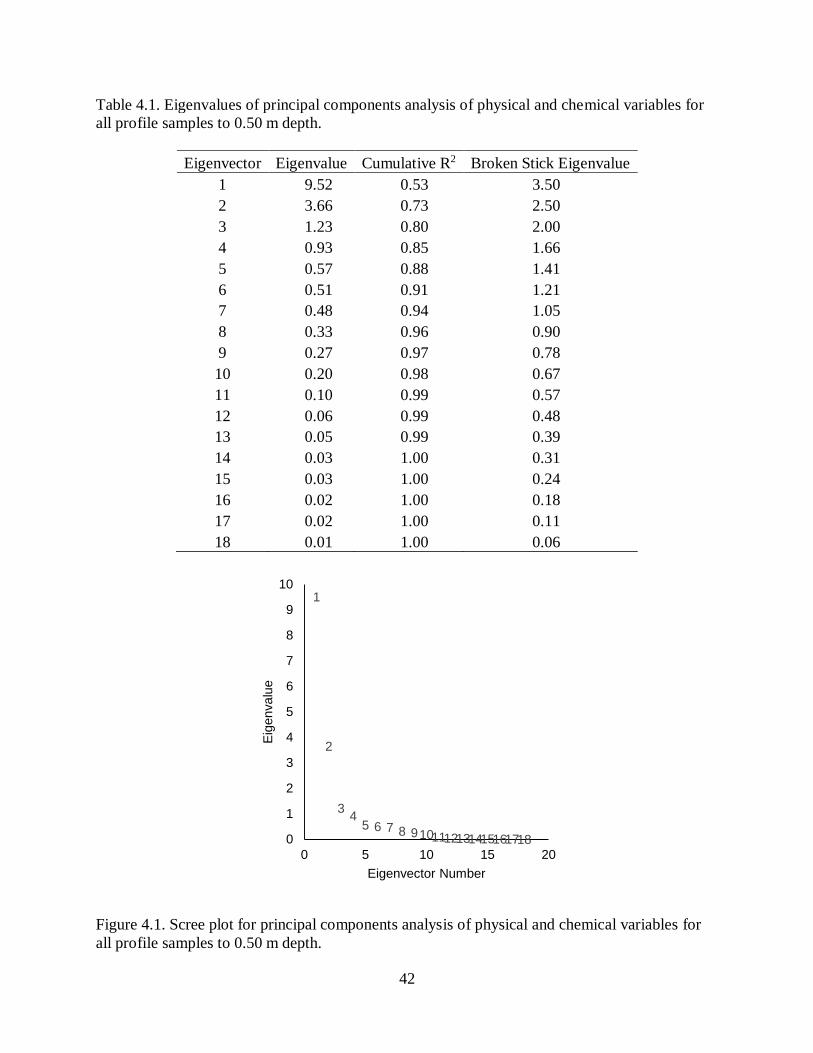
42
Table 4.1. Eigenvalues of principal components analysis of physical and chemical variables for
all profile samples to 0.50 m depth.
Eigenvector Eigenvalue Cumulative R2 Broken Stick Eigenvalue
1 9.52 0.53 3.50
2 3.66 0.73 2.50
3 1.23 0.80 2.00
4 0.93 0.85 1.66
5 0.57 0.88 1.41
6 0.51 0.91 1.21
7 0.48 0.94 1.05
8 0.33 0.96 0.90
9 0.27 0.97 0.78
10 0.20 0.98 0.67
11 0.10 0.99 0.57
12 0.06 0.99 0.48
13 0.05 0.99 0.39
14 0.03 1.00 0.31
15 0.03 1.00 0.24
16 0.02 1.00 0.18
17 0.02 1.00 0.11
18 0.01 1.00 0.06
Figure 4.1. Scree plot for principal components analysis of physical and chemical variables for
all profile samples to 0.50 m depth.
1
2
34
5 6 7 8 91011121314151617180
1
2
3
4
5
6
7
8
9
10
0 5 10 15 20
Eig
en
va
lue
Eigenvector Number
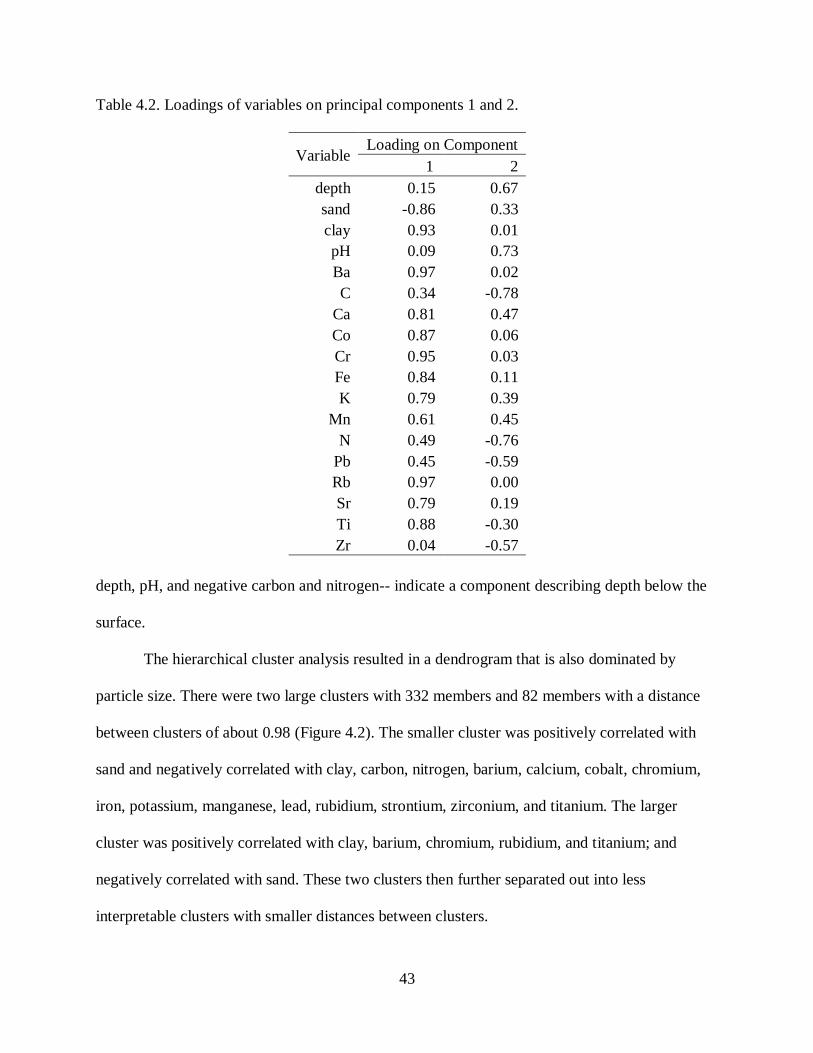
43
Table 4.2. Loadings of variables on principal components 1 and 2.
Variable Loading on Component
1 2
depth 0.15 0.67
sand -0.86 0.33
clay 0.93 0.01
pH 0.09 0.73
Ba 0.97 0.02
C 0.34 -0.78
Ca 0.81 0.47
Co 0.87 0.06
Cr 0.95 0.03
Fe 0.84 0.11
K 0.79 0.39
Mn 0.61 0.45
N 0.49 -0.76
Pb 0.45 -0.59
Rb 0.97 0.00
Sr 0.79 0.19
Ti 0.88 -0.30
Zr 0.04 -0.57
depth, pH, and negative carbon and nitrogen-- indicate a component describing depth below the
surface.
The hierarchical cluster analysis resulted in a dendrogram that is also dominated by
particle size. There were two large clusters with 332 members and 82 members with a distance
between clusters of about 0.98 (Figure 4.2). The smaller cluster was positively correlated with
sand and negatively correlated with clay, carbon, nitrogen, barium, calcium, cobalt, chromium,
iron, potassium, manganese, lead, rubidium, strontium, zirconium, and titanium. The larger
cluster was positively correlated with clay, barium, chromium, rubidium, and titanium; and
negatively correlated with sand. These two clusters then further separated out into less
interpretable clusters with smaller distances between clusters.
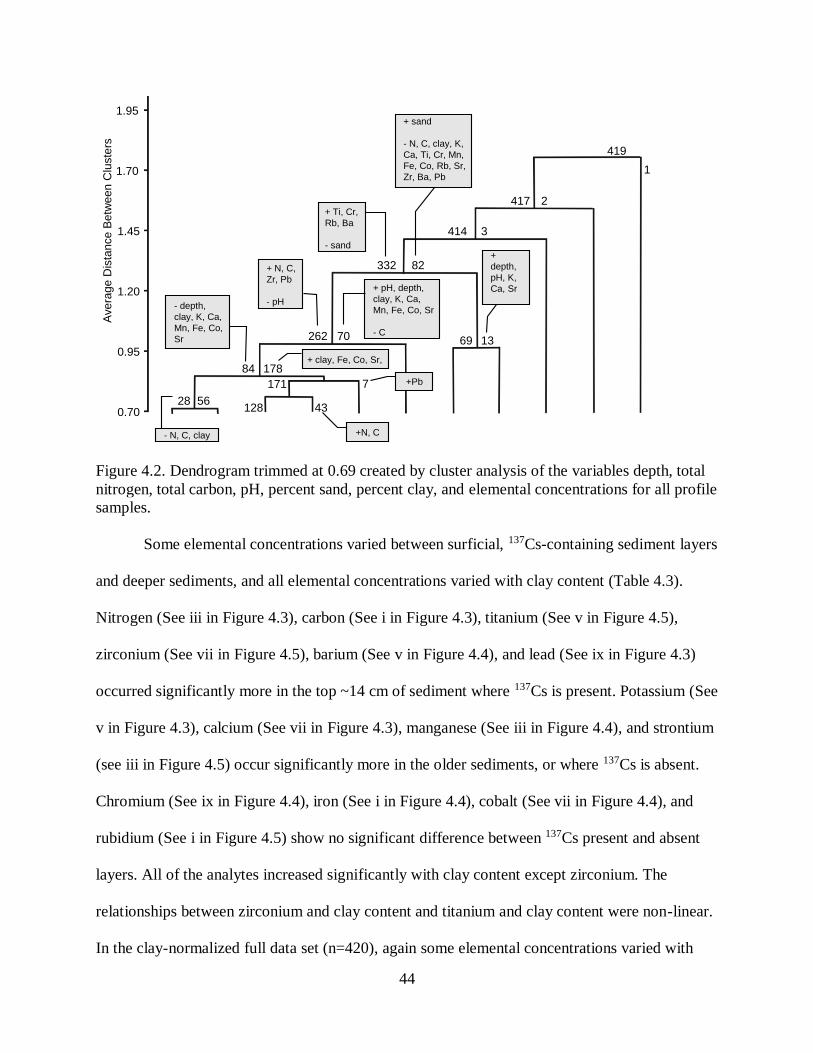
44
Figure 4.2. Dendrogram trimmed at 0.69 created by cluster analysis of the variables depth, total
nitrogen, total carbon, pH, percent sand, percent clay, and elemental concentrations for all profile
samples.
Some elemental concentrations varied between surficial, 137Cs-containing sediment layers
and deeper sediments, and all elemental concentrations varied with clay content (Table 4.3).
Nitrogen (See iii in Figure 4.3), carbon (See i in Figure 4.3), titanium (See v in Figure 4.5),
zirconium (See vii in Figure 4.5), barium (See v in Figure 4.4), and lead (See ix in Figure 4.3)
occurred significantly more in the top ~14 cm of sediment where 137Cs is present. Potassium (See
v in Figure 4.3), calcium (See vii in Figure 4.3), manganese (See iii in Figure 4.4), and strontium
(see iii in Figure 4.5) occur significantly more in the older sediments, or where 137Cs is absent.
Chromium (See ix in Figure 4.4), iron (See i in Figure 4.4), cobalt (See vii in Figure 4.4), and
rubidium (See i in Figure 4.5) show no significant difference between 137Cs present and absent
layers. All of the analytes increased significantly with clay content except zirconium. The
relationships between zirconium and clay content and titanium and clay content were non-linear.
In the clay-normalized full data set (n=420), again some elemental concentrations varied with
2.20
1.95
1.70
1.45
1.20
0.95
0.70
Avera
ge D
ista
nce B
etw
een C
luste
rs
419
1
417 2
414 3
332 82
262 70 69 13
17884
171 7
4312828 56
+ Ti, Cr,
Rb, Ba
- sand
+ sand
- N, C, clay, K,
Ca, Ti, Cr, Mn,
Fe, Co, Rb, Sr,
Zr, Ba, Pb
+ N, C,
Zr, Pb
- pH
+ pH, depth,
clay, K, Ca,
Mn, Fe, Co, Sr
- C
+
depth,
pH, K,
Ca, Sr
- depth,
clay, K, Ca,
Mn, Fe, Co,
Sr
+ clay, Fe, Co, Sr,
+Pb
+N, C- N, C, clay
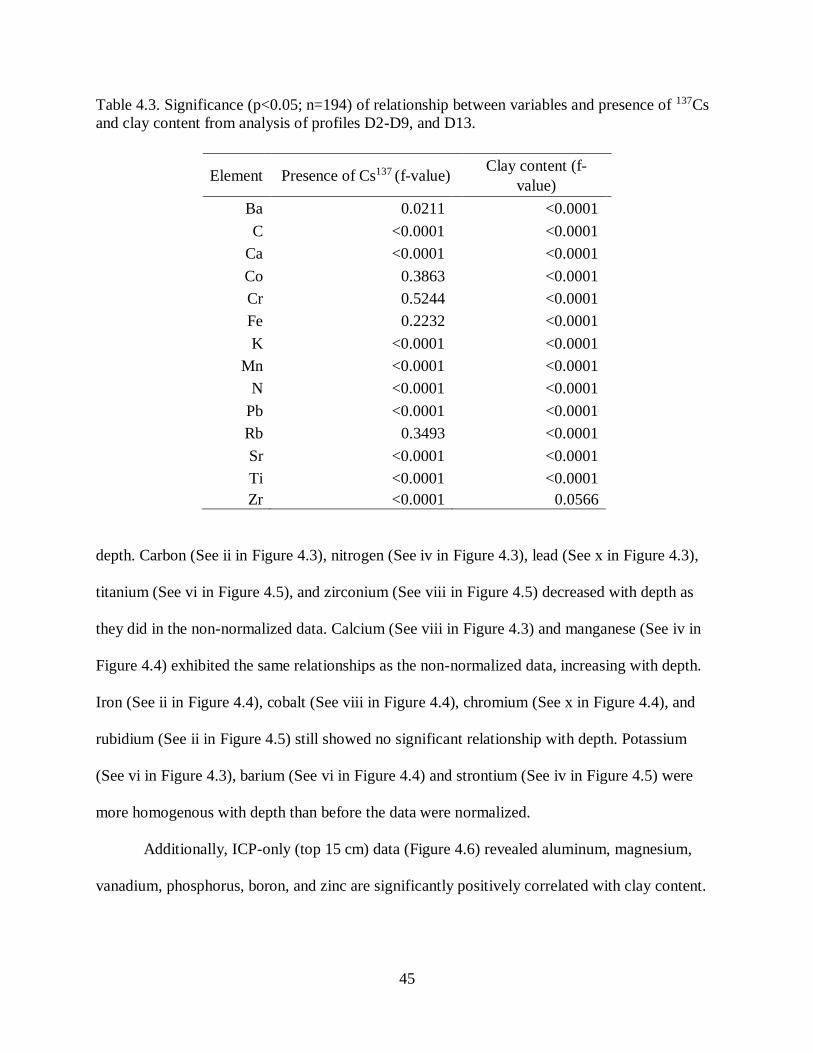
45
Table 4.3. Significance (p<0.05; n=194) of relationship between variables and presence of 137Cs
and clay content from analysis of profiles D2-D9, and D13.
Element Presence of Cs137 (f-value) Clay content (f-
value)
Ba 0.0211 <0.0001
C <0.0001 <0.0001
Ca <0.0001 <0.0001
Co 0.3863 <0.0001
Cr 0.5244 <0.0001
Fe 0.2232 <0.0001
K <0.0001 <0.0001
Mn <0.0001 <0.0001
N <0.0001 <0.0001
Pb <0.0001 <0.0001
Rb 0.3493 <0.0001
Sr <0.0001 <0.0001
Ti <0.0001 <0.0001
Zr <0.0001 0.0566
depth. Carbon (See ii in Figure 4.3), nitrogen (See iv in Figure 4.3), lead (See x in Figure 4.3),
titanium (See vi in Figure 4.5), and zirconium (See viii in Figure 4.5) decreased with depth as
they did in the non-normalized data. Calcium (See viii in Figure 4.3) and manganese (See iv in
Figure 4.4) exhibited the same relationships as the non-normalized data, increasing with depth.
Iron (See ii in Figure 4.4), cobalt (See viii in Figure 4.4), chromium (See x in Figure 4.4), and
rubidium (See ii in Figure 4.5) still showed no significant relationship with depth. Potassium
(See vi in Figure 4.3), barium (See vi in Figure 4.4) and strontium (See iv in Figure 4.5) were
more homogenous with depth than before the data were normalized.
Additionally, ICP-only (top 15 cm) data (Figure 4.6) revealed aluminum, magnesium,
vanadium, phosphorus, boron, and zinc are significantly positively correlated with clay content.
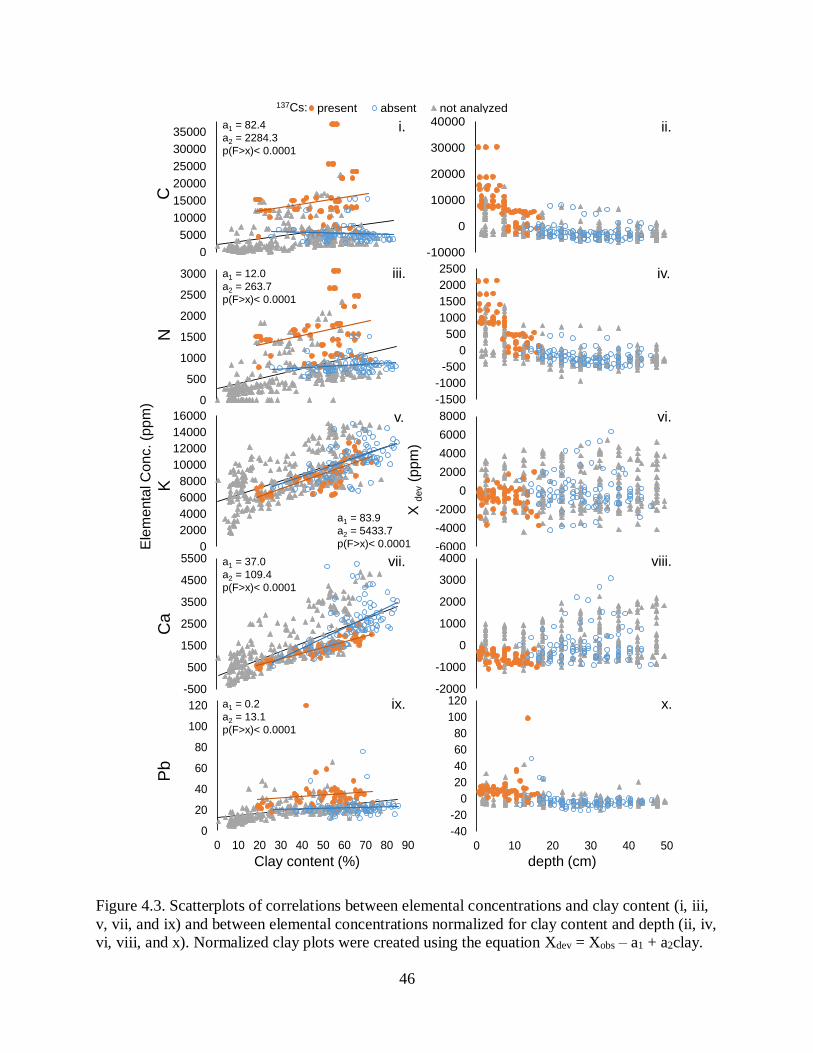
46
Figure 4.3. Scatterplots of correlations between elemental concentrations and clay content (i, iii,
v, vii, and ix) and between elemental concentrations normalized for clay content and depth (ii, iv,
vi, viii, and x). Normalized clay plots were created using the equation Xdev = Xobs – a1 + a2clay.
-2000
-1000
0
1000
2000
3000
0 10 20 30 40 50
present absent not analyzed
Ti
depth (cm)
-10000
0
10000
20000
30000
40000
0 10 20 30 40 50
-1500
-1000
-500
0
500
1000
1500
2000
2500
0 10 20 30 40 50
-6000
-4000
-2000
0
2000
4000
6000
8000
0 10 20 30 40 50
-2000
-1000
0
1000
2000
3000
4000
0 10 20 30 40 50
-40
-20
0
20
40
60
80
100
120
0 10 20 30 40 50
0
20
40
60
80
100
120
0 10 20 30 40 50 60 70 80 90
Pb-500
500
1500
2500
3500
4500
5500
0 10 20 30 40 50 60 70 80 90
Ca0
2000
4000
6000
8000
10000
12000
14000
16000
0 10 20 30 40 50 60 70 80 90
0
500
1000
1500
2000
2500
3000
0 10 20 30 40 50 60 70 80 90
N
0
500
1000
1500
2000
2500
3000
0 10 20 30 40 50 60 70 80 90
0
5000
10000
15000
20000
25000
30000
35000
0 10 20 30 40 50 60 70 80 90
C
Clay content (%)
Ele
me
nta
l C
on
c. (p
pm
)
CN
KC
aP
b
137Cs:
0
5000
10000
15000
20000
25000
30000
35000
0 10 20 30 40 50 60 70 80 90
X d
ev
(pp
m)
a1 = 82.4
a2 = 2284.3
p(F>x)< 0.0001
a1 = 12.0
a2 = 263.7
p(F>x)< 0.0001
0
2000
4000
6000
8000
10000
12000
14000
16000
0 10 20 30 40 50 60 70 80 90
a1 = 83.9
a2 = 5433.7
p(F>x)< 0.0001
-500
500
1500
2500
3500
4500
5500
0 10 20 30 40 50 60 70 80 90
a1 = 37.0
a2 = 109.4
p(F>x)< 0.0001
0
20
40
60
80
100
120
0 10 20 30 40 50 60 70 80 90
a1 = 0.2
a2 = 13.1
p(F>x)< 0.0001
i. ii.
iii. iv.
v. vi.
vii. viii.
ix. x.
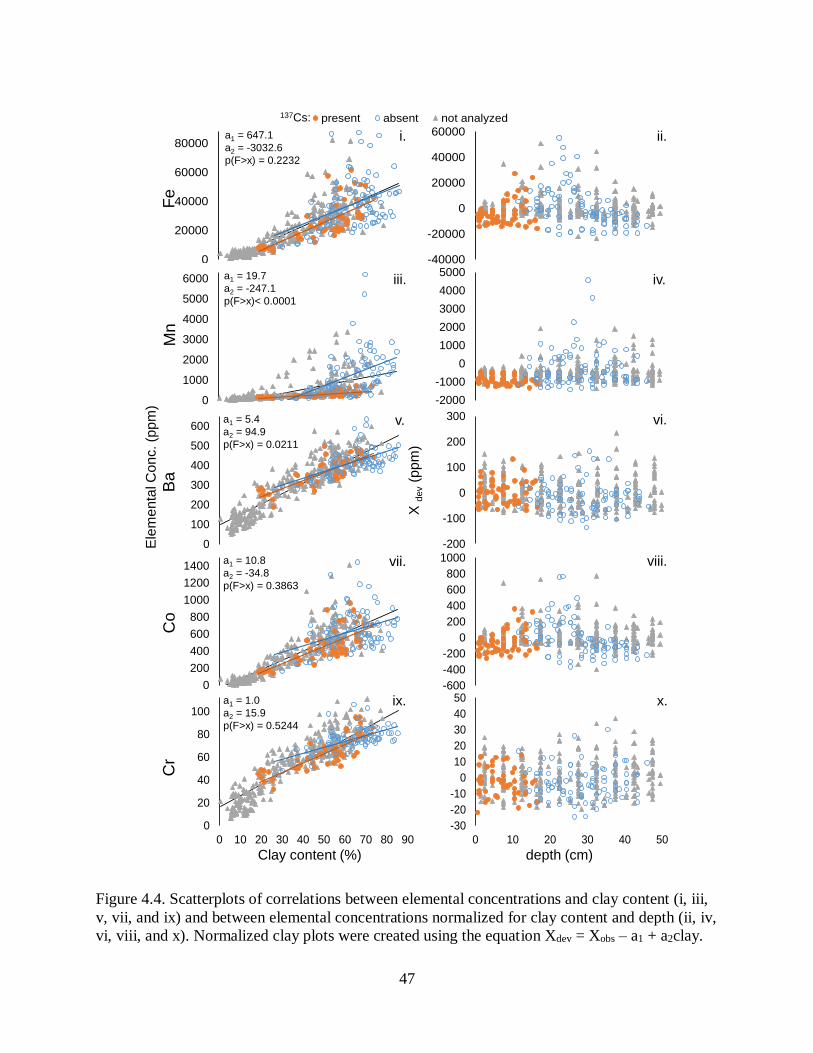
47
Figure 4.4. Scatterplots of correlations between elemental concentrations and clay content (i, iii,
v, vii, and ix) and between elemental concentrations normalized for clay content and depth (ii, iv,
vi, viii, and x). Normalized clay plots were created using the equation Xdev = Xobs – a1 + a2clay.
0
20000
40000
60000
80000
0 10 20 30 40 50 60 70 80 90
Fe
-2000
-1000
0
1000
2000
3000
4000
5000
0 10 20 30 40 50
depth (cm)
-40000
-20000
0
20000
40000
60000
0 10 20 30 40 50
-200
-100
0
100
200
300
0 10 20 30 40 50
-600
-400
-200
0
200
400
600
800
1000
0 10 20 30 40 50
-30
-20
-10
0
10
20
30
40
50
0 10 20 30 40 50
X d
ev
(pp
m)
-2000
-1000
0
1000
2000
3000
0 20 40 60
no data yes no
0
20
40
60
80
100
0 10 20 30 40 50 60 70 80 90
Cr
0
20
40
60
80
100
0 10 20 30 40 50 60 70 80 90
0
200
400
600
800
1000
1200
1400
0 10 20 30 40 50 60 70 80 90
Co
0
200
400
600
800
1000
1200
1400
0 10 20 30 40 50 60 70 80 90
0
1000
2000
3000
4000
5000
6000
0 10 20 30 40 50 60 70 80 90
Mn
0
1000
2000
3000
4000
5000
6000
0 10 20 30 40 50 60 70 80 90
0
100
200
300
400
500
600
0 10 20 30 40 50 60 70 80 90
Ba
0
100
200
300
400
500
600
0 10 20 30 40 50 60 70 80 90
0
20000
40000
60000
80000
0 10 20 30 40 50 60 70 80 90
Ele
me
nta
l Co
nc. (p
pm
)
Clay content (%)
Fe
Mn
Ba
Co
Cr
a1 = 647.1
a2 = -3032.6
p(F>x) = 0.2232
a1 = 19.7
a2 = -247.1
p(F>x)< 0.0001
a1 = 5.4
a2 = 94.9
p(F>x) = 0.0211
a1 = 10.8
a2 = -34.8
p(F>x) = 0.3863
a1 = 1.0
a2 = 15.9
p(F>x) = 0.5244
-2000
-1000
0
1000
2000
3000
0 10 20 30 40 50
present absent not analyzed
Ti
137Cs:
i. ii.
iii. iv.
v. vi.
vii. viii.
ix. x.
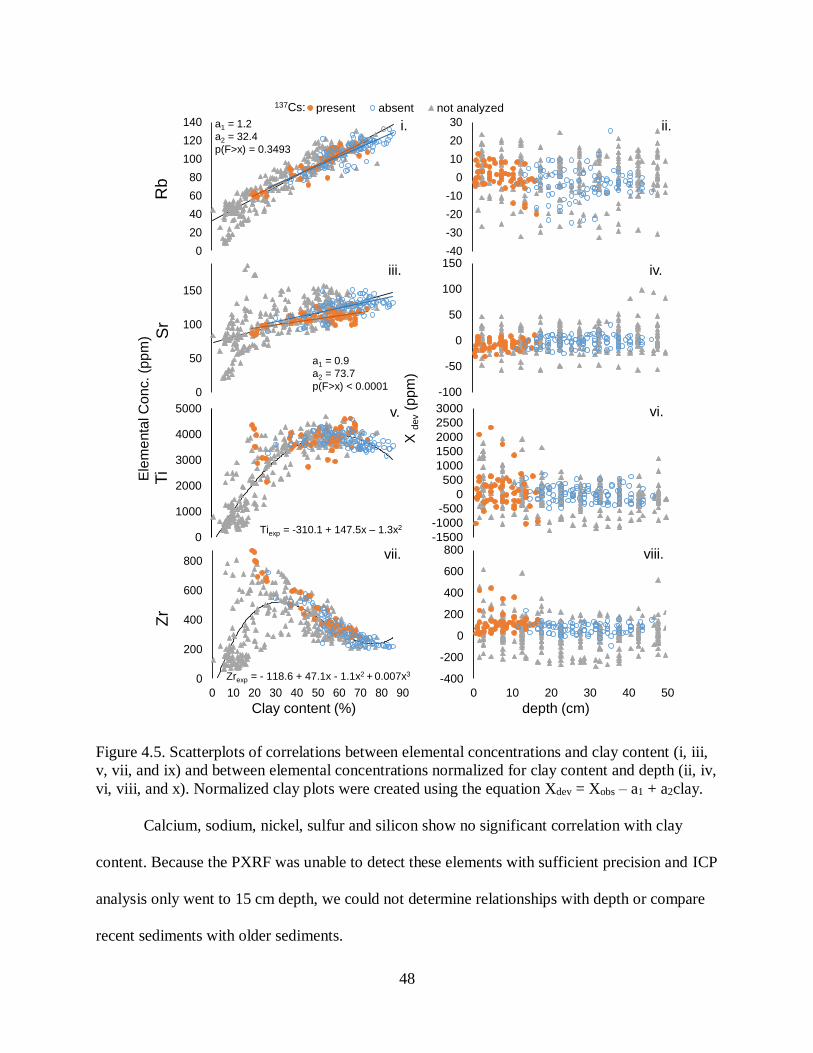
48
Figure 4.5. Scatterplots of correlations between elemental concentrations and clay content (i, iii,
v, vii, and ix) and between elemental concentrations normalized for clay content and depth (ii, iv,
vi, viii, and x). Normalized clay plots were created using the equation Xdev = Xobs – a1 + a2clay.
Calcium, sodium, nickel, sulfur and silicon show no significant correlation with clay
content. Because the PXRF was unable to detect these elements with sufficient precision and ICP
analysis only went to 15 cm depth, we could not determine relationships with depth or compare
recent sediments with older sediments.
depth (cm)
-40
-30
-20
-10
0
10
20
30
0 10 20 30 40 50
-100
-50
0
50
100
150
0 10 20 30 40 50
-1500
-1000
-500
0
500
1000
1500
2000
2500
3000
0 10 20 30 40 50
X d
ev
(pp
m)
-2000
-1000
0
1000
2000
3000
0 10 20 30 40 50
present absent not analyzed
Ti
137Cs:
-400
-200
0
200
400
600
800
0 10 20 30 40 50
Zr
Zrexp = - 118.6 + 47.1x - 1.1x2 + 0.007x3
Ele
me
nta
l C
on
c. (p
pm
)
Rb
Sr
Ti
Zr
Clay content (%)
a1 = 1.2
a2 = 32.4
p(F>x) = 0.3493
a1 = 0.9
a2 = 73.7
p(F>x) < 0.0001 0
50
100
150
0 10 20 30 40 50 60 70 80 90
Sr
0
50
100
150
0 10 20 30 40 50 60 70 80 90
0
20
40
60
80
100
120
140
0 10 20 30 40 50 60 70 80 90
Rb
0
20
40
60
80
100
120
140
0 10 20 30 40 50 60 70 80 90
0
200
400
600
800
0 10 20 30 40 50 60 70 80 90
Zr0
1000
2000
3000
4000
5000
0 10 20 30 40 50 60 70 80 90
Ti
Tiexp = -310.1 + 147.5x – 1.3x2
0
1000
2000
3000
4000
5000
0 10 20 30 40 50 60 70 80 90
0
200
400
600
800
0 10 20 30 40 50 60 70 80 90
i. ii.
iii. iv.
v. vi.
vii. viii.
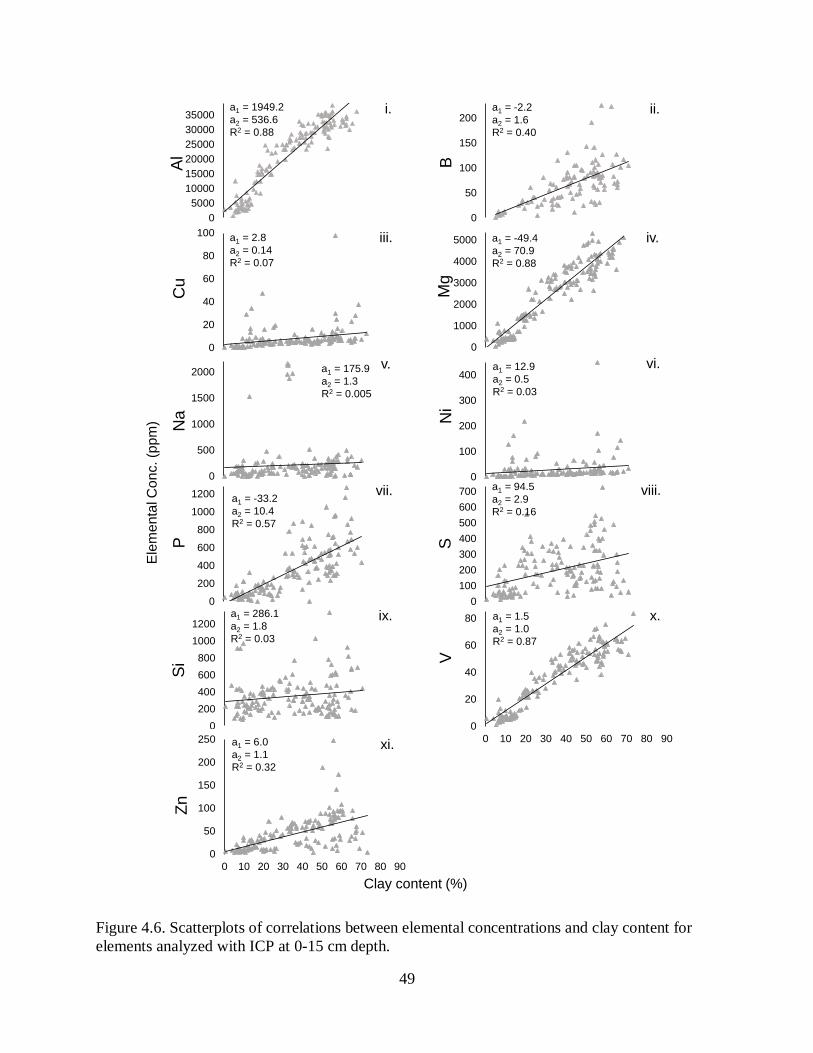
49
Figure 4.6. Scatterplots of correlations between elemental concentrations and clay content for
elements analyzed with ICP at 0-15 cm depth.
0
200
400
600
800
1000
1200
0 10 20 30 40 50 60 70 80 90
0
500
1000
1500
2000
0 10 20 30 40 50 60 70 80 90
0
20
40
60
80
100
0 10 20 30 40 50 60 70 80 90
Ele
me
nta
l Con
c. (p
pm
)
Al
Cu
Na
PS
i
a1 = 1949.2
a2 = 536.6
R2 = 0.88
a1 = 2.8
a2 = 0.14
R2 = 0.07
a1 = 175.9
a2 = 1.3
R2 = 0.005
a1 = 286.1
a2 = 1.8
R2 = 0.03
i.
iii.
v.
vii.
ix.
0
5000
10000
15000
20000
25000
30000
35000
0 10 20 30 40 50 60 70 80 90
0
200
400
600
800
1000
1200
0 10 20 30 40 50 60 70 80 90
a1 = -33.2
a2 = 10.4
R2 = 0.57
ii.
iv.
vi.
viii.
x.
0
50
100
150
200
0 10 20 30 40 50 60 70 80 90
B
a1 = -2.2
a2 = 1.6
R2 = 0.40
0
1000
2000
3000
4000
5000
0 10 20 30 40 50 60 70 80 90
a1 = -49.4
a2 = 70.9
R2 = 0.88
Mg
0
100
200
300
400
0 10 20 30 40 50 60 70 80 90
a1 = 12.9
a2 = 0.5
R2 = 0.03
Ni
0
100
200
300
400
500
600
700
0 10 20 30 40 50 60 70 80 90
S
a1 = 94.5
a2 = 2.9
R2 = 0.16
0
20
40
60
80
0 10 20 30 40 50 60 70 80 90
a1 = 1.5
a2 = 1.0
R2 = 0.87
V
0
50
100
150
200
250
0 10 20 30 40 50 60 70 80 90
Zn
a1 = 6.0
a2 = 1.1
R2 = 0.32
xi.
Clay content (%)
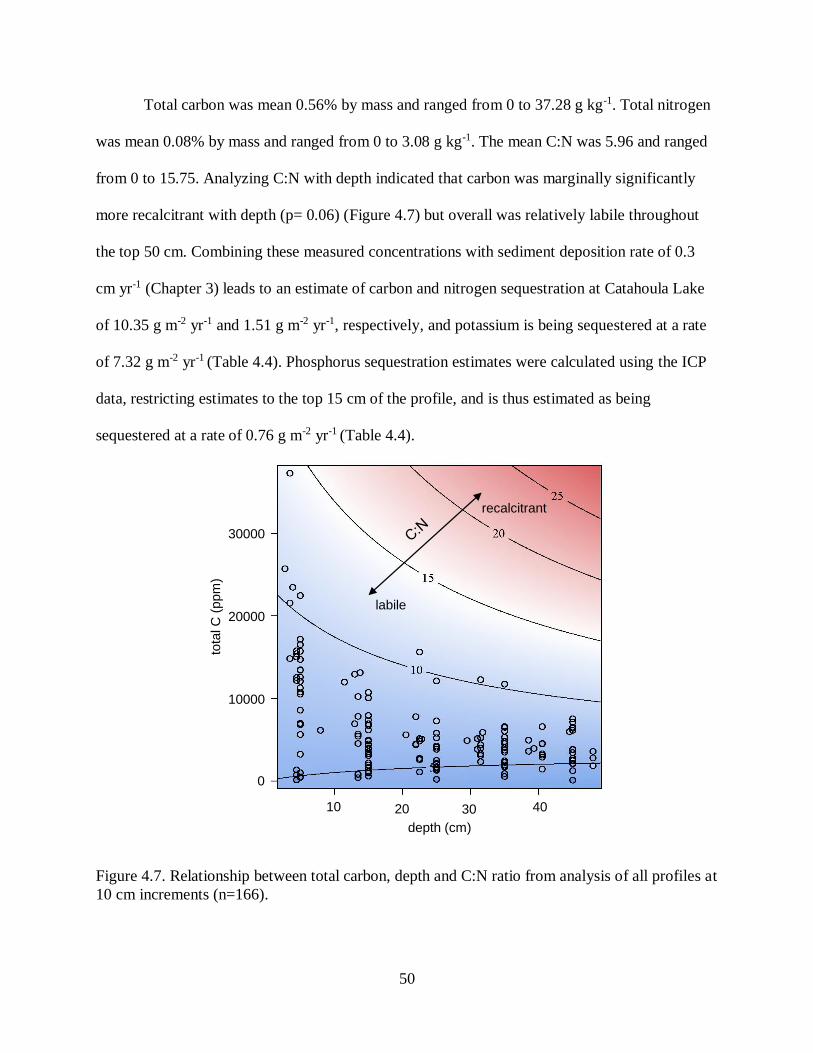
50
Total carbon was mean 0.56% by mass and ranged from 0 to 37.28 g kg-1. Total nitrogen
was mean 0.08% by mass and ranged from 0 to 3.08 g kg-1. The mean C:N was 5.96 and ranged
from 0 to 15.75. Analyzing C:N with depth indicated that carbon was marginally significantly
more recalcitrant with depth (p= 0.06) (Figure 4.7) but overall was relatively labile throughout
the top 50 cm. Combining these measured concentrations with sediment deposition rate of 0.3
cm yr-1 (Chapter 3) leads to an estimate of carbon and nitrogen sequestration at Catahoula Lake
of 10.35 g m-2 yr-1 and 1.51 g m-2 yr-1, respectively, and potassium is being sequestered at a rate
of 7.32 g m-2 yr-1 (Table 4.4). Phosphorus sequestration estimates were calculated using the ICP
data, restricting estimates to the top 15 cm of the profile, and is thus estimated as being
sequestered at a rate of 0.76 g m-2 yr-1 (Table 4.4).
Figure 4.7. Relationship between total carbon, depth and C:N ratio from analysis of all profiles at
10 cm increments (n=166).
depth (cm)
30000
20000
10000
0
10 20 30 40
tota
l C
(ppm
)
recalcitrant
labile
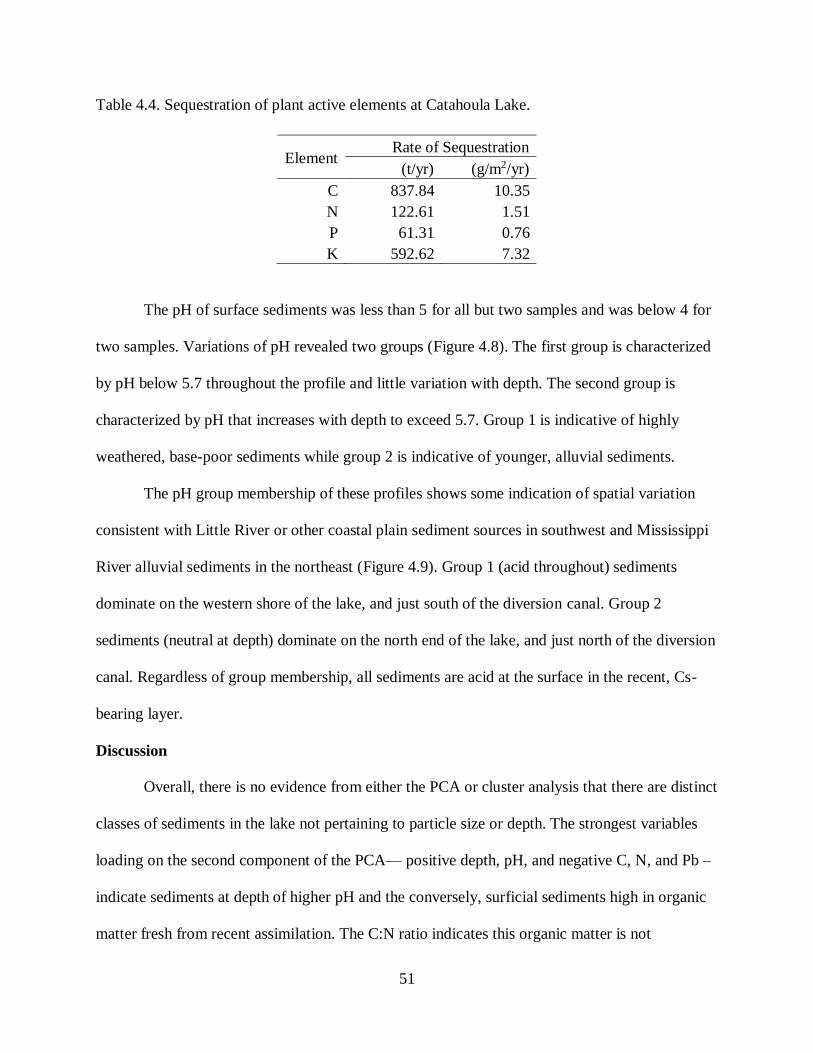
51
Table 4.4. Sequestration of plant active elements at Catahoula Lake.
Element Rate of Sequestration
(t/yr) (g/m2/yr)
C 837.84 10.35
N 122.61 1.51
P 61.31 0.76
K 592.62 7.32
The pH of surface sediments was less than 5 for all but two samples and was below 4 for
two samples. Variations of pH revealed two groups (Figure 4.8). The first group is characterized
by pH below 5.7 throughout the profile and little variation with depth. The second group is
characterized by pH that increases with depth to exceed 5.7. Group 1 is indicative of highly
weathered, base-poor sediments while group 2 is indicative of younger, alluvial sediments.
The pH group membership of these profiles shows some indication of spatial variation
consistent with Little River or other coastal plain sediment sources in southwest and Mississippi
River alluvial sediments in the northeast (Figure 4.9). Group 1 (acid throughout) sediments
dominate on the western shore of the lake, and just south of the diversion canal. Group 2
sediments (neutral at depth) dominate on the north end of the lake, and just north of the diversion
canal. Regardless of group membership, all sediments are acid at the surface in the recent, Cs-
bearing layer.
Discussion
Overall, there is no evidence from either the PCA or cluster analysis that there are distinct
classes of sediments in the lake not pertaining to particle size or depth. The strongest variables
loading on the second component of the PCA— positive depth, pH, and negative C, N, and Pb –
indicate sediments at depth of higher pH and the conversely, surficial sediments high in organic
matter fresh from recent assimilation. The C:N ratio indicates this organic matter is not
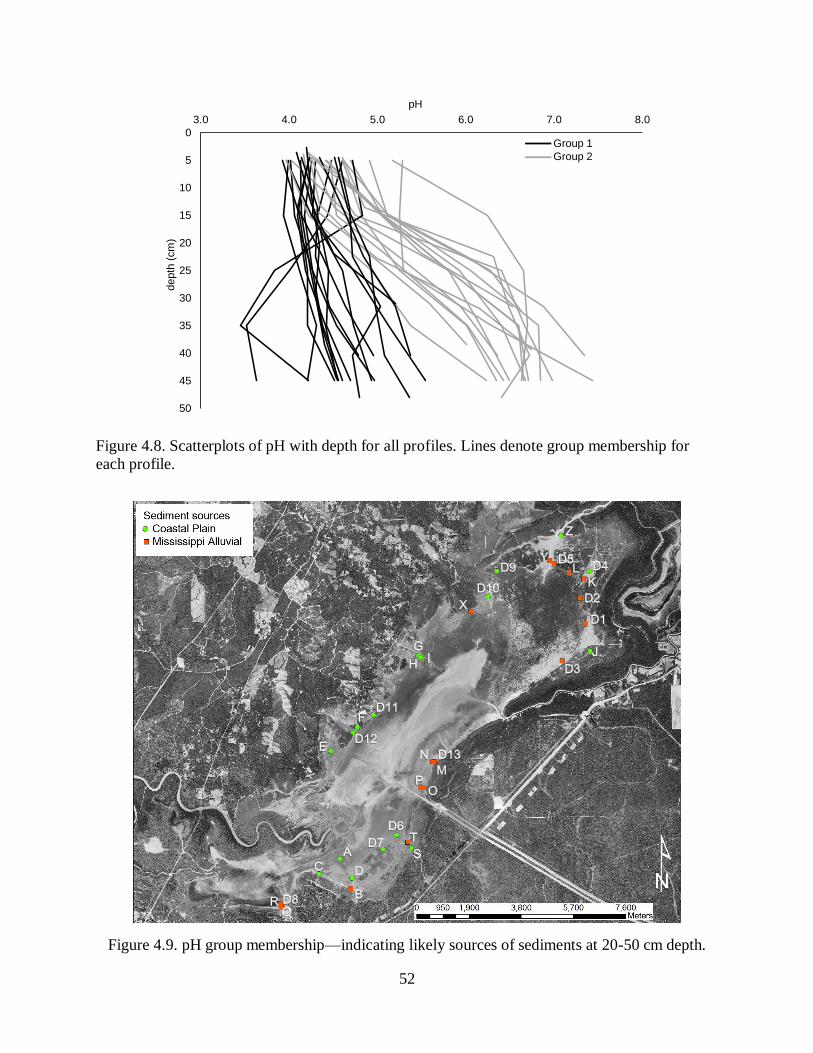
52
Figure 4.8. Scatterplots of pH with depth for all profiles. Lines denote group membership for
each profile.
Figure 4.9. pH group membership—indicating likely sources of sediments at 20-50 cm depth.
0
5
10
15
20
25
30
35
40
45
50
3.0 4.0 5.0 6.0 7.0 8.0
pH
de
pth
(cm
)
Group 1
Group 2
Sediment sources
Coastal Plain
Mississippi Alluvial
pH group
!( 1 (< 5.7)
") 2 (> 5.7)
pH group
!( 1 (< 5.7)
") 2 (> 5.7)
53
accumulating in the lake, and is likely mainly mobilized and removed during drawdown instead
of being sequestered. The strong negative association with lead in the deeper sediments indicates
surficial lead, which is already well known to be the result of lead shot from waterfowl hunters
(Peters, Afton 1993). The reasons for the other variations with depth are less obvious, and
suggest there has been a temporal shift in sediment at Catahoula Lake. The hierarchical cluster
analysis was less useful for analysis of sediments as it complicates the relationship between
depth and particle size. The orthogonality of PCA allowed depth and particle size to exist
together.
Generally higher concentrations of calcium and potassium below the surficial sediments
may be indicative of a historically greater input of Mississippi River alluvial sediments with
Coastal Plain sediments dominating more recently. Mississippi River sediments are high in
smectites, or 2:1 clays, which have high cation exchange capacity. They are also relatively
unweathered so they retain high concentrations of basic cations like Ca2+ and K+, causing their
more basic pH. Coastal plain sediments are higher in kaolinite, or 1:1 clays, which form by
weathering in situ over a long time during pre-glacial time (Sionneau 2008). These sediments are
base poor, and therefore more acidic (Milne, Earley 1958; Autin, Aslan 2001).
The high concentration of zirconium and titanium only at the surface suggests a recent
change in the source of sediment in the past ~50 yr. The change may be an increase in
dominance of coastal plain sediments. Pleistocene sediments are enriched in zirconium and
titanium, which may indicate recent deposition of coastal plain sediments. However, both
zirconium and titanium are known to be highly resistant to weathering and their mobility is still
not well understood (Milnes, Fitzpatrick 1989; Hodson 2002). Alternatively, zirconium and
titanium enrichment could indicate an influx of sediments from western sources via the Red
54
River. Zirconium concentration is dependent on the presence of zircon, its main mineral form in
rocks and sediments (Milnes, Fitzpatrick 1989), which is present in higher amounts in sediments
of the Red River compared to the Mississippi River (Davies, Moore 1970; Mange, Otvos 2005).
Titanium, which is associated with high zirconium in the clay fraction of sediments (Milnes,
Fiztpatrick 1989), also is enriched in sediments from central Texas which were derived between
10,000 and 7,000 BP (Davies, Moore 1970). It may be possible connectivity to the Red River has
been maintained more than has connectivity to the Mississippi River, because the Old River
Control Structures and incision of the upper Atchafalaya River have reduced the backwater
effect into Catahoula Lake (Willis 2009).
The increase in manganese with depth could be indicative of translocation during
reducing conditions. Manganese is subject to changes in oxidation-reduction conditions that
affect plant availability and solubility. When oxidation is occurring, manganese is immobile in
sediment, but it is released into an aqueous phase during reducing conditions (Gambrell 1994,
LaForce et al 2002) and may be translocated down the profile (Linnik, Zubenko 2002).
In addition to evidence in the depth-dependent variation in zirconium, calcium, and
potassium, the pH data suggested two sources of sediment deposition at Catahoula Lake. In
general, sediments were more acidic at the surface, which might indicate effects of weathering
and organic matter, but organic matter is low and acidity at depth seems unlikely to be the
product of weathering in situ because of sediment mobility and frequent reducing conditions.
Therefore, we interpret acidity as being inherited from parent sediment material. Group 1
sediments (acid throughout) are consistent with the chemistry of the coastal plain. The sediment
load carried by the Little River, indicated by Una and Urbo series soils just upstream from
Catahoula Lake, both include very strongly acid horizons (4.5-5.0, NRCS 1993) and consist of
55
highly weathered Coastal Plain parent materials. Group 2 (neutral at depth) sediments are
consistent with the sediment load carried by the Mississippi River and would include the Sharkey
and Forestdale series soils. These series both include slightly acid (6.1-6.5) horizons near the
surface, with slightly alkaline sediments (7.4-7.8) deeper sediments (NRCS 1993).
Thus, it appears that coastal plain sediments have dominated the lake for about 60 years
(i.e., the same depth and same timeframe as 137Cs deposition) at the expense of Mississippi River
sediments. This change is consistent with the gradual loss of connectivity to the Mississippi and
Red rivers via hydrologic modification such as navigation locks on the Black River and
channelization and base level lowering of the Atchafalaya River (Willis 2009). On the other
hand, the Little River is captive and all sediments must at least transit Catahoula Lake. It
therefore appears that the decrease in sediment delivery to the lake over the past ~60 yr (Chapter
3) is more likely a result of lost connection to the Mississippi and Red rivers than decreases from
the Little River.
Carbon and nitrogen decrease with depth at Catahoula Lake, showing larger amounts at
the surface where fresh organic matter exists, but very little storage of carbon and nitrogen in the
lower sediments. Carbon sequestration is very low at Catahoula Lake at just 10.4 g m-2 yr-1.
Mitsch et al (2010) compiled results of carbon sequestration studies from various types of
wetland ecosystems and found a wide range from 8 g m-2 year-1 in a high-latitude peat land
(Ovenden 1990) to 260 g m-2 year-1 in a humid tropical wetland in Costa Rica (Bernal, Mitsch
2008). Using C:N ratios we can also determine the source of this carbon (Das et al 2008, Kenney
et al 2011). C:N ratios at Catahoula Lake are also low with mean 6.07, which is within the range
of ~4-12 characteristic of primary producers like algae and phytoplankton or macrophytes (Das
et al 2008).
56
Total nitrogen in the sediments of Catahoula Lake is low, which may be indicative of
rapid denitrification and uptake of nitrogen by plants (Clarke, Wharton 2001) or simply low
nitrogen loading. Howard-Williams (1985) reported total nitrogen in the top 20 cm of the
sediments of several different wetland types to range between 370–6380 kg ha-1. At Catahoula
Lake it is an estimated 1200 kg ha-1. The average percentage of total nitrogen in sediments at
Catahoula Lake (0.08%) is comparable to low energy, temperate streams found in lowland
England that range from 0.02% - 0.52% (Clarke, Wharton 2001).
There has been little work done to evaluate edaphic relationships between sediments and
water-elm or swamp-privet that would aid in interpreting the sediment chemistry results in terms
of their effects on expansion of woody vegetation in Catahoula Lake. Patterson (1997),
concluded that water-elm was positively correlated to high exchangeable potassium, low
calcium, and high pH; and that swamp-privet was positively correlated with high pH and Red
River alluvium rather than Mississippi River alluvium. Rayner (1974), on the other hand, found
that soils of mostly -pure stands of water-elm in South Carolina were very low in pH, around
4.4-4.8 and low in nutrients and basic cations. Given the contradictions in these findings, it is
difficult to conclude whether a shift to dominance of coastal-plain sediments may favor
establishment of these species. However, the conditions of Catahoula Lake are trending toward
those typical of pure water-elm in South Carolina.
There are strengths and weaknesses of both of our two elemental analysis methods, ICP
and PXRF. The PXRF has difficulty detecting low atomic number elements, particularly those
below potassium (Migliori 2011). The lack of homogeneity of efficiency for some elements is
also a concern (Kalnicky, Singhvi 2001; Zhu 2011). However, the instrument we used is capable
of quick, in-situ analysis of total titanium, barium, lead, potassium, calcium, chromium, iron,
57
cobalt, and manganese, and with results highly correlated with ICP (Appendix B). Although ICP
is generally accepted as the superior method for analysis of elemental concentration, it is not a
total analysis as it is limited by the digestion method used on samples (Soltanpouri 1996). We
used US EPA method 3050B, which is generally satisfactory for digesting recoverable silver,
arsenic, barium, beryllium, cadmium, chromium, copper, mercury, manganese, molybdenum,
nickel, lead, antimony, selenium, zinc, aluminum, calcium, iron, potassium, magnesium, and
phosphorus (Chen, Ma 1998). However, this digestion method is incomplete and some silicate
minerals and phosphorus are not dissolved. (Chen, Ma 1998; Richardson, Reddy 2013; Gambrell
2013; Soltanpour 1996). Thus, elements bound in silicate structures and phosphorus are likely
underestimates of total concentration but relatively better as estimates of exchangeable
concentrations.
The findings of this research point to two needed research projects. First, further study of
phosphorus at Catahoula Lake would be of great benefit in understanding nutrient dynamics. The
PXRF was unable to give us precise results for phosphorus and ICP was only performed on the
top 15 cm of all profiles. Because phosphorus is an important limiting nutrient in many
ecosystems, it would be useful to gather data with greater depth to understand whether its
concentrations have changed over time. Second, future research at Catahoula Lake should also
include a study of the mineralogy of sediments. Although elemental concentrations like those of
calcium, potassium, titanium, and zirconium can give us some clues to the mineralogy, a study of
the minerals themselves would be a more direct approach to identifying sediment sources. In
particular, clay mineralogy and analysis of zircon crystals may reveal more about sediment
entering the lake.
58
Conclusions
Recent sediments at Catahoula Lake are fine-textured and likely of Coastal Plain origins.
Compared to deeper sediments, surface sediments are generally higher in titanium and
zirconium; lower in calcium and potassium; and lower in pH. This chemistry occurs consistently
across the lake bed on the surface, but below recent (~60 yr) sediments, 51% of sediment profiles
are higher in pH and thus show influence of Mississippi River alluvial sediments. These basal
Mississippi River alluvial sediments increase in pH toward neutral with depth. Mississippi River
Alluvial Valley sediments are more prevalent in the northern and eastern parts of the lake while
basal Coastal Plain sediments are more prevalent in the west and southwest. Coastal Plain
sediments are likely entering the lake from the Little River and small streams along the bluffs to
the west, which are all captive drainages into the lake, while Mississippi River Alluvial Valley
sediments can enter through the diversion canal or French Fork of Little River as backwater
flow. The recent shift to dominance of coastal plain sediments suggests hydrologic modification
has disconnected the lake from sediment-bearing flows from the Mississippi River Alluvial
Valley.
Carbon and nitrogen sequestration is within the range typical of wetlands, but at the
extreme low end. Carbon and nitrogen relationships indicate that the carbon that is present is
labile. Total nitrogen in the sediments of Catahoula Lake are low which is indicative of rapid
denitrification and uptake of nitrogen by plants and accumulation into plant tissue and no
excessive nitrogen loading.
References – Chapter 4
Autin, W.J., Aslan, A., 2001, Alluvial Pedogenesis in Pleistocene and Holocene Mississippi
River Deposits: Effects of Relative Sea-level Change: Geological Society of America
Bulletin, ed. 113, v. 11, p. 1456-1466.
59
Bedford, B.L., Walbridge, M.R., Aldous, A., 1999, Patterns in nutrient availability and plant
diversity of temperate North American wetlands: Ecology, v. 80, p. 2151-2169.
Bernal, B., and Mitsch, W.J., 2008, Comparing carbon sequestration rates in tropical and
temperate wetlands using radiometric dating: Abstracts, Soil Science Society of
America/Geological Society of America Annual Meeting, Houston, Texas.
Briggs, J.M., Knapp, A.K., Blair, J.M., Heisler, J.L., Hoch, G.A., Lett, M.S., McCarron, J.K., An
Ecosystem in Transition: Causes and Consequences of the Conversion of Mesic
Grassland to Shrubland: BioScience, v. 55, p. 243 – 254.
Casanova, M.T., Brock, M.A., 2000, How do depth, duration and frequency of flooding
influence the establishment of wetland plant communities?: Plant Ecology, v. 147, p.
237-250.
Chen, M., Ma, L.Q., 1998, Comparison of four USEPA digestion methods for trace metal
analysis using certified and Florida soils: Journal of Environmental Quality, v. 27, p.
1294-1300.
Clarke, S.J., Wharton, G., 2001, Sediment nutrient characteristics and aquatic macrophytes in
lowland English rivers: The Science of the Total Environment, v. 266, p. 103-112.
Das, S.K., Routh, J., Roychoudhury, A.N., Val Klump, J., 2008, Elemental (C, N, H and P) and
stable isotope (δ15 N and δ13C) signatures in sediments from Zeekoevlei, South Africa: a
record of human intervention in the lake: Journal of Paleolimnology, v. 39, p. 349-360.
Davies, D.K., Moore, R., 1970, Dispersal of Mississippi Sediment in the Gulf of Mexico: Journal
of Sedimentary Petrology, v. 40, p. 339-353.
Gambrell, R.P., 2013, Total Heavy Metal Analyses and Extractions in DeLaune, R.D., Reddy,
K.R., Richardson, C.J., Megonigal, J.P. eds., Methods of Biogeochemistry of Wetlands,
Soil Science Society of America, p. 775-796
Hodson, M.E., 2002, Experimental evidence for mobility of Zr and other trace elements in soils:
Geochimica et Cosmochimica Acta, v. 66, p. 819-828.
Howard-Williams, C., 1985, Cycling and retention of Nitrogen and phosphorus in wetlands: a
theoretical and applied perspective: Freshwater Biology, v. 15, p. 391-431.
Kalnicky, D.J., Singhvi, R., 2001, Field portable XRF analysis of environmental samples:
Journal of Hazardous Materials, v. 83, p. 93-122.
60
Kenney, W.F., Brenner, M., Curtis, J.H., Schelske, C.L., 2011, Identifying sources of organic
matter in sediments of shallow lakes using multiple geochemical variables: Journal of
Paleolimnology, v. 44, p. 1039-1052.
Koerselman, W., Meuleman, F.M., 1996, The vegetation N:P ratio: a new tool to detect the
nature of nutrient limitation: Journal of Applied Ecology, v. 33, p. 1441-1450.
La Force, M.J., Hansel, C.M., Fendorf, S., 2002, Seasonal Transformations of Manganese in a
Palustrine Emergent Wetland: Soil Science Society of America Journal, v. 66, p. 1377-
1389.
Linnik, P.M., Zubenko, I.B., 2002, Role of bottom sediments in the secondary pollution of
aquatic environments by heavy-metal compounds: Lakes and Reservoirs: Research and
Management, v. 5, p. 11-21.
Mange, M.A., Otvos, E.G., 2005, Gulf Coastal Plain evolution in West Louisiana: Heavy mineral
provenance and Pleistocene alluvial chronology: Sedimentary Geology, v. 182, p. 29-57.
McCune, B., Grace, J.B., 2002, Analysis of Ecological Communities, MjM Software Design,
Gleneden Beach, Oregon, p.119.
Migliori, A., Bonanni, P., Carraresi, L., Grassi, N., Mando, P.A., 2011, A novel portable XRF
spectrometer with range of detection extended to low-Z elements: X-Ray Spectrometry,
v. 40, p. 107-112.
Milne, I.H., Earley, J.W., 1958, Effect of Source and Environment on Clay Minerals: Bulletin of
the American Association of Petroleum Geologists, v. 42, p. 328-338.
Milnes, A.R., Fitzpatrick, R.W., 1989, Titanium and Zirconium Minerals, in Klute, E.A., ed.,
Methods of Soil Analysis: Part 1 - Physical and Mineralogical Methods. Soil Science
Society of America, p. 1131-1205.
Mitsch, W.J., Nahlik, A., Wolski, P., Bernal, B., Zhang, L., Ramberg, L., 2010, Tropical
Wetlands: Seasonal Hydrologic Pulsing, Carbon Sequestration, and Methane Emissions:
Wetlands Ecology and Management, v. 18, p. 573-586.
Nilsson, C., Berggren, K, 2014, Alterations of Riparian Ecosystems Caused by River Regulation:
BioScience, v. 9, p. 783 – 792.
Nilsson, C., Svedmark, M., 2002, Basic Principles and Ecological Consequences of Changing
Water Regimes: Riparian Plant Communities: Environmental Management, v. 30, p. 468-
480.
61
NRCS Soil Survey Division Staff, 1993, Soil survey manual, Soil Conservation Service, U.S.
Department of Agriculture Handbook 18.
Ovenden, L., 1990, Peat accumulation in northern wetlands: Quaternary Research, v. 33, p. 377-
386.
Patterson, W.B., 1997, Vegetation, Soils, and Hydrology of Central Louisiana Bottomland
Hardwood Forest Types, University of Tennessee, Knoxville, Tennessee, p. 1-247.
Peters, M. S., Afton, A.D., 1993, Effects of deep tillage on redistribution of lead shot and chufa
flatsedge at Catahoula Lake, Louisiana: Wildlife Society Bulletin, v. 21, p. 471-479.
Rayner, D.A., 1976, A Monograph Concerning the Water-Elm, Planera Aquatica (Walt.) J.F.
Gmelin (Ulmaceae), University of South Carolina, Columbia, p. 1-163.
Reddy, K.R., Chua, T., Richardson, C.J., 2013, Organic Phosphorus Mineralization in Wetland
Soils in DeLaune, R.D., Reddy, K.R., Richardson, C.J., and Megonigal, J.P. eds.,
Methods of Biogeochemistry of Wetlands, Soil Science Society of America, p. 775-796
Reisinger, A.J., Blair, J.M., Rice, C.W., Dodds, W.K., 2013, Woody Vegetation Removal
Stimulates Riparian and Benthic Denitrification in Tallgrass Prairie: Ecosystems, v. 16, p.
547-560.
Saunders, D.L., Kalff, J., 2001, Nitrogen retention in wetlands, lakes and rivers: Hydrobiologia,
v. 443, p. 205-212.
Shafroth, P.B., Friedman, J.M., Auble, G.T., Scott, M.L., Braatne, J.H., 2002, Potential
Responses of Riparian Vegetation to Dam Removal: BioScience, v. 52, p. 703 – 712.
Sionneau, T., Bout-Roumazeilles, V., Biscaye, P.E., Van Vliet-Lanoe, B., Bory, A., 2008, Clay
mineral distributions in and around the Mississippi River watershed and Northern Gulf of
Mexico: sources and transport patterns: Quaternary Science Reviews, v. 27, p. 1740-
1751.
Soltanpour, P.N., Johnson, G.W., Workman, S.M., Jones, J.B., Jr., Miller, R.O., 1996, in, Sparks,
D.L, Page, A.L., Helmke, P.A., Loeppert, R.H., eds., Methods of Soil Analysis: Part 3 -
Chemical Methods, Soil Science Society of America, p. 91-139.
Taggart, M.S., Jr., Kaiser, A.D., Jr., 1960, Clay Mineralogy of Mississippi River Deltaic
Sediments: Bulletin of the Geological Society of America, v. 71., p. 521-530.
62
Tedford, R. A., 2009, A multi-proxy approach to investigating the latest Holocene (~4,500 yrs.
BP) vegetational history of Catahoula Lake, Louisiana, Louisiana State University, Baton
Rouge, La, p. 1-382.
Thomas, G.W., 1996, Soil pH and Soil Acidity, in Sparks, D.L., Page, A.L., Helmke, P.A.,
Loeppert, R.H., eds., Methods of Soil Analysis: Part 3 – Chemical Methods. Soil Science
Society of America, p. 475-490.
Toner, M., Keddy, P., 1997, River Hydrology and Riparian Wetlands: A Predictive Model for
Ecological Assembly: Ecological Applications, v. 7, p. 236-246.
Weindorf, D.C., 2008, An Update of the Field Guide to Louisiana Soil Classification, LSU
AgCenter Research Bulletin #889.
Willis, F. L., 2009, A Multidisciplinary Approach for Determining the Extents of the Beds of
Complex Natural Lakes in Louisiana, University of New Orleans, New Orleans, p. 1-182.
Zedler, J.B., Kercher, S., 2004, Causes and Consequences of Invasive Plants in Wetlands:
Opportunities, Opportunists, and Outcomes: Critical Reviews in Plant Sciences, v. 23, p.
431-452.
Zhu, Y., Weindorf, D.C., Zhang, W., 2011, Characterizing soils using a portable X-ray
fluorescence spectrometer: 1. Soil texture: Geoderma, v. 167-168, p. 167-177.
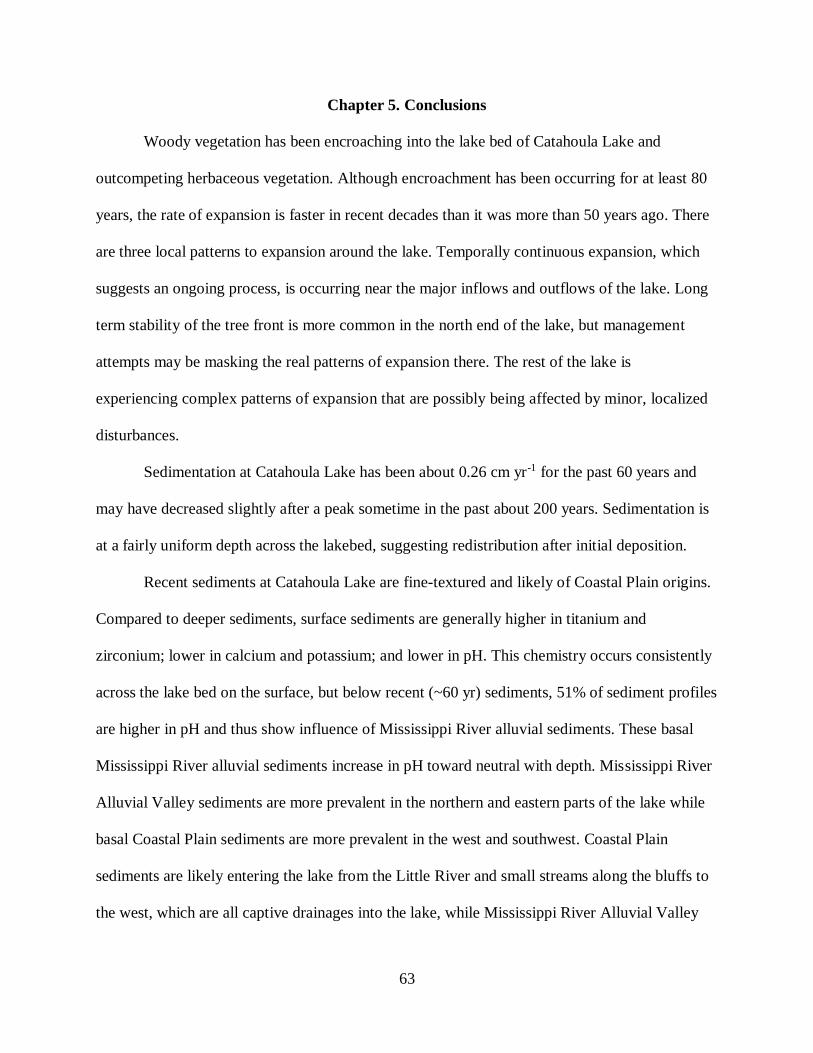
63
Chapter 5. Conclusions
Woody vegetation has been encroaching into the lake bed of Catahoula Lake and
outcompeting herbaceous vegetation. Although encroachment has been occurring for at least 80
years, the rate of expansion is faster in recent decades than it was more than 50 years ago. There
are three local patterns to expansion around the lake. Temporally continuous expansion, which
suggests an ongoing process, is occurring near the major inflows and outflows of the lake. Long
term stability of the tree front is more common in the north end of the lake, but management
attempts may be masking the real patterns of expansion there. The rest of the lake is
experiencing complex patterns of expansion that are possibly being affected by minor, localized
disturbances.
Sedimentation at Catahoula Lake has been about 0.26 cm yr-1 for the past 60 years and
may have decreased slightly after a peak sometime in the past about 200 years. Sedimentation is
at a fairly uniform depth across the lakebed, suggesting redistribution after initial deposition.
Recent sediments at Catahoula Lake are fine-textured and likely of Coastal Plain origins.
Compared to deeper sediments, surface sediments are generally higher in titanium and
zirconium; lower in calcium and potassium; and lower in pH. This chemistry occurs consistently
across the lake bed on the surface, but below recent (~60 yr) sediments, 51% of sediment profiles
are higher in pH and thus show influence of Mississippi River alluvial sediments. These basal
Mississippi River alluvial sediments increase in pH toward neutral with depth. Mississippi River
Alluvial Valley sediments are more prevalent in the northern and eastern parts of the lake while
basal Coastal Plain sediments are more prevalent in the west and southwest. Coastal Plain
sediments are likely entering the lake from the Little River and small streams along the bluffs to
the west, which are all captive drainages into the lake, while Mississippi River Alluvial Valley
64
sediments can enter through the diversion canal or French Fork of Little River as backwater
flow. The recent shift to dominance of coastal plain sediments suggests hydrologic modification
has disconnected the lake from sediment-bearing flows from the Mississippi River Alluvial
Valley.
Carbon and nitrogen sequestration is low compared to other wetlands. C:N ratios indicate
that the organic matter that is present is labile and related to recent primary production rather
than sequestered, older organic matter. Total nitrogen in the sediments of Catahoula Lake is low,
which may be indicative of rapid denitrification and uptake of nitrogen by or simply low
nitrogen loading.
Compared to its condition prior to hydrologic alterations beginning in the 1920’s,
Catahoula Lake is about 15 cm shallower and the chemical composition of sediments is more
acidic. Although these results are not sufficient to link these differences directly to ecological
changes, it is likely the altered sedimentary and hydrologic environment is contributing to the
increased dominance of woody vegetation.
References – Entire Thesis
Autin, W.J., Aslan, A., 2001, Alluvial Pedogenesis in Pleistocene and Holocene Mississippi
River Deposits: Effects of Relative Sea-level Change: Geological Society of America
Bulletin, ed. 113, v. 11, p. 1456-1466.
Bedford, B.L., Walbridge, M.R., Aldous, A., 1999, Patterns in nutrient availability and plant
diversity of temperate North American wetlands: Ecology, v. 80, p. 2151-2169.
Bernal, B., Mitsch, W.J., 2008, Comparing carbon sequestration rates in tropical and temperate
wetlands using radiometric dating: Abstracts, Soil Science Society of
America/Geological Society of America Annual Meeting, Houston, Texas.
Brenner, M., Kenney, F., 2013. Dating Wetland Sediment Cores, in DeLaune, R.D., Reddy,
K.R., Richardson, C.J., Megonigal, J.P. eds., Methods of Biogeochemistry of Wetlands,
Soil Science Society of America, p. 879-900.
65
Briggs, J.M., Knapp, A.K., Blair, J.M., Heisler, J.L., Hoch, G.A., Lett, M.S., McCarron, J.K., An
Ecosystem in Transition: Causes and Consequences of the Conversion of Mesic
Grassland to Shrubland: BioScience, v. 55, p. 243 – 254.
Brown, C. A., 1943, Vegetation and lake level correlations at Catahoula Lake, Louisiana: The
Geographical review, v. 33, p. 435-445.
Bruser, J. F., 1995, Ecology of Catahoula Lake Plant Communities in Relation to an
Anthropogenic Water Regime, Louisiana State University, Baton Rouge, p. 1-100.
Callaway, J.C., DeLaune, R.D., Patrick, W.H., Jr., 1996, Chernobyl 137Cs used to determine
sediment accretion rates at selected northern European coastal wetlands: Limnology and
Oceanography, ed. 41, v. 3, p. 444-450.
Casanova, M.T., Brock, M.A., 2000, How do depth, duration and frequency of flooding
influence the establishment of wetland plant communities?: Plant Ecology, v. 147, p.
237-250.
Chen, M., Ma, L.Q., 1998, Comparison of four USEPA digestion methods for trace metal
analysis using certified and Florida soils: Journal of Environmental Quality, v. 27, p.
1294-1300.
Choi, Y.D., Bury, C., 2003, Process of floristic degradation in urban and suburban wetlands in
Northwestern Indiana, USA: Natural Areas Journal, v. 23, p. 320-331.
Clarke, S.J., Wharton, G., 2001, Sediment nutrient characteristics and aquatic macrophytes in
lowland English rivers: The Science of the Total Environment, v. 266, p. 103-112.
Das, S.K., Routh, J., Roychoudhury, A.N., Val Klump, J., 2008, Elemental (C, N, H and P) and
stable isotope (δ15 N and δ13C) signatures in sediments from Zeekoevlei, South Africa: a
record of human intervention in the lake: Journal of Paleolimnology, v. 39, p. 349-360.
Davies, D.K., Moore, R., 1970, Dispersal of Mississippi Sediment in the Gulf of Mexico: Journal
of Sedimentary Petrology, v. 40, p. 339-353.
De Selm, H.R., Shanks, R.E., 1967, Vegetation and Floristic Changes on a Portion of White Oak
Lake Bed: Ecology, v. 48, p. 419-425.
DeLaune, R. D., Patrick, W.H., Buresh, R.J., 1978, Sedimentation rates determined by Cs-137
dating in a rapidly accreting salt marsh: Nature, v. 275, p. 532-533.
Fisk, H.N., 1944, Geological Investigation of the Alluvial Valley of the Lower Mississippi River
Conducted for the Mississippi River Commission, War Department, Corps of Engineers,
U.S. Army, p. 28-29.
66
Fredrickson, L.H, Taylor, T.S., 1982, Management of Seasonally Flooded Impoundments for
Wildlife: U.S. Department of the Interior Fish and Wildlife Service, Resource publication
148.
Gambrell, R.P., 2013, Total Heavy Metal Analyses and Extractions in DeLaune, R.D., Reddy,
K.R., Richardson, C.J., Megonigal, J.P. eds., Methods of Biogeochemistry of Wetlands,
Soil Science Society of America, p. 775-796.
Gardner, R., Connolly, K.D., 2007, The Ramsar Convention on Wetlands: Assessment of
International Designations Within the United States: Environmental Law Reviewer ELR
10089, ed. 2, v. 37, p. 1-25.
Gee, G. W., Bauder, J.W., 1986, Particle-size Analysis, in Klute, E.A., ed., Methods of Soil
Analysis: Part 1 - Physical and Mineralogical Methods. Soil Science Society of America,
p. 383-411.
Gleason, R., Euliss, N., Hubbard, D., Duffy, W., 2003, Effects of Sediment Load on Emergence
of Aquatic Invertebrates and Plants from Wetland Soil Egg and Seed Banks: Wetlands, v.
23, p. 26-34.
Hartleb, C. F., Madswen, J.D., Boylen, C.W., 1993, Environmental Factors Affecting Seed
Germination in Myriophyllum spicatum L.: Aquatic Botany, v. 45, p. 15-25.
Havlin, J., Beaton, J.D., Tisdale, S.L., Nelson, W.L, 2005, Soil Fertility and Fertilizers: An
Introduction to Nutrient Management, Seventh Edition, Pearson Education Inc.
Hillel, D., 2004, Introduction to Environmental Soil Physics, Elsevier Academic Press.
Hodson, M.E., 2002, Experimental evidence for mobility of Zr and other trace elements in soils:
Geochimica et Cosmochimica Acta, v. 66, p. 819-828.
Horst, J., 2012, Defining Catahoula Lake: Louisiana Sportsman, December 01, 2012,
http://www.louisianasportsman.com/details.php?id=4612.
Howard-Williams, C., 1985, Cycling and retention of Nitrogen and phosphorus in wetlands: a
theoretical and applied perspective: Freshwater Biology, v. 15, p. 391-431.
Jefferson, T., 1806, Message from the President of the United States, Communicating
Discoveries Made in Exploring the Missouri, Red River, and Washita, by Captains Lewis
and Clark, Doctor Sibley, and Mr. Dunbar; with a Statistical Account of the Countries
Adjacent, New York: Printed by Hopkins and Seymour, 1806,
www.americanjourneys.org/aj-090/.
Joshi, S., 2012, Evaluation of Growth Rates and Establishment Patterns of Water-elm (Planera
Aquatica) and Baldcypress (Taxodium Distichum) in Response to Hydrologic and
67
Climatic Conditions at Catahoula Lake, Louisiana. Louisiana State University, Baton
Rouge, p. 1-58.
Jurik, T. W., Wang, S.C., van der Valk, A., 1994, Effects of Sediment Load on Seedling
Emergence From Wetland Seed Banks: Wetlands, v. 14, p. 159-165.
Kalnicky, D.J., Singhvi, R., 2001, Field portable XRF analysis of environmental samples:
Journal of Hazardous Materials, v. 83, p. 93-122.
Kenney, W.F., Brenner, M., Curtis, J.H., Schelske, C.L., 2011, Identifying sources of organic
matter in sediments of shallow lakes using multiple geochemical variables: Journal of
Paleolimnology, v. 44, p. 1039-1052.
Koerselman, W., Meuleman, F.M., 1996, The vegetation N:P ratio: a new tool to detect the
nature of nutrient limitation: Journal of Applied Ecology, v. 33, p. 1441-1450.
Kummu, M., Penny, D., Sarkkula, J., Koponen, J., 2008, Sediment: Curse or Blessing for Tonle
Sap Lake?: AMBIO: A Journal of the Human Environment, ed. 37, v. 3, p. 158-163.
La Force, M.J., Hansel, C.M., Fendorf, S., 2002, Seasonal Transformations of Manganese in a
Palustrine Emergent Wetland: Soil Science Society of America Journal, v. 66, p. 1377-
1389.
Linnik, P.M., Zubenko, I.B., 2002, Role of bottom sediments in the secondary pollution of
aquatic environments by heavy-metal compounds: Lakes and Reservoirs: Research and
Management, v. 5, p. 11-21.
Lotz, B.A., 2000, Growth Rates of Water-elm and Swamp-Privet at Catahoula Lake, Louisiana,
Louisiana State University, Baton Rouge, p. 1-46.
Mange, M.A., Otvos, E.G., 2005, Gulf Coastal Plain evolution in West Louisiana: Heavy mineral
provenance and Pleistocene alluvial chronology: Sedimentary Geology, v. 182, p. 29-57.
McCune, B., Grace, J.B., 2002, Analysis of Ecological Communities, MjM Software Design,
Gleneden Beach, Oregon, p.119.
Meriwether, J.R., 2007, Cesium Core Study at Catahoula Lake, Report to U.S. Geological
Survey, National Wetlands Research Center. Unpublished data.
Migliori, A., Bonanni, P., Carraresi, L., Grassi, N., Mando, P.A., 2011, A novel portable XRF
spectrometer with range of detection extended to low-Z elements: X-Ray Spectrometry,
v. 40, p. 107-112.
Milne, I.H., Earley, J.W., 1958, Effect of Source and Environment on Clay Minerals: Bulletin of
the American Association of Petroleum Geologists, v. 42, p. 328-338.
68
Milnes, A.R., Fitzpatrick, R.W., 1989, Titanium and Zirconium Minerals, in Klute, E.A., ed.,
Methods of Soil Analysis: Part 1 - Physical and Mineralogical Methods. Soil Science
Society of America, p. 1131-1205.
Mitsch, W.J., Nahlik, A., Wolski, P., Bernal, B., Zhang, L., Ramberg, L., 2010, Tropical
Wetlands: Seasonal Hydrologic Pulsing, Carbon Sequestration, and Methane Emissions:
Wetlands Ecology and Management, v. 18, p. 573-586.
Nelson, D.W., Sommers, L.E., 1996, Total Carbon, Organic Carbon, and Organic Matter, in
Sparks, D.L., Page, A.L., Helmke, P.A., Loeppert, R.H., eds., Methods of Soil Analysis:
Part 3 – Chemical Methods. Soil Science Society of America, p. 961-1010.
Nilsson, C., Berggren, K, 2014, Alterations of Riparian Ecosystems Caused by River Regulation:
BioScience, v. 9, p. 783 – 792.
Nilsson, C., Svedmark, M., 2002, Basic Principles and Ecological Consequences of Changing
Water Regimes: Riparian Plant Communities: Environmental Management, v. 30, p. 468-
480.
NRCS Soil Survey Division Staff, 1993, Soil survey manual, Soil Conservation Service, U.S.
Department of Agriculture Handbook 18.
Ovenden, L., 1990, Peat accumulation in northern wetlands: Quaternary Research, v. 33, p. 377-
386.
Paine, D. P., 1981, Aerial photography and image interpretation for resource management,
Wiley, New York.
Patterson, W.B., 1997, Vegetation, Soils, and Hydrology of Central Louisiana Bottomland
Hardwood Forest Types, University of Tennessee, Knoxville, Tennessee, p. 1-247.
Pennington, W., Tutin, T.G., Cambray, R.S., Fisher, E.M., 1973, Observations on Lake
Sediments using Fallout 137Cs as a Tracer: Nature, v. 242, p. 324-326.
Peters, M. S., Afton, A.D., 1993, Effects of deep tillage on redistribution of lead shot and chufa
flatsedge at Catahoula Lake, Louisiana: Wildlife Society Bulletin, v. 21, p. 471-479.
Rayner, D.A., 1976, A Monograph Concerning the Water-Elm, Planera Aquatica (Walt.) J.F.
Gmelin (Ulmaceae), University of South Carolina, Columbia, p. 1-163.
Reddy, K.R., Chua, T., Richardson, C.J., 2013, Organic Phosphorus Mineralization in Wetland
Soils in DeLaune, R.D., Reddy, K.R., Richardson, C.J., Megonigal, J.P. eds., Methods of
Biogeochemistry of Wetlands, Soil Science Society of America, p. 775-796
Reinecke, K.J., Kaminski, R.M., Moorhead, D.J., Hodges, J.D., Nassar, J.R., 1989, Mississippi
Alluvial Valley, in, Habitat Management for Migrating and Wintering Waterfowl in
69
North America, Smith, L.M., Pederson, R.L., Kaminski, R.M., eds., Texas Tech
University Press, p. 203-247.
Reisinger, A.J., Blair, J.M., Rice, C.W., Dodds, W.K., 2013, Woody Vegetation Removal
Stimulates Riparian and Benthic Denitrification in Tallgrass Prairie: Ecosystems, v. 16, p.
547-560.
Ritchie, J.C., McHenry, J.R., 1990, Application of Radioactive Fallout Cesium-137 for
Measuring Soil Erosion and Sediment Accumulation Rates and Patterns: A Review:
Journal of Environmental Quality, ed. 19, v. 2, p. 215-233.
Russell, R.J., 1942, The Elevation of the Shore Line of Catahoula Lake, LaSalle Parish,
Louisiana, p. 40.
Rybicki, N. B., Carter, V., 1986, Effect of Sediment Depth and Sediment Type on the Survival of
Vallisneria americana Michx grown from tubers: Aquatic Botany, v. 24, p. 233-240.
Saengkul, C., Pakkong, P., Sawangwong, P., 2013, Effect of sediment characteristics on sorption
of 137Cs at the sediment-water interface: IOSR Journal of Environmental Science,
Toxicology and Food Technology, ed. 4, v. 5, p. 122-125.
Saunders, D.L., Kalff, J., 2001, Nitrogen retention in wetlands, lakes and rivers: Hydrobiologia,
v. 443, p. 205-212.
Sessums, R. T., 1954, Catahoula Lake area report, presented to Governor Robert F. Kennon and
the Louisiana Legislature in compliance with Act no. 598, 1952 Legislature, p. 84.
Shafroth, P.B., Friedman, J.M., Auble, G.T., Scott, M.L., Braatne, J.H., 2002, Potential
Responses of Riparian Vegetation to Dam Removal: BioScience, v. 52, p. 703 – 712.
Sionneau, T., Bout-Roumazeilles, V., Biscaye, P.E., Van Vliet-Lanoe, B., Bory, A., 2008, Clay
mineral distributions in and around the Mississippi River watershed and Northern Gulf of
Mexico: sources and transport patterns: Quaternary Science Reviews, v. 27, p. 1740-
1751.
Soltanpour, P.N., Johnson, G.W., Workman, S.M., Jones, J.B., Jr., Miller, R.O., 1996, in, Sparks,
D.L, Page, A.L., Helmke, P.A., Loeppert, R.H., eds., Methods of Soil Analysis: Part 3 -
Chemical Methods, Soil Science Society of America, p. 91-139.
Taggart, M.S., Jr., Kaiser, A.D., Jr., 1960, Clay Mineralogy of Mississippi River Deltaic
Sediments: Bulletin of the Geological Society of America, v. 71., p. 521-530.
Tedford, R. A., 2009, A multi-proxy approach to investigating the latest Holocene (~4,500 yrs.
BP) vegetational history of Catahoula Lake, Louisiana, Louisiana State University, Baton
Rouge, La, p. 1-382.
70
Thomas, G.W., 1996, Soil pH and Soil Acidity, in Sparks, D.L., Page, A.L., Helmke, P.A.,
Loeppert, R.H., eds., Methods of Soil Analysis: Part 3 – Chemical Methods. Soil Science
Society of America, p. 475-490.
Toner, M., Keddy, P., 1997, River Hydrology and Riparian Wetlands: A Predictive Model for
Ecological Assembly: Ecological Applications, v. 7, p. 236-246.
U.S. Army Corps of Engineers. 1998. Water Resources Development in Louisiana. Saucier, M.H
ed., U.S. Army Corps of Engineers New Orleans District. 177p.
USGS, 2002, Modeling the bathymetry of Catahoula Lake specialized technology for wetland
management, U.S. Geological Survey Fact Sheet, U.S. Dept. of the Interior.
Wang, S.C., Jurik, T.W., van der Valk, A.G., 1994, Effects of Sediment Load on Various Stages
in the Life and Death of Cattail (Typha x Glauca): Wetlands, v. 14, p. 166-173.
Weindorf, D.C., 2008, An Update of the Field Guide to Louisiana Soil Classification, LSU
AgCenter Research Bulletin #889.
Weller, M.W., 1989, Plant and Water-Level Dynamics in an East Texas Shrub Hardwood
Bottomland Wetland: Wetlands, v. 9, p. 73-88.
Willis, F. L., 2009, A Multidisciplinary Approach for Determining the Extents of the Beds of
Complex Natural Lakes in Louisiana, University of New Orleans, New Orleans, p. 1-182.
Wills, D.W., 1963, An investigation of some factors affecting waterfowl and waterfowl habitat
on Catahoula Lake, Louisiana, Louisiana State University, Baton Rouge, p. 1-97.
Wills, D.W., Davis, F., The Catahoula Contract: Louisiana Conservationist, v. 29, p. 8-11.
Winstead, N.A., King, S.L., 2006, Least Bittern Distribution Among Structurally Different
Vegetation Types in Managed Wetlands of Northwest Tennessee, USA: Wetlands, v. 26,
p. 619-623.
Woolington, D.W., Emfinger, J.W., 1989, Trends in Canvasback Populations at Catahoula Lake,
Louisiana: Proceedings of the Annual Conference of the Southeast Association of Fish
and Wildlife Agencies, v. 43, p. 396-403.
Zedler, J.B., Kercher, S., 2004, Causes and Consequences of Invasive Plants in Wetlands:
Opportunities, Opportunists, and Outcomes: Critical Reviews in Plant Sciences, v. 23, p.
431-452.
Zhu, Y., Weindorf, D.C., Zhang, W., 2011, Characterizing soils using a portable X-ray
fluorescence spectrometer: 1. Soil texture: Geoderma, v. 167-168, p. 167-17
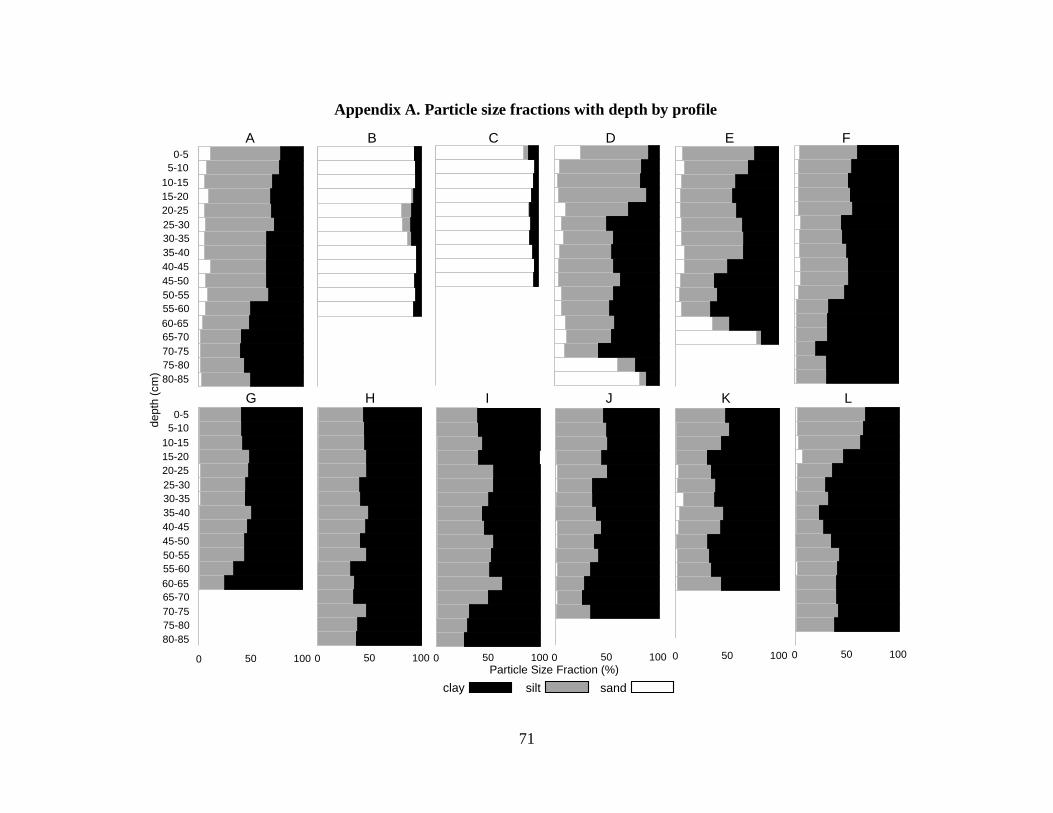
71
0 50 100
00-05
05-10
10-15
15-20
20-25
25-30
30-35
35-40
40-45
45-50
50-55
55-60
60-65
65-70
70-75
75-80
80-85
A
0 50 100
00-05
05-10
10-15
15-20
20-25
25-30
30-35
35-40
40-45
45-50
50-55
55-60
60-65
65-70
70-75
75-80
80-85
B
0 50 100
00-05
05-10
10-15
15-20
20-25
25-30
30-35
35-40
40-45
45-50
50-55
55-60
60-65
65-70
70-75
75-80
80-85
C
0 50 100
00-05
05-10
10-15
15-20
20-25
25-30
30-35
35-40
40-45
45-50
50-55
55-60
60-65
65-70
70-75
75-80
80-85
D
0 50 100
00-05
05-10
10-15
15-20
20-25
25-30
30-35
35-40
40-45
45-50
50-55
55-60
60-65
65-70
70-75
75-80
80-85
E
0 50 100
00-05
05-10
10-15
15-20
20-25
25-30
30-35
35-40
40-45
45-50
50-55
55-60
60-65
65-70
70-75
75-80
80-85
F
0 50 100
00-05
05-10
10-15
15-20
20-25
25-30
30-35
35-40
40-45
45-50
50-55
55-60
60-65
65-70
70-75
75-80
80-85
G
0 50 100
00-05
05-10
10-15
15-20
20-25
25-30
30-35
35-40
40-45
45-50
50-55
55-60
60-65
65-70
70-75
75-80
80-85
H
0 50 100
00-05
05-10
10-15
15-20
20-25
25-30
30-35
35-40
40-45
45-50
50-55
55-60
60-65
65-70
70-75
75-80
80-85
I
0 50 100
00-05
05-10
10-15
15-20
20-25
25-30
30-35
35-40
40-45
45-50
50-55
55-60
60-65
65-70
70-75
75-80
80-85
J
0 50 100
00-05
05-10
10-15
15-20
20-25
25-30
30-35
35-40
40-45
45-50
50-55
55-60
60-65
65-70
70-75
75-80
80-85
K
0 50 100
00-05
05-10
10-15
15-20
20-25
25-30
30-35
35-40
40-45
45-50
50-55
55-60
60-65
65-70
70-75
75-80
80-85
L
A B C D E F
G H I J K L
0-5
5-10
10-15
15-20
20-25
25-30
30-35
35-40
40-45
45-50
50-55
55-60
60-65
65-70
70-75
75-80
80-85
0-5
5-10
10-15
15-20
20-25
25-30
30-35
35-40
40-45
45-50
50-55
55-60
60-65
65-70
70-75
75-80
80-85
0 50 100 0 50 100 0 50 100 0 50 100 0 50 100 0 50 100
de
pth
(cm
)
Particle Size Fraction (%)
clay silt sand
Appendix A. Particle size fractions with depth by profile
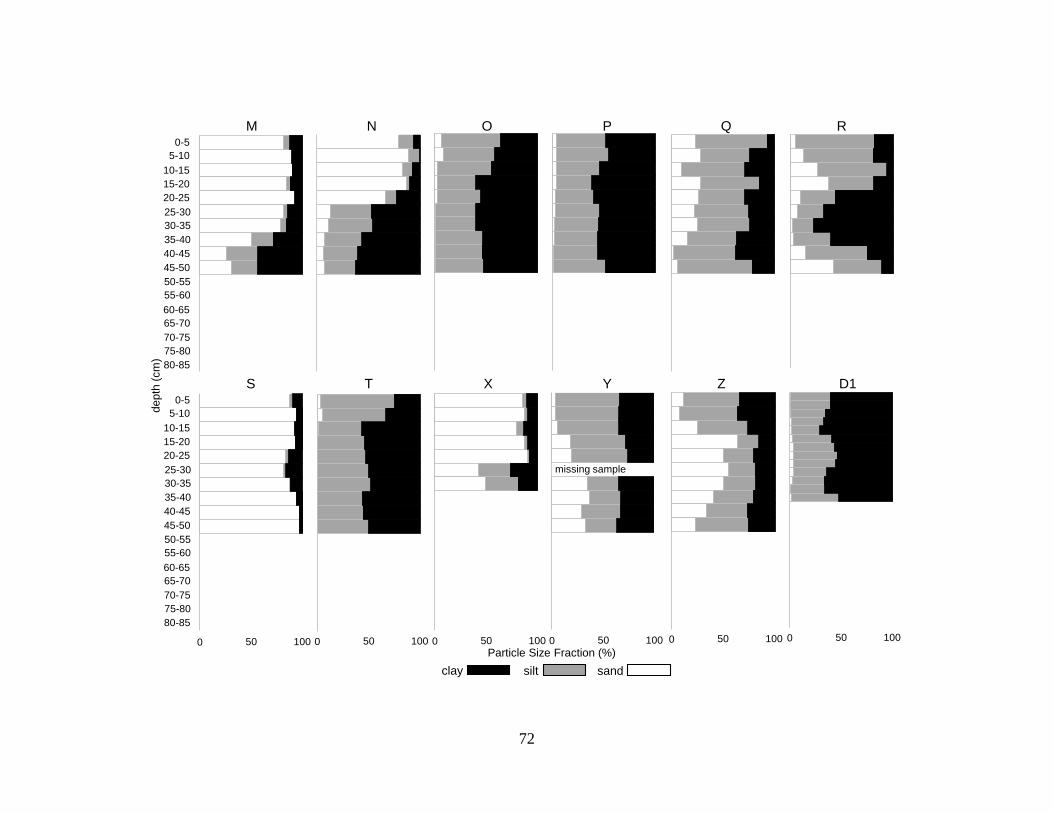
72
M N O P Q R
S T X Y Z D1
0-5
5-10
10-15
15-20
20-25
25-30
30-35
35-40
40-45
45-50
50-55
55-60
60-65
65-70
70-75
75-80
80-85
0-5
5-10
10-15
15-20
20-25
25-30
30-35
35-40
40-45
45-50
50-55
55-60
60-65
65-70
70-75
75-80
80-85
0 50 100 0 50 100 0 50 100 0 50 100 0 50 100 0 50 100
0 50 100
00-05
05-10
10-15
15-20
20-25
25-30
30-35
35-40
40-45
45-50
50-55
55-60
60-65
65-70
70-75
75-80
80-85
M
0 50 100
00-05
05-10
10-15
15-20
20-25
25-30
30-35
35-40
40-45
45-50
50-55
55-60
60-65
65-70
70-75
75-80
80-85
N
0 50 100
00-05
05-10
10-15
15-20
20-25
25-30
30-35
35-40
40-45
45-50
50-55
55-60
60-65
65-70
70-75
75-80
80-85
O
0 50 100
00-05
05-10
10-15
15-20
20-25
25-30
30-35
35-40
40-45
45-50
50-55
55-60
60-65
65-70
70-75
75-80
80-85
P
0 50 100
00-05
05-10
10-15
15-20
20-25
25-30
30-35
35-40
40-45
45-50
50-55
55-60
60-65
65-70
70-75
75-80
80-85
Q
0 50 100
00-05
05-10
10-15
15-20
20-25
25-30
30-35
35-40
40-45
45-50
50-55
55-60
60-65
65-70
70-75
75-80
80-85
R
0 50 100
00-05
05-10
10-15
15-20
20-25
25-30
30-35
35-40
40-45
45-50
50-55
55-60
60-65
65-70
70-75
75-80
80-85
S
0 50 100
00-05
05-10
10-15
15-20
20-25
25-30
30-35
35-40
40-45
45-50
50-55
55-60
60-65
65-70
70-75
75-80
80-85
T
0 50 100
00-05
05-10
10-15
15-20
20-25
25-30
30-35
35-40
40-45
45-50
50-55
55-60
60-65
65-70
70-75
75-80
80-85
X
0 50 100
00-05
05-10
10-15
15-20
20-25
25-30
30-35
35-40
40-45
45-50
50-55
55-60
60-65
65-70
70-75
75-80
80-85
Y
0 50 100
00-05
05-10
10-15
15-20
20-25
25-30
30-35
35-40
40-45
45-50
50-55
55-60
60-65
65-70
70-75
75-80
80-85
Z
0 50 100
00-03
06-09
12-15
18-21
24-27
30-33
36-39
42-45
48-51
54-57
60-63
66-69
72-75
78-81
D1
missing sample
de
pth
(cm
)
Particle Size Fraction (%)
clay silt sand
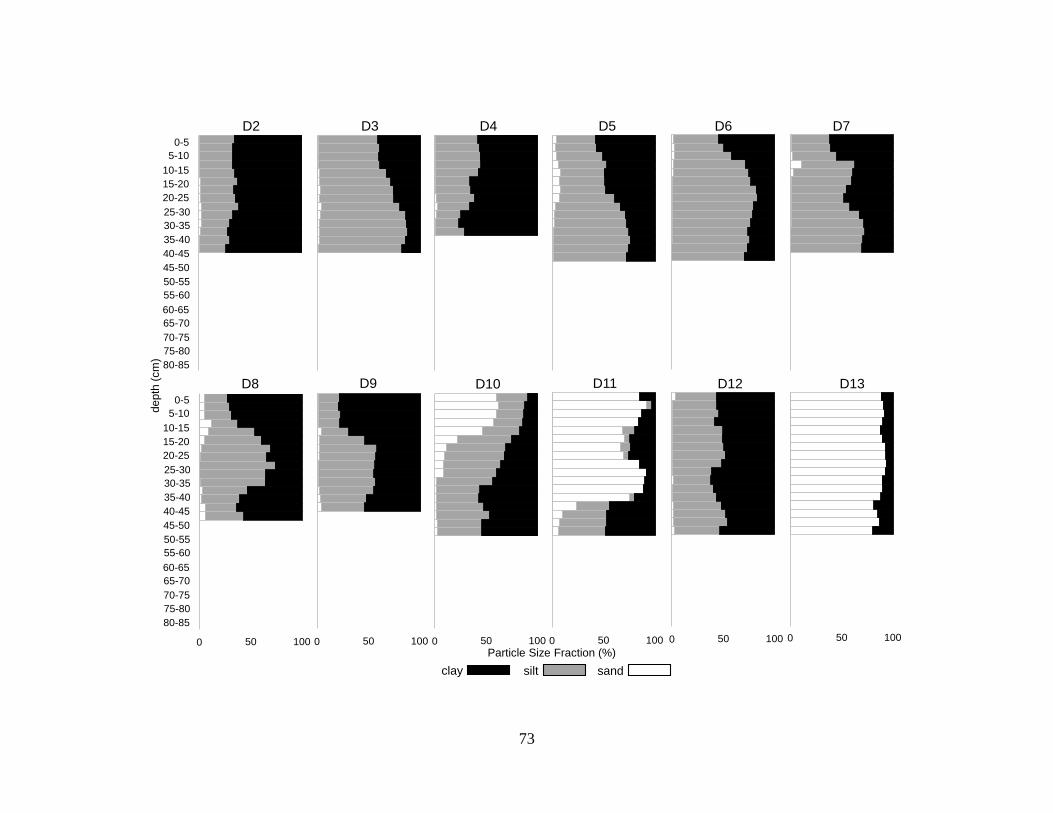
73
D2 D3 D4 D5 D6 D7
D8 D9 D10 D11 D12 D13
0-5
5-10
10-15
15-20
20-25
25-30
30-35
35-40
40-45
45-50
50-55
55-60
60-65
65-70
70-75
75-80
80-85
0-5
5-10
10-15
15-20
20-25
25-30
30-35
35-40
40-45
45-50
50-55
55-60
60-65
65-70
70-75
75-80
80-85
0 50 100 0 50 100 0 50 100 0 50 100 0 50 100 0 50 100
0 50 100
00-03
06-09
12-15
18-21
24-27
30-33
36-39
42-45
48-51
54-57
60-63
66-69
72-75
78-81
D2
0 50 100
00-03
06-09
12-15
18-21
24-27
30-33
36-39
42-45
48-51
54-57
60-63
66-69
72-75
78-81
D3
0 50 100
00-03
06-09
12-15
18-21
24-27
30-33
36-39
42-45
48-51
54-57
60-63
66-69
72-75
78-81
D4
0 50 100
00-03
06-09
12-15
18-21
24-27
30-33
36-39
42-45
48-51
54-57
60-63
66-69
72-75
78-81
D5
0 50 100
00-03
06-09
12-15
18-21
24-27
30-33
36-39
42-45
48-51
54-57
60-63
66-69
72-75
78-81
D6
0 50 100
00-03
06-09
12-15
18-21
24-27
30-33
36-39
42-45
48-51
54-57
60-63
66-69
72-75
78-81
D7
0 50 100
00-03
06-09
12-15
18-21
24-27
30-33
36-39
42-45
48-51
54-57
60-63
66-69
72-75
78-81
D8
0 50 100
00-03
06-09
12-15
18-21
24-27
30-33
36-39
42-45
48-51
54-57
60-63
66-69
72-75
78-81
D9
0 50 100
00-03
06-09
12-15
18-21
24-27
30-33
36-39
42-45
48-51
54-57
60-63
66-69
72-75
78-81
D10
0 50 100
00-03
06-09
12-15
18-21
24-27
30-33
36-39
42-45
48-51
54-57
60-63
66-69
72-75
78-81
D11
0 50 100
00-03
06-09
12-15
18-21
24-27
30-33
36-39
42-45
48-51
54-57
60-63
66-69
72-75
78-81
D12
0 50 100
00-03
06-09
12-15
18-21
24-27
30-33
36-39
42-45
48-51
54-57
60-63
66-69
72-75
78-81
D13
de
pth
(cm
)
Particle Size Fraction (%)
clay silt sand
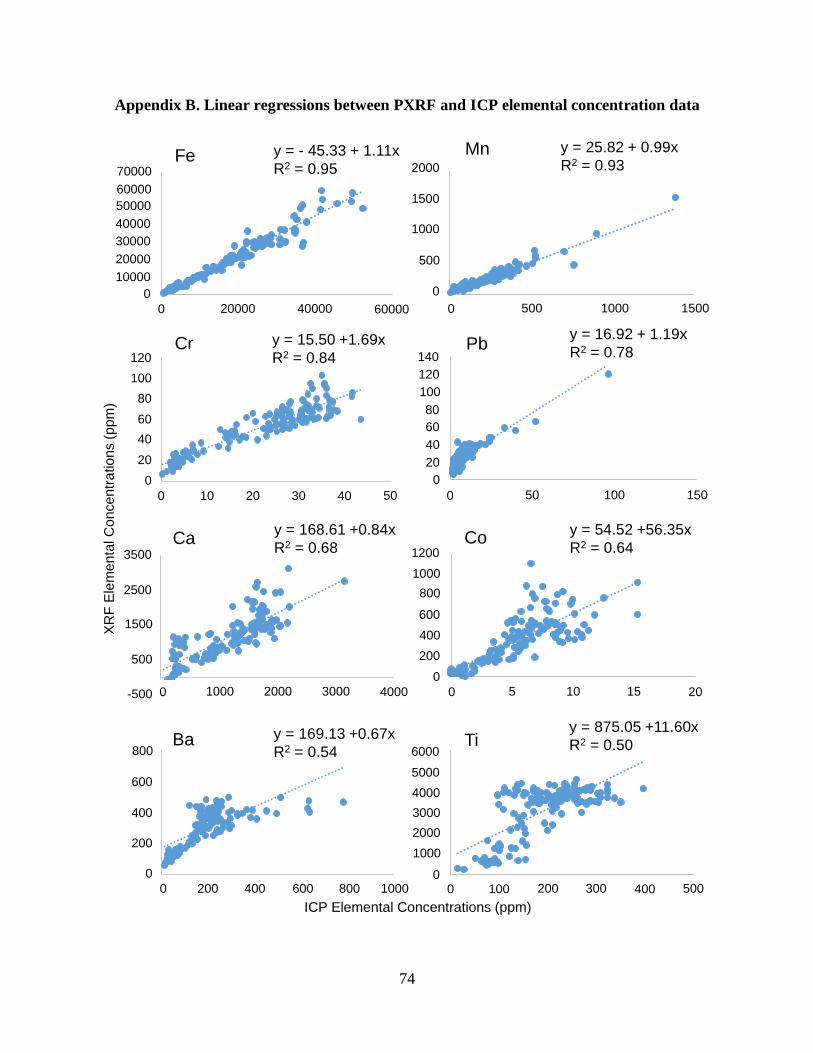
74
Appendix B. Linear regressions between PXRF and ICP elemental concentration data
ICP Elemental Concentrations (ppm)
y = 1.114x - 45.332R² = 0.9493
0
10000
20000
30000
40000
50000
60000
70000
0 20000 40000 60000
Fe y = 0.9887x + 25.817R² = 0.9283
0
500
1000
1500
2000
0 500 1000 1500
Mn
y = 1.6865x + 15.494R² = 0.8441
0
20
40
60
80
100
120
0 10 20 30 40 50
Cry = 1.1877x + 16.918
R² = 0.776
0
20
40
60
80
100
120
140
0 50 100 150
Pb
y = 0.8401x + 168.61R² = 0.6783
-500
500
1500
2500
3500
0 1000 2000 3000 4000
Ca
y = 0.6657x + 169.13R² = 0.5384
0
200
400
600
800
0 200 400 600 800 1000
Ba y = 11.598x + 875.05R² = 0.5001
0
1000
2000
3000
4000
5000
6000
0 100 200 300 400 500
Ti
y = 56.346x + 54.518R² = 0.6436
0
200
400
600
800
1000
1200
0 5 10 15 20
Co
120
100
80
60
40
20
0
0 10 20 30 40 50
Cr y = 15.50 +1.69x
R2 = 0.84
70000
60000
50000
40000
30000
20000
10000
0
0 20000 40000 60000
Fe y = - 45.33 + 1.11x
R2 = 0.95 2000
1500
1000
500
0
0 500 1000 1500
Mn y = 25.82 + 0.99x
R2 = 0.93
140
120
100
80
60
40
20
0
0 50 100 150
Pby = 16.92 + 1.19x
R2 = 0.78
3500
2500
1500
500
0-500 1000 2000 3000 4000
Cay = 168.61 +0.84x
R2 = 0.68 1200
1000
800
600
400
200
0
0 5 10 15 20
Coy = 54.52 +56.35x
R2 = 0.64
800
600
400
200
0
0 200 400 600 800 1000
Ba y = 169.13 +0.67x
R2 = 0.54 6000
5000
4000
3000
2000
1000
00 100 200 300 400 500
Tiy = 875.05 +11.60x
R2 = 0.50
XR
F E
lem
enta
l C
oncentr
ations (
ppm
)
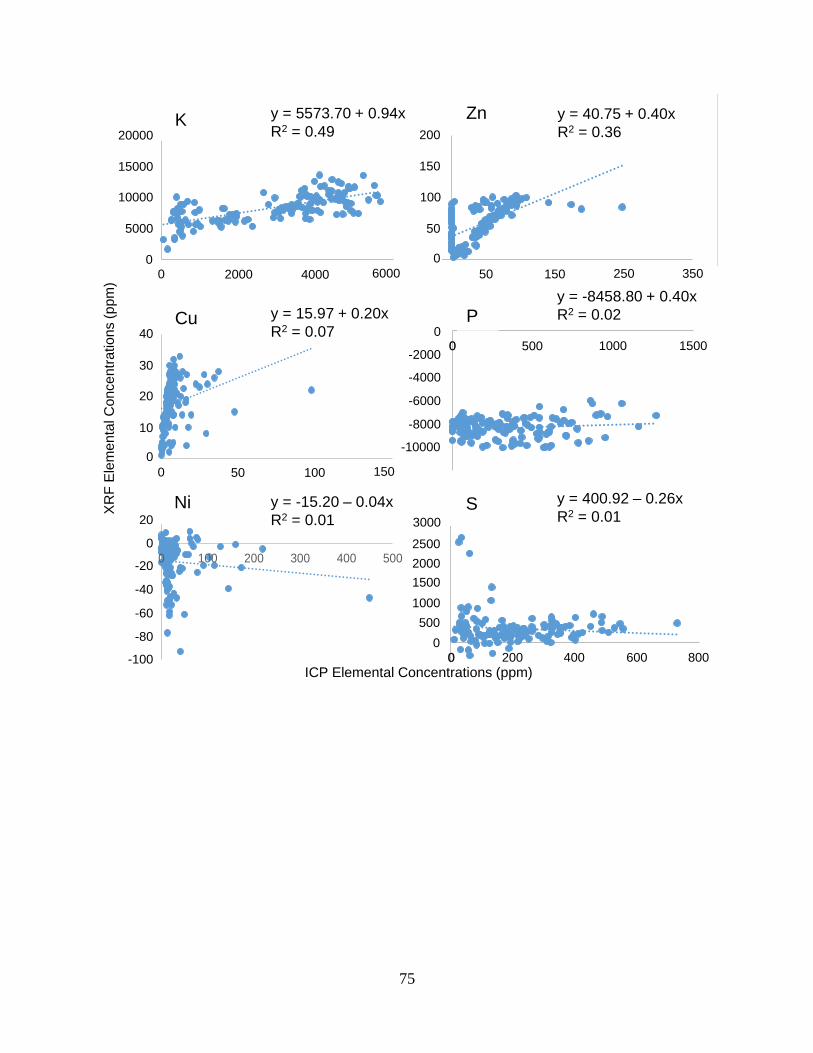
75
y = 0.9359x + 5573.7R² = 0.4897
0
5000
10000
15000
20000
0 2000 4000 6000
K
y = 0.1992x + 15.969R² = 0.0724
0
10
20
30
40
0 50 100 150
Cu
y = -0.2557x + 400.92R² = 0.0085
-500
0
500
1000
1500
2000
2500
3000
0 200 400 600 800
S
y = 0.3974x + 40.752R² = 0.3574
0
50
100
150
200
-50 50 150 250 350
Zn
y = 0.4024x - 8458.8R² = 0.0171
-12000
-10000
-8000
-6000
-4000
-2000
0
0 500 1000 1500
P
y = -0.0353x - 15.197R² = 0.0089
-100
-80
-60
-40
-20
0
20
0 100 200 300 400 500
Ni
-100
-80
-60
-40
-20
0
20
0
10
20
30
40
0 50 100 150
20000
15000
10000
5000
00 2000 4000 6000
200
150
100
50
0
50 150 250 350
0
-2000
-4000
-6000
-8000
-10000
0 500 1000 1500
3000
2500
2000
1500
1000
500
00 200 400 600 800
K Zny = 5573.70 + 0.94x
R2 = 0.49y = 40.75 + 0.40x
R2 = 0.36
Cu y = 15.97 + 0.20x
R2 = 0.07P
y = -8458.80 + 0.40x
R2 = 0.02
Ni y = -15.20 – 0.04x
R2 = 0.01S y = 400.92 – 0.26x
R2 = 0.01
XR
F E
lem
en
tal C
once
ntr
ation
s (
ppm
)
ICP Elemental Concentrations (ppm)
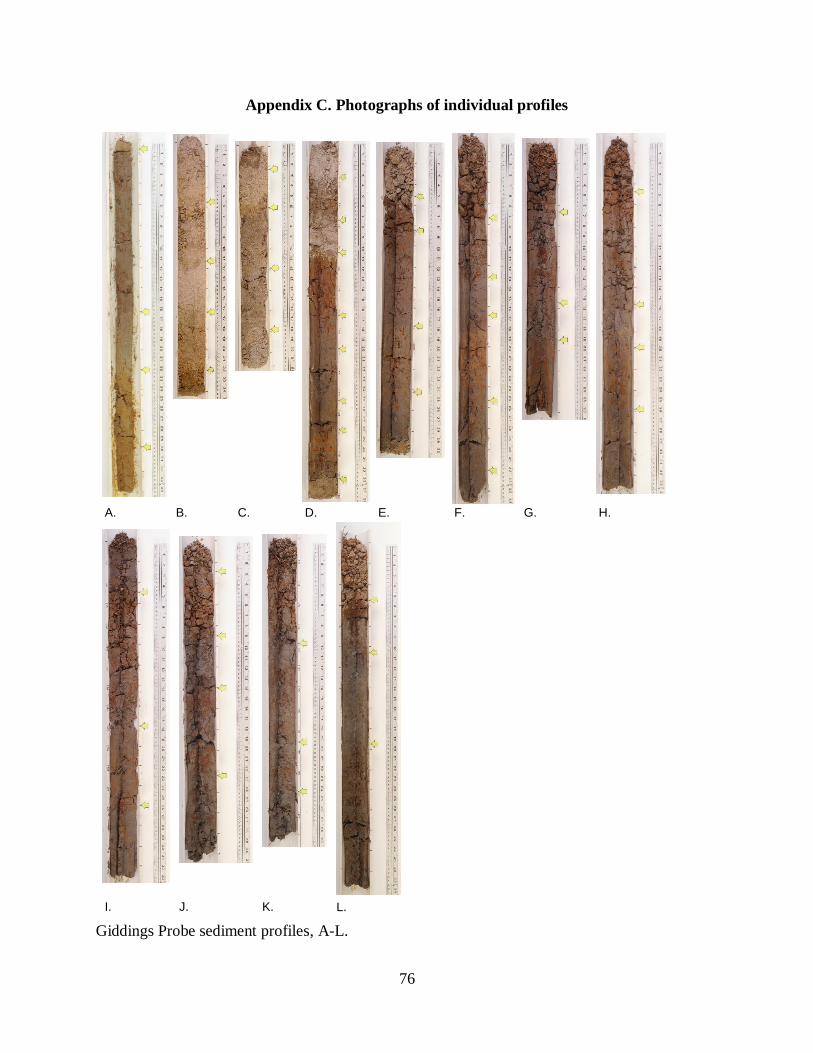
76
Appendix C. Photographs of individual profiles
Giddings Probe sediment profiles, A-L.
A. B. C. D. E. F. G. H.
I. J. K. L.
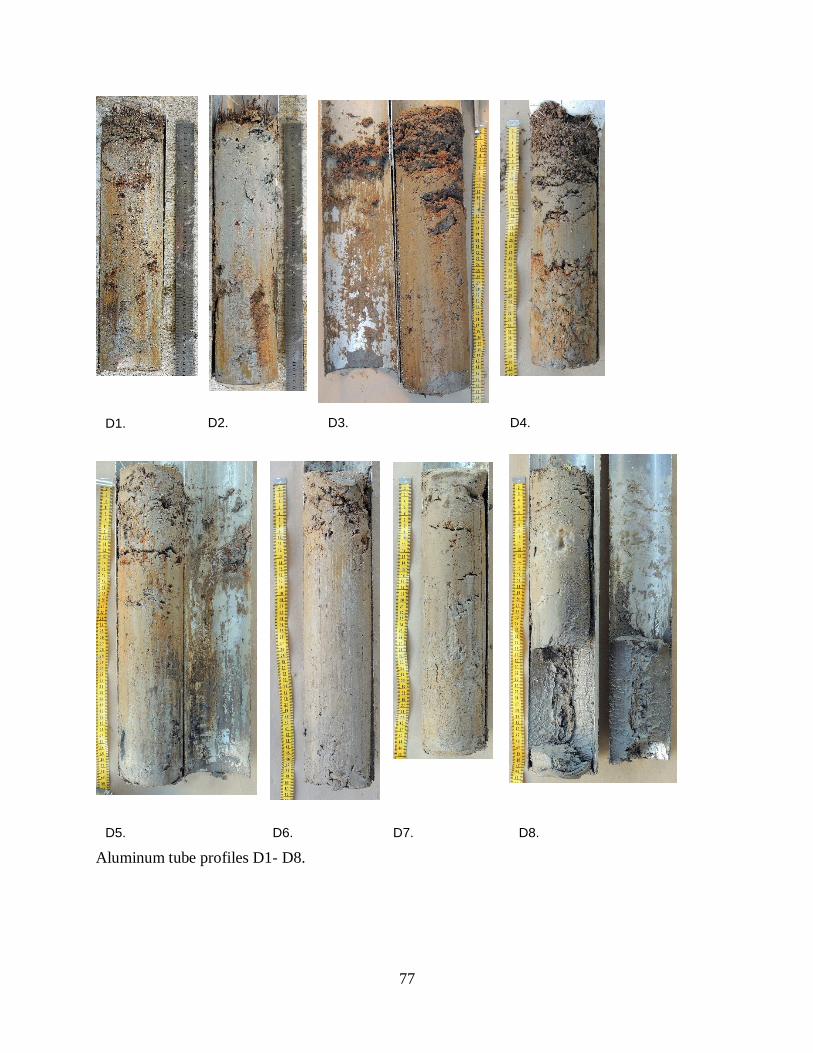
77
Aluminum tube profiles D1- D8.
D1. D2. D3. D4.
D5. D6. D7. D8.
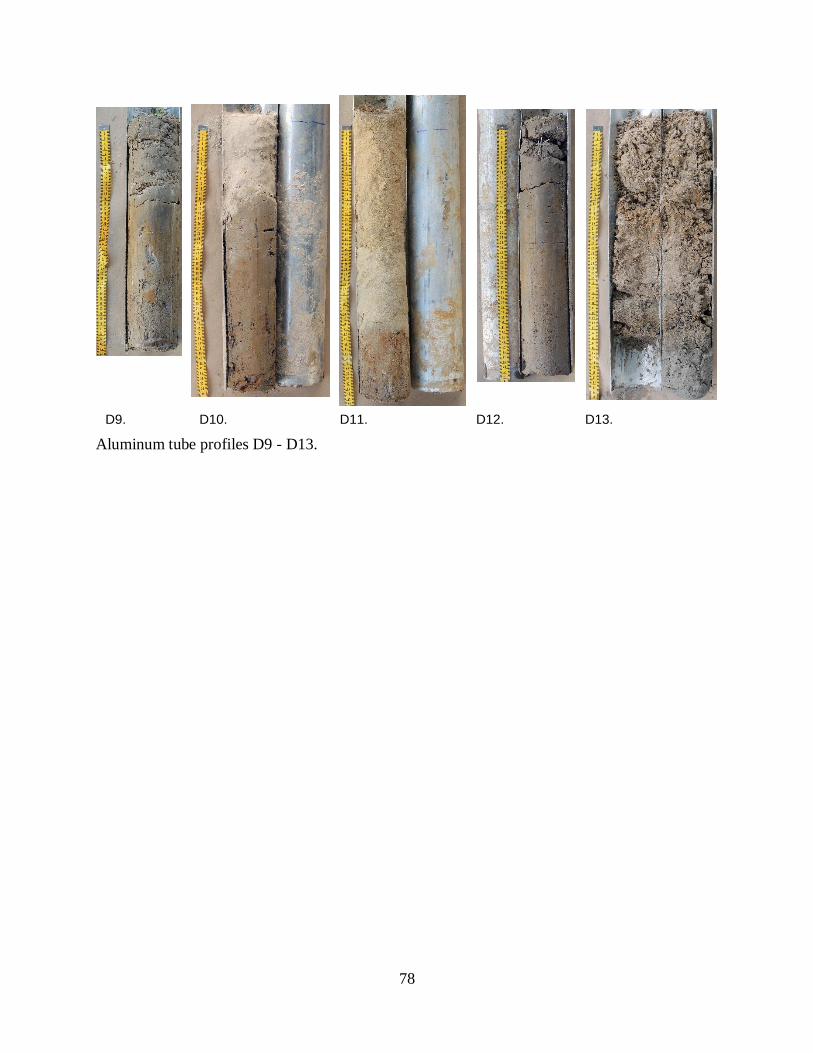
78
Aluminum tube profiles D9 - D13.
D9. D10. D11. D12. D13.

79
Vita
Karen Doerr Latuso, a native of Jacksonville, Florida, received her associate’s degree at
Florida State College at Jacksonville. Upon graduation, she transferred to the University of
Florida in Gainesville, Florida and received a bachelor’s degree in Journalism in 2001.
Thereafter, she worked as a professional photographer and photography editor at The News-Star
in Monroe, Louisiana; The Montgomery Advertiser in Montgomery, Alabama; and The
Advocate in Baton Rouge, Louisiana.
In 2009, she decided to return to school to pursue a master’s degree in the School of
Renewable Natural Resources at Louisiana State University. She hopes to receive her master’s
degree with a minor in Agronomy in May 2014 and hopes to begin employment with a
consulting firm or government agency as a wetlands or soil scientist.