Embed Size (px)
Citation preview

Seemingly Inconsistent Analyst Revisions1
Michael Iselin
Carlson School of Management
University of Minnesota
321 19th
Ave S.
Minneapolis, MN 55455
Min Park
Fisher College of Business
The Ohio State University
2100 Neil Avenue
Columbus, OH 43210
Andrew Van Buskirk
Fisher College of Business
The Ohio State University
2100 Neil Avenue
Columbus, OH 43210
November 2017
1 We thank Mark Bradshaw, Michael Drake, and Tzachi Zach as well as workshop participants at Ohio State
University for helpful comments. We gratefully acknowledge financial support from the Fisher College of Business
and the Carlson School of Management.

Seemingly Inconsistent Analyst Revisions
Abstract
We study seemingly inconsistent analyst revisions - cases where an analyst issued an original
target price and earnings estimate on the same date, then that same analyst updated each of those
estimates on the same future date, but did so in opposite directions. Contrary to an assumption in
prior literature that inconsistencies among analysts’ various outputs stem from conflicts of
interest, we provide evidence that these seemingly inconsistent revisions are largely driven by
economic and accounting-related reasons. Specifically, we find that shorter horizon earnings
forecasts, quarterly earnings forecasts, and forecasts preceded by reported losses and large
expenditures on R&D or advertising are more likely to be inconsistent with the direction of
target price revisions. We also demonstrate that when analysts provide inconsistent revisions,
investors’ reaction to subsequent realized earnings is muted, suggesting that, investors also
perceive a disconnect between earnings and firm value in these cases. We show that earnings
forecasts and target prices are both more accurate when their revisions are directionally
inconsistent with one another, indicating that seemingly inconsistent revisions are not a sign of
low-quality analyst output. Finally, we document that the market’s response to analyst forecast
revisions depends critically on the nature of concurrent target price revisions. In fact, the
earnings forecast revision is only perceived as incrementally informative relative to the target
price revision when the two signals move in opposite directions.

1
1. Introduction
A large body of literature examines the relation among different analyst outputs, arguing
that a desire by analysts to either generate trading behavior or obtain investment banking
business can conflict with their desire to issue accurate outputs. A common assumption in this
literature is that inconsistency among an analyst’s outputs provides evidence that the analyst
suffers from such conflicts of interest. (Lin and McNichols 1998; Chen and Chen 2009; Brown
and Huang 2013; Malmendier and Shanthikumar 2014). In this study we examine the validity of
that assumption by studying the determinants of seemingly inconsistent analyst outputs, and
whether seemingly inconsistent outputs reflect obviously conflicted or lower-quality outputs.
Prior papers employ different schemes for classifying analysts’ outputs as internally
inconsistent. These include observing two outputs where one is high relative to other analysts
and the other is low relative to other analysts (Lin and McNichols 1998; Brown and Huang 2013;
Malmendier and Shanthikumar 2014), or observing a weak link between a stock
recommendation and a calculated measure of intrinsic value based on earnings estimates (Chen
and Chen 2009). We focus on the internal consistency between revisions in an analyst’s earnings
estimates and contemporaneous revisions in that analyst’s target price estimates.1 Specifically,
we define an analyst’s revision as inconsistent if that analyst revised both a previously-issued
target price and a previously-issued earnings estimate on the same date for the same firm (where
both the original target price and earnings estimate were also issued on the same date), and the
target price revision is directionally opposite the earnings estimate revision.
1 We focus on the relation between earnings estimates and target prices, rather than stock recommendations, for a
few reasons. First, we argue that there is a more direct link between an analyst’s earnings estimates and his or her
target price estimate, compared to the link between earnings estimates and stock recommendations. Second, stock
recommendations are issued significantly less frequently than target price estimates and, when they are issued, are
very often reiterations, and therefore lack a clear directional interpretation. Third, stock recommendations can be
viewed as a coarse measure of target prices (relative to current stock price), while the target price itself provides a
more continuous measure. Finally, target prices tend to generate the strongest market response out of all analyst
outputs, yet we know relatively little about the process by which those target prices are generated.
2
We investigate whether these seemingly inconsistent revisions reflect evidence of low-
quality analyst output and/or analysts’ conflicts of interest or, alternatively, whether they’re
driven by economic and accounting-related factors. We do so by analyzing both the determinants
of such revisions and how the ex post accuracy of target price estimates and earnings estimates
varies as a function of their internal (in)consistency. Finally, we examine how investors respond
to the combined bundle of analyst revisions (i.e., both target price and earnings estimates), and
how that reaction varies with the consistency between the two signals.
We start by documenting that seemingly inconsistent revisions are quite common in the
post-Global Settlement era2 – approximately 22% of earnings revisions issued concurrently with
target price revisions are directionally different from the target price revision.3 We then
investigate the determinants of inconsistent revisions in target prices and earnings estimates.
Consistent with prior literature, we find that if a firm has recently issued either debt or equity,
analysts are more likely to issue inconsistent revisions. On its own, this relationship might
support the assumption that inconsistent analyst outputs indicate analysts’ conflicts of interest.
However, we also investigate whether inconsistent revisions are more likely when the
firm’s accounting earnings do not effectively measure real changes in firm value (e.g., when the
firm invests in research and development costs or when earnings estimates relate to short-term
estimates), and when changes in market-wide discount rates alter the pricing of the firm’s
earnings. In these cases, inconsistent analyst revisions could be a natural outcome of unbiased
analysts’ efforts. We find evidence in support of this notion. Revisions in longer-horizon and
2 The Global Settlement refers to a 2003 settlement between several regulatory agencies and ten top investment
banking firms in response to alleged conflicts of interest within those banks that led to the issuance of misleading
information to investors. Further information can be found at http://www.finra.org/industry/2003-global-settlement. 3 As we discuss in Section 3, we retain only observations where both the original earnings estimate and the revised
earnings estimates relate to the same fiscal period, the original earnings estimate and target price are issued on the
same date. We allow for multiple earnings estimates (for different fiscal periods) on the same date, as long as they
meet the above criteria, and discard observations where the analyst introduced estimates for other fiscal periods
during the revision period.

3
annual earnings forecasts are less likely to directionally differ from target price revisions,
consistent with the fact that earnings and returns are more highly correlated over longer windows
(Easton et al. 1992). Inconsistent signals are more likely for firms that generated losses in the
prior year, because losses are less informative about firm value than profits (Hayn 1995), and
more likely for firms with higher R&D and advertising spending in the prior year as those
expenditures are likely to translate into value in future periods but be reflected as a decrease in
current period earnings (Lev and Zarowin 1999).
We also find that changes in market-wide discount rates affect the likelihood of
inconsistent signals, particularly when the revisions occur over longer windows (i.e., a longer
period between the original and the updated estimates). This is to be expected, as a higher
earnings estimate capitalized at a lower multiple could lead to a lower target price. Also intuitive
is the fact that the relative pre-revision levels of the analyst’s target price and earnings estimate
matter; when the analyst’s target price is below consensus target price and the earnings estimate
is above the consensus earnings estimate (or vice versa), that analyst is more likely to issue
directionally inconsistent revisions to those measures.
Next, we ask whether the equity market’s response to earnings news is more likely to be
directionally inconsistent with the sign of the news when analysts are releasing inconsistent
revisions. We expect that if internally inconsistent analyst output is a function of analysts’
conflicts and strategic behavior, there would be no reason for investors to exhibit similar
behavior when they interpret firms’ earnings announcements. On the other hand, if inconsistent
signals are driven by accounting and economic factors, we expect those same factors to lead to
greater discrepancy between earnings news and investors’ assessments of firm value. We find
that short-window earnings announcement period returns are more likely to be directionally
4
different from the firm’s earnings surprise for those firms with the highest proportion of analysts
issuing inconsistent signals.4 We also find that earnings response coefficients are smaller for
those same firms. These results again suggest that accounting and economic factors play at least
some role in explaining inconsistent analyst revisions.
Our next analysis examines whether seemingly inconsistent analyst revisions reflect
lower-quality output, in terms of the accuracy of either the target price or the earnings estimate.
We measure the accuracy of both the earnings estimates and target prices and find no evidence
that inconsistent signals imply lower-quality signals. In fact, we find the opposite – earnings
estimates are more accurate in cases of inconsistent revisions, and the same is true for target
prices (the evidence for target prices accuracy is weaker and depends upon exactly how we
measure target price accuracy). These findings again suggest that inconsistent revisions are not
solely driven by conflicts of interest, and may even represent higher quality information than
consistent revisions.
Finally, we focus on the market’s response to seemingly inconsistent analyst signals.
Prior research shows that when analysts issue multiple contemporaneous signals (e.g., earnings
estimates, target prices, recommendations), each signal appears to convey incremental
information (Feldman et al. 2012; Asquith et al. 2005). We find a similar result in our data when
we analyze the full sample. We then perform the same test for the subsample of internally
inconsistent observations. We expect that if analysts are systematically manipulating one of their
measures (as in Malmendier and Shanthikumar 2014), investors will disregard that signal and
respond only to the truthfully-disclosed measure. On the other hand, if both signals represent
4 We note that the significance of this relation depends upon how we classify firms based on the extent of
inconsistent analysts.

5
truthful analyst disclosure (despite their seeming inconsistency), we expect that investors will
respond positively to the news in both outputs. We find evidence for the latter.
We also show that this result (i.e., measurable responses to both contemporaneous
analysts’ outputs) is restricted to the subsample of seemingly inconsistent revisions. When the
revisions are inconsistent, the investor response to each signal is positive and significant. On the
other hand, when the signals are directionally consistent (e.g., both the target price and the
earnings estimate is revised upwards), there is no detectable incremental response to the earnings
estimate revision. When analysts issue consistent revisions, the information in the target price
revision seems to fully subsume the information in the earnings estimate revision.
As for why inconsistent signals seem to be associated with higher quality estimates of
both target prices and earnings, we offer the following conjecture: Early target price research
concludes that analysts often generated target prices by simply applying a multiple to their
earnings estimates (either some appropriate price/earnings multiple or a PEG ratio that took
growth rates into account), rather than employing a more complex valuation process (e.g., a
residual income model or DCF) (Bradshaw 2004; Brown et al. 2015). A possible explanation for
seemingly inconsistent analyst outputs, and the fact that these inconsistent outputs have become
more common over time, is that analysts are tending to use more complex valuation models that
rely upon a richer set of inputs. The use of more complex models, especially those relying upon
inputs other than just earnings, would naturally lead to a greater likelihood that earnings forecast
revisions differ from target price revisions, and would plausibly generate more accurate
estimates (Gleason et al. 2013).
We offer exploratory evidence in support of this conjecture. First, we show that estimates
of non-earnings items (e.g., Sales, EBIT, CapEX) have become more common over time and,

6
importantly, that inconsistent signals are more likely in those cases where the analyst has issued
estimates for more of those non-earnings measures. Moreover, we find that both earnings
estimates and target prices are more accurate when the analyst issues more non-earnings
estimates. Although exploratory in nature, these patterns are consistent with our conjecture that
both seemingly inconsistent analyst outputs and higher quality analyst outputs are a consequence
of analysts explicitly estimating more non-earnings metrics.
We contribute to the existing analyst literature in several ways. First, we show that
inconsistent analyst signals are associated with several accounting-related and economic factors
in intuitive ways. Moreover, these inconsistent signals seem to be associated with higher-quality
(more accurate) estimates. One implication is that inconsistent signals should not be viewed as
prima facie evidence of strategic or suboptimal analyst behavior, as some prior research implies.
We also show that the information content of analysts’ earnings revisions depends critically upon
the nature of concurrent target price revisions. When issued in conjunction with target price
revisions, earnings revisions appear to have no incremental information content unless they
directionally disagree with concurrently-issued target prices.
Our paper also emphasizes the importance of controlling for target price revisions when
assessing investor response to earnings revisions, since the two outputs are often issued
simultaneously. For example, many studies have looked at how investors respond to earnings
estimates (e.g., Clement and Tse 2003; Keung 2010), without considering concurrently issued
target prices; our results suggest that this omission could have material effects on inferences.
Finally, our paper provides more information on the interrelation between different analyst
outputs, and sheds light on the “black box” by which analysts convert their estimates into
valuations. Based on our results, we speculate that valuation process may be changing over time,

7
where valuation models are incorporating more non-earnings inputs. But we leave a full
investigation of that speculation to future research.
2. Prior Research
2.1. Relation between different analyst outputs
Security analysts generate three main outputs for investors – earnings estimates, target
prices, and buy/sell/hold recommendations. There is an intuitive relation among these outputs,
illustrated in Figure 1 of Bradshaw (2009), reproduced below. In this schematic, analysts
generate estimates of future earnings (and other metrics), convert those estimates into an
estimated firm value (target price) through some valuation process, and then generate a
recommendation to buy, sell, or hold the stock based on how that estimated fair value compares
to the current stock price.
A substantial literature has explored the characteristics of each of these outputs, and how
analysts derive them. Not surprisingly, this literature finds positive relations among the various
analyst outputs. Bandyopadhyay et al. (1995) study the relation between earnings estimates and
analysts’ target prices for a sample of Canadian firms and find that forecasted earnings explains
between 30-60% of the variation in forecasted prices, depending on the horizon of the forecasted

8
earnings. Bradshaw (2004) documents that analysts’ recommendations can be explained by
estimated fair values based on forecasted earnings.5 Ertimur et al. (2007) show that analysts’
stock recommendations are more profitable when their earnings estimates are more accurate,
suggesting that those earnings estimates are useful in deriving those recommendations.
Although these measures are positively related with one another, they are not redundant
signals. For example, Francis and Soffer (1997) study market reactions to analyst reports and
show that investors respond to both earnings estimate revisions and stock recommendation
revisions; neither measure subsumes the other. Francis and Soffer (1997) note that earnings
estimates may be incrementally informative to recommendations, even though recommendations
should incorporate the information within those estimates, because the recommendations are
categorical rather than continuous, and thus represent information loss. Similarly, Feldman et al.
(2012) show that investors respond to all three types of outputs – revisions in recommendations,
target price estimates, and earnings estimates – but that the response to target price (and
recommendation) revisions is stronger than responses to revised earnings estimates. More
importantly, they show that each signal provides information that is incremental to the other two.
Notwithstanding the previous discussion, prior literature also suggests that analysts do
not always maintain consistency across their outputs. Bradshaw (2002) studies a sample of 103
analyst reports and finds a positive correlation between disclosed target prices (relative to
observed stock prices) and their stock recommendations. However, not all of the analyst reports
disclosed a target price. In those cases where the target price was not disclosed, there does not
appear to be a relation between a pseudo target price (applying an industry multiple to the firm’s
estimated earnings) and the analyst’s recommendation. One interpretation of this result is that
5 Bradshaw (2004) notes that the valuations based on present value models (e.g., residual income) do not appear to
be related to recommendations, while valuations based on multiples (e.g., the PEG ratio) are strongly related.

9
analysts issued stock prices that they knew to be inconsistent with their own (undisclosed)
estimate of firm value.6
2.2. Conflicting analyst outputs as a sign of cognitive bias or incentives
The existence and consequences of conflicts of interest in the sell-side analyst industry
have been debated over the last two decades (see Mehran and Stulz (2007) for a survey). As part
of this debate, researchers have used a variety of factors as evidence that these conflicts lead to
strategically biased behavior. For example, investment-banking affiliated analysts issue more
favorable growth forecasts and recommendations (Lin and McNichols 1998; Dugar and Nathan
1995) and are slower to downgrade their recommendations (O'Brien et al. 2005) than unaffiliated
analysts; and analysts appear to be able to generate trading volume for their brokerage firm by
issuing positive stock recommendations (Irvine 2004). More recently, Malmendier and
Shanthikumar (2014) offer another proxy as evidence of strategic analyst behavior – analysts
issuing relatively low earnings estimates at the same time as those analysts issue relatively
positive stock recommendations, which they refer to as analysts speaking “in two tongues”.
Following the 2003 Global Analyst Research Settlement (the settlement), the effect of
analysts’ conflicts of interest seemed to dissipate: Recommendations became more closely
aligned with intrinsic value estimates (Barniv et al. 2009; Chen and Chen 2009), and the
distribution of stock recommendations became more balanced, as analysts were more willing to
issue Hold and Sell recommendations (Kadan et al. 2009). Corwin et al. (2017) provide evidence
that the settlement had a more significant effect on curtailing affiliation bias for the 12 large
6 Bradshaw offers other interpretations as well, including the possibility that analysts may not disclose target prices
when they have less confidence in their valuation inputs.

10
investment banks sanctioned in the settlement, but that there is strong evidence of bias for non-
sanctioned banks both before and after the settlement.
One conclusion from these studies is that individual analysts’ outputs became more
internally consistent after the settlement, implying that the settlement had been effective in
curbing analysts’ biased behavior.7 Broadly speaking, researchers have often characterized
internal consistency in analysts’ outputs as a natural and desirable attribute; as Bradshaw (2011)
notes, “Clearly, recommendations should be linked in some manner to analysts’ valuations” and
thus “rational behavior by analysts would mean that their own earnings forecasts are correlated
with their valuations that provide the basis for their stock recommendations” (p. 30). As another
example, Kanne et al. (2012) study target prices issued with stock recommendations and
characterize the two signals as confirming one another when they move in the same direction.
Motivated by this line of reasoning, we examine the determinants and consequences of
seemingly inconsistent revisions. Our goal is to determine whether these revisions likely reflect
lower quality or incentive-driven analyst behavior, or if they seem to have more benign origins.
In particular, we focus on the relation between earnings estimates and target prices, and do so for
several reasons. First, while much of the prior literature has focused on the relation between
stock recommendations and earnings estimates, we believe there is a tighter link between target
prices and earnings estimates than between stock recommendations and earnings estimates;
recommendations require an assessment of how estimated fair value relates to current stock
price, while target prices should be generally unaffected by stock price.8 Moreover, prior
7 As Barniv et al. (2009) characterize it – analysts practice what they preach when their earnings forecasts are
consistent with a stock recommendation based on those forecasts. 8 There is an argument that the causality does not go from target price estimate to recommendation, but rather the
opposite direction. That is, analysts first determine what recommendation they want to issue for a particular firm,
then they choose a target price that, relative to the current stock price, justifies that recommendation. We believe this
causality is less likely in our sample, in the post Global Settlement period, because analysts have less incentive to
strategically issue recommendations.

11
research suggests that target prices are often linear functions of earnings estimates, justified
based on appropriate P/E ratios or PEG ratios (Bradshaw 2002; Asquith et al. 2005). If target
prices are simply estimated as a simple multiple of estimated earnings, it should be relatively
uncommon for the direction of the earnings estimate revision to differ from the target price
revision.9
Second, we know relatively less about target prices than we do about recommendations
or earnings estimates. In the earlier figure, Bradshaw characterizes the two black boxes as “the
most interesting” steps in the analyst process. Our goal in studying the relation between earnings
estimates and target prices is to better understand more about the second black box (how
earnings estimates are translated into estimated target prices).
Third, target prices seem to have more influence on investors than earnings estimates.
Asquith et al. (2005) study investor response to all components of analyst reports and find that
target price revisions contain information incremental to that in earnings estimate revisions and
recommendation revisions. Moreover, they find that the response to a target price revision is
greater than the response to an earnings estimate revision of the same percentage change.
Feldman et al. (2012) and Kanne et al. (2012) draw similar conclusions in their data.
3. Sample Data
We start by identifying target price revisions – pairs of sequential target price estimates
made by the same analyst for the same firm. For each target price revision, we then identify any
9 It is true that an analyst could revise the earnings estimate and the earnings multiple in different directions.
However, we expect that higher multiples are warranted by firms with higher anticipated earnings growth. All else
equal, it would be unlikely to simultaneously revise upwards the estimated future earnings, but revise downwards to
appropriate multiple.

12
earnings estimates issued by that same analyst that were issued/revised on the same dates. To
illustrate, consider the following analyst outputs:
Date Item Date
6/15/2016 Target price $45
6/15/2016 Earnings estimate for fiscal year 2016 $1.25
9/1/2016 Target price $50
9/1/2016 Earnings estimate for fiscal year 2016 $1.22
In this case, we would start with the target price revision based on the 6/15/2016 and
9/1/2016 target price estimates. We would then match that target price revision to the pair of
estimates for the 2016 fiscal year, and we would classify the revision in target price as
inconsistent with the revision in earnings estimates, because the target price increased while the
earnings estimate was lowered from 6/15/2016 to 9/1/2016. Each target price revision may have
multiple matching earnings estimate revisions, depending on how many fiscal periods the
particular analyst issued estimates for.
We then exclude observations for which analysts introduced other earnings estimates
during the revision window. For example, consider this series of events:
Date Item Date
6/15/2016 Target price $45
6/15/2016 Earnings estimate for fiscal year 2016 $1.25
9/1/2016 Target price $50
9/1/2016 Earnings estimate for fiscal year 2016 $1.22
9/1/2016 Earnings estimate for fiscal year 2017 $3.00
In this case, the analyst has not only revised an existing 2016 earnings estimate, but also
introduced a 2017 earnings estimate. We would eliminate this observation because the analyst is
not solely updating existing estimates, but is also introducing new information. The introduction
of new information makes it difficult to assess the response to the revision because we cannot
disentangle the revision from the new information that comes out simultaneously. (Figure 1

13
shows several examples of possible sequences, and how we would choose to retain or drop
observations in each case.) Finally, we exclude observations where the analyst issues a revised
estimate (either target price or earnings) that exactly equals the prior estimate, as such a revised
estimate could not be easily classified as either consistent or inconsistent with other concurrent
revisions. This last situation is relatively uncommon though, as only about 2% of otherwise-
qualifying observations include a reiteration, rather than a new estimate.
This process results in 377,019 unique target price revision events that have at least one
concurrent earnings revision on the same dates. This sample represents 36% of the total number
of target price revisions that occur during our sample period. The 377,019 target price revisions
result in 1,771,386 pairs of revisions of both the target price and an earnings estimate. The
distribution of these revisions is presented in Table 1, Panel A. For this set of observations, target
prices are more likely to be revised upwards than downwards (54.3% to 45.7%), which reflects
the general tendency for stock prices to increase over time.10
In contrast, earnings estimates tend
to be revised downward more often than upwards (54.2% to 45.8%), which is consistent with
prior research generally documenting an on-average walkdown in analysts’ earnings estimates as
the earnings announcement date approaches (Richardson et al. 2004).
Our focus is on the extent to which these revisions are directionally consistent with one
another. In our sample, 77.6% of revisions are directionally consistent, split about equally
between upward revisions in both target price and earnings estimates (38.8%) and downward
revisions in both (38.8%). The remaining 22.4% of revisions are inconsistent with one another,
and are noticeably asymmetric. Of the 405,654 inconsistent revisions, 279,298 (69%) reflect
10
In expectation, an analyst would increase the target price for a non-dividend-paying stock by the cost of equity
each year. In our sample, the median revision window (i.e., time between the initial and the updated estimate) is 284.
When we examine the determinants of inconsistent analyst signals, we examine the full sample as well as the set of
revisions issued after a relatively brief window (less than 90 days).
14
increased target prices paired with decreased earnings estimates, while only 126,356 (31%)
reflect decreased target prices paired with increased earnings estimates.
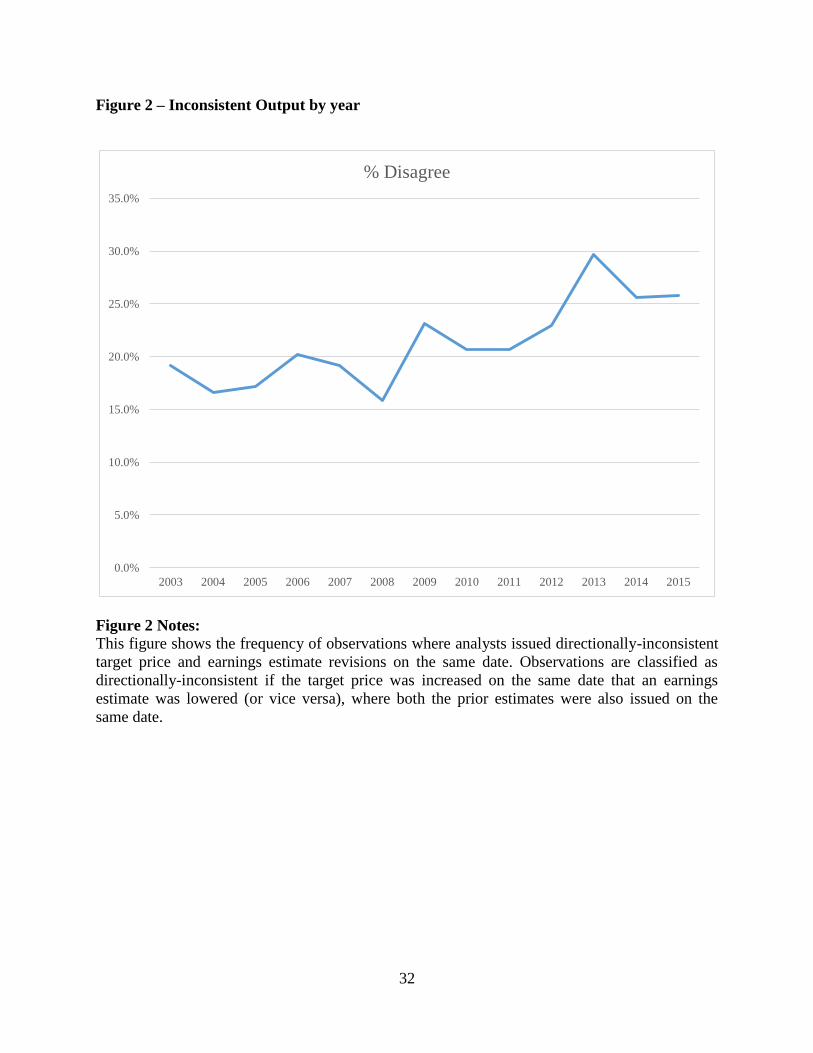
In Panel B, we show the split between consistent and inconsistent revisions over time.
(Figure 2 provides this data graphically.) In the early part of our sample (immediately following
the analyst regulations), roughly 16-20% of analyst revisions are inconsistent. That number
grows to about 26-29% in the most recent years of our sample period. Thus, the act of issuing
seemingly conflicting revisions is prevalent throughout our sample, and is more common in
recent years. In untabulated results, we also find that this pattern is not unique to any particular
industry. When we classify covered firms into the 12 Fama French industries, we find that
conflicting analyst revisions within industry range from about 18% (Business Equipment) to
about 33% (Utilities).
4. Results
4.1. What drives inconsistent revisions?
We start by exploring the factors associated with seemingly inconsistent analyst
revisions. We identify possible determinants based on prior research, discussions with sell-side
analysts, and reading a sample of analyst reports featuring conflicting revisions. We subjectively
group these potential determinants into the several categories.
The first category of potential determinants represents situations where current
accounting earnings are likely to be less useful in estimating firm value. When earnings are less
value relevant, we expect a greater likelihood that analysts revise earnings estimates in one
direction, and a target price in another direction. We use the following proxies to capture
circumstances where a firm’s earnings are less likely to fully capture changes in firm value:

15
When the firm experiences significant variation in profitability, so that no single
period’s earnings are necessarily a good reflection of long-term earnings. We
measure this variation as the standard deviation of firm’s Return on Assets, Std.
Dev (ROA).
When the firm experiences a loss (Hayn 1995). We use a binary variable, Loss,
based on a whether or not the firm was profitable in the most recent fiscal year
before the analyst’s revised estimates.
When the firm has greater investments in intangible assets. We use three different
measures to capture this general construct: R&D/Advertising as the combined
amount spent on Research & Development and Advertising in the prior period,
scaled by total assets; Book-to-market, equal to the book value of firm assets
divided by the market value of those assets; and Intangibles, equal to recognized
Intangible Assets scaled by total assets.
The previous factors are all firm-level characteristics. We also expect some estimates to
conflict with target price revisions more often than other estimates based on the nature of the
estimate. In our sample, there is significant variation in the horizon of earnings estimates, with
the horizon at the 10th
percentile being 63 days out and the horizon at the 90th
percentile being
693 days out. Just as earnings explain a larger proportion of returns over long windows (Easton
et al. 1992), we expect that revisions in longer-horizon estimates will be more likely to be
consistent with target price revisions. We use two variables to capture this notion: Log(Horizon),
the natural logarithm of the number of days between the revised forecast and the fiscal period
end date, and Annual Estimate, a binary variable equal to 1 for estimates of annual periods.
The second category is based on the analyst’s discount rate, or earnings multiple. The
argument that revisions in earnings estimates and target price should be directionally consistent
implicitly assumes that the pricing function/earnings multiple is held constant. But that is
obviously not the case – prices change because of changes in the risk free rate or the risk
premium, even if future cash flows are unchanged. We expect that when market-wide multiples
have changed during the revision period, we are more likely to observe conflicting outputs. For
16
example, an analyst may increase an individual firm’s estimated earnings, but apply a lower
earnings multiple due to a decline in market-wide multiples, so that the net effect on the target
price is negative.11
We account for this effect by including the absolute value of the value-
weighted market return during the revision period, |Market Return|. This variable would capture
both changes in the risk-free rate and changes in the market-wide risk premium during the
revision period. We expect that larger absolute returns are more likely to lead to revised
multiples, leading to conflicting analyst revisions. We also include changes in the individual
analyst’s long term growth forecast for the given firm (ΔLTG Forecast) which should capture
changes in the firm specific risk premium. Again, we expect the larger the change in the firm
specific risk premium the more likely to lead to conflicting analyst revisions.
A third category is based on whether or not the firm has accessed the capital markets for
financing over the prior year. Prior literature supports the assertion that one of the sources of
conflicts of interest is a tendency by analysts to issue overly optimistic research for firms around
new equity and debt offerings (Bradshaw et al. 2006). If these conflicts of interest are partially
responsible for conflicting analyst revisions we would expect recent issuances of either debt or
equity to increase the likelihood of an inconsistent revision. We include the variable Debt Issue
which is an indicator equal to one if the firm issued any debt during the previous fiscal year, as
well as the variable Stock Issue which is an indicator variable equal to one if the number of
common shares outstanding for the firm increased by more than 10% over the prior fiscal year.
Both of these variables are expected to be positively related to the likelihood of inconsistent
revisions if conflicts of interest play a role in this behavior.
11
Note that this phenomena should apply to changes in market-wide or industry-wide multiples, but we do not
expect changes firm-specific multiples to lead to conflicting analyst outputs. This is because, all else equal, increases
in earnings estimates should lead to higher earnings multiples because higher multiples are justified by higher
anticipated earnings growth. So the change in multiple would have the same directional effect on target price as the
change in the earnings estimate, and lead to consistent revisions.

17
A final category is based on the analysts’ individual characteristics and environment. If
seemingly inconsistent revisions are a sign of a lower quality analyst, we expect that Analyst
Tenure and portfolio size, Analyst Coverage, (which we expect to be positively correlated with
analyst quality) will be associated with the likelihood of observing those conflicting revisions.
Because we are looking at analysts’ revisions, rather than simply analysts’ estimates, we also
take into account the possibility that a conflicting signal is driven by the initial estimate, rather
than the revision. In other words, the analyst in question may have originally issued a target price
and earnings estimates that were hard to reconcile with one another, and the subsequent revision
brought each output to a more appropriate level. To capture this factor, we construct a dummy
variable equal to 1 for the following cases: the original analyst’s earnings estimate was above
(below) the median for all analysts covering that firm, but the target price estimate was below
(above) the median for all analysts covering that firm. We expect that when analysts had
divergent views about estimated earnings versus target prices, Pre-Revision Inconsistency, their
subsequent revisions are more likely to be directionally different.
We provide descriptive statistics of all these variables in Table 2. We provide the results
of our determinants model in Table 3. Column (1) presents results for the full sample, column (2)
includes only those observations where the revision was made relatively quickly after the initial
estimate (i.e., less than 90 days), and column (3) includes analyst fixed effects.12
We find mixed
evidence that accounting factors play an important role in predicting inconsistent analyst
revisions. On one hand, we find that inconsistent signals are significantly more likely for shorter-
horizon estimates (coefficient estimates on Log(Horizon) and Annual Estimate) and revisions
following the reporting of a loss (coefficient estimates on Loss), or significant expenditures on
12
Due to the incidental parameters problem when we include analyst fixed effects in column (3) we estimate an
OLS regression as opposed to a logistic regression, which is used in columns (1) and (2).

18
R&D and Advertising (coefficient estimate on R&D/Ads). On the other hand, we find no
significant association between the remaining accounting variables meant to capture the extent of
the firm’s profit variation, intangible assets, and growth opportunities.
The results for |Market Return|, our proxy for changes in market-wide multiples, differ
depending on what sample we use. If we use the full sample, we find a positive and significant
relation between absolute market returns and the likelihood of issuing inconsistent revisions. On
the other hand, we find no evidence of that relation in the sample of shorter-window revisions.
As for the difference between the two columns, we offer the following possible explanation:
While market-wide multiples would normally be an important factor in estimating target prices,
some analysts’ revisions will be made in response to firm-specific events and not because the
appropriate multiple has changed. When analysts issue a revised target price soon after issuing
their prior estimate, that revision is more likely to be due to a firm-specific event, such as a
restructuring announcement or new product. In these cases, changes in market-wide multiples
would have little to do with the analyst’s update.
Finally, we find evidence consistent with prior literature that inconsistent analyst outputs
are more likely to occur shortly after a firm has accessed the capital market. We also find little
evidence that analyst quality, at least based on our two proxies, plays a role in predicting
inconsistent analyst revisions. We find a significant relation for only one of the two proxies
(Analyst Tenure), and only for the sample of shorter-window revisions in column (2).
One question that comes up for variables like Log(Horizon) is whether it is truly the
horizon of the estimate that matters, or whether some correlated factor generates the negative
relation we observe in Table 3. For example, it may be the case that certain analysts choose to
issue longer horizon estimates, and those analysts have a greater tendency to issue conflicting

19
revisions. Or, alternatively, the covered firm has some unobservable attribute that leads to
conflicting revisions. In order to better determine whether horizon is a driving factor behind
conflicting revisions, we take advantage of one feature of our data. For any given target price
revision by a single analyst for a single firm, we may have multiple earnings estimates (covering
different fiscal periods) for that same analyst and the same firm at the same time.
We test for the effect of horizon while controlling for all analyst and firm characteristics
by using a conditional logistic model, which effectively includes a fixed effect at the analyst-
firm-target price revision level. In cases where the analyst issued only a single estimate, the
observation would be excluded. Similarly, in cases where all of the earnings revisions were
consistent (or all were inconsistent) with the sign of the target price revision, those observations
would be excluded as well. But if the analyst revised multiple earnings estimates, and only some
of them were inconsistent with the target price revision, we can cleanly identify the effect of
estimate horizon.
Table 3, Panel B shows the results. Column (1) of the regression includes only a single
variable, Log(Horizon), other than the fixed effects, and a substantially smaller number of
observations than in Panel A.13
Column (2) also includes the independent variable Annual
Estimate as this measure also varies within target price revision events as the same analyst can
issue both a quarterly and an annual earnings revision with the same target price revision for one
firm. Across both columns the inference is clear. We continue to identify a significant negative
relation between both Log(Horizon) and Annual Estimate and the likelihood of an inconsistent
revision. These results confirm that longer-horizon earnings estimates are more likely to be
consistent with target price revisions.
13
Note that all other independent variables (both firm and analyst characteristics) would be subsumed by the fixed
effects in this regression.
20
4.2. Do investors react similarly when responding to earnings announcements?
We next ask whether investors seem to act similar to analysts in terms of how they
interpret earnings information. If analysts’ inconsistent revisions reflect analyst-specific factors
(e.g., incentives or analyst quality), then we would not expect a correlation between the types of
covered firms that are the subject of inconsistent revisions and the way that investors respond to
earnings information. On the other hand, if inconsistent analyst revisions are the natural product
of accounting and economic factors, then we would expect those same factors to cause a wedge
between a firm’s earnings and how investors value the firm. That is, if firm economics lead
analysts to view target prices and earnings estimates as weakly linked, we expect investors to
behave in a similar way.
We perform two tests, both focused on short-window earnings announcement returns.
First, we examine whether the sign of the earnings surprise differs from the sign of the
contemporaneous stock return. We perform a logistic regression where the dependent variable is
equal to 1 when the sign of the earnings surprise is not equal to the sign of the market-adjusted 3-
day stock return surrounding the earnings announcement. Our construct of interest is the
likelihood of analysts issuing inconsistent revisions for the firm. We measure this in two ways.
First, we use the percentage of target price/earnings estimate revisions issued for that firm in the
last 12 months that were inconsistent. Second, we use a binary variable equal to 1 if that
percentage is in the top quartile of all firm-year observations.
Results of this test are presented in Panel A of Table 4. The variable of interest,
Inconsistent Analysts, is positively associated with the likelihood of earnings announcements
generating a short-window return that differs in sign from the earnings surprise. However, the
21
statistical strength of this association depends upon how we measure that variable. When we
define Inconsistent Analysts as a discrete variable (Column 1), the coefficient estimate is
significantly different from 0 at the p<0.05 level. When we define Inconsistent Analysts as the
percentage of inconsistent revisions in the prior 12 months (Column 2), the coefficient is not
statistically significant at even the p= 0.10 level.
The control variables all have the expected signs. Larger magnitude earnings surprises
are less likely to have conflicting returns. When earnings surprises are close to 0, it’s more
common for the returns to differ from the sign of the surprise. When the earnings surprise is
negative, there is less likely to be conflicting (positive) returns; investors are likely to view
earnings surprises equal to or slightly above zero as the product of earnings management, and
respond negatively to small positive earnings surprises, but not respond positively to small
negative earnings surprises. Larger firms are less likely to have conflicting returns, because
earnings are more likely to be value relevant. Similarly, firms with volatile earnings are more
likely to have conflicting returns because the current period’s earnings surprise is less likely to
be reflective of future earnings. High book-to-market firms are more likely to have conflicting
returns because they may be financially distressed.
We next test whether earnings response coefficients vary with the likelihood of
conflicting analyst signals. We expect that if analysts’ target price revisions differ in sign from
their earnings estimate revisions due to an economically weak link between price and earnings,
then investors’ price responses to actual earnings will be weaker. In Table 5, we show the results
of a typical ERC regression, where 3-day earnings announcement stock returns are regressed on
earnings surprises and other control variables. Our primary variable of interest is the interaction
term Earnings Surprise* Inconsistent Analysts, where we use the same two measures to identify

22
the extent of inconsistent revisions. Consistent with our expectations, this interaction term is
negative for both measures (at the 1% significance level in Column 1 and the 10% significance
level in Column 2), indicating that investors place a lower valuation weight on earnings surprises
for the same firms where analysts are more likely to have target price revisions that differ from
earnings estimate revisions. Overall, the results in Table 4 and Table 5 provide further evidence
that accounting and economic factors are associated with weaker links between firms’ earnings
and valuations, which is naturally associated with analysts’ revisions that appear to be internally
inconsistent.
4.3. Are inconsistent revisions a sign of lower-quality revisions?
Next, we attempt to more directly investigate whether inconsistent revisions indicate
lower-quality, or even strategically-issued, estimates, as some prior studies imply. We do this by
examining the accuracy of both revised target prices and revised earnings forecasts. If
inconsistent revisions are a result of strategically-issued analyst outputs, then we would expect to
find that one, if not both, of the outputs is less accurate when the revisions are directionally
inconsistent than when they both move in the same direction. If, on the other hand, there are
accounting or economic reasons for revisions to move in opposite directions we would not
predict any differential accuracy of inconsistent versus consistent revisions.
To test whether inconsistent target price revisions are more accurate, we rely on two
measures examined in Bradshaw et al. (2013). First, we examine the absolute difference between
the revised target price and the actual stock price 12 months after the release of the target price
(|TP_Error|). The target prices we examine in this paper are all 12 month ahead target prices, so
if the stock price 12 months after the issuance of the target price is closer to the target price, we
interpret that as a more accurate estimate. Second, we code an indicator variable equal to 1 if the
23
stock price met or exceeded the target price at any time during the subsequent 12 months, and 0
if it did not (TP_MetAny).
We regress each of these accuracy measures on Inconsistent as well as firm level
controls and firm and calendar year fixed effects. Table 6 reports the results of these regressions.
Columns (1) and (2) present the results with |TP_Error|, and TP_MetAny as the dependent
variables, respectively, including one observation for each target price-forecast horizon pair.
Columns (3) and (4) present results when we aggregate observations to the target price revision
level. Here, we replace Inconsistent with %Inconsistent (the percentage of earnings forecasts
released with that target price revision that were inconsistent) as the independent variable of
interest. Across both samples we find a negative and significant coefficient estimate on the
measure of inconsistency when |TP_Error| is the dependent variable, suggesting that along this
dimension of accuracy target price revisions are actually more accurate when they disagree with
the direction of the contemporaneous earnings forecast.
We take a similar approach to assess the accuracy of earnings forecasts. We first regress
the absolute value of forecasted earnings per share minus actual earnings per share times 100
divided by stock price (Forecast Accuracy) on Inconsistent, control variables, and firm and year
fixed effects. Table 7 Column (1) reports the results of this regression which shows a negative
and significant coefficient estimate on Inconsistent. This finding suggests that earnings forecasts
are also more accurate when they disagree with the direction of the contemporaneous earnings
forecast. Columns (2) and (3) take advantage of the data structure similar to what is done in
Table 3 Panel B and include a target price revision event fixed effects. Both columns continue to
report a negative and significant coefficient estimate on Inconsistent further validating the results
in Column (1).

24
4.4. Does investor response to analyst revisions vary with the consistency of those revisions?
We next focus on how investors respond to analysts’ revisions, and whether that response
varies with the internal consistency of those revisions. We regress the short-window stock
market response on analysts’ target price revisions and earnings estimate revisions, and include
firm and year fixed effects. To allow for easier comparison across coefficients, we standardize
the independent variables by subtracting the sample mean and dividing by the sample standard
deviation for each independent variable.
Table 8 presents the results of this analysis. Column (1) shows the results for the full
sample. Consistent with the results in Asquith et al. (2005) and Feldman et al. (2012), we find
that investor response is significantly associated with both the target price revision and the
earnings estimate revision. Moreover, the response to the target price revision is more than ten
times larger than the response to the revision in the same analyst’s earnings estimate. Of course,
the lower weight on the earnings signal isn’t surprising – if the analyst’s valuation already
incorporates the earnings information, the information in the target price would subsume the
information in the earnings estimate.
In Columns (2) and (3), we separate the sample into those revisions that are directionally
inconsistent (Column 2) and those that are directionally consistent (Column 3). If inconsistent
revisions are a function of analysts strategically biasing one of the outputs then we would expect
investors to decrease their reliance on, or even ignore, that signal. Similarly, if consistent
revisions reflect the truthful disclosure of both estimates, we would expect investors to respond
strongly to the information in each signal. However, that is not what we find. In both
subsamples, the response to the target price revision is significantly positive. That relation is

25
stronger when the two signals are consistent with each other (0.029 in Column 3 vs. 0.02 in
Column 2); investors respond more strongly to the information in target prices when the earnings
estimates revisions are in the same direction. This result is consistent with the results in Kecskés
et al. (2016), who show that the market response to analyst recommendation revisions is stronger
when those revisions are issued with earnings estimates revised in the same direction.
However, the investor response to earnings estimate revisions is strikingly different
across the two columns. When the two signals are inconsistent with one another (Column 2),
there is a significantly positive association between the stock market response and the earnings
estimate revision. On the other hand, when the earnings estimate is consistent with the target
price revision (Column 3), there is no detectable association between the earnings revision and
the stock market response.
Our interpretation of these results is that inconsistent analyst revisions do not reflect
strategically biased estimates that are consequently downweighted by investors. Instead, our
results suggest that investors perceive both the target price and the earnings estimate revisions as
conveying credible information. When the two signals are inconsistent with one another,
investors respond to both. Otherwise, the information in the target price revision subsumes the
information in the earnings estimate. As a result, earnings estimate revisions issued in
conjunction with target price revisions are only incrementally informative when the revisions are
directionally inconsistent. Consistent with our findings in prior tests, this result provides
additional evidence in support of the idea that seemingly inconsistent revisions are actually of
higher quality than consistent revisions.
Columns (4) and (5) highlight one important implication of this finding. Here we show
the results of regressing the 3-day return on only the earnings estimate revision, for the same two

26
subsamples. In Column (5) (the consistent revisions subsample), we see the expected positive
and significant relation, an upward (downward) revision in earnings estimate by an analyst is
correlated with a corresponding upward (downward) movement in stock price. However, in
Column (4), for the subsample of inconsistent analyst revisions, we find a significantly negative
relation between the earnings update and the stock market response. One obvious conclusion is
that researchers investigating the response to earnings revisions, and how those revisions vary
with different factors, should carefully consider the role of concurrent target price revisions, and
how those target price revisions relate to the earnings revisions.
4.5. Why are inconsistent revisions more accurate?
The fact that inconsistent earnings estimate revisions and target price revisions are more
accurate may initially seem counter-intuitive for at least two reasons. First, as highlighted in
Figure 1 of Bradshaw (2009) earnings estimates should be one input into the valuation process
and prior literature documents a positive association between earnings estimates and target prices
in the cross section (Bandyopadhyay et al. 1995; Bradshaw 2004; Ertimur et al. 2007). Second,
some of the prior research explicitly views inconsistent analyst outputs as prima facie evidence
of analysts’ bias or conflicts of interest, which would suggest these inconsistent revisions might
be of lower quality, not higher quality (Lin and McNichols 1998; Chen and Chen 2009; Brown
and Huang 2013; Malmendier and Shanthikumar 2014).
One possible explanation for our documented relations builds on the fact that earnings
estimates are not necessarily the only input to analysts’ target price calculations. That is, even
though analysts often use simple earnings multiples to generate target prices, it may be the case
that some analysts employ richer models that incorporate non-earnings metrics like book value,

27
profit margins, or even off-balance sheet items. Conflicting revisions may indicate that analysts
are using more than a simple earnings multiple to value the firm. Valuation models that employ a
variety of inputs, rather than a single earnings number, will naturally be less tied to estimates of
the single earnings number, and revisions in those valuations will be more likely to be
inconsistent with the revisions in the earnings number.
We perform the following exploratory analysis to assess this possible explanation. We
calculate the number of different non-EPS metrics that the individual analyst forecasts for a
given firm at any time over the prior 12 months (N_Analyst Outputs). We first include this
variable in our determinants model. The result of that regression (similar to the regression shown
in Table 3) is shown in Table 9, Panel A. We see that the coefficient estimate on N_Analyst
Outputs, is positive and significant. This result suggests that the more outputs an analyst chooses
to explicitly estimate, the more likely that analyst is to issue a seemingly inconsistent revision.
That result would be consistent with analysts who use more complex valuation models being
more likely to issue seemingly inconsistent revisions.
We then include this same variable in our forecast and target price accuracy tests. In
Table 9, Panel B, we show that both earnings estimates and target prices are more accurate when
the analyst explicitly issues more non-earnings estimates. Again, these results are consistent with
the idea that forecasting a richer set of information is correlated with forecasting more accurate
information. We caution that this evidence is only exploratory, and that a more complete
investigation of this conjecture is beyond the scope of our current paper.
5. Conclusion

28
This paper investigates seemingly inconsistent analyst revisions of target prices and
earnings forecasts, where both outputs are released on the same date and are then revised on the
same date, but the revisions are in opposite directions. We first highlight that these seemingly
inconsistent revisions are relatively common, making up more than 20% of the target price
revisions in our sample. We then provide evidence that, contrary to the idea that inconsistent
analyst outputs represent evidence of the conflicts of interest or strategic behavior by analysts,
these seemingly inconsistent revisions are at least partially driven by accounting and economic
factors. We go on to show that both outputs in these seemingly inconsistent revisions are more
accurate, on average, than consistent revisions. Finally, we show that the market response to
analyst revision outputs depends critically on the relation between the outputs. Specifically, we
show that the market only places incremental weight on an earnings forecast revision that is
released concurrently with a target price revision if the two move in opposite directions.
The evidence presented here results in two main takeaways that can be useful to future
research. First, we show that inconsistencies among an individual analyst’s different outputs is
not, on its own, evidence that the analyst is acting strategically or that he is subject to conflicts of
interest. It is entirely possible, and even likely, that those inconsistencies have arisen for rational,
economic reasons. Second, we highlight the importance of considering concurrent revisions in
target prices when investigating the market’s reaction to earnings forecast revisions. Our
evidence suggests that failing to do so results in a negative and significant coefficient estimate on
the earnings forecast revision when that revision is directionally inconsistent with a concurrent
target price revision.
29
References
Asquith, P., M. B. Mikhail, and A. S. Au. 2005. Information Content of Equity Analyst Reports.
Journal of Financial Economics 75 (2):245-282.
Bandyopadhyay, S. P., L. D. Brown, and G. D. Richardson. 1995. Analysts' Use of Earnings
Forecasts in Predicting Stock Returns: Forecast Horizon Effects. International Journal of
Forecasting 11 (3):429-445.
Barniv, R., O. K. Hope, M. J. Myring, and W. B. Thomas. 2009. Do Analysts Practice What
They Preach and Should Investors Listen? Effects of Recent Regulations. The Accounting
Review 84 (4):1015-1039.
Bradshaw, M. T. 2002. The Use of Target Prices to Justify Sell-Side Analysts' Stock
Recommendations. Accounting Horizons 16 (1):27-41.
———. 2004. How Do Analysts Use Their Earnings Forecasts in Generating Stock
Recommendations? The Accounting Review 79 (1):25-50.
———. 2009. Analyst Information Processing, Financial Regulation, and Academic Research.
The Accounting Review 84 (4):1073-1083.
———. 2011. Analysts’ Forecasts: What Do We Know after Decades of Work? SSRN eLibrary.
Bradshaw, M. T., L. D. Brown, and K. Huang. 2013. Do Sell-Side Analysts Exhibit Differential
Target Price Forecasting Ability? Review of Accounting Studies 18, no. 4: 930–55.
Bradshaw, M. T., S. A. Richardson, and R. G. Sloan. 2006. The Relation Between Corporate
Financing Activities, Analysts’ Forecasts and Stock Returns. Journal of Accounting and
Economics 42: 53-85.
Brown, L. D., A. C. Call, M. B. Clement, and N. Y. Sharp. 2015. Inside the “Black Box” of Sell-
Side Financial Analysts. Journal of Accounting Research 53 (1):1-47.
Brown, L. D., and Kelly Huang. 2013. Recommendation-Forecast Consistency and Earnings
Forecast Quality. Accounting Horizons 27, no. 3: 451–67.
Chen, C. Y., and P. F. Chen. 2009. NASD Rule 2711 and Changes in Analysts' Independence in
Making Stock Recommendations. The Accounting Review 84 (4):1041-1071.
Clement, M. B., and S. Y. Tse. 2003. Do Investors Respond to Analysts' Forecast Revisions as If
Forecast Accuracy Is All That Matters? The Accounting Review 78 (1):227-249.
Corwin, S. A., S. A. Larocque, and M. A. Stegemoller. 2017. Investment Banking Relationships
and Analyst Affiliation Bias: The Impact of the Global Settlement on Sanctioned and
Non-Sanctioned Banks. Journal of Financial Economics 124 (3):614-631.
Dugar, A., and S. Nathan. 1995. The Effect of Investment Banking Relationships on Financial
Analysts' Earnings Forecasts and Investment Recommendations. Contemporary
Accounting Research 12 (1):131-160.
Easton, P. D., T. S. Harris, and J. A. Ohlson. 1992. Aggregate Accounting Earnings Can Explain
Most of Security Returns: The Case of Long Return Intervals. Journal of Accounting and
Economics 15 (2-3):119-142.
Ertimur, Y., J. Sunder, and S. V. Sunder. 2007. Measure for Measure: The Relation between
Forecast Accuracy and Recommendation Profitability of Analysts. Journal of Accounting
Research 45 (3):567-606.
Feldman, R., J. Livnat, and Y. Zhang. 2012. Analysts’ Earnings Forecast, Recommendation, and
Target Price Revisions. Journal of Portfolio Management 38 (3):120-132.

30
Francis, J., and L. Soffer. 1997. The Relative Informativeness of Analysts' Stock
Recommendations and Earnings Forecast Revisions. Journal of Accounting Research 35
(2):193-211.
Gleason, C. A., W. Bruce Johnson, and H. Li. 2013. Valuation Model Use and the Price Target
Performance of Sell-Side Equity Analysts. Contemporary Accounting Research 30
(1):80-115.
Hayn, C. 1995. The Information Content of Losses. Journal of Accounting and Economics 20
(2):125-153.
Irvine, P. J. 2004. Analysts' Forecasts and Brokerage-Firm Trading. The Accounting Review 79
(1):125-149.
Kadan, O., L. Madureira, R. Wang, and T. Zach. 2009. Conflicts of Interest and Stock
Recommendations: The Effects of the Global Settlement and Related Regulations.
Review of Financial Studies 22 (10):4189-4217.
Kanne, S., J. Klobucnik, D. Kreutzmann, and S. Sievers. 2012. To Buy or Not to Buy? The
Value of Contradictory Analyst Signals. Financial Markets and Portfolio Management
26 (4):405-428.
Kecskés, A., R. Michaely, and K. L. Womack. 2016. Do Earnings Estimates Add Value to Sell-
Side Analysts’ Investment Recommendations? Management Science, Forthcoming.
Keung, E. C. 2010. Do Supplementary Sales Forecasts Increase the Credibility of Financial
Analysts' Earnings Forecasts? The Accounting Review 85 (6):2047-2074.
Lev, B., and P. Zarowin. 1999. The Boundaries of Financial Reporting and How to Extend
Them. Journal of Accounting Research 37 (2):353-385.
Lin, H.-w., and M. F. McNichols. 1998. Underwriting Relationships, Analysts' Earnings
Forecasts and Investment Recommendations. Journal of Accounting and Economics 25
(1):101-127.
Malmendier, U., and D. Shanthikumar. 2014. Do Security Analysts Speak in Two Tongues?
Review of Financial Studies 27 (5):1287-1322.
Mehran, H., and R. M. Stulz. 2007. The Economics of Conflicts of Interest in Financial
Institutions. Journal of Financial Economics 85 (2):267-296.
O'Brien, P. C., M. F. McNichols, and H.-W. Lin. 2005. Analyst Impartiality and Investment
Banking Relationships. Journal of Accounting Research 43 (4):623-650.
Richardson, S., S. H. Teoh, and P. D. Wysocki. 2004. The Walk-down to Beatable Analyst
Forecasts: The Role of Equity Issuance and Insider Trading Incentives. Contemporary
Accounting Research 21 (4):885-924.

31
Figure 1 – Identifying Target Price/Earnings Estimate Pairs
Row
# Initial Date Interim Date
Revision
Date
# of valid
observations
1
TP, Q1, Y1,
Y2
TP, Q1, Y1,
Y2 3
2
TP, Q1, Y1,
Y2 Y2
TP, Q1, Y1,
Y2 3
3 TP, Y1, Y2
TP, Y1 1
4 TP, Y1, Y2 Y2 TP, Y1 0
5 TP, Y1, Y2 Q1 TP, Y1, Y2 0
6 TP, Y1 Y2 TP, Y1 0
TP = Target Price
Q1 = 1 quarter ahead earnings
forecast
Y1 = 1 year ahead earnings forecast
Y2 = 2 year ahead earnings forecast
Figure 1 Notes: This figure illustrates six different patterns in time during which target prices
and earnings forecasts can be issued and revised, and shows which observations are included in
our sample. When TP, Q1, Y1 or Y2 is listed in the column under either 'Initial Date', 'Interim
Date', or 'Revision Date' it means that analyst output was released on that date. We begin
constructing our sample by identifying an initial target price release and a subsequent revision of
that target price. As such, there are no instances where a target price is revised between the initial
date and the revision date, but there are instances where earnings forecasts are revised between
these two dates. In order for a target price revision observation to be included in the final sample
no earnings forecast may be released from the day after the initial date, up to and including the
revision date for a horizon that was not also forecasted on both the initial date and the revision
date.
Row 1 is an example of a valid pattern that results in 3 observations in the sample (i.e. TP/Q1,
TP/Y1, & TP/Y2). Row 2 highlights that revisions between the two dates are allowed as long as
the forecast horizon is also estimated on both the initial date and the revision date. Row 3
highlights that not all forecast horizons released on the initial date must be released on the
revision date. However, row 4 demonstrates that any horizon forecasted on the initial date but the
not revised date cannot be revised during the interim period. Finally, rows 5 and 6 show that any
forecast during the interim period, whether it be for a horizon inside the longest horizon
forecasted on both dates (e.g. Row 5) or outside the longest horizon forecasted on both dates
(e.g. Row 6) negates all observations linked to that target price revision from inclusion in the
sample.
32
Figure 2 – Inconsistent Output by year
Figure 2 Notes:
This figure shows the frequency of observations where analysts issued directionally-inconsistent
target price and earnings estimate revisions on the same date. Observations are classified as
directionally-inconsistent if the target price was increased on the same date that an earnings
estimate was lowered (or vice versa), where both the prior estimates were also issued on the
same date.
0.0%
5.0%
10.0%
15.0%
20.0%
25.0%
30.0%
35.0%
2003 2004 2005 2006 2007 2008 2009 2010 2011 2012 2013 2014 2015
% Disagree

33
Table 1 – Sample distribution
Panel A: Frequency of upward/downward revisions in target prices and earnings estimates
Earnings Estimate
Revised Down
Earnings Estimate
Revised Up Total
Target Price Revised Down 700,634
(38.8%)
126,356
(7.0%)
826,990
(45.7%)
Target Price Revised Up 279,298
(15.4%)
701,773
(38.8%)
981,071
(54.3%)
Total 979,932
(54.2%)
828,129
(45.8%)
1,808,061
(100%)
Consistent 1,402.407 77.6%
Inconsistent (shaded cells) 405,654 22.4%
Total 1,808,061 100.0%
Panel B: Inconsistent revisions by year
Year Consistent Inconsistent Total % Inconsistent
2003 25,672 6,051 31,723 19.1%
2004 52,140 10,400 62,540 16.6%
2005 61,539 12,690 74,229 17.1%
2006 68,492 17,265 85,757 20.1%
2007 83,178 19,739 102,917 19.2%
2008 132,306 25,001 157,307 15.9%
2009 117,357 35,372 152,729 23.2%
2010 116,140 30,204 146,344 20.6%
2011 151,402 39,652 191,054 20.8%
2012 144,174 43,038 187,212 23.0%
2013 133,685 56,656 190,341 29.8%
2014 151,085 52,134 203,219 25.7%
2015 165,237 57,452 222,689 25.8%
Total 1,402,407 405,654 1,808,061 22.4%
Notes: Panel A of this table presents the frequency of upward and downward earnings forecast
and target price revisions in a 2x2 matrix. Shaded cells in the off diagonal are observations that
we refer to as inconsistent revisions. Panel B presents the breakdown of consistent and
inconsistent revision observations by year. The last column of Panel B shows the percentage of
revisions each year that are inconsistent where there is an upward target price revision and a
downward earnings forecast revision or vice versa.

34
Table 2 – Univariate Statistics
Mean Std Dev 10th Pctl Median 90th Pctl
Inconsistent 0.224 0.417 0 0 1
Horizon 346.273 268.795 63 291 693
Ln_Horizon 5.496 0.930 4.143 5.673 6.541
R&D/Advertising 0.042 0.068 0.000 0.008 0.133
Book-to-Market 0.634 0.277 0.264 0.627 0.996
Intangibles 0.159 0.186 0.000 0.082 0.450
Std Dev. (ROA) 0.059 0.083 0.006 0.031 0.136
Annual Estimate 0.399 0.490 0 0 1
Loss 0.159 0.365 0 0 1
|Market Return| 0.051 0.051 0.006 0.038 0.107
Pre-Revision Inconsistency 0.353 0.478 0 0 1
ΔLTG Estimate -0.039 1.924 0.000 0.000 0.000
Debt Issue 0.597 0.490 0 1 1
Stock Issue 0.163 0.369 0 0 1
Analyst Tenure 13.059 8.835 3 11 27
Log(Analyst Coverage) 2.732 0.553 2.079 2.833 3.296
N_Analyst Outputs 7.329 3.735 2 7 12
Notes: This table presents descriptive statistics for the variables included in the determinants
regression. Inconsistent is an indicator variable equal to 1 for earnings forecast revisions that
move in the opposite direction from the target price revision and 0 otherwise. Horizon is the
number of days between the revised forecast and the fiscal period end date of the period being
forecast. Log(Horizon) is the log of Horizon. Accounting variables are measured as of the end of
the most recent fiscal year prior to the release of the initial forecast date. R&D/Advertising is the
sum of R&D expenditures and Advertising divided by total assets. Book-to-market is the book
value of assets divided by the book value of assets minus the book value of equity plus the
market value of equity. Intangibles is total intangible assets divided by total assets. Std.
Dev(ROA) is the standard deviation of annual ROA over the previous 5 fiscal years. Annual
Estimate is an indicator variable if the earnings forecast is for an annual fiscal period and 0 if the
forecast is for a quarterly fiscal period. Loss is an indicator if the firm reported a loss in the prior
fiscal year and 0 otherwise. |Market Return| is the absolute value of the value weighted market
return between the date of the initial forecast date and the forecast revision date. Pre-Revision
Inconsistency is an indicator variable if the initial target price was above the median consensus
target price and the initial earnings forecast was below the median consensus earnings forecast or
vice versa and 0 if both were either above or below the median consensus. ΔLTG Estimate is the
most recent long term growth estimate made by the analyst as of the revision date minus the
most recent long term growth estimate issued no more than 90 days prior to the initial estimate
date. Debt Issue is an indicator variable equal to one if the firm issued debt during the prior fiscal
year and zero otherwise. Stock Issue is an indicator variable equal to one if the total shares
outstanding increased by 10% or more over the prior fiscal year and zero otherwise. Analyst
Tenure is the number of years since the analyst first showed up in the IBES database covering

35
any firm. Log(Analyst Coverage) is the natural log of the total number of firms that an analyst
provides at least one earnings forecast for during the same calendar year. N_Analyst Outputs is
the number of different metrics forecasted by the analyst for the specific firm excluding EPS
(e.g. book value per share, cash flow per share, EBITDA, etc.).

36
Table 3 – Determinants of Inconsistent Signals
Panel A: Full Sample
Dependent Variable: Inconsistent Indicator variable equal to 1 if the earnings estimate revision
is directionally opposite concurrent target price revision.
All
Observations Within 90 Days
All
Observations
Independent Variable (1) (2) (3)
Log(Horizon) -0.119*** -0.113*** -0.022***
(0.005) (0.006) (0.001)
R&D/Ads 0.483*** 0.575** 0.082***
(0.179) (0.229) (0.023)
Book-To-Market 0.017 0.079 0.022***
(0.061) (0.053) (0.006)
Intangibles 0.007 -0.065 -0.003
(0.068) (0.077) (0.006)
Std. Dev(ROA) -0.064 -0.019 0.011
(0.113) (0.105) (0.014)
Annual Estimate -0.244*** -0.276*** -0.045***
(0.013) (0.015) (0.003)
Loss 0.152*** 0.155*** 0.022***
(0.030) (0.037) (0.004)
|Market Return| 2.141** 0.718 0.341*
(0.851) (0.956) (0.166)
ΔLTG Forecast 0.003 0.003 0.000
(0.002) (0.002) (0.000)
Pre-Revision
Inconsistency 0.071*** 0.074*** 0.007***
(0.014) (0.015) (0.002)
Debt Issue 0.108*** 0.119*** 0.007**
(0.019) (0.021) (0.002)
Stock Issue 0.062*** 0.078*** 0.006*
(0.021) (0.019) (0.003)
Analyst Tenure -0.001 -0.002**
(0.001) (0.001)
Log(Analyst Coverage) 0.018 0.010
(0.014) (0.016)
Year fixed effects Yes Yes Yes
Industry fixed effects Yes Yes No
Analyst fixed effects No No Yes
Observations 1,525,334 1,084,049 1,667,178
Psuedo R-squared 0.023 0.024 0.050

37
Table 3 – Determinants of Inconsistent Signals
Panel B – Conditional Logistic Model
Dependent Variable: Inconsistent Indicator variable equal to 1 if the earnings estimate revision
is directionally opposite concurrent target price revision.
Independent Variable (1) (2)
Log(Horizon) -0.295*** -0.212***
(0.003) (0.003)
Annual Estimate
-0.517***
(0.007)
Target price revision FE Yes Yes
Observations 674,476 674,476
Pseudo R-square
0.019 0.031
Notes: This table presents the results of regressions of the variable Inconsistent on several
potential determinants. Panel A presents results of a logistic regression which includes both year
and Fama French 12 industry fixed effects in Columns (1) and (2). Column (1) presents results
for the full sample. Column (2) presents results for only those revisions that happen within 90
days of the initial estimate date. Column (3) of Panel A presents results of an OLS regression for
the full sample and includes both year and analyst fixed effects. Panel B presents results of the
estimation of a Conditional Logit Model. This model is similar to including target price revision
fixed effects. Only variables that vary within target price revision event are included in the model
as all other variation is subsumed by the structure of the Conditional Logit. Only observations
where there are multiple earnings forecasts revisions for the same target price revision and at
least one of those earnings forecast revisions agrees with the direction of the target price revision
and at least one disagrees can be included in the model. Definitions of all variables can be found
in the notes to Table 1. ***, **, and * represent statistical significance of the coefficient estimate
at the 1%, 5%, and 10% level, respectively, for two-tailed tests.

38
Table 4 – Investor Response to Earnings Information: Likelihood that 3-Day Earnings
Period Stock Return Directionally Differs from Earnings Surprise
Dependent Variable: SUE_Ret_Disagree is an indicator variable equal to 1 if the sign of the
earnings surprise is opposite of the sign of the 3-day cumulative abnormal return around the
earnings announcement date.
Inconsistent Analysts Measure
Top Quartile of
Inconsistent
Revision
% of Inconsistent
Revision
(1) (2)
Inconsistent Analysts 0.032 **
0.034
(0.016)
(0.033)
|Earnings Surprise| -10.282 ***
-10.271 ***
(0.817)
(0.817)
Negative Earnings
Surprise -0.341 ***
-0.340 ***
(0.015)
(0.015)
Log(Market Value) -0.011 **
-0.011 **
(0.005)
(0.005)
Earnings Volatility 2.482 ***
2.481 ***
(0.287)
(0.287)
Book-to-Market 0.076 ***
0.075 ***
(0.010)
(0.010)
Quarter Fixed Effects Yes Yes
Observations 96,102
96,102
Pseudo R-Square 0.010 0.010
Notes: This table presents the results of logistic regressions where the dependent variable is
SUE_Ret_Disagree. Both columns include quarter fixed effects. Column (1) presents results
using an indicator variable equal to 1 if the percentage of analyst revisions made for that firm
during the past year that are inconsistent is in the top quartile of all firms across the full sample
as the measure of Inconsistent Analysts. Column (2) presents results using the continuous
measure of the percentage of those forecast revisions that are inconsistent as the measure of
Inconsistent Analysts. |Earnings Surprise| is the absolute value of the difference between actual
earnings per share for the quarter and the median consensus analyst estimate of earnings per
share deflated by the stock price 2 days before the earnings announcement. Negative Earnings
Surprise is an indicator variable equal to 1 if the earnings surprise is negative and 0 otherwise.
Log(Market Value) is the log of the market value of equity measure two days before the earnings
announcement. Earnings Volatility is the standard deviation of the firm’s prior 12 quarters of
earnings deflated by average total assets. Book-to-market is the book value of assets divided by

39
the book value of assets minus the book value of equity plus the market value of equity. ***, **,
and * represent statistical significance of the coefficient estimate at the 1%, 5%, and 10% level,
respectively, for two-tailed tests.
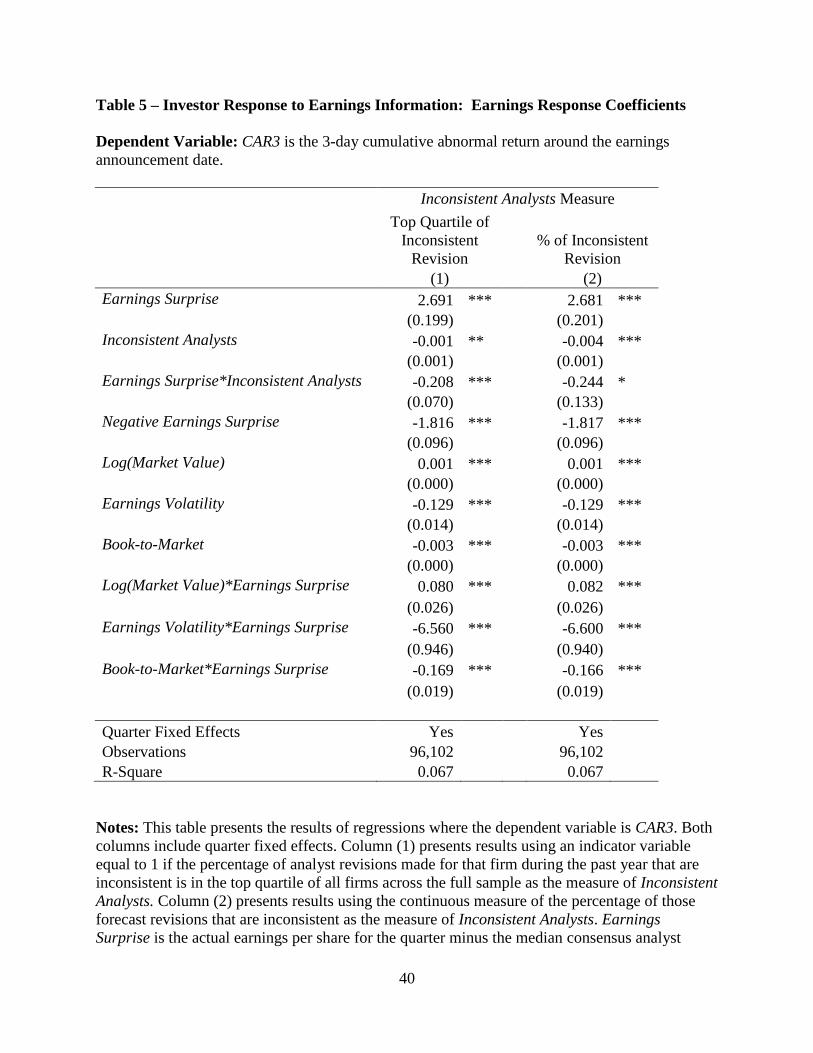
40
Table 5 – Investor Response to Earnings Information: Earnings Response Coefficients
Dependent Variable: CAR3 is the 3-day cumulative abnormal return around the earnings
announcement date.
Inconsistent Analysts Measure
Top Quartile of
Inconsistent
Revision
% of Inconsistent
Revision
(1) (2)
Earnings Surprise 2.691 ***
2.681 ***
(0.199)
(0.201)
Inconsistent Analysts -0.001 **
-0.004 ***
(0.001)
(0.001)
Earnings Surprise*Inconsistent Analysts -0.208 ***
-0.244 *
(0.070)
(0.133)
Negative Earnings Surprise -1.816 ***
-1.817 ***
(0.096)
(0.096)
Log(Market Value) 0.001 ***
0.001 ***
(0.000)
(0.000)
Earnings Volatility -0.129 ***
-0.129 ***
(0.014)
(0.014)
Book-to-Market -0.003 ***
-0.003 ***
(0.000)
(0.000)
Log(Market Value)*Earnings Surprise 0.080 ***
0.082 ***
(0.026)
(0.026)
Earnings Volatility*Earnings Surprise -6.560 ***
-6.600 ***
(0.946)
(0.940)
Book-to-Market*Earnings Surprise -0.169 ***
-0.166 ***
(0.019)
(0.019)
Quarter Fixed Effects Yes Yes
Observations 96,102
96,102
R-Square 0.067 0.067
Notes: This table presents the results of regressions where the dependent variable is CAR3. Both
columns include quarter fixed effects. Column (1) presents results using an indicator variable
equal to 1 if the percentage of analyst revisions made for that firm during the past year that are
inconsistent is in the top quartile of all firms across the full sample as the measure of Inconsistent
Analysts. Column (2) presents results using the continuous measure of the percentage of those
forecast revisions that are inconsistent as the measure of Inconsistent Analysts. Earnings
Surprise is the actual earnings per share for the quarter minus the median consensus analyst

41
estimate of earnings per share deflated by the stock price 2 days before the earnings
announcement. Negative Earnings Surprise is an indicator variable equal to 1 if the earnings
surprise is negative and 0 otherwise. Log(Market Value) is the log of the market value of equity
measure two days before the earnings announcement. Earnings Volatility is the standard
deviation of the firm’s prior 12 quarters of earnings deflated by average total assets. Book-to-
market is the book value of assets divided by the book value of assets minus the book value of
equity plus the market value of equity. ***, **, and * represent statistical significance of the
coefficient estimate at the 1%, 5%, and 10% level, respectively, for two-tailed tests.

42
Table 6 – Target Price Accuracy
Dependent Variables: |TP_Error| is the absolute difference between the revised target price and
the actual stock price 12 months after the release of the target price. TP_MetAny is an indicator
variable equal to 1 if the stock price met or exceeded the target price at any time during the 12
months after the release of the target price, and 0 otherwise.
|TP_Error| TP_MetAny |TP_Error| TP_MetAny
Independent Variable (1) (2) (3) (4)
Inconsistent -0.010*** 0.010
(0.003) (0.017)
%Inconsistent
-0.016*** 0.018
(0.004) (0.024)
Log(Market Value) -0.040* -0.028** -0.043* -0.036**
(0.021) (0.014) (0.022) (0.014)
Book-to-Market 0.049 0.010 0.057 -0.003
(0.033) (0.114) (0.033) (0.112)
ROA -0.055** 0.358*** -0.046* 0.338***
(0.024) (0.111) (0.024) (0.103)
Std. Dev(ROA) -0.056 -0.739*** -0.033 -0.819***
(0.079) (0.179) (0.082) (0.200)
Obs. Level Forecast Forecast TP TP
Firm FE Yes Yes Yes Yes
Industry FE No Yes No Yes
Year FE Yes No Yes No
Observations 1,695,717 1,774,736 355,394 372,627
R-squared/Psuedo R-squared 0.342 0.050 0.339 0.049
Notes: This table presents the results of regressions where the dependent variable is |TP_Error|
in Columns (1) and (3) and TP_MetAny in Columns (2) and (4). All columns include firm and
year fixed effects. Columns (1) and (2) present results with each individual earnings forecast
revision as a unique observation. Columns (3) and (4) present results with one observation for
each target price revision event. Inconsistent is an indicator variable equal to 1 for earnings
forecast revisions that move in the opposite direction from the target price revision and 0
otherwise. %Inconsistent is the percentage of earnings forecast revisions released concurrently
with the target price revision that are directionally inconsistent with the target price revision.
Log(Market Value) is the log of the market value of equity measure two days before the earnings
announcement. Book-to-market is the book value of assets divided by the book value of assets
minus the book value of equity plus the market value of equity. ROA is the return on assets. Std.
Dev(ROA) is the standard deviation of annual ROA over the previous 5 fiscal years. ***, **, and
* represent statistical significance of the coefficient estimate at the 1%, 5%, and 10% level,
respectively, for two-tailed tests.

43
Table 7 – Earnings Forecast Accuracy
Dependent Variables: |Forecast Error| is the absolute value of forecasted earnings per share
minus actual earnings per share times 100 divided by stock price 2 days before the forecast
revision date.
|Forecast Error|
Independent Variable (1) (2) (3)
Inconsistent -0.294*** -0.443*** -0.087**
(0.057) (0.055) (0.029)
Log(Horizon) 1.203***
1.386***
(0.092)
(0.112)
Log(Market Value) -0.444
(0.288)
Book-to-Market 2.237***
(0.352)
ROA -2.266***
(0.608)
Std. Dev(ROA) -1.473
(1.692)
Firm FE Yes No No
Year FE Yes No No
Target price revision FE No Yes Yes
Observations 1,697,455 1,667,022 1,665,879
R-squared 0.556 0.763 0.774
Notes: This table presents the results of regressions where the dependent variable is |Forecast
Error|. Column (1) presents results with firm and year fixed effects. Columns (2) and (3) present
results with target price revision event fixed effects. In these columns all variables that do not
vary within an individual target price revision event are subsumed by the fixed effect.
Inconsistent is an indicator variable equal to 1 for earnings forecast revisions that move in the
opposite direction from the target price revision and 0 otherwise. %Inconsistent is the percentage
of earnings forecast revisions released concurrently with the target price revision that are
directionally inconsistent with the target price revision. Log(Market Value) is the log of the
market value of equity measure two days before the earnings announcement. Book-to-market is
the book value of assets divided by the book value of assets minus the book value of equity plus
the market value of equity. ROA is the return on assets. Std. Dev(ROA) is the standard deviation
of annual ROA over the previous 5 fiscal years. ***, **, and * represent statistical significance
of the coefficient estimate at the 1%, 5%, and 10% level, respectively, for two-tailed tests.

44
Table 8 – Investor Response to Analyst Revisions
Dependent Variable: CAR3_Revise is the 3-day cumulative abnormal return around the analyst
forecast and target price revision date.
(1) (2) (3) (4) (5)
Full
Sample Inconsistent Consistent Inconsistent Consistent
Target Price Revision 0.025*** 0.020*** 0.029***
(0.002) (0.002) (0.003)
Earnings Estimate Revision 0.002*** 0.004*** -0.001 -0.008*** 0.017***
(0.001) (0.001) (0.001) (0.001) (0.001)
Firm FE Yes Yes Yes Yes Yes
Year FE Yes Yes Yes Yes Yes
Observations 1,801,862 403,895 1,397,611 403,895 1,397,611
R-squared 0.144 0.129 0.165 0.104 0.122
Notes: This table presents the results of regressions where the dependent variable is
CAR3_Revise. All columns include firm and year fixed effects. Target Price Revision is the
standardized value of the revised target price minus the initial target price scaled by the stock
price 2 days before the revision date. Earnings Estimate Revision is the standardized value of the
revised EPS forecast minus the initial EPS forecast scaled by the price 2 days before the revision
date. To standardize both variables we subtract the sample mean and divide by the sample
standard deviation for the full sample of observations. Column (1) presents results for the full
sample. Columns (2) and (4) present results for the sample of revisions that are inconsistent.
Columns (3) and (5) present results for the sample of revisions that are consistent. ***, **, and *
represent statistical significance of the coefficient estimate at the 1%, 5%, and 10% level,
respectively, for two-tailed tests.

45
Table 9 – Effect of the Number of Outputs Estimated by Analysts
Panel A: Determinants of Inconsistent Signals
Dependent Variable: Inconsistent Indicator variable equal to 1 if the earnings estimate revision
is directionally opposite concurrent target price revision.
All
Observations
Within 90
Days
Independent Variable (1) (2)
Log(Horizon) -0.122*** -0.116***
(0.005) (0.006)
R&D/Ads 0.490*** 0.583**
(0.178) (0.228)
Book-To-Market 0.020 0.082
(0.061) (0.054)
Intangibles 0.002 -0.072
(0.069) (0.078)
Std. Dev(ROA) -0.057 -0.011
(0.111) (0.104)
Annual Estimate -0.240*** -0.270***
(0.013) (0.015)
Loss 0.153*** 0.156***
(0.030) (0.037)
|Market Return| 2.144** 0.708
(0.853) (0.953)
ΔLTG Forecast 0.003 0.003
(0.002) (0.002)
Pre-Revision
Inconsistency 0.070*** 0.072***
(0.014) (0.015)
Debt Issue 0.106*** 0.117***
(0.018) (0.021)
Stock Issue 0.062*** 0.078***
(0.021) (0.019)
N_Analyst Outputs 0.011*** 0.013***
(0.002) (0.002)
Analyst Tenure -0.001 -0.002***
(0.001) (0.001)
Log(Analyst Coverage) 0.017 0.010
(0.014) (0.016)
Year fixed effects Yes Yes
Industry fixed effects Yes Yes
Observations 1,525,240 1,083,980

46
Psuedo R-squared 0.023 0.025
Panel B: Effect on Target Price and Earnings Forecast Accuracy
Dependent Variables: |TP_Error| is the absolute difference between the revised target price and
the actual stock price 12 months after the release of the target price. TP_MetAny is an indicator
variable equal to 1 if the stock price met or exceeded the target price at any time during the 12
months after the release of the target price, and 0 otherwise. |Forecast Error| is the absolute
value of forecasted earnings per share minus actual earnings per share times 100 divided by
stock price 2 days before the forecast revision date.
|TP_Error| TP_MetAny |TP_Error| TP_MetAny |Forecast_Error|
Independent Variable (1) (2) (3) (4) (5)
Inconsistent -0.009*** 0.008
-0.291***
(0.003) (0.017)
(0.057)
%Inconsistent
-0.016*** 0.016
(0.004) (0.024)
N_Analyst_Outputs -0.002*** 0.020*** -0.001*** 0.015*** -0.028**
(0.000) (0.003) (0.000) (0.002) (0.009)
Log(Market Value) -0.040* -0.029** -0.043* -0.036** -0.443
(0.021) (0.014) (0.022) (0.014) (0.288)
Book-to-Market 0.049 0.011 0.057 0.001 2.236***
(0.033) (0.115) (0.033) (0.113) (0.352)
ROA -0.055** 0.348*** -0.046* 0.330*** -2.265***
(0.024) (0.110) (0.024) (0.101) (0.607)
Std. Dev(ROA) -0.055 -0.731*** -0.033 -0.808*** -1.460
(0.079) (0.179) (0.082) (0.199) (1.692)
Log(Horizon)
1.207***
(0.093)
Obs. Level Forecast Forecast TP TP Forecast
Firm FE Yes Yes Yes Yes Yes
Industry FE No Yes No Yes No
Year FE Yes No Yes No Yes
Observations 1,695,677 1,774,696 355,374 372,607 1,665,421
R-squared/Psuedo R-squared 0.342 0.0511 0.339 0.0494 0.560
Notes: This table presents the results of regressions including N_Analyst_Outputs as an
independent variable. Panel A reproduces the determinants regressions found in Table 3 Panel A.
Panel B reproduces the target price accuracy regressions found in Table 7 and the earnings
forecast accuracy regressions found in Table 8. In both panels Inconsistent is an indicator
variable equal to 1 for earnings forecast revisions that move in the opposite direction from the
target price revision and 0 otherwise. %Inconsistent is the percentage of earnings forecast
revisions released concurrently with the target price revision that are directionally inconsistent
with the target price revision. See the notes to Tables 3, 7, and 8 for descriptions of the other

47
variables. ***, **, and * represent statistical significance of the coefficient estimate at the 1%,
5%, and 10% level, respectively, for two-tailed tests.


![[Smith, Kohn, 2000] Nonparametric Seemingly Unrelated Regression](https://img.pdfslide.net/doc/110x75/577cd1081a28ab9e7893727a/smith-kohn-2000-nonparametric-seemingly-unrelated-regression.jpg)