Embed Size (px)
DESCRIPTION
Segregation and Stratification. A Biosocial Approach. Segregation and Stratification: A Biosocial Approach Douglas S. Massey Princeton University. - PowerPoint PPT Presentation
Citation preview
Segregation and Stratification
A Biosocial Approach

Figure 1. Level of segregation experienced by African Americans in 2000.Source: Iceland et al. 2002
41.1
18.4
40.5
Hypersegregated
Highly Segregated
Low-Moderately Segregated
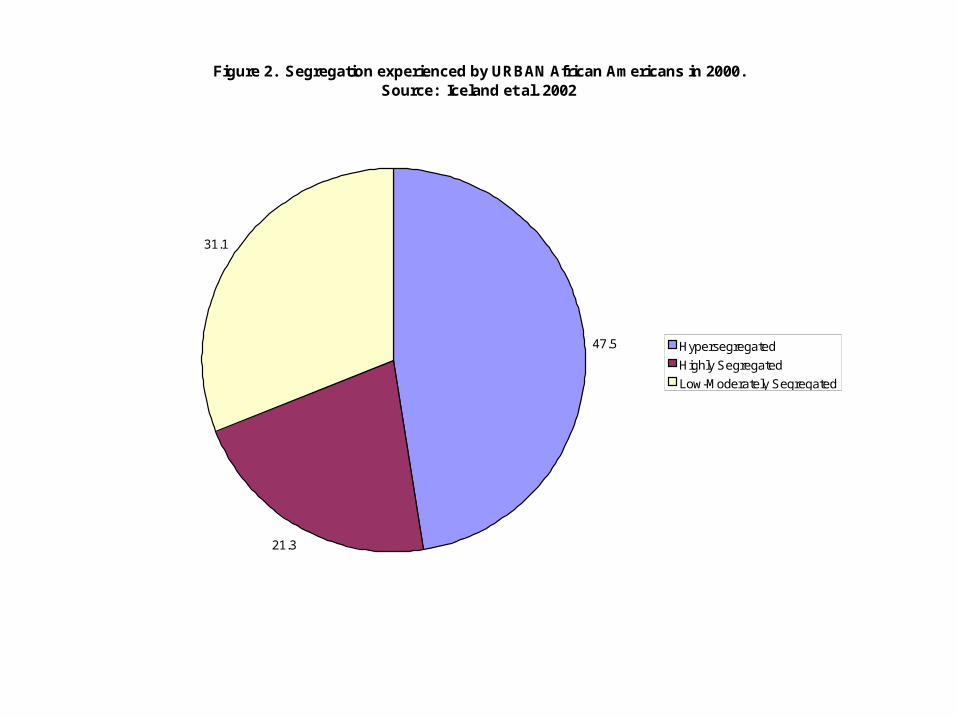
Figure 2. Segregation experienced by URBAN African Americans in 2000.Source: Iceland et al. 2002
47.5
21.3
31.1
Hypersegregated
Highly Segregated
Low-Moderately Segregated
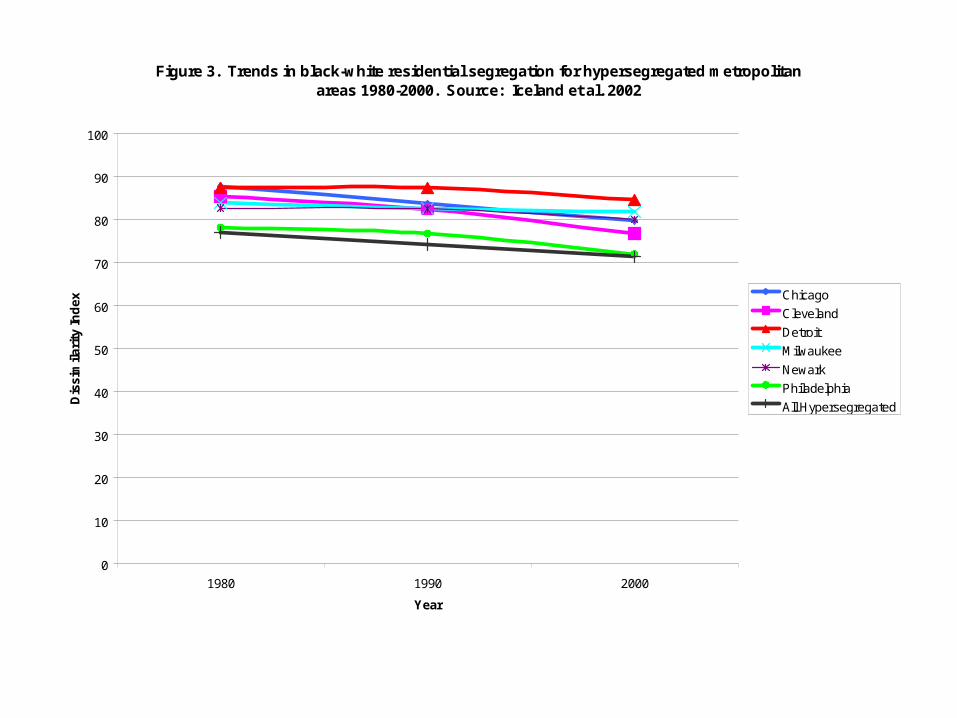
Figure 3. Trends in black-white residential segregation for hypersegregated metropolitan areas 1980-2000. Source: Iceland et al. 2002
0
10
20
30
40
50
60
70
80
90
100
1980 1990 2000
Year
Dis
sim
ilari
ty In
dex
Chicago
Cleveland
Detroit
Milwaukee
Newark
Philadelphia
All Hypersegregated

Figure 4. Degree of Black-White segregation in hypersegregated metro areas of the U.S. compared with Metro Areas in South Africa Under Apartheid.
Sources: Christopher 1993; Iceland 2003
0
10
20
30
40
50
60
70
80
90
100
South
Afri
can
Met
ro A
reas
Detro
it
Milw
auke
e
Chicag
o
Newar
k
Clevela
nd
Philad
elphia
US Hyp
erse
greg
ated
Met
ro A
reas
Metropolitan Area
Se
gre
ga
tio
n I
nd
ex

Figure 5. Segregegation of Blacks, Latinos, and Asians from Whites by income in 1990. Source: Massey and Fischer 1999
0
10
20
30
40
50
60
70
80
<$15,000 $15,000-$34,999 $35,000-$49,999 $50,000+
Income Category
Se
gre
ga
tio
n I
nd
ex
Black
Latino
Asian
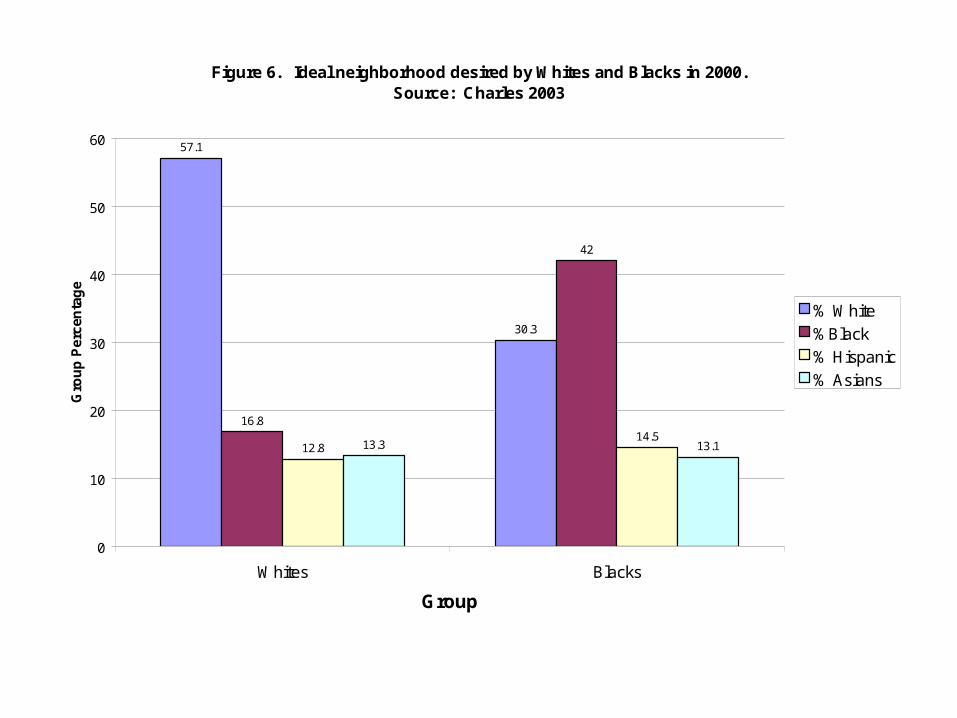
Figure 6. Ideal neighborhood desired by Whites and Blacks in 2000.Source: Charles 2003
57.1
30.3
16.8
42
12.814.5
13.3 13.1
0
10
20
30
40
50
60
Whites Blacks
Group
Gro
up
Per
cen
tag
e
% White
%Black
% Hispanic
% Asians

Figure 7. Preference for all in-group and no-outgroup neighborhoods in 2000.Source: Charles 2003
20.3
6.5
24.7
9.2
0
5
10
15
20
25
30
Whites Blacks
Group
Per
cen
tag
e F
avo
rin
g A
ll I
ng
rou
p o
r N
o O
utg
rou
p
All Ingroup
No Outgroup

Figure 8. Explaining White Preferences for White Neighbors.Source: Charles 2003
0.041
0.429
0.142
0
0.05
0.1
0.15
0.2
0.25
0.3
0.35
0.4
0.45
0.5
Perceived Class Differences Racial Stereotyping Ingroup Attachment
White Perceptions
Siz
e o
f E
ffec
t
Stereotyping of Blacks: Intelligence Laziness Violence Family Fairness

Figure 9. Explaining White Avoidance of Black NeighborsSource: Charles 2003
0.056
0.39
0.091
0
0.05
0.1
0.15
0.2
0.25
0.3
0.35
0.4
0.45
Perceived Class Differences Racial Stereotyping Ingroup Attachment
White Perceptions
Siz
e o
f E
ffe
ct
Stereotyping of Blacks: Intelligence Laziness Violence Family Fairness

Figure 10. Percentage Gaining Access to Rental Units and Percentage Having Credit Raised as an Issue, Philadelphia 2000.
Source: Massey and Lundy 2001.
0
10
20
30
40
50
60
70
80
White Middle Class English Black Accented English Black English Vernacular
Linguistic Style
Pe
rce
nta
ge
Achieved Access
Credit Problems Raised
Male
Female
Female
Male
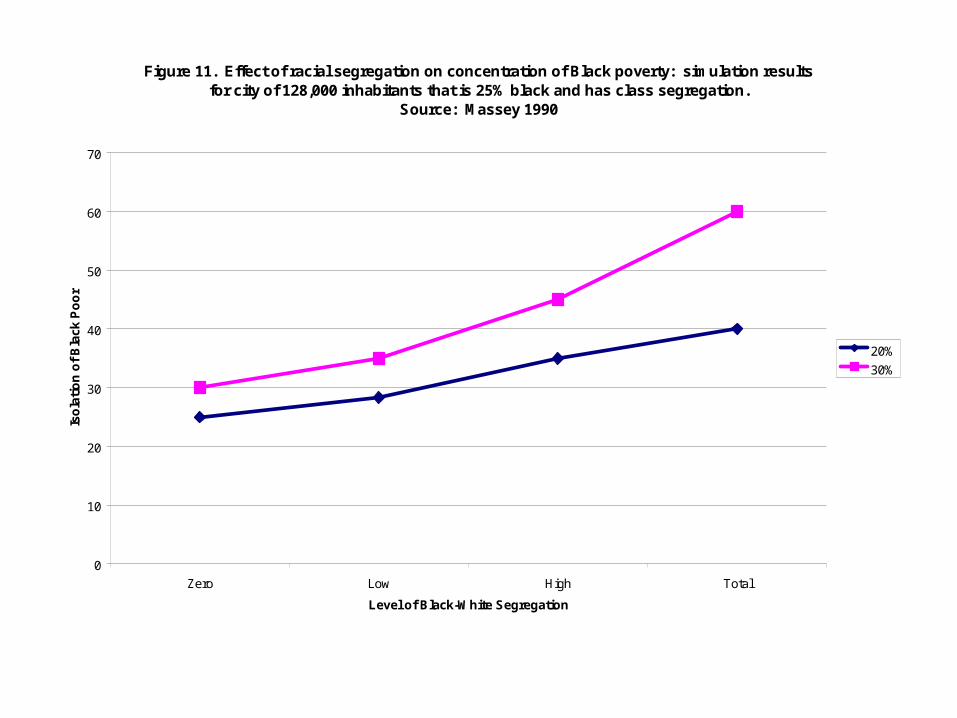
Figure 11. Effect of racial segregation on concentration of Black poverty: simulation results for city of 128,000 inhabitants that is 25% black and has class segregation.
Source: Massey 1990
0
10
20
30
40
50
60
70
Zero Low High Total
Level of Black-White Segregation
Iso
lati
on
of
Bla
ck P
oo
r
20%
30%

Figure 12. How segregation increases exposure to major crimes (murder, rape, assault, robbery, burglary, larceny, autho theft).
Source: Massey 2001.
50
55
60
65
70
75
80
85
90
Zero Low High Total
Level of segregation
Pre
dic
ted
Rat
e p
er 1
000
20%
30%

Figure 13. Percentage of freshmen at selective schools growing up in segregated schools and neighborhoods. Source: Massey et al. 2003
0.7 0.6
23.6
37.1
0.4 0.6
20
22.2
0
5
10
15
20
25
30
35
40
Whites Asians Latinos Blacks
Group
Per
cen
tag
e
Neighborhoods Schools

Figure 14. Exposure of freshmen at selctive schools to school and neighborhood disorder while growing up. Source: Massey et al. 2003
18.48 18.2619.53
25.38
31.65
0
5
10
15
20
25
30
35
Whites Asians Integrated Mixed Segregated
Group and Segregation Level Experienced by Blacks and Latinos
Ind
ex V
alu
e

Figure 15. Exposure of freshmen at selctive schools to school and neighborhood iolence while growing up. Source: Massey et al. 2003
10.3710.9
11.77
18.07
25.97
0
5
10
15
20
25
30
Whites Asians Integrated Mixed Segregated
Group and Segregation Level Experienced by Blacks and Latinos
Ind
ex V
alu
e

Figure 16. Effect of segregation on grade point earned by African Americans during first three terms of freshman year. Source: Massey and Fischer 2003.
2.9
2.95
3
3.05
3.1
0 0.1 0.2 0.3 0.4 0.5 0.6 0.7 0.8 0.9 1
Average Minority Proportion in Schools and Neighborhoods
GP
A
ß = -.171

Table 1. Reduced-form model estimating effect of social and economic background ongrade point earned during first three terms of college or university.Source: Massey and Fischer 2003
Independent Variables B SE Race/Ethnicity White (reference) ---- ---- Asian -0.011 0.023 Latino -0.145*** 0.030 Black -0.262*** 0.027Segregation Average While Growing Up -0.028 0.035Demographic Background Foreign Born Parent 0.016 0.016 Two Parent Family 0.021 0.019 Siblings under 18 0.002 0.009Socioeconomic StatusEducation of Parents No College Degrees (reference) ---- ---- One College Degree 0.002 0.019 Two College Degrees 0.071** 0.024 One Advanced Degree 0.086*** 0.020 Two Advanced Degrees 0.153*** 0.023Economic Status Home Value (000) -0.017 0.035 Ever on Welfare -0.010 0.023 Income>$75,000 0.018 0.024Correlates of Segregation School Quality 0.074*** 0.046 Academic Preparation 0.003*** 0.001 Social Preparation -0.395*** 0.065 Psychological Preparation 0.256*** 0.062 Exposure to Disorder 0.167 0.110 Exposure to Violence -0.527*** 0.126
Intercept 3.183***R2 0.287
Number of Cases 3,920

Allostasis:
*The tendency for organisms to maintain stability through change
*Occurs through a delicate interaction between the brain, the endocrine system, and the immune system
*when a person perceives an external threat, a brain organ known as the hypothalamus triggers an allostatic response.
-hypothalamus signals adrenal glands to release adrenaline-accelerates heartbeat-constricts blood vessels to skin-expands flow of blood to internal organs-dilates bronchial tubes-triggers release of fibrogen into blood (clotting)-releases glucose and fatty acids from stored fats (glycogen)-signals brain to produce endorphins
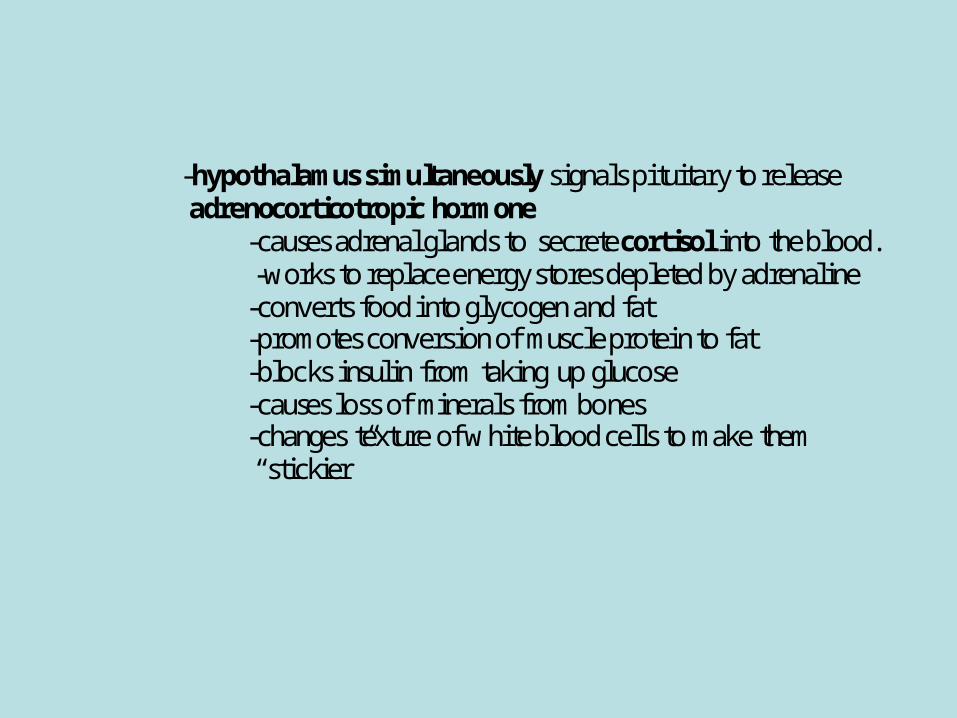
-hypothalamus simultaneously signals pituitary to release adrenocorticotropic hormone
-causes adrenal glands to secrete cortisol into the blood. -works to replace energy stores depleted by adrenaline-converts food into glycogen and fat-promotes conversion of muscle protein to fat-blocks insulin from taking up glucose-causes loss of minerals from bones-changes texture of white blood cells to make them “stickier”
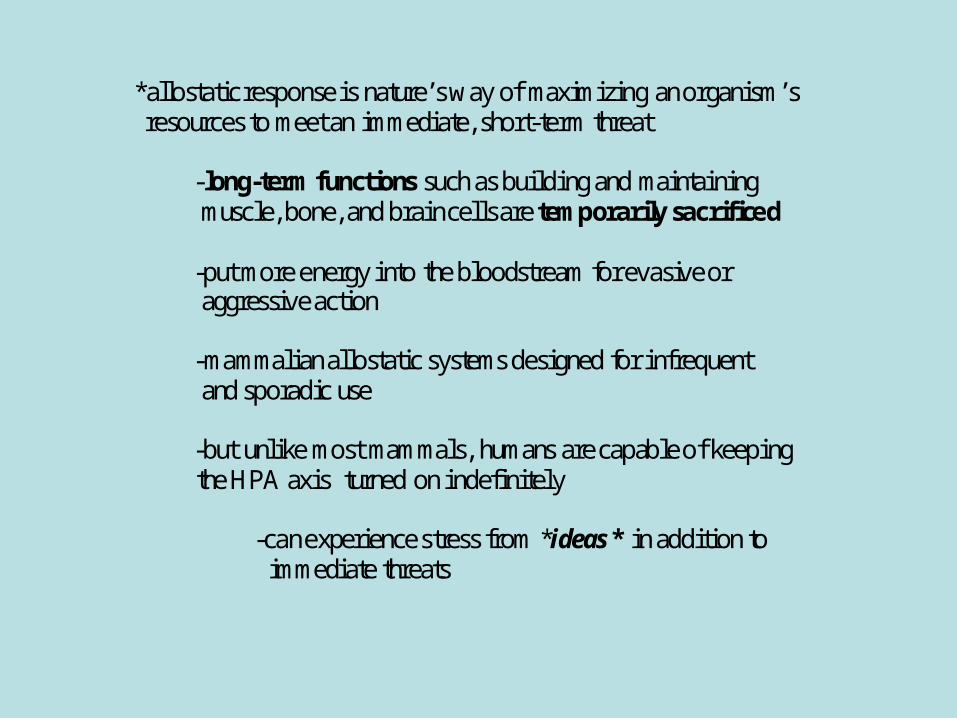
*allostatic response is nature’s way of maximizing an organism’s resources to meet an immediate, short-term threat
-long-term functions such as building and maintaining muscle, bone, and brain cells are temporarily sacrificed
-put more energy into the bloodstream for evasive or aggressive action
-mammalian allostatic systems designed for infrequent and sporadic use
-but unlike most mammals, humans are capable of keeping the HPA axis turned on indefinitely
-can experience stress from *ideas * in addition to immediate threats

Allostatic Load
*Results whenever stress response is triggered repeatedly or chronically
*As when someone is compelled by socioeconomic circumstances or racial discrimination to live in a dangerous environment
*inhabitants of such settings not only experience an allostatic response when they perceive dangers directly,
*also when they anticipate them mentally—when they imagine threatening events that might occur or when they recall past traumas

Consequences of Allostatic Load for Bodily Systems
*cardiovascular system:-elevated adrenaline levels increase blood pressure to raise the risk of hypertension
-elevated fibrogen levels increase the propensity for blood to clot and raise the risk of thrombosis
-the build-up of “sticky” white blood cells causes the formation of arterial plaques that contribute to atherosclerosis
-elevated cortisol levels cause the production of excess glycogen and fat, to raise the risk of obesity
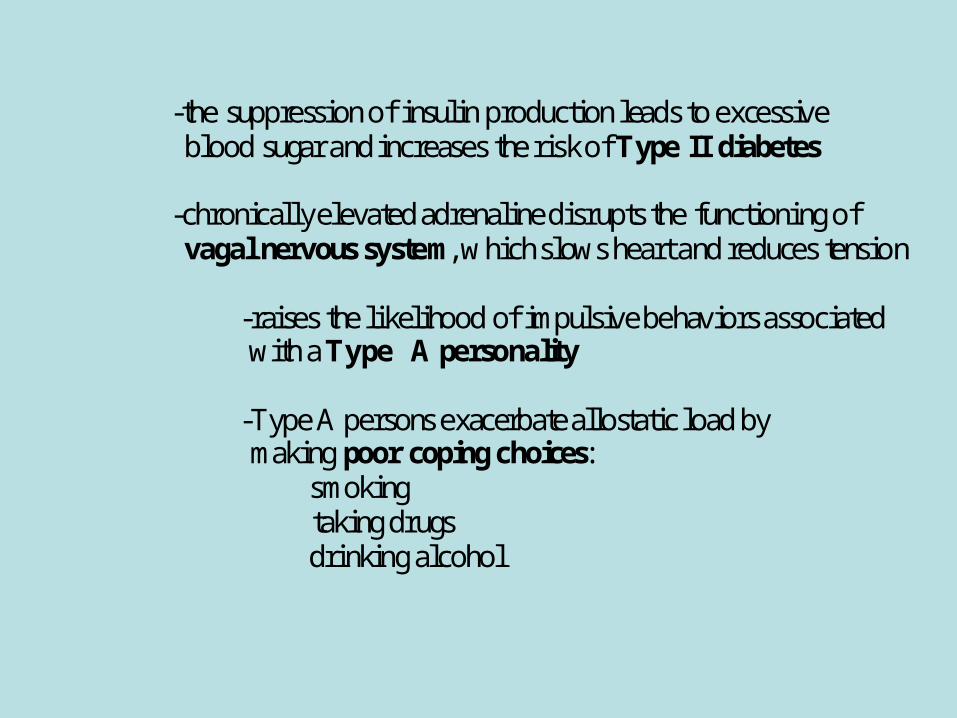
-the suppression of insulin production leads to excessive blood sugar and increases the risk of Type II diabetes
-chronically elevated adrenaline disrupts the functioning of vagal nervous system, which slows heart and reduces tension
-raises the likelihood of impulsive behaviors associated with a Type A personality
-Type A persons exacerbate allostatic load by making poor coping choices:
smokingtaking drugsdrinking alcohol

*immune system:
-elevated cortisol lowers immune response to increase risk of illness and infection
-elevated cortisol overstimulates the immune system and goads it into attacking targets that normally don’t pose \ a threat
-leads to the expression of inflammatory disorders -asthma-autoimmune diseases
-multiple sclerosis-arthritis-Type I diabetes
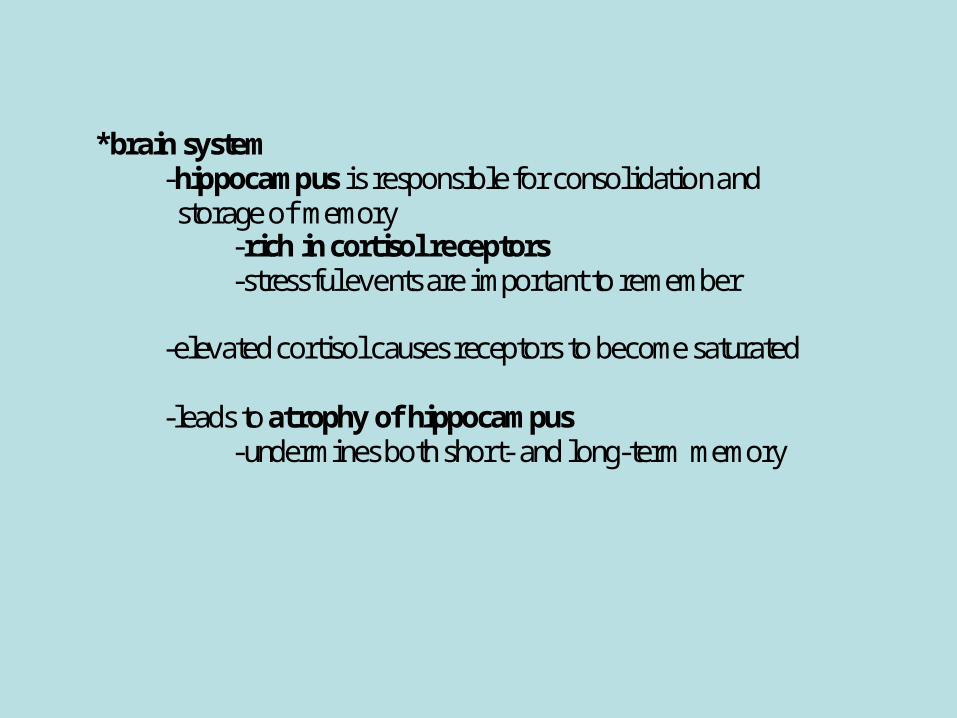
*brain system-hippocampus is responsible for consolidation and storage of memory -rich in cortisol receptors
-stressful events are important to remember
-elevated cortisol causes receptors to become saturated
-leads to atrophy of hippocampus-undermines both short- and long-term memory

-excessive cortisol also interferes with the operation of excitatory neurotransmitters
-such as glutamate -inhibits long-term potentiation of neural synapses-fundamental neurological event of learning

-hippocampus also plays an essential in shutting off the HPA axis, so that damage to it creates a vicious cycle:
-excessive cortisol causes shrinkage of hippocampus-causes less inhibition of cortisol production-causes more shrinkage-leads to dendritic remodeling -neurons become shorter and sprout fewer
branches-suppresses neurogenesis,
-creation of new neurons

Leads to Biosocial Model of Health and Cognition:
*There is a causal path between segregation, stressful neighborhoods, allostatic load, and compromised health and cognitive outcomes
Segregation-->Stressful Neighborhoods-->Allostatic Load-->Outcomes
*what is needed to confirm the links in this chain of events is a dataset that connects individuals and their characteristics to measuresof allostatic load and to neighborhood stress
*Adolescent Health Survey

Neighborhood Conditions at Waves I, II, and III
School Conditions at Wave I and II
Total Cortisol at Wave III
Health Outcomes at Wave III
Cognitive Outcomes at Wave III
Health Statuson Waves I and II
Cognitive Status on Wave I
Prejudice Against Biosocial Theories in Social Science
Letter from Editor of Social Science Journal with Instructions for Review:
“Downplay the speculative biosocial explanation of the findings. This is a ‘red flag’ to reviewers...”
Emphasis in original.
Segregation and Stratification:
A Biosocial Approach
Douglas S. Massey
Princeton University