Embed Size (px)
Citation preview
Segregation change: Longitudinal evidence from the NCDS and the ONS Longitudinal Study
Dr Daniel Guinea-MartinLongitudinal Development TeamOffice for National Statistics
Introduction
• Aims• Definitions • Structural changes/changes in occupational
classification• Data
– Comparing LS & NCDS cohorts
• Occupational segregation by sex in the 1990s – At the aggregated level – At the individual level
• The importance of data comparison• Next steps
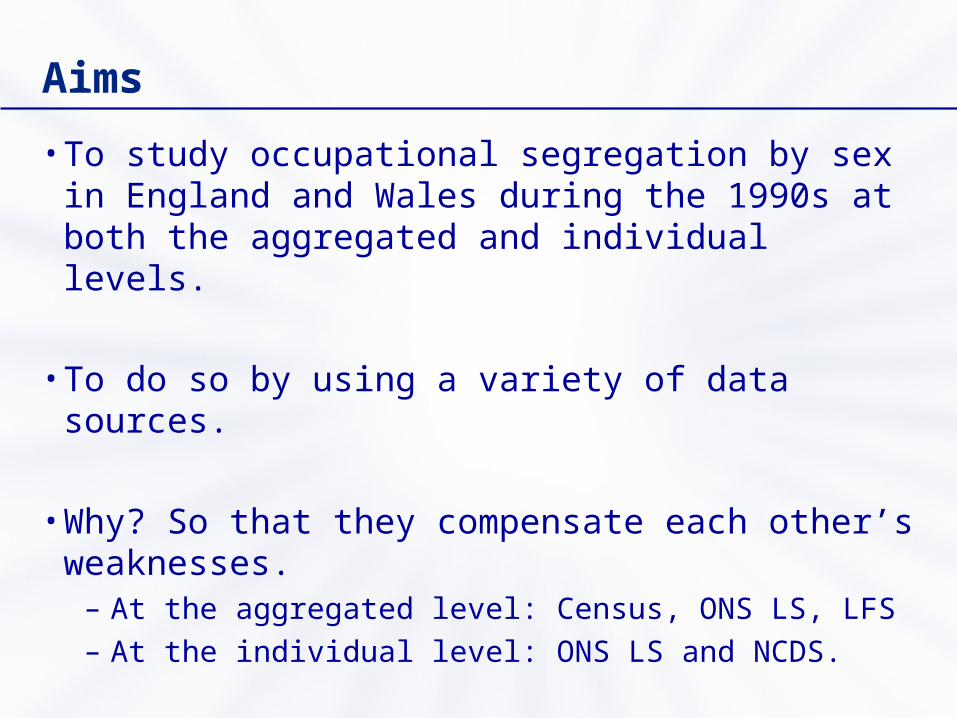
Aims
• To study occupational segregation by sex in England and Wales during the 1990s at both the aggregated and individual levels.
• To do so by using a variety of data sources.
• Why? So that they compensate each other’s weaknesses.
– At the aggregated level: Census, ONS LS, LFS– At the individual level: ONS LS and NCDS.
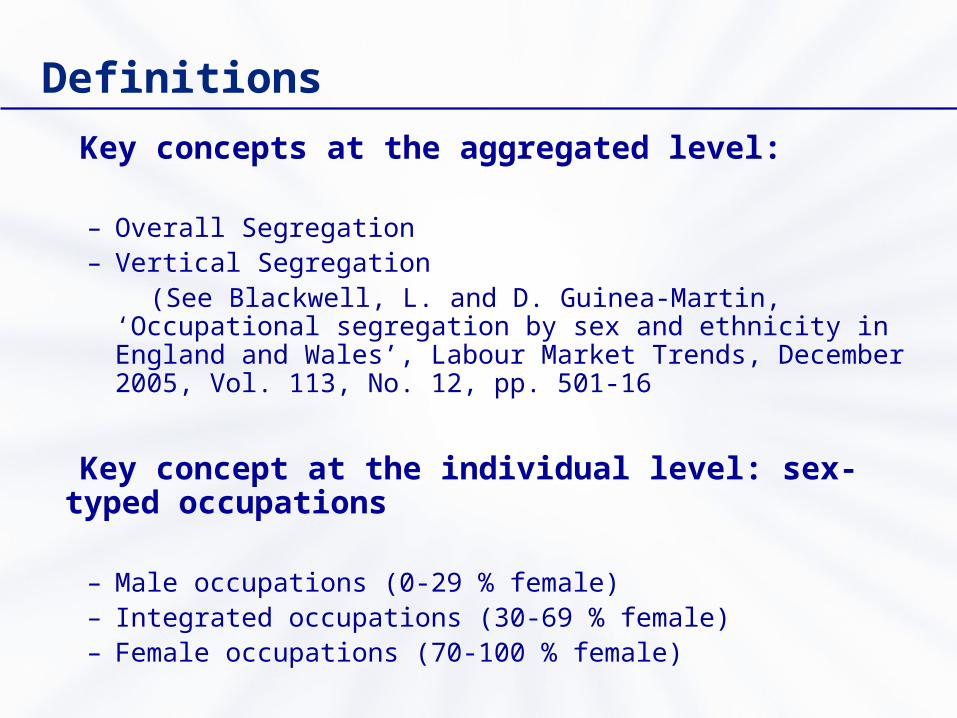
Definitions
Key concepts at the aggregated level:
– Overall Segregation– Vertical Segregation (See Blackwell, L. and D. Guinea-Martin, ‘Occupational segregation
by sex and ethnicity in England and Wales’, Labour Market Trends, December 2005, Vol. 113, No. 12, pp. 501-16
Key concept at the individual level: sex-typed occupations
– Male occupations (0-29 % female)– Integrated occupations (30-69 % female)– Female occupations (70-100 % female)
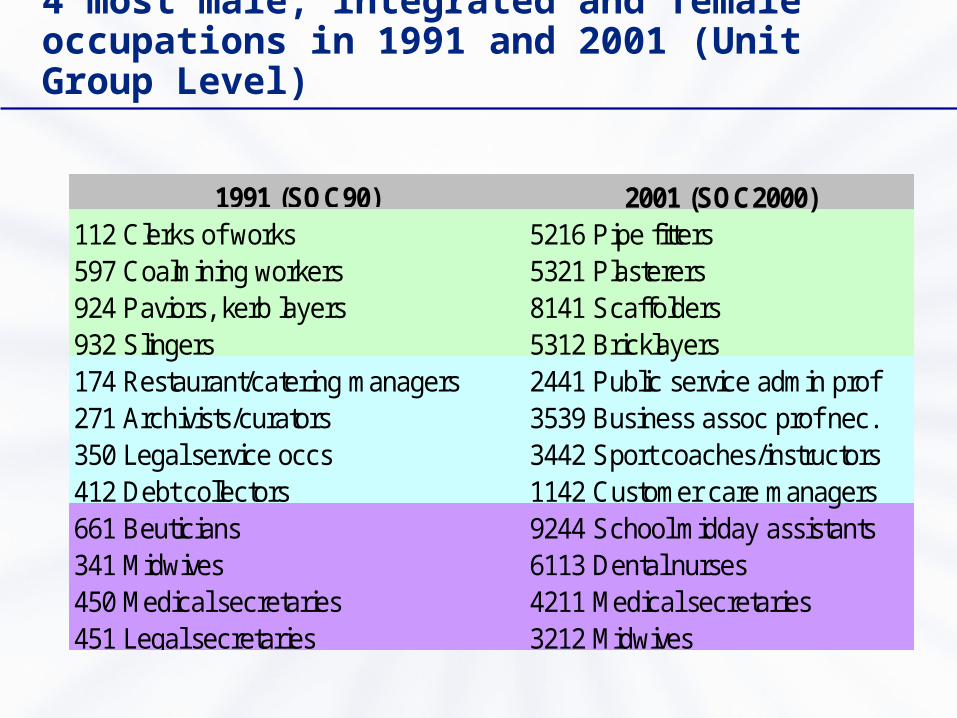
4 most male, integrated and female occupations in 1991 and 2001 (Unit Group Level)
2001 (SOC2000)112 Clerks of works 5216 Pipe fitters597 Coalmining workers 5321 Plasterers924 Paviors, kerb layers 8141 Scaffolders932 Slingers 5312 Bricklayers174 Restaurant/catering managers 2441 Public service admin prof271 Archivists/curators 3539 Business assoc prof nec. 350 Legal service occs 3442 Sport coaches/instructors412 Debt collectors 1142 Customer care managers661 Beuticians 9244 School midday assistants341 Midwives 6113 Dental nurses450 Medical secretaries 4211 Medical secretaries451 Legal secretaries 3212 Midwives
1991 (SOC90)
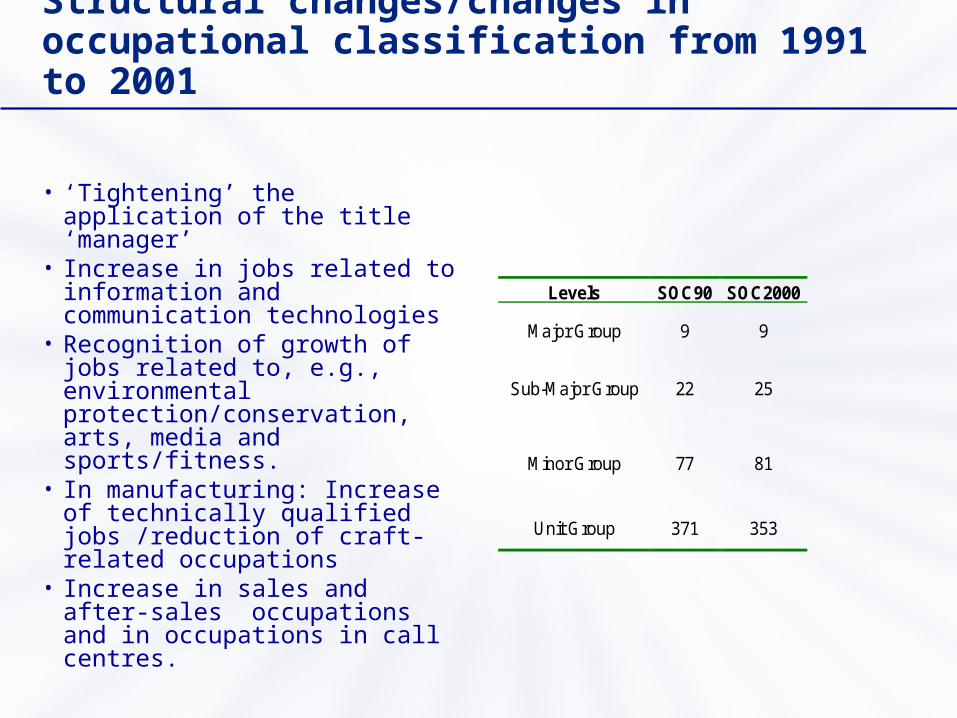
Structural changes/changes in occupational classification from 1991 to 2001
• ‘Tightening’ the application of the title ‘manager’
• Increase in jobs related to information and communication technologies
• Recognition of growth of jobs related to, e.g., environmental protection/conservation, arts, media and sports/fitness.
• In manufacturing: Increase of technically qualified jobs /reduction of craft-related occupations
• Increase in sales and after-sales occupations and in occupations in call centres.
Levels SOC90 SOC2000
Major Group 9 9
Sub-Major Group 22 25
Minor Group 77 81
Unit Group 371 353
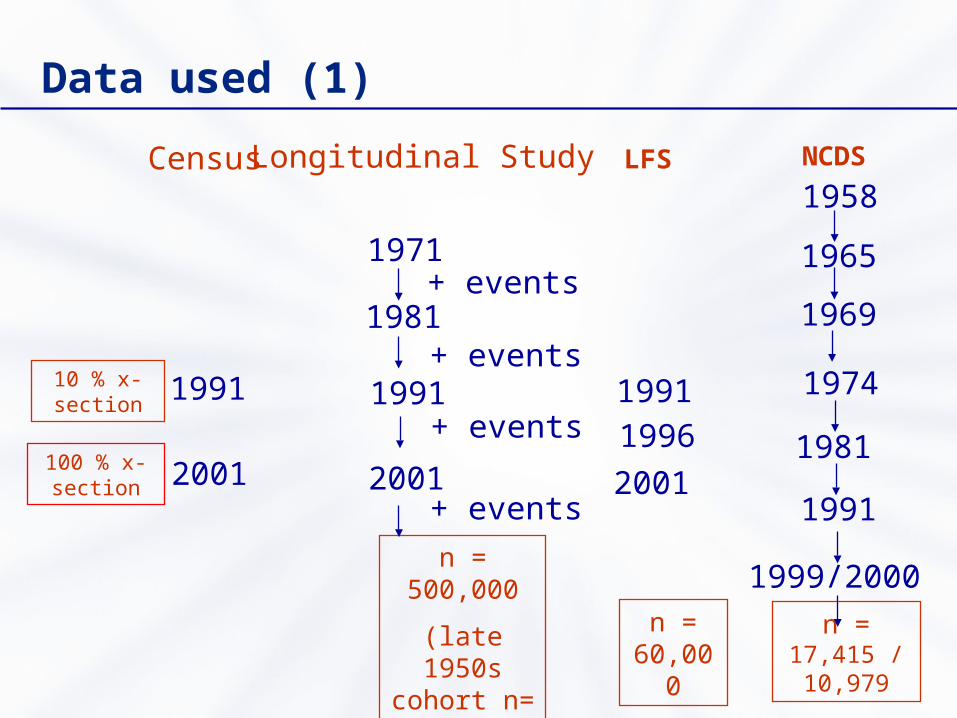
Data used (1)
Census Longitudinal Study
1971
1981
1991
2001
+ events
+ events
+ events
+ events
1991
2001
10 % x-section
100 % x-section
n = 500,000
(late 1950s cohort n= 19,152)
1991
2001
n = 60,000
1996
LFS
1991
1999/2000
n = 17,415 /10,979
NCDS
1974
1981
1969
1965
1958
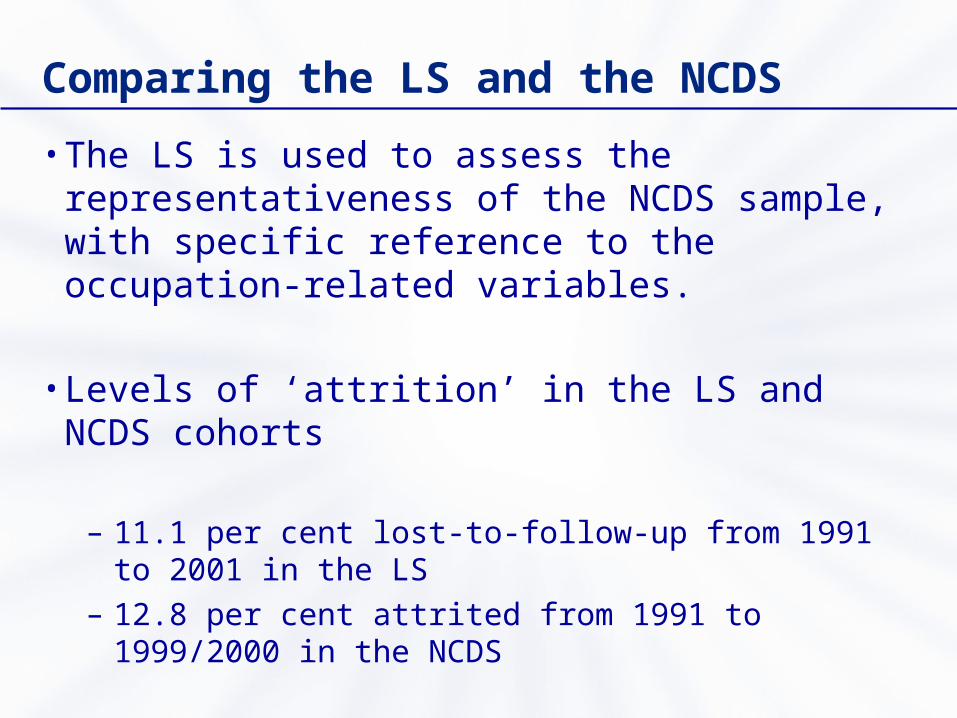
Comparing the LS and the NCDS
• The LS is used to assess the representativeness of the NCDS sample, with specific reference to the occupation-related variables.
• Levels of ‘attrition’ in the LS and NCDS cohorts
– 11.1 per cent lost-to-follow-up from 1991 to 2001 in the LS
– 12.8 per cent attrited from 1991 to 1999/2000 in the NCDS
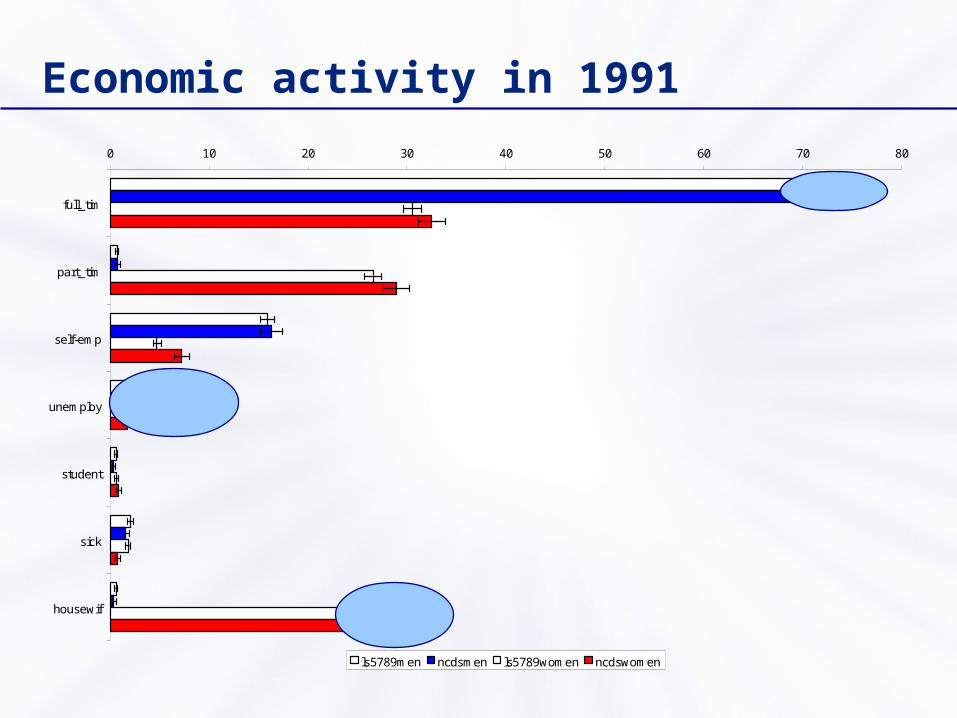
Economic activity in 1991
0 10 20 30 40 50 60 70 80
full_tim
part_tim
self-emp
unemploy
student
sick
housewif
ls5789men ncdsmen ls5789women ncdswomen
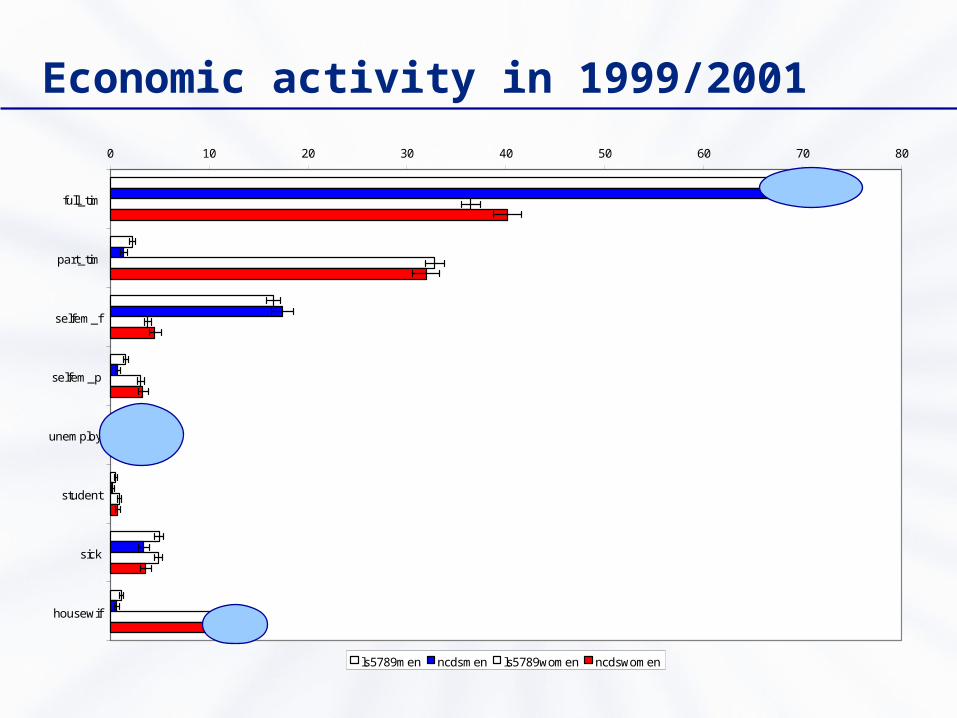
Economic activity in 1999/2001
0 10 20 30 40 50 60 70 80
full_tim
part_tim
selfem_f
selfem_p
unemploy
student
sick
housewif
ls5789men ncdsmen ls5789women ncdswomen
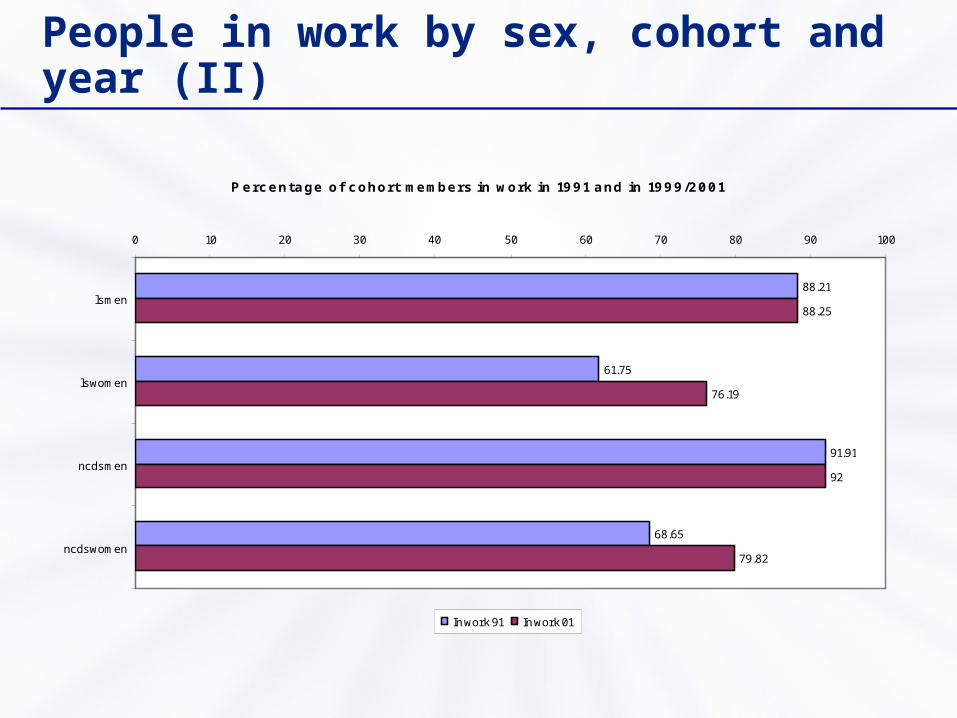
People in work by sex, cohort and year (II)
Percentage of cohort members in work in 1991 and in 1999/2001
88.21
61.75
91.91
68.65
88.25
76.19
92
79.82
0 10 20 30 40 50 60 70 80 90 100
ls men
ls women
ncds men
ncds women
In work 91 In work 01
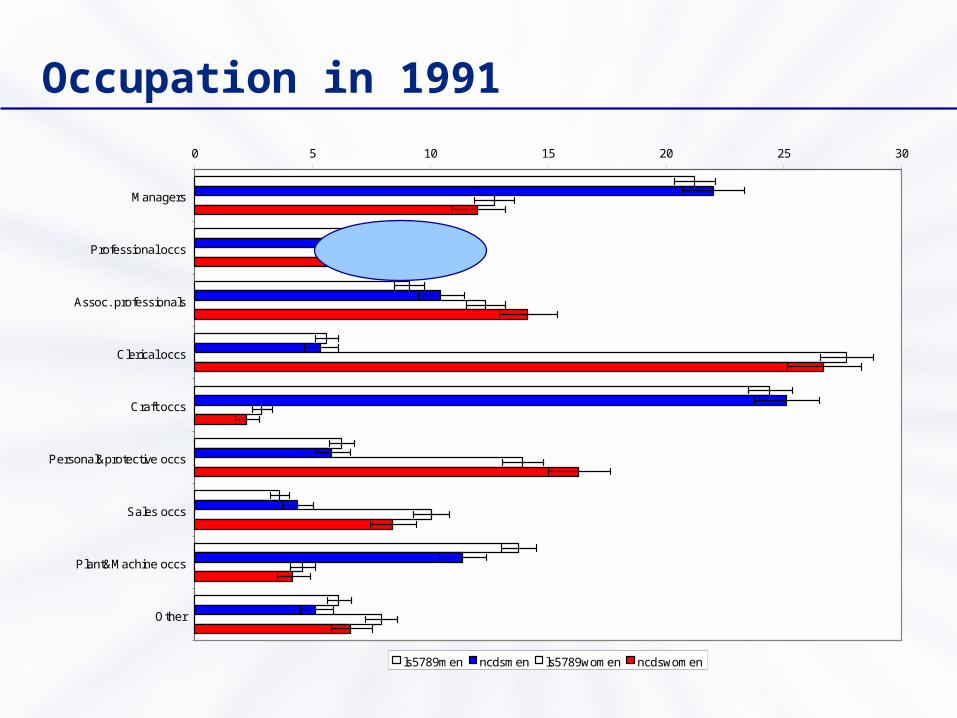
Occupation in 1991
0 5 10 15 20 25 30
Managers
Professional occs
Assoc. professionals
Clerical occs
Craft occs
Personal&protective occs
Sales occs
Plant&Machine occs
Other
ls5789men ncdsmen ls5789women ncdswomen
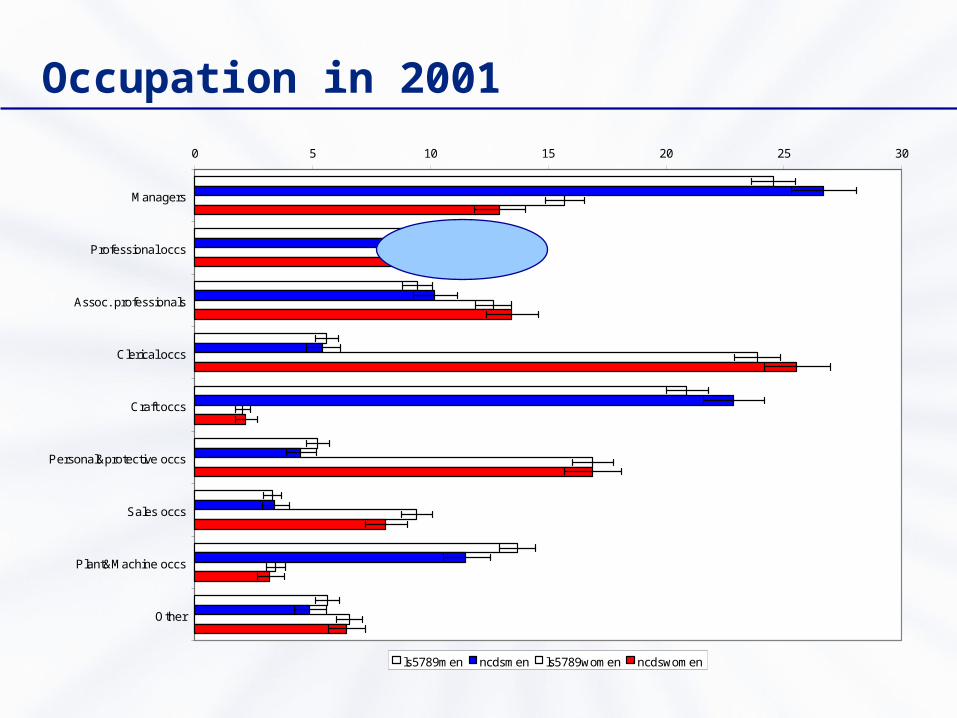
Occupation in 2001
0 5 10 15 20 25 30
Managers
Professional occs
Assoc. professionals
Clerical occs
Craft occs
Personal&protective occs
Sales occs
Plant&Machine occs
Other
ls5789men ncdsmen ls5789women ncdswomen
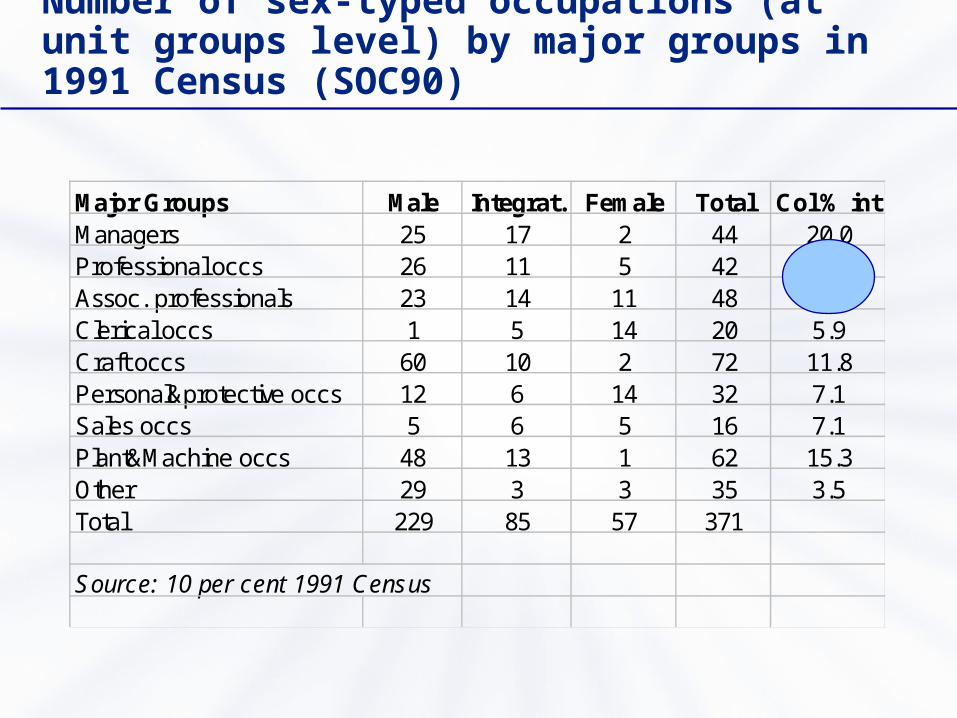
Number of sex-typed occupations (at unit groups level) by major groups in 1991 Census (SOC90)
Major Groups Male Integrat. Female Total Col % intManagers 25 17 2 44 20.0Professional occs 26 11 5 42 12.9Assoc. professionals 23 14 11 48 16.5Clerical occs 1 5 14 20 5.9Craft occs 60 10 2 72 11.8Personal&protective occs 12 6 14 32 7.1Sales occs 5 6 5 16 7.1Plant&Machine occs 48 13 1 62 15.3Other 29 3 3 35 3.5Total 229 85 57 371
Source: 10 per cent 1991 Census
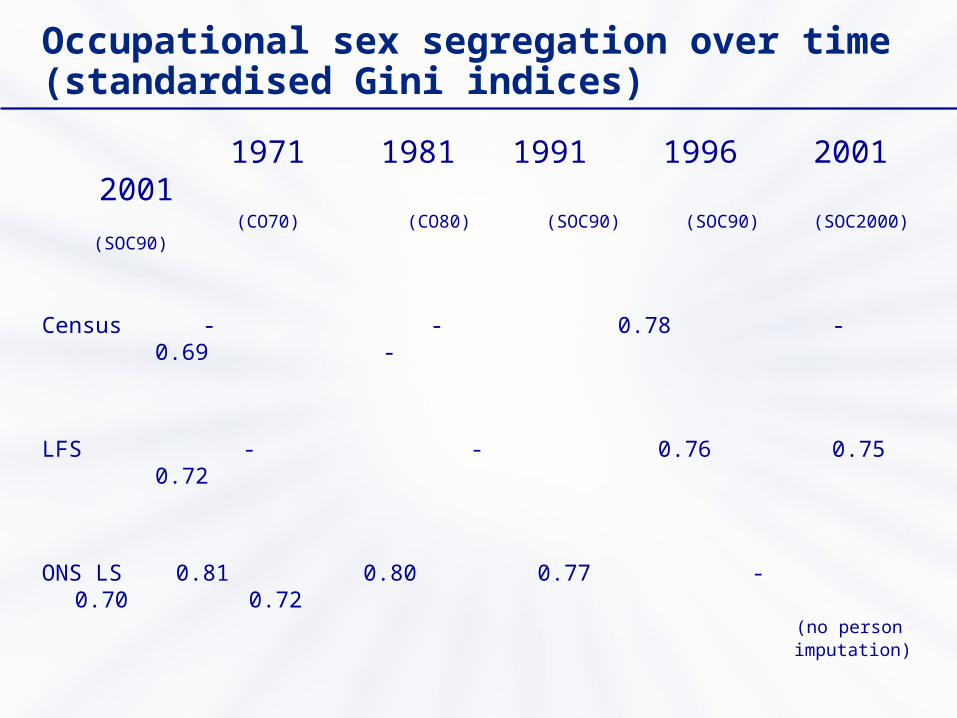
Occupational sex segregation over time (standardised Gini indices)
1971 1981 1991 1996 2001 2001 (CO70) (CO80) (SOC90) (SOC90) (SOC2000) (SOC90)
Census - - 0.78 - 0.69 -
LFS - - 0.76 0.75 0.72
ONS LS 0.81 0.80 0.77 - 0.70 0.72 (no person imputation)
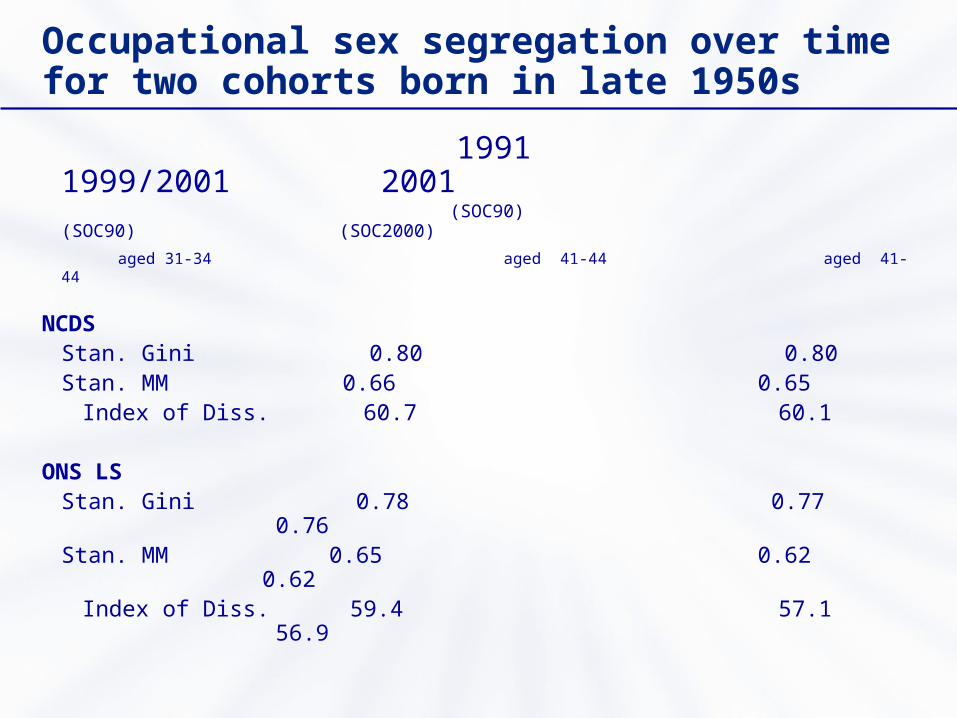
Occupational sex segregation over time for two cohorts born in late 1950s
1991 1999/2001 2001 (SOC90) (SOC90) (SOC2000)
aged 31-34 aged 41-44 aged 41-44
NCDS Stan. Gini 0.80 0.80Stan. MM 0.66 0.65
Index of Diss. 60.7 60.1
ONS LS Stan. Gini 0.78 0.77 0.76Stan. MM 0.65 0.62 0.62
Index of Diss. 59.4 57.1 56.9
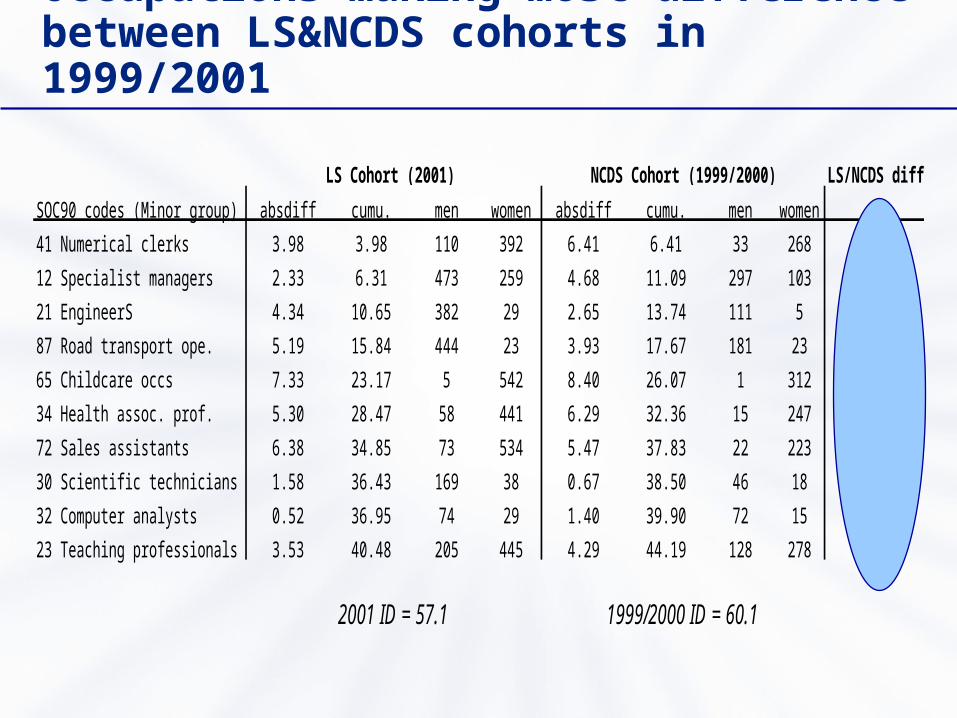
Occupations making most difference between LS&NCDS cohorts in 1999/2001
LS/NCDS diff
SOC90 codes (Minor group) absdiff cumu. men women absdiff cumu. men women
41 Numerical clerks 3.98 3.98 110 392 6.41 6.41 33 268 2.42
12 Specialist managers 2.33 6.31 473 259 4.68 11.09 297 103 2.35
21 EngineerS 4.34 10.65 382 29 2.65 13.74 111 5 1.69
87 Road transport ope. 5.19 15.84 444 23 3.93 17.67 181 23 1.26
65 Childcare occs 7.33 23.17 5 542 8.40 26.07 1 312 1.07
34 Health assoc. prof. 5.30 28.47 58 441 6.29 32.36 15 247 0.99
72 Sales assistants 6.38 34.85 73 534 5.47 37.83 22 223 0.91
30 Scientific technicians 1.58 36.43 169 38 0.67 38.50 46 18 0.91
32 Computer analysts 0.52 36.95 74 29 1.40 39.90 72 15 0.88
23 Teaching professionals 3.53 40.48 205 445 4.29 44.19 128 278 0.76
LS Cohort (2001) NCDS Cohort (1999/2000)
2001 ID = 57.1 1999/2000 ID = 60.1
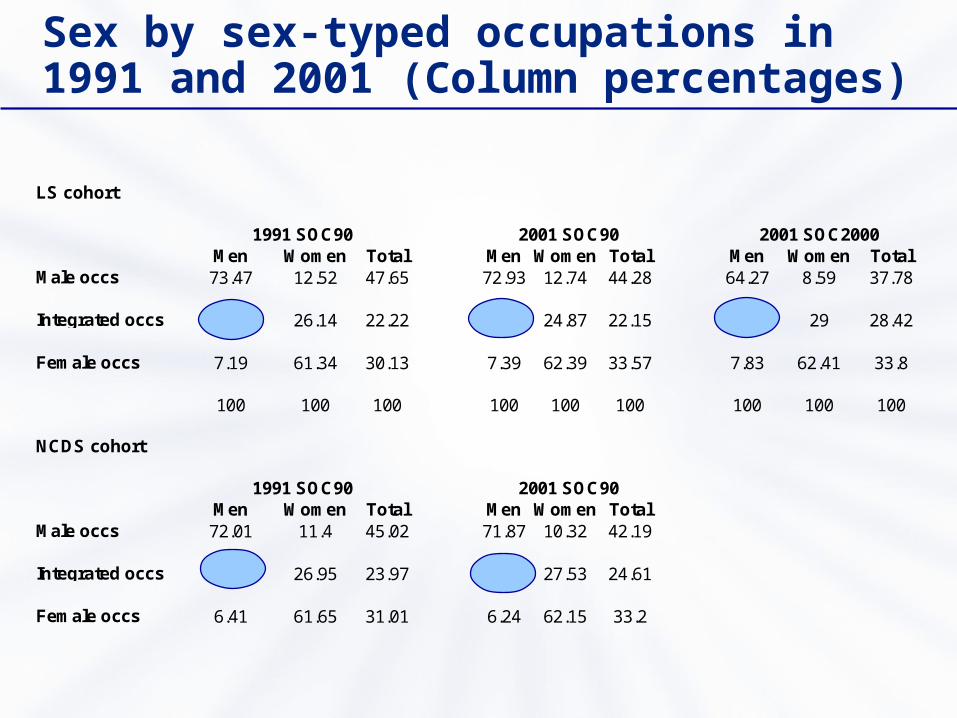
Sex by sex-typed occupations in 1991 and 2001 (Column percentages)
LS cohort
Men Women Total Men Women Total Men Women TotalMale occs 73.47 12.52 47.65 72.93 12.74 44.28 64.27 8.59 37.78
Integrated occs 19.34 26.14 22.22 19.68 24.87 22.15 27.89 29 28.42
Female occs 7.19 61.34 30.13 7.39 62.39 33.57 7.83 62.41 33.8
100 100 100 100 100 100 100 100 100
NCDS cohort
Men Women Total Men Women TotalMale occs 72.01 11.4 45.02 71.87 10.32 42.19
Integrated occs 21.58 26.95 23.97 21.89 27.53 24.61
Female occs 6.41 61.65 31.01 6.24 62.15 33.2
1991 SOC90 2001 SOC90
1991 SOC90 2001 SOC90 2001 SOC2000
Next steps
• Using the strength of the NCDS: work histories
• Apply Survival Analysis to study the influence of sex-type of occupation on duration in employment:
– How long people stay on an occupation depending on what sex-type of occupation it is?