Embed Size (px)
Citation preview
Trends in gender and ethnic occupational segregation in England and Wales: Longitudinal evidence
by L. Blackwell and D. Guinea-Martin
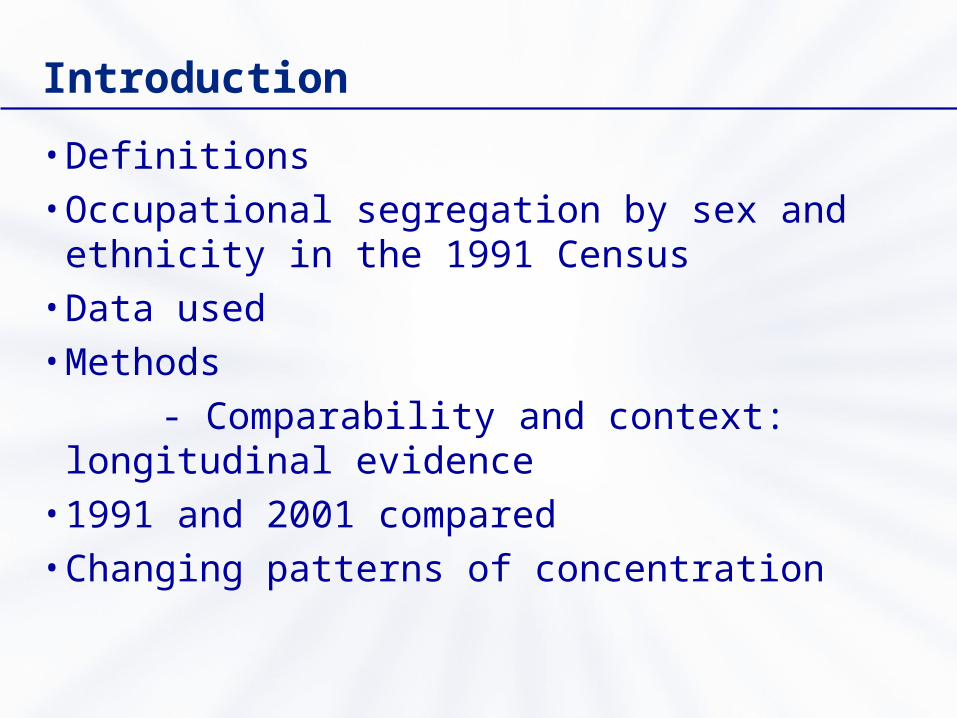
Introduction
• Definitions • Occupational segregation by sex and ethnicity in
the 1991 Census• Data used• Methods
- Comparability and context: longitudinal evidence
• 1991 and 2001 compared• Changing patterns of concentration
Definitions
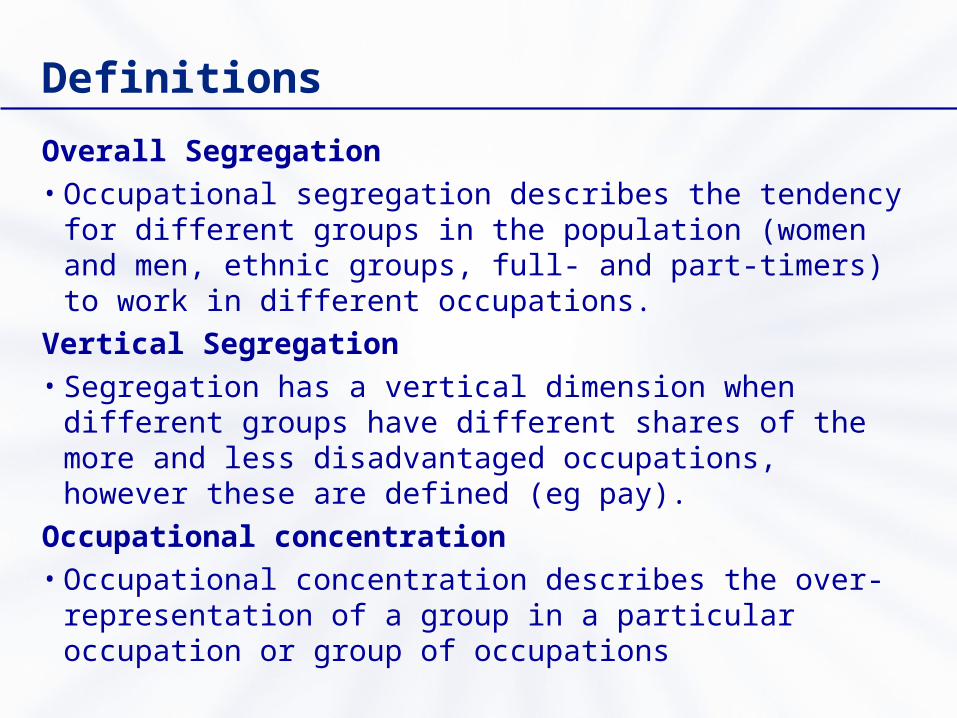
Overall Segregation• Occupational segregation describes the tendency for
different groups in the population (women and men, ethnic groups, full- and part-timers) to work in different occupations.
Vertical Segregation• Segregation has a vertical dimension when different groups
have different shares of the more and less disadvantaged occupations, however these are defined (eg pay).
Occupational concentration• Occupational concentration describes the over-
representation of a group in a particular occupation or group of occupations
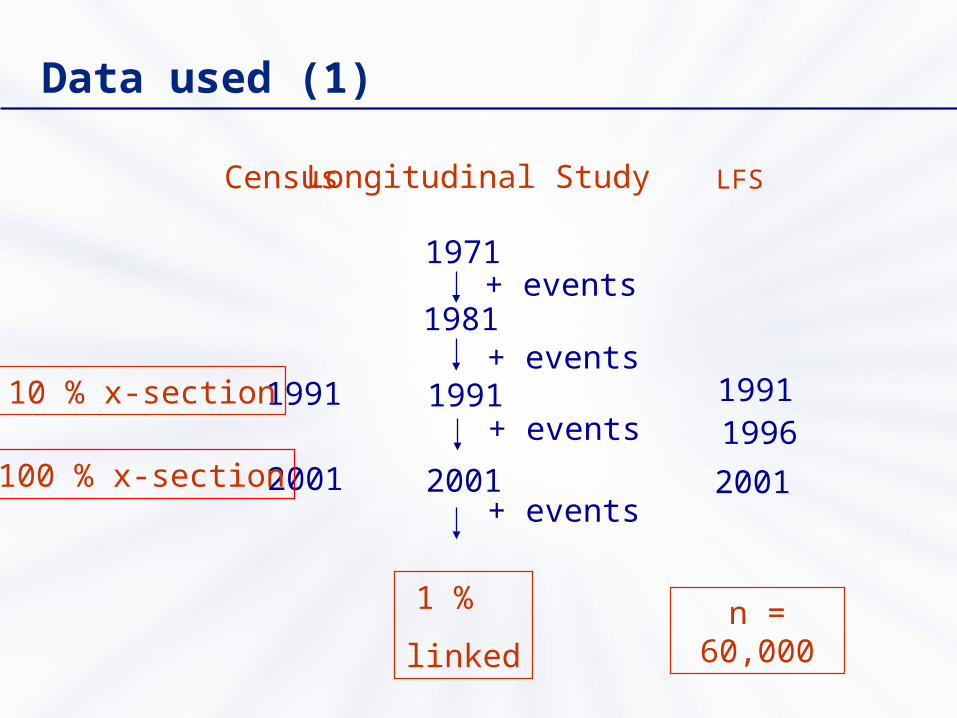
Data used (1)
Census Longitudinal Study
1971
1981
1991
2001
+ events
+ events
+ events
+ events
1991
2001
10 % x-section
100 % x-section
1 %
linked
1991
2001
n = 60,000
1996
LFS
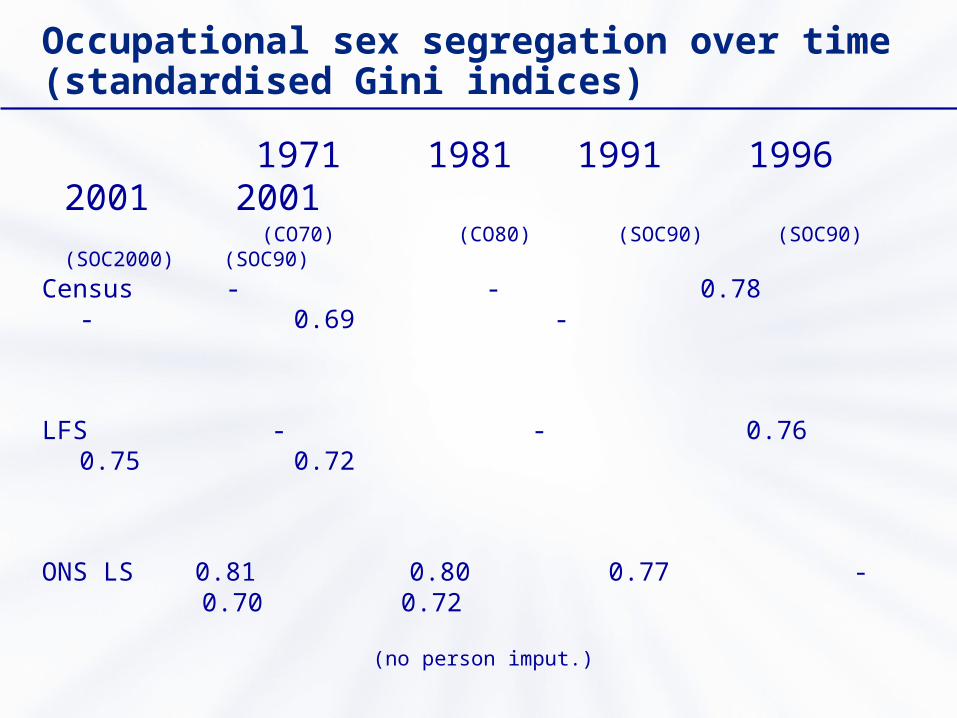
Occupational sex segregation over time (standardised Gini indices)
1971 1981 1991 1996 2001 2001 (CO70) (CO80) (SOC90) (SOC90) (SOC2000) (SOC90)
Census - - 0.78 - 0.69 -
LFS - - 0.76 0.75 0.72
ONS LS 0.81 0.80 0.77 - 0.70 0.72 (no person imput.)
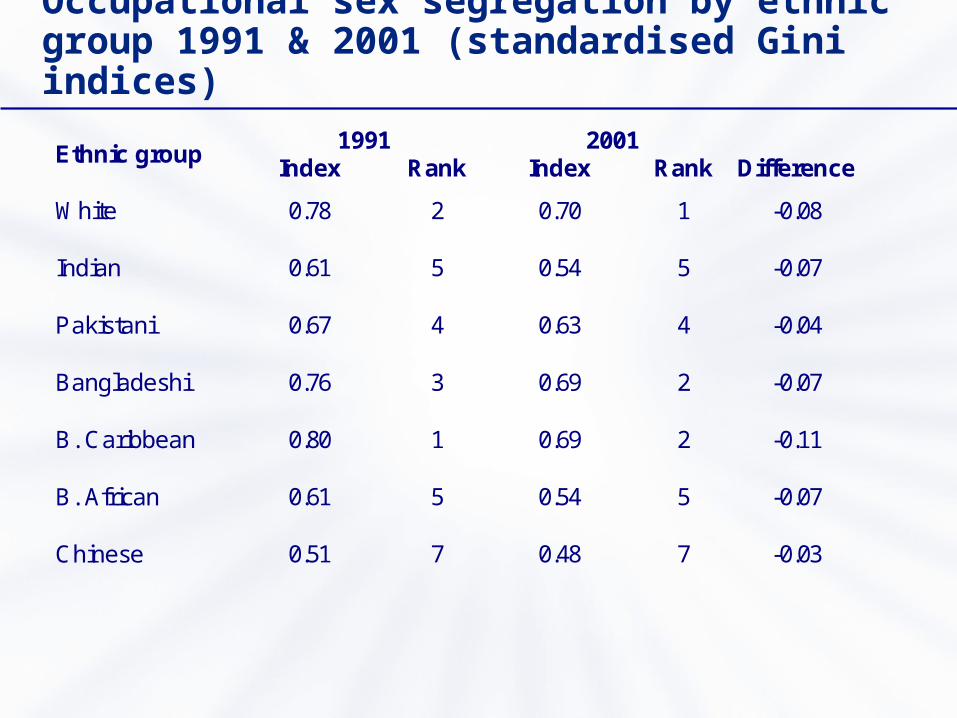
Occupational sex segregation by ethnic group 1991 & 2001 (standardised Gini indices)
1991 2001 Ethnic group
Index Rank Index Rank Difference
White 0.78 2 0.70 1 -0.08
Indian 0.61 5 0.54 5 -0.07
Pakistani 0.67 4 0.63 4 -0.04
Bangladeshi 0.76 3 0.69 2 -0.07
B. Caribbean 0.80 1 0.69 2 -0.11
B. African 0.61 5 0.54 5 -0.07
Chinese 0.51 7 0.48 7 -0.03
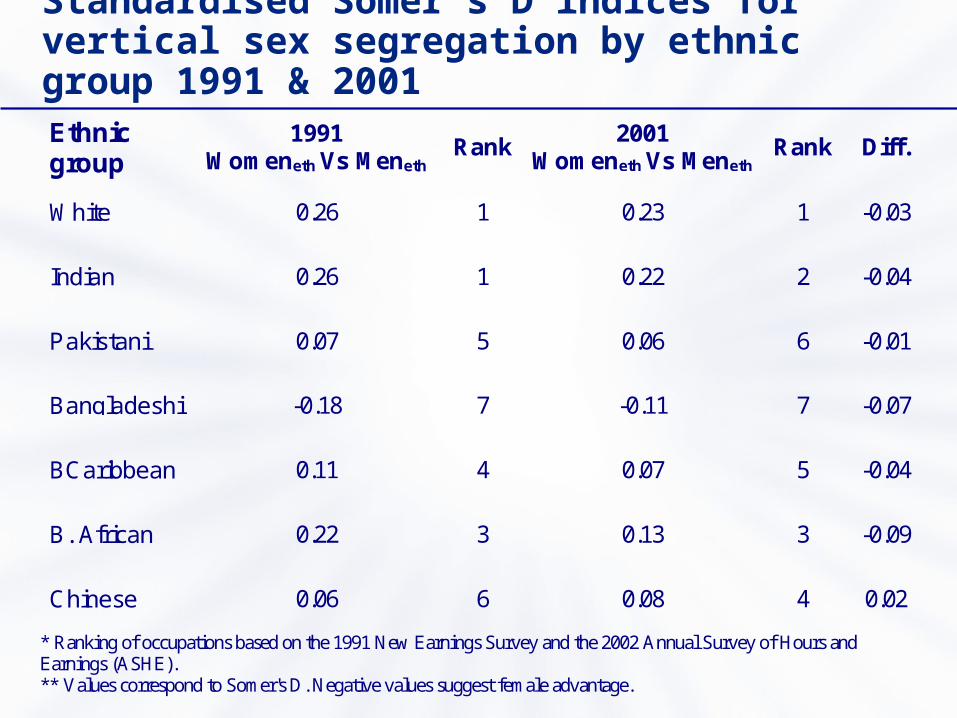
Standardised Somer’s D indices for vertical sex segregation by ethnic group 1991 & 2001 Ethnicgroup
1991Womeneth Vs Meneth
Rank2001
Womeneth Vs MenethRank Diff.
White 0.26 1 0.23 1 -0.03
Indian 0.26 1 0.22 2 -0.04
Pakistani 0.07 5 0.06 6 -0.01
Bangladeshi -0.18 7 -0.11 7 -0.07
BCaribbean 0.11 4 0.07 5 -0.04
B. African 0.22 3 0.13 3 -0.09
Chinese 0.06 6 0.08 4 0.02
* Ranking of occupations based on the 1991 New Earnings Survey and the 2002 Annual Survey of Hours andEarnings (ASHE).** Values correspond to Somer's D. Negative values suggest female advantage.
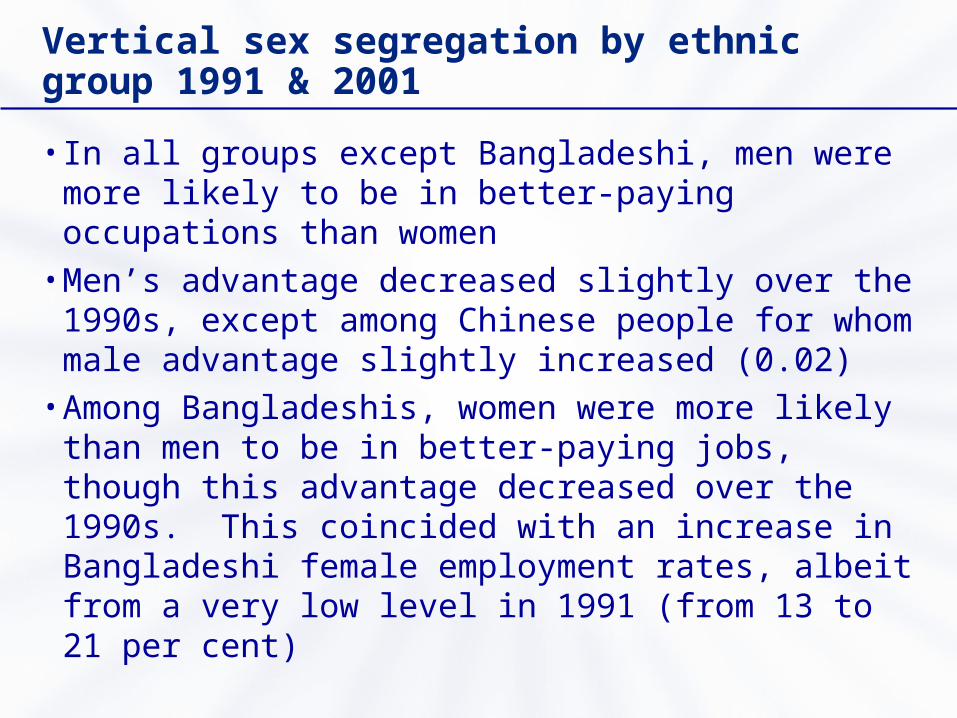
Vertical sex segregation by ethnic group 1991 & 2001
• In all groups except Bangladeshi, men were more likely to be in better-paying occupations than women
• Men’s advantage decreased slightly over the 1990s, except among Chinese people for whom male advantage slightly increased (0.02)
• Among Bangladeshis, women were more likely than men to be in better-paying jobs, though this advantage decreased over the 1990s. This coincided with an increase in Bangladeshi female employment rates, albeit from a very low level in 1991 (from 13 to 21 per cent)
Discussion
• Decline in occupational sex segregation is consistent with other findings (Elliott & Gerova 2005, Blackburn and Jarman 2005 )
• Consistency of decline across ethnic groups suggests structural change, given the flux in the minority ethnic labour force that longitudinal evidence shows.
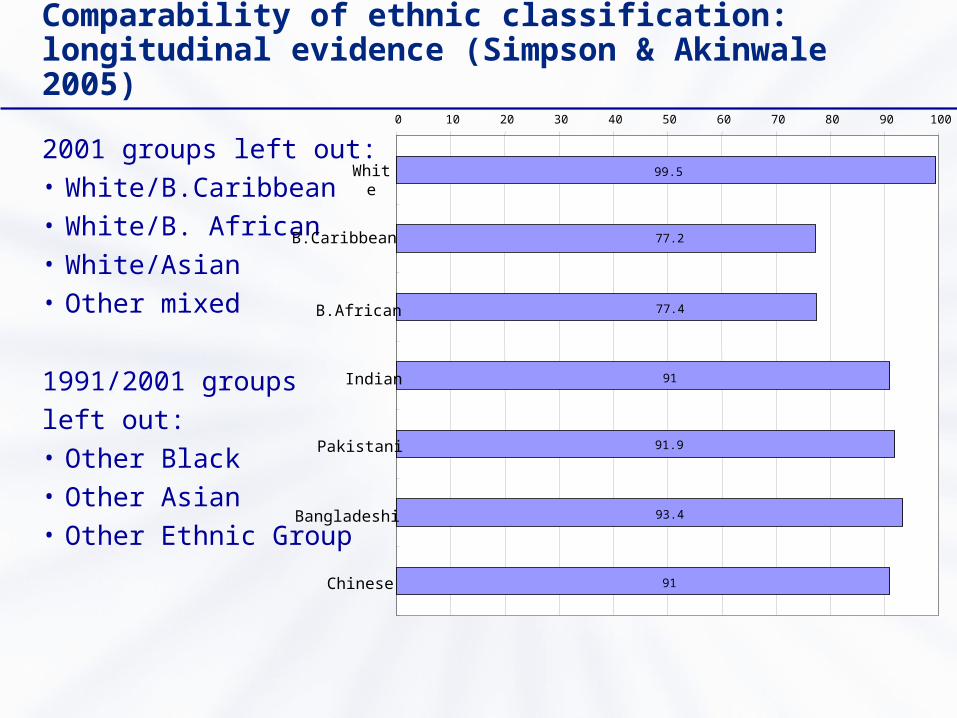
Comparability of ethnic classification: longitudinal evidence (Simpson & Akinwale 2005)
2001 groups left out:• White/B.Caribbean• White/B. African• White/Asian• Other mixed
1991/2001 groups
left out:• Other Black• Other Asian• Other Ethnic Group
91
93.4
91.9
91
77.4
77.2
99.5
0 10 20 30 40 50 60 70 80 90 100
White
B.Caribbean
B.African
Indian
Pakistani
Bangladeshi
Chinese
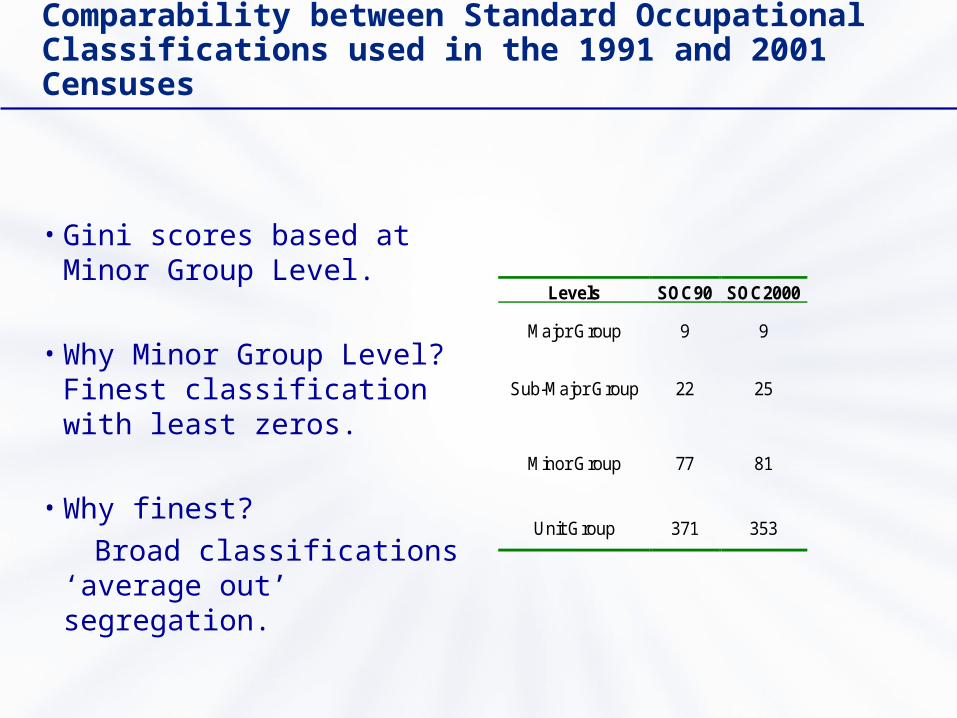
Comparability between Standard Occupational Classifications used in the 1991 and 2001 Censuses
• Gini scores based at Minor Group Level.
• Why Minor Group Level? Finest classification with least zeros.
• Why finest?
Broad classifications ‘average out’ segregation.
Levels SOC90 SOC2000
Major Group 9 9
Sub-Major Group 22 25
Minor Group 77 81
Unit Group 371 353
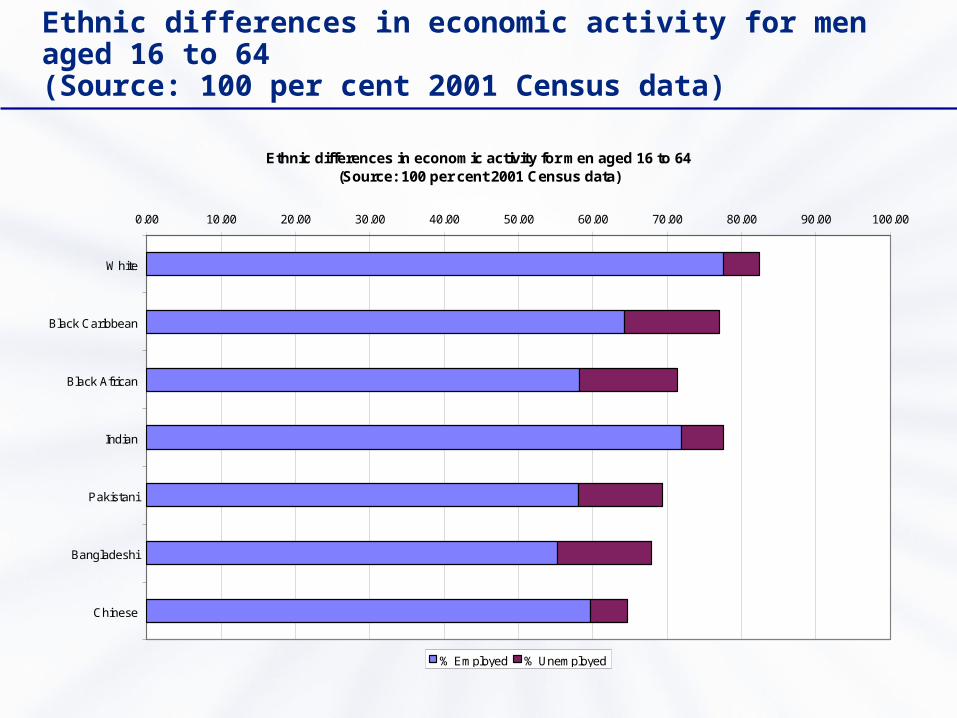
Ethnic differences in economic activity for men aged 16 to 64 (Source: 100 per cent 2001 Census data)
Ethnic differences in economic activity for men aged 16 to 64 (Source: 100 per cent 2001 Census data)
0.00 10.00 20.00 30.00 40.00 50.00 60.00 70.00 80.00 90.00 100.00
White
Black Caribbean
Black African
Indian
Pakistani
Bangladeshi
Chinese
% Employed % Unemployed
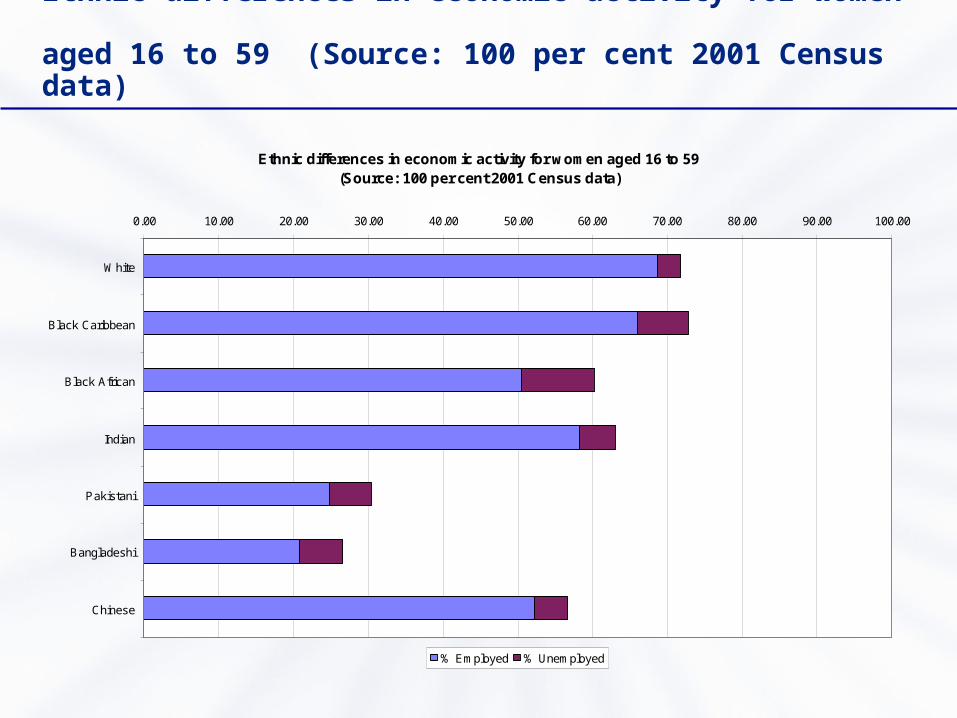
Ethnic differences in economic activity for women aged 16 to 59 (Source: 100 per cent 2001 Census data)
Ethnic differences in economic activity for women aged 16 to 59 (Source: 100 per cent 2001 Census data)
0.00 10.00 20.00 30.00 40.00 50.00 60.00 70.00 80.00 90.00 100.00
White
Black Caribbean
Black African
Indian
Pakistani
Bangladeshi
Chinese
% Employed % Unemployed
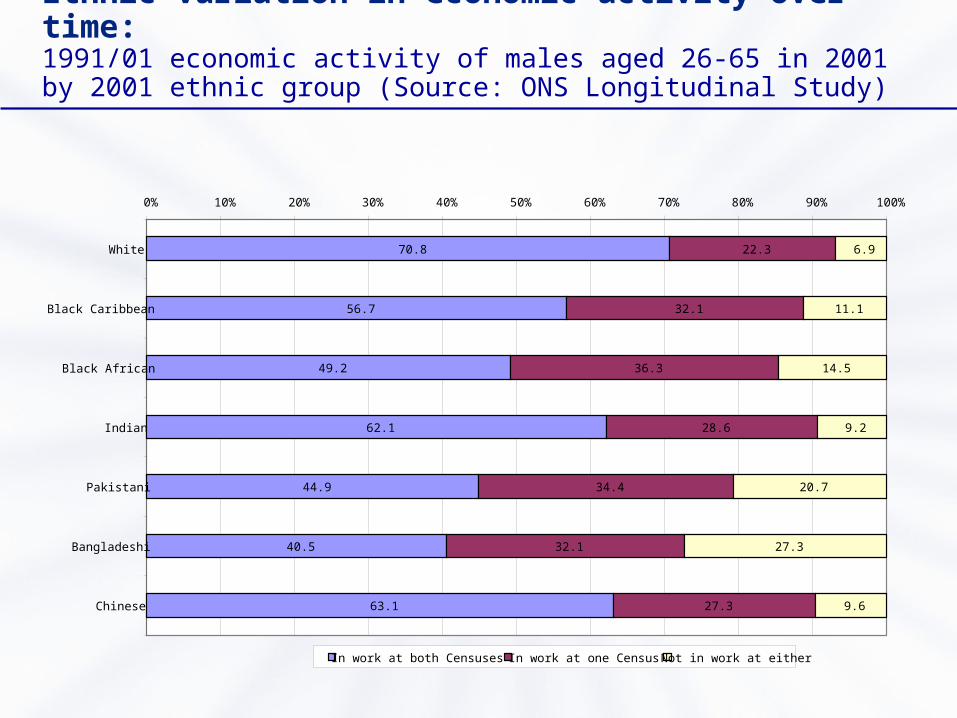
Ethnic variation in economic activity over time: 1991/01 economic activity of males aged 26-65 in 2001 by 2001 ethnic group (Source: ONS Longitudinal Study)
70.8
56.7
49.2
62.1
44.9
40.5
63.1
22.3
32.1
36.3
28.6
34.4
32.1
27.3
6.9
11.1
14.5
9.2
20.7
27.3
9.6
0% 10% 20% 30% 40% 50% 60% 70% 80% 90% 100%
White
Black Caribbean
Black African
Indian
Pakistani
Bangladeshi
Chinese
In work at both Censuses In work at one Census Not in work at either
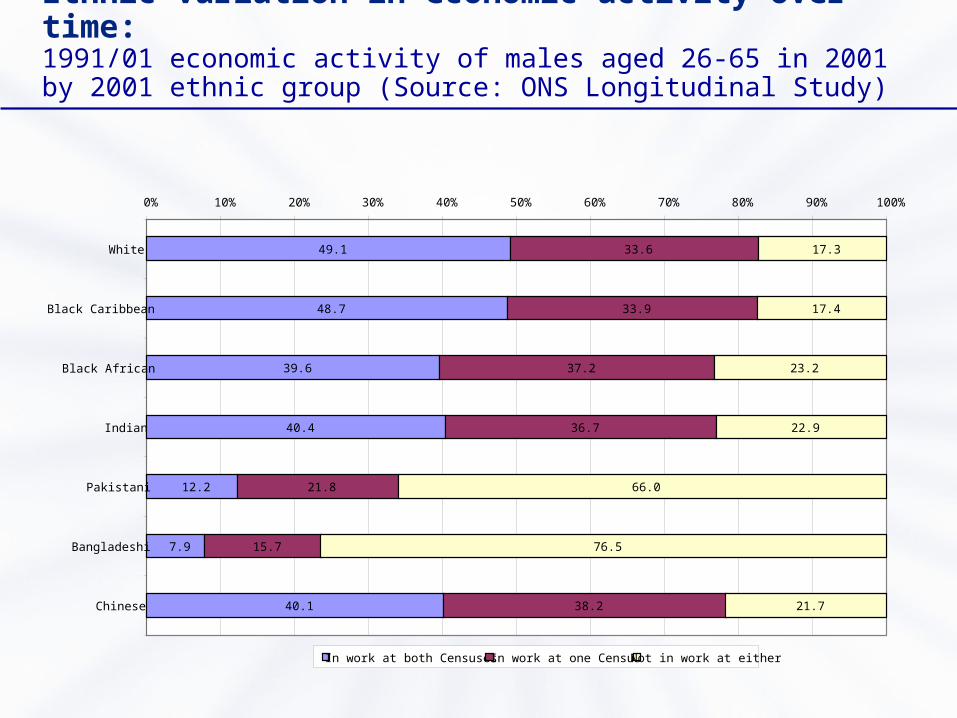
Ethnic variation in economic activity over time:1991/01 economic activity of males aged 26-65 in 2001 by 2001 ethnic group (Source: ONS Longitudinal Study)
49.1
48.7
39.6
40.4
12.2
7.9
40.1
33.6
33.9
37.2
36.7
21.8
15.7
38.2
17.3
17.4
23.2
22.9
66.0
76.5
21.7
0% 10% 20% 30% 40% 50% 60% 70% 80% 90% 100%
White
Black Caribbean
Black African
Indian
Pakistani
Bangladeshi
Chinese
In work at both Censuses In work at one Census Not in work at either
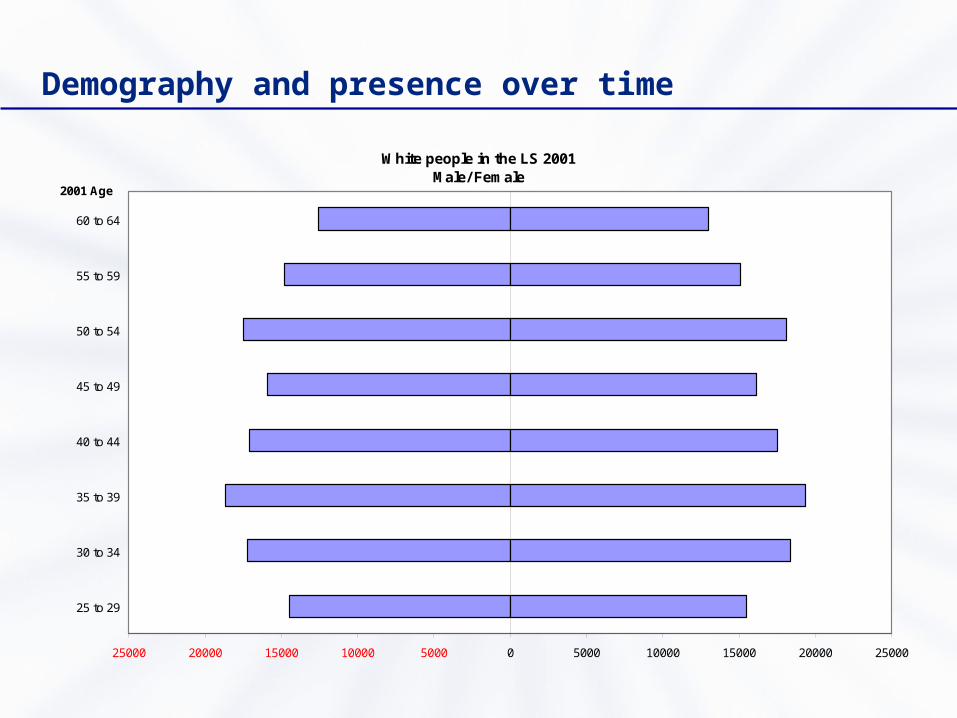
Demography and presence over time
White people in the LS 2001 Male/ Female
25000 20000 15000 10000 5000 0 5000 10000 15000 20000 25000
25 to 29
30 to 34
35 to 39
40 to 44
45 to 49
50 to 54
55 to 59
60 to 64
2001 Age
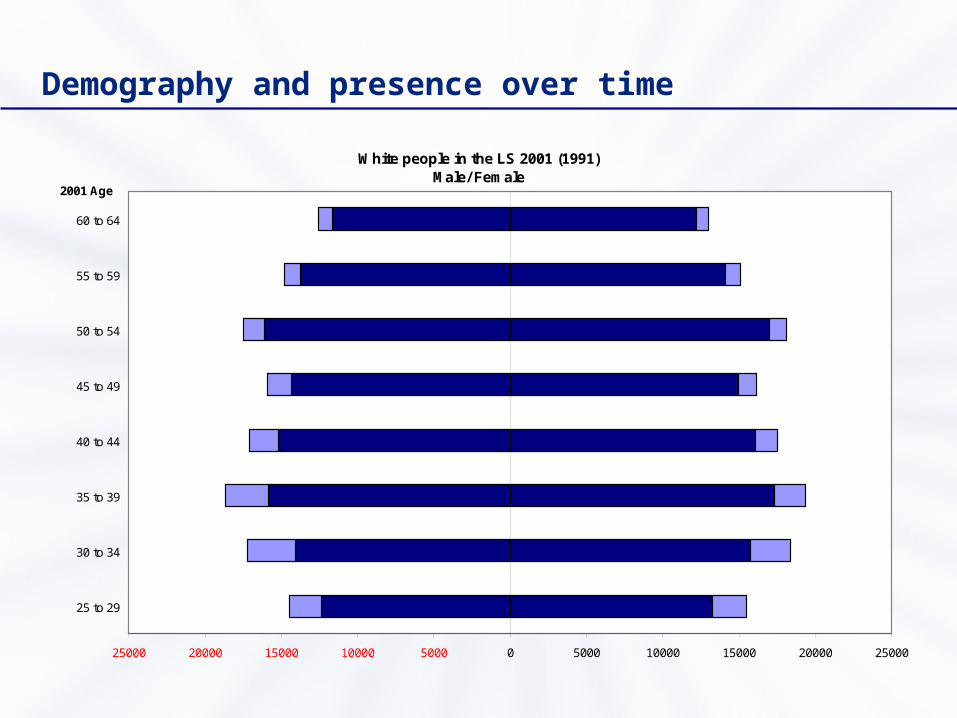
Demography and presence over time
White people in the LS 2001 (1991)Male/ Female
25000 20000 15000 10000 5000 0 5000 10000 15000 20000 25000
25 to 29
30 to 34
35 to 39
40 to 44
45 to 49
50 to 54
55 to 59
60 to 64
2001 Age
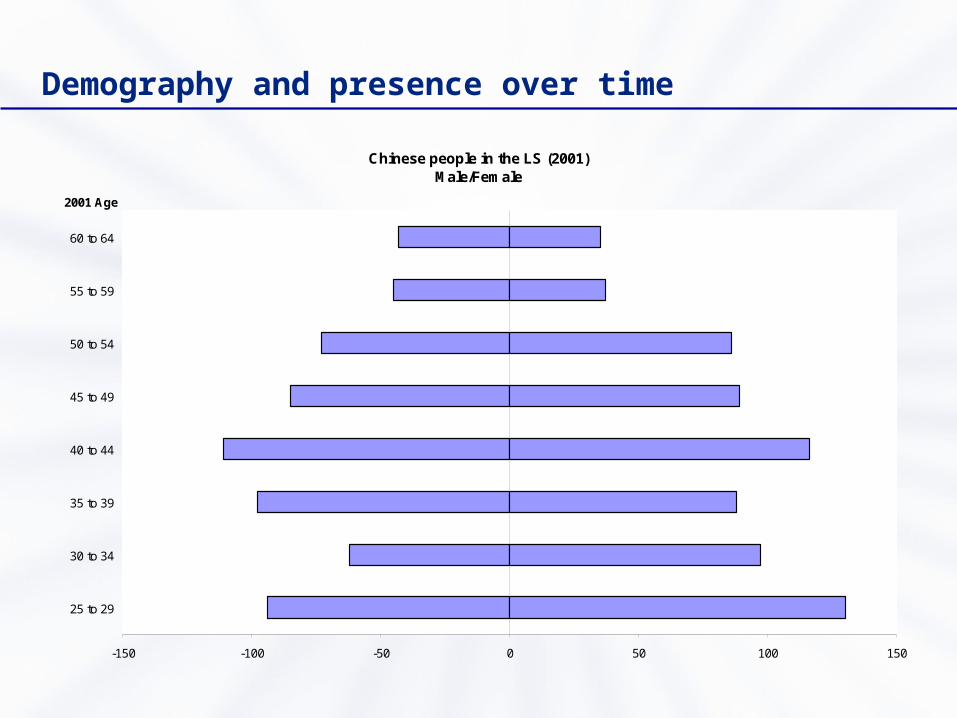
Demography and presence over time
Chinese people in the LS (2001) Male/Female
-150 -100 -50 0 50 100 150
25 to 29
30 to 34
35 to 39
40 to 44
45 to 49
50 to 54
55 to 59
60 to 64
2001 Age
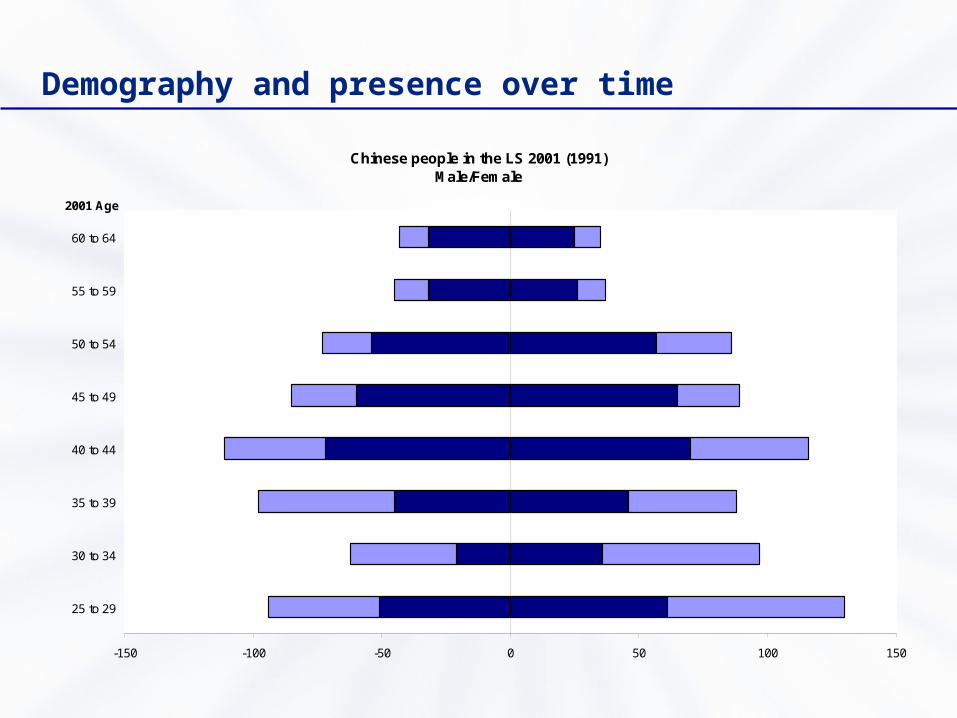
Demography and presence over time
Chinese people in the LS 2001 (1991)Male/Female
-150 -100 -50 0 50 100 150
25 to 29
30 to 34
35 to 39
40 to 44
45 to 49
50 to 54
55 to 59
60 to 64
2001 Age
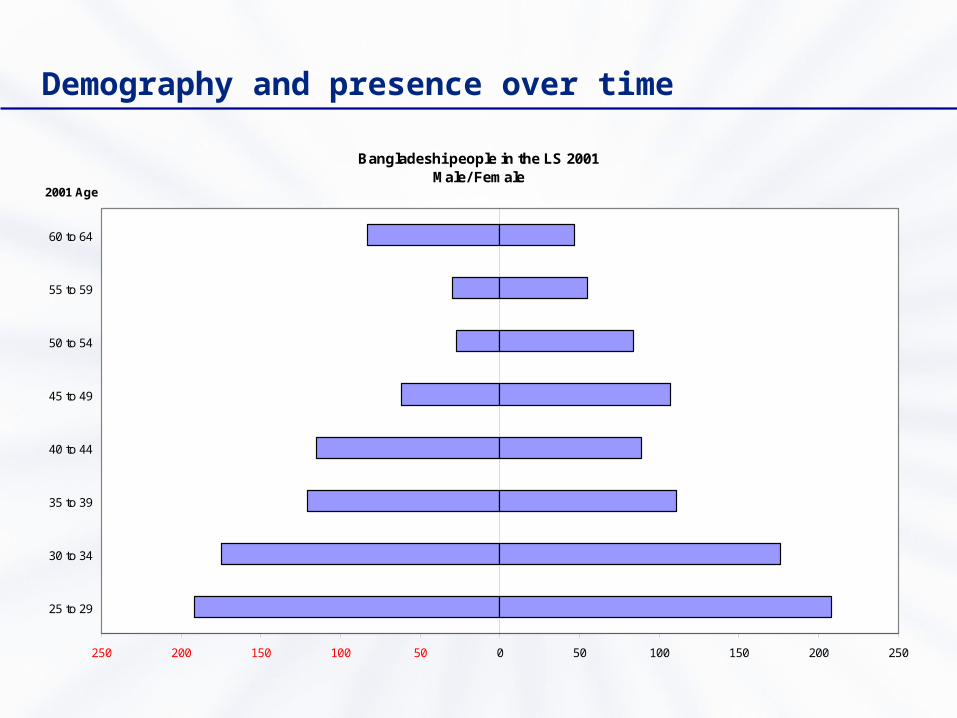
Demography and presence over time
Bangladeshi people in the LS 2001Male/ Female
250 200 150 100 50 0 50 100 150 200 250
25 to 29
30 to 34
35 to 39
40 to 44
45 to 49
50 to 54
55 to 59
60 to 64
2001 Age
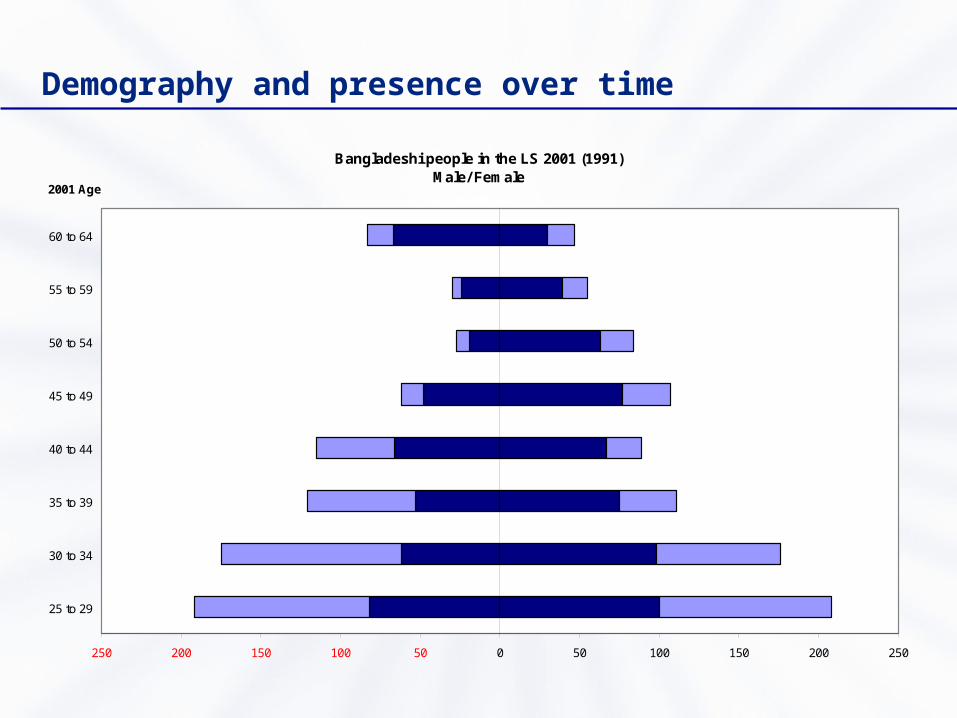
Demography and presence over time
Bangladeshi people in the LS 2001 (1991)Male/ Female
250 200 150 100 50 0 50 100 150 200 250
25 to 29
30 to 34
35 to 39
40 to 44
45 to 49
50 to 54
55 to 59
60 to 64
2001 Age
Next steps
• Further cross-sectional work: analysis of segregation of full- and part-timers, manual/non-manual, UK- and non UK-born using the LS.
• Use NCDS to derive occupational segregation indices for 1958 cohort.
• Use NCDS to examine underlying work histories.
• At the same time, the LS will help assess the representativeness of the NCDS sample.
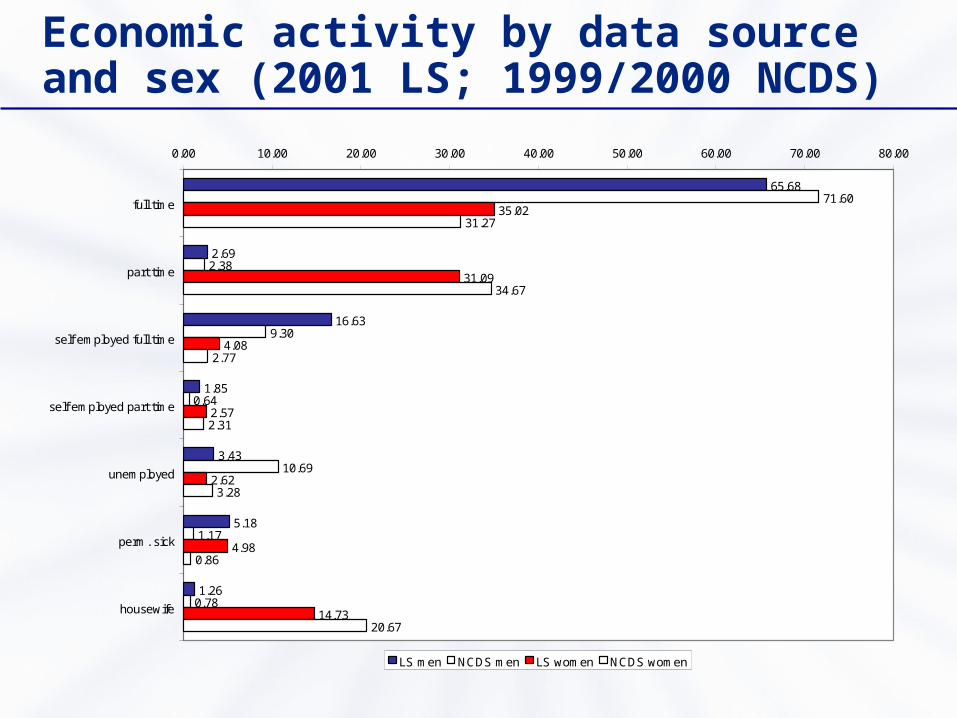
Economic activity by data source and sex (2001 LS; 1999/2000 NCDS)
65.68
2.69
16.63
1.85
3.43
5.18
1.26
71.60
2.38
9.30
0.64
10.69
1.17
0.78
35.02
31.09
4.08
2.57
2.62
4.98
14.73
31.27
34.67
2.77
2.31
3.28
0.86
20.67
0.00 10.00 20.00 30.00 40.00 50.00 60.00 70.00 80.00
full time
part time
self employed full time
self employed part time
unemployed
perm. sick
housewife
LS men NCDS men LS women NCDS women
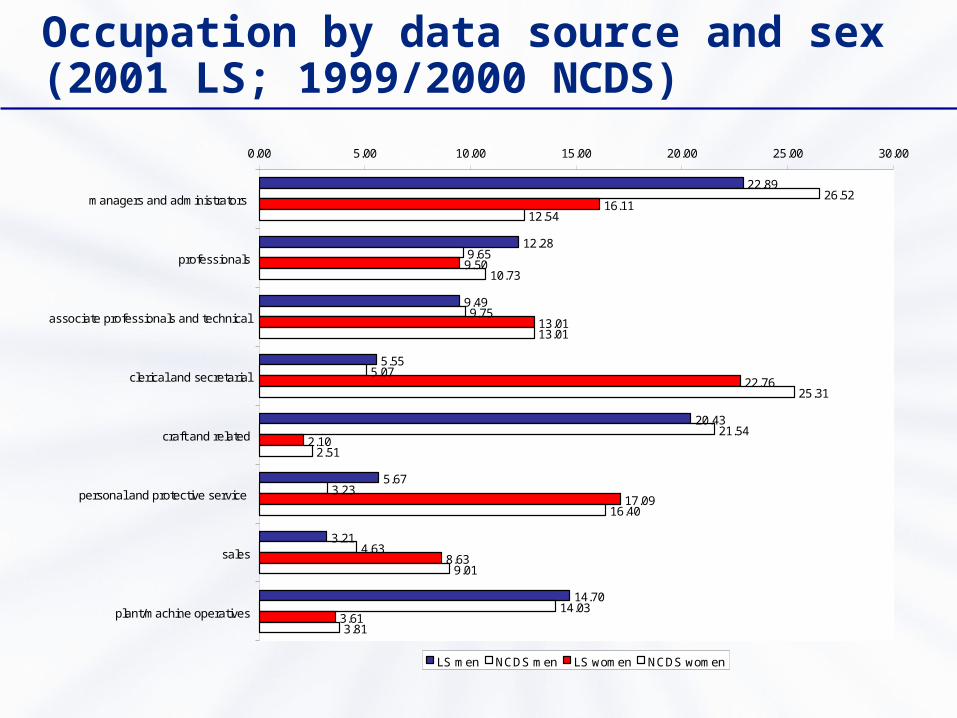
Occupation by data source and sex (2001 LS; 1999/2000 NCDS)
22.89
12.28
9.49
5.55
20.43
5.67
3.21
14.70
26.52
9.65
9.75
5.07
21.54
3.23
4.63
14.03
16.11
9.50
13.01
22.76
2.10
17.09
8.63
3.61
12.54
10.73
13.01
25.31
2.51
16.40
9.01
3.81
0.00 5.00 10.00 15.00 20.00 25.00 30.00
managers and administrators
professionals
associate professionals and technical
clerical and secretarial
craft and related
personal and protective service
sales
plant/machine operatives
LS men NCDS men LS women NCDS women