Embed Size (px)
Citation preview
SEISMIC ANALYSIS OF STEEL WIND TURBINE TOWERS
IN THE CANADIAN ENVIRONMENT
by
Elena Nuta
A thesis submitted in conformity with the requirements
for the degree of Master of Applied Science
Graduate Department of Civil Engineering
University of Toronto
© Copyright by Elena Nuta (2010)
SEISMIC ANALYSIS OF WIND TURBINE TOWERS IN THE CANADIAN ENVIRONMENT - ii -
Seismic Analysis of Steel Wind Turbine Towers in the Canadian Environment
Master of Applied Science (2010)
Elena Nuta
Department of Civil Engineering
University of Toronto
ABSTRACT
The seismic response of steel monopole wind turbine towers is investigated and their risk is
assessed in the Canadian seismic environment. This topic is of concern as wind turbines are
increasingly being installed in seismic areas and design codes do not clearly address this aspect of
design. An implicit finite element model of a 1.65MW tower was developed and validated.
Incremental dynamic analysis was carried out to evaluate its behaviour under seismic excitation, to
define several damage states, and to develop a framework for determining its probability of damage.
This framework was implemented in two Canadian locations, where the risk was found to be low for
the seismic hazard level prescribed for buildings. However, the design of wind turbine towers is
subject to change, as is the design spectrum. Thus, a methodology is outlined to thoroughly
investigate the probability of reaching predetermined damage states under seismic loading for future
considerations.
SEISMIC ANALYSIS OF WIND TURBINE TOWERS IN THE CANADIAN ENVIRONMENT - iii -
ACKNOWLEDGEMENTS
I would firstly like to express my gratitude to Professor J. A. Packer and to Professor C.
Christopoulos for their guidance and the countless meetings that ensured my project was always on
track. I see now, in retrospect, how paramount this guidance was, and I thank you both.
Special thanks go out to Andrew Voth and Dr. Gilberto Martinez-Saucedo, for many hours of
help working out finite element modelling glitches, and to Lydell Wiebe and Nabil Mansour, for
their willingness to always discuss thesis concerns with me. I would also like to thank my many
officemates, research group members, and colleagues for enriching my graduate experience and
providing conversation and laughter.
Financial support has been provided by Ontario Graduate Scholarships (OGS), the National
Sciences and Engineering Research Council of Canada (NSERC), and the Steel Structures Education
Foundation (SSEF). I also gratefully acknowledge the Ontario Centres of Excellence (OCE), and
the Fraunhofer Centre Windenergie und Meerestechnik, Bremerhaven, Germany where I spent the
summer of 2008 as an intern.
Last but not least, I thank the people most important in my life. To my awesome parents,
Floarea and Mihai Nuta, thank you for teaching me to always aim high and for supporting me
always. To my beautiful sister and brother-in-law, Gabriela Nuta and Andrew Orel-Golla, thank you
for making sure I had enough distractions to stay sane and for accommodating my erratic schedule.
To my loving boyfriend, Michael Colalillo, thank you for your motivation, understanding,
encouragement, time, and patience during this time; and of course, thank you for the pasta dinners.
To all my friends, thank you for the unwavering mental support and for never doubting me.
SEISMIC ANALYSIS OF WIND TURBINE TOWERS IN THE CANADIAN ENVIRONMENT - iv -
TABLE OF CONTENTS
ABSTRACT .............................................................................................................................. ii ACKNOWLEDGEMENTS .................................................................................................... iii TABLE OF CONTENTS ........................................................................................................iv LIST OF TABLES................................................................................................................... ix LIST OF FIGURES................................................................................................................. xi LIST OF SYMBOLS AND ABBREVIATIONS.....................................................................xv
CHAPTER 1: INTRODUCTION................................................................................................... 1 1.1 Overview of Thesis................................................................................................................................ 1 1.2 Wind Turbine Type, Components, and Terminology .........................................................................2
CHAPTER 2: LITERATURE REVIEW..........................................................................................4 2.1 International Standards ........................................................................................................................4
2.1.1 International Electrotechnical Commission (IEC) .................................................................4 2.1.2 Germanischer Lloyd (GL) ........................................................................................................5 2.1.3 Det Norske Veritas (DNV) ......................................................................................................5 2.1.4 Other European Standards.......................................................................................................7
2.2 Canadian Standards ..............................................................................................................................7 2.2.1 CAN/CSA-C61400-1:08, Wind Turbines – Part 1: Design Requirements..............................7 2.2.2 CAN/CSA S37-01, Antennas, Towers, and Antenna-Supporting Structures..........................8 2.2.3 CAN/CSA S473-04, Steel (Fixed Offshore) Structures............................................................8 2.2.4 CAN/CSA S16-09, Design of Steel Structures .........................................................................8
2.3 Book Publications.................................................................................................................................8 2.4 Current Research on Wind Turbine Towers ........................................................................................9
2.4.1 Comparison of Seismic Analysis Methods: Frequency-Domain vs. Time-Domain..............9 2.4.2 Shell Buckling......................................................................................................................... 10 2.4.3 Dynamic Soil-Structure Interaction Effects............................................................................11
2.5 Summary ............................................................................................................................................. 12
CHAPTER 3: FINITE ELEMENT MODEL DEVELOPMENT AND VALIDATION ......................... 13 3.1 Geometry of Wind Turbine Towers.................................................................................................... 13 3.2 Finite Element Analysis Program ...................................................................................................... 13 3.3 Material Properties.............................................................................................................................. 14 3.4 Choice of Elements............................................................................................................................. 16
TABLE OF CONTENTS
SEISMIC ANALYSIS OF WIND TURBINE TOWERS IN THE CANADIAN ENVIRONMENT - v -
3.4.1 Shell Elements ........................................................................................................................ 16 3.4.1.1 Classical Plate Theory............................................................................................ 16
3.4.2 Solid Elements........................................................................................................................ 17 3.4.2.1 Elastic Beam Theory ............................................................................................. 18
3.4.3 Solid-Shell Interaction............................................................................................................ 18 3.5 Connection Modelling ........................................................................................................................ 18 3.6 Tubular Members under Bending...................................................................................................... 19
3.6.1 FE Model for Pure Flexure .................................................................................................... 21 3.6.1.1 Mesh Sensitivity ..................................................................................................... 22 3.6.1.2 Refinement of Mesh............................................................................................... 23 3.6.1.3 Results and Analysis of Tubular Members under Pure Flexure........................... 24
3.6.2 FE Model of a Cantilever Tower under Bending .................................................................. 27 3.6.2.1 Results and Analysis of Cantilever Tower under Bending ................................... 28 3.6.2.2 Stiffening Effect of a Flange .................................................................................. 29 3.6.2.3 Effect of Local Imperfections on Flexural Behaviour........................................... 30
3.7 Tubular Members under Axial Compression..................................................................................... 31 3.7.1 FE Analyses for Validation of Axial Buckling Behaviour ..................................................... 32
3.7.1.1 FE Models for Validation of Axial Buckling Behaviour ....................................... 32 3.7.1.2 Eigenvalue Buckling Analysis ............................................................................... 32 3.7.1.3 Nonlinear Buckling Analysis – Geometric and Material Nonlinearities ............. 33 3.7.1.4 Geometric Imperfections for Global Buckling...................................................... 33 3.7.1.5 Geometric Imperfections for Local Buckling ....................................................... 33 3.7.1.6 Results and Analysis of Cantilever Tower under Axial Compression .................. 34
3.7.2 Summary of Modelling Decisions.......................................................................................... 36 3.8 Time-History Analysis under Seismic Excitation.............................................................................. 36
3.8.1 Damping in ANSYS ............................................................................................................... 37 3.8.1.1 Comparison of Effect of Damping ........................................................................ 38 3.8.1.2 Aerodynamic Damping.......................................................................................... 41
3.8.2 Incremental Nonlinear Analysis ............................................................................................ 41 3.8.2.1 Failure Mode.......................................................................................................... 42
3.9 Summary ............................................................................................................................................. 43
CHAPTER 4: PRELIMINARY ANALYSIS OF VESTAS WIND TURBINE TOWER...........................45 4.1 Structure Characteristics..................................................................................................................... 45
4.1.1 Dimensions And Details ........................................................................................................ 45 4.1.1.1 Discontinuities ....................................................................................................... 45
4.1.2 Mass........................................................................................................................................ 48 4.1.3 Mode Shapes .......................................................................................................................... 49 4.1.4 Damping................................................................................................................................. 49
TABLE OF CONTENTS
SEISMIC ANALYSIS OF WIND TURBINE TOWERS IN THE CANADIAN ENVIRONMENT - vi -
4.2 Finite Element Model of Vestas Wind Turbine Tower ..................................................................... 49 4.3 Pushover Analysis ............................................................................................................................... 52
4.3.1 Background ............................................................................................................................ 52 4.3.2 Pushover Analysis of Wind Turbine Tower........................................................................... 53
4.3.2.1 Imposed Imperfections.......................................................................................... 54 4.3.3 Results of Pushover Analysis ................................................................................................. 55
4.3.3.1 Interpretation of Pushover Analysis Results ......................................................... 57 4.4 Summary ............................................................................................................................................. 57
CHAPTER 5: NONLINEAR TIME-HISTORY ANALYSIS OF THE VESTAS WIND TURBINE TOWER
........................................................................................................................................58 5.1 Earthquake Suite................................................................................................................................. 58
5.1.1 Earthquake Input in Time-History Analyses ........................................................................ 62 5.1.2 Scaling of Earthquake Records.............................................................................................. 62
5.2 Results of LA01 & LA02 (Imperial Valley, 1940, Elcentro) ................................................................ 63 5.2.1 Intensity and Damage Measures ........................................................................................... 63
5.2.1.1 Peak Displacement ................................................................................................ 64 5.2.1.2 Peak Rotation......................................................................................................... 65 5.2.1.3 Peak Stress ............................................................................................................. 66 5.2.1.4 Residual Deformation............................................................................................ 67
5.2.2 Displaced Shape ..................................................................................................................... 67 5.2.3 Time-History Displacement Response ................................................................................. 69 5.2.4 Orbit Plots .............................................................................................................................. 70 5.2.5 Definition of Damage States for Wind Turbine Towers ....................................................... 72
5.2.5.1 0.2% Residual Out-of-Straightness........................................................................ 72 5.2.5.2 First Yield............................................................................................................... 72 5.2.5.3 1.0% Residual Out-of-Straightness........................................................................ 72 5.2.5.4 First Buckle / Loss of Tower................................................................................. 72
5.3 Summary of Results for LA Earthquake Suite ................................................................................... 73 5.3.1 Incremental Dynamic Analysis Curves.................................................................................. 74
5.3.1.1 Assessment of Damage Measures ......................................................................... 74 5.3.1.2 Average Damage Measures ................................................................................... 75
5.3.2 Location of Buckle for 4th Damage State............................................................................... 75 5.3.3 Definition of Fragility Curves ................................................................................................ 76 5.3.4 Effect of Vertical Earthquake Component ............................................................................ 79 5.3.5 Effect of Damping.................................................................................................................. 80 5.3.6 Validation of Connection Modelling...................................................................................... 81
5.4 Summary ............................................................................................................................................. 83
TABLE OF CONTENTS
SEISMIC ANALYSIS OF WIND TURBINE TOWERS IN THE CANADIAN ENVIRONMENT - vii -
CHAPTER 6: INCREMENTAL ANALYSIS FOR TWO CANADIAN SITES ......................................85 6.1 Eastern Canada Site............................................................................................................................ 85
6.1.1 Simulated Time-History Records for the Eastern Canada Site ............................................ 86 6.1.2 Earthquake Suite for the Eastern Canada Site ...................................................................... 86
6.2 Western Canada Site ........................................................................................................................... 89 6.2.1 Simulated Time-History Records for the Western Canada Site............................................ 89 6.2.2 Earthquake Suite for the Western Canada Site ..................................................................... 90
6.3 Methodology for Scaling Records for IDA......................................................................................... 93 6.3.1 Efficiency of Method.............................................................................................................. 94
6.4 Results for Eastern Canada Site ......................................................................................................... 96 6.5 Results of Time-History Analysis for Western Canada Site .............................................................. 97
6.5.1 Incremental Dynamic Analysis Curves.................................................................................. 97 6.5.1.1 Average Damage Measures ................................................................................... 98
6.5.2 Fragility Curves ...................................................................................................................... 99 6.6 Summary ........................................................................................................................................... 100
CHAPTER 7: CONCLUSIONS AND RECOMMENDATIONS........................................................101
REFERENCES..................................................................................................................... 103
APPENDIX A: RESULTS OF INCREMENTAL TIME-HISTORY ANALYSIS FOR LA
EARTHQUAKE SUITE.................................................................................. 107 A.1 LA03 & LA04 (Imperial Valley, 1979, Array #05)............................................................................ 108 A.2 LA05 & LA06 (Imperial Valley, 1979, Array #06)............................................................................. 111 A.3 LA07 & LA08 (Landers, 1992, Barstow)...........................................................................................114 A.4 LA09 & LA10 (Landers, 1992, Yermo)..............................................................................................117 A.5 LA11 & LA12 (Loma Prieta, 1989, Gilroy) ....................................................................................... 120 A.6 LA13 & LA14 (Northridge, 1994, Newhill)...................................................................................... 123 A.7 LA15 & LA16 (Northridge, 1994, Rinaldi RS) ................................................................................. 126 A.8 LA17 & LA18 (Northridge, 1994, Sylmar)........................................................................................ 129 A.9 LA19 & LA20 (North Palm Springs, 1986) ...................................................................................... 132 A.10 IDA Curves for Investigated Intensity Measures ........................................................................... 135
APPENDIX B: SEISMIC HAZARD FOR TWO CANADIAN SITES............................................ 138 APPENDIX C: RESULTS OF THE WESTERN CANADA EARTHQUAKE SUITE........................141
C.1 WCan01 (Magnitude 6, 8 – 13 km) .................................................................................................. 142 C.2 WCan02 (Magnitude 7, 10 – 26 km) ................................................................................................ 144 C.3 WCan03 (Magnitude 7, 10 – 26 km) ................................................................................................ 146
TABLE OF CONTENTS
SEISMIC ANALYSIS OF WIND TURBINE TOWERS IN THE CANADIAN ENVIRONMENT - viii -
C.4 WCan04 (Magnitude 7, 10 – 26 km) ................................................................................................ 148 C.5 WCan05 (Magnitude 7, 10 – 26 km) ................................................................................................ 150 C.6 WCan06 (Magnitude 7, 30 – 100 km) .............................................................................................. 152 C.7 WCan07 (Cascadia Record, Magnitude 9, 112 – 201 km)................................................................ 154 C.8 Fragility Curves for Additional Intensity Measures........................................................................ 156
SEISMIC ANALYSIS OF WIND TURBINE TOWERS IN THE CANADIAN ENVIRONMENT - ix -
LIST OF TABLES
Table 3.1: Cross-sectional slenderness limits (D/t) of circular hollow sections in bending 20 Table 3.2: Slenderness limits (D/t) of circular hollow sections in axial compression for non-slender
behaviour, using E = 200000 MPa 31 Table 3.3: Summary of results of time-history analyses for the UCSD tower comparing different damping
values 38 Table 3.4: Summary of results of incremental time-history analyses for the UCSD tower 42 Table 4.1: Mass of Vestas wind turbine tower 48 Table 5.1: Properties of LA earthquake suite records 59 Table 5.2: Summary of displacement results of time-history analyses subjected to LA01 & LA02 (Imperial
Valley, 1940, Elcentro) 63 Table 5.3: Minimum, average, and maximum values of damage measures at each damage state 75 Table 5.4: Location of buckle for the LA earthquake suite 76 Table 5.5: Intensity measures (magnification factors) of each earthquake analysis and statistics for all the
damage states for the LA earthquake suite 77 Table 5.6: Properties of earthquake records for analyses that included a vertical component 79 Table 5.7: Variation of peak displacement compared to 1% damping for LA11 and LA12 (Loma Prieta,
1989, Gilroy) 80 Table 5.8: Properties of bolts used in intermediate flanges of Vestas wind turbine tower 82 Table 5.9: Characteristics of wind turbine tower flanges 83 Table 6.1: Spectral hazard values (Sa(T)) and peak ground acceleration (PGA) for the Eastern Canada site,
2% probability of exceedance in 50 years 85 Table 6.2: Scale factors and PGA of earthquake records chosen for the Eastern Canada site 87 Table 6.3: Spectral hazard values (Sa(T)) and peak ground acceleration (PGA) for the Western Canada site,
2% probability of exceedance in 50 years 89 Table 6.4: Scale factors and PGA of earthquake records chosen for the Western Canada site 91 Table 6.5: Summary of results of time-history analyses for the Eastern Canada suite 96 Table 6.6: Summary of results of time-history analyses for the Eastern Canada suite with magnification
factor of 10 96 Table 6.7: Minimum, average, and maximum values of damage measures at each damage state for the
Western Canada site 99 Table 6.8: Probability of exceedance of particular damage states for varying seismic event intensities 100
Table A. 1: Summary of displacement results of time-history analyses subjected to LA03 & LA04 (Imperial Valley, 1979, Array #05) 108
Table A.2: Summary of displacement results of time-history analyses subjected to LA05 & LA06 (Imperial Valley, 1979, Array #06) 111
Table A.3: Summary of displacement results of time-history analyses subjected to LA07 & LA08 (Landers, 1992, Barstow) 114
Table A.4: Summary of displacement results of time-history analyses subjected to LA09 & LA10 (Landers, 1992, Yermo) 117
LIST OF TABLES
SEISMIC ANALYSIS OF WIND TURBINE TOWERS IN THE CANADIAN ENVIRONMENT - x -
Table A.5: Summary of displacement results of time-history analyses subjected to LA11 & LA12 (Loma Prieta, 1989, Gilroy) 120
Table A.6: Summary of displacement results of time-history analyses subjected to LA13 & LA14 (Northridge, 1994, Newhill) 123
Table A.7: Summary of displacement results of time-history analyses subjected to LA15 & LA16 (Northridge, 1994, Rinaldi RS) 126
Table A.8: Summary of displacement results of time-history analyses subjected to LA17 & LA18 (Northridge, 1994, Sylmar) 129
Table A.9: Summary of displacement results of time-history analyses subjected to LA19 & LA20 (North Palm Springs, 1986) 132
Table C.1: Summary of results of time-history analyses for WCan01 142 Table C.2: Summary of results of time-history analyses for WCan02 144 Table C.3: Summary of results of time-history analyses for WCan03 146 Table C.4: Summary of results of time-history analyses for WCan04 148 Table C.5: Summary of results of time-history analyses for WCan05 150 Table C.6: Summary of results of time-history analyses for WCan06 152 Table C.7: Summary of results of time-history analyses for WCan07 154
SEISMIC ANALYSIS OF WIND TURBINE TOWERS IN THE CANADIAN ENVIRONMENT - xi -
LIST OF FIGURES
Figure 1.1: Typical horizontal-axis wind turbine 2 Figure 3.1: Engineering and true stress-strain curve from Voth (2010) for cold-formed circular HSS 15 Figure 3.2: Stress-strain curves used in subsequent analyses 15 Figure 3.3: Geometry of shell element used to represent tower walls (ANSYS, 2007) 16 Figure 3.4: Geometry of 20-noded solid element used to represent flanges (ANSYS, 2007) 17 Figure 3.5: Geometry of wind turbine tower ring flanges 18 Figure 3.6: Bolted flange connections of wind turbine tower (Vestas, 2006) 19 Figure 3.7: Schematic and descriptions of FE models for validation of pure flexure 21 Figure 3.8: Normalised moment-curvature response of FEA of VF-el for various mesh sizes using uniform
mesh and perfect geometry/loading 22 Figure 3.9: Refined mesh configuration 23 Figure 3.10: Incorrect buckling configuration due to perfectly symmetrical model and loading 24 Figure 3.11: Normalised moment-curvature response of FE model VF-el compared with experimental results
from Elchalakani et al. (2002) 25 Figure 3.12: Local buckling failure of CHS under pure bending, D/t = 111 25 Figure 3.13: Normalised moment-curvature response of FE models VF-1 and VF-el (D/t = 111) 26 Figure 3.14: Normalised moment-curvature response of FE models VF-2 (D/t = 286) 27 Figure 3.15: Local buckle failure of very slender CHS under pure bending (D/t = 286) 27 Figure 3.16: Schematic and descriptions of FE models for validation of bending behaviour 28 Figure 3.17: Normalised moment-curvature response of FE models VB-1 (D/t = 111), VB-2 (D/t = 276),
and VBS-1 (stiffened) 29 Figure 3.18: Investigation of location of buckle 30 Figure 3.19: Effect of local imperfections on cantilever tower under bending 31 Figure 3.20: Schematic and descriptions of FE models for validation of axial compression 32 Figure 3.21: Assessment of influence of geometric imperfections for local buckling 34 Figure 3.22: Axial loading analysis FE results of VA-1 (D/t = 111) with and without local imperfections 35 Figure 3.23: Axial loading analysis FE results of VA-2 (D/t = 286) with and without local imperfections 35 Figure 3.24: Details of small wind turbine tested at UCSD 37 Figure 3.25: Acceleration at top of nacelle for the reference earthquake for various damping ratios 39 Figure 3.26: Acceleration at upper joint for the reference earthquake for various damping ratios 40 Figure 3.27: Displacement response of incremental time-history analysis of small wind turbine 42 Figure 3.28: Buckled shape of UCSD wind turbine tower – analysis at a magnification factor of 10 43 Figure 4.1: Details at base of Vestas wind turbine tower 46 Figure 4.2: Wind turbine tower dimensions and layout (Vestas, 2006) 47 Figure 4.3: D/t ratio of Vestas wind turbine tower sections along the height with CSA (2009b) cross-section
classification in bending 48 Figure 4.4: Mode shapes of Vestas tower in horizontal direction 49 Figure 4.5: Mesh of Vestas wind turbine tower 51 Figure 4.6: Direction of pushover analyses 54
LIST OF FIGURES
SEISMIC ANALYSIS OF WIND TURBINE TOWERS IN THE CANADIAN ENVIRONMENT - xii -
Figure 4.7: Multimode load pattern for pushover analysis of Vestas wind turbine tower 54 Figure 4.8: Load-displacement curves for pushover analysis at 0° for material properties with gradual
yielding and with yield plateau 55 Figure 4.9: Buckled failure of Vestas wind turbine tower subjected to pushover analysis at 0° 56 Figure 4.10: Peak load for pushover analysis acting at various angles 56 Figure 4.11: Top displacement at peak load for pushover analysis acting at various angles 56 Figure 5.1: Elastic acceleration response spectra for earthquake suite considered 60 Figure 5.2: Elastic displacement response spectra for earthquake suite considered 60 Figure 5.3: Accelerograms of 20 scaled ground motion records of the LA earthquake suite 61 Figure 5.4: Top view of tower showing definition of angle in plan view 64 Figure 5.5: Displaced shape of wind turbine tower used to determine the peak rotation for LA01 & LA02
(Imperial Valley, 1940, Elcentro) 66 Figure 5.6: Displaced shape of wind turbine tower at various magnification factors for LA01 & LA02
(Imperial Valley, 1940, Elcentro) 68 Figure 5.7: Bucked shape of Vestas wind turbine tower analysis for LA01 & LA02 (Imperial Valley, 1940,
Elcentro) 69 Figure 5.8: Incremental time-history displacement response of Vestas wind turbine tower subjected to
LA01 & LA02 (Imperial Valley, 1940, Elcentro) at hub height 70 Figure 5.9: Orbit in x-z plane (in mm) for Vestas wind turbine tower subjected to LA01 & LA02 (Imperial
Valley, 1940, Elcentro) 71 Figure 5.10: Incremental dynamic analysis curves for three damage measures: peak displacement, peak
rotation, and residual displacement 74 Figure 5.11: Fragility curves for LA earthquake suite for magnification factor intensity measure 78 Figure 5.12: Fragility curves for LA earthquake suite for PGV intensity measure 78 Figure 5.13: Fragility curves for LA earthquake suite for PGA intensity measure 79 Figure 5.14: Orbit in x-z plane (in mm) for varying damping values of wind turbine tower: 0.5%, 1.0% and
1.5% of critical 81 Figure 5.15: Geometry of bolted connection of tower flange 82 Figure 6.1: 2005 NBCC UHS for the Eastern Canada site for 2% in 50 years and average spectra of 4
record sets of simulated earthquakes 86 Figure 6.2: Accelerograms of 14 scaled ground motion records for the Eastern Canada site 88 Figure 6.3: Acceleration response spectra for the Eastern Canada earthquake suite for 2% in 50 years
probability of exceedance 89 Figure 6.4: 2005 NBCC UHS for the Western Canada site for 2% in 50 years and average spectra of 4
record sets of simulated earthquakes 90 Figure 6.5: Accelerograms of 14 scaled ground motion records for the Western Canada site 92 Figure 6.6: Acceleration response spectra for the Western Canada earthquake suite for 2% in 50 years
probability of exceedance 93 Figure 6.7: Flowchart of scaling procedure for the Canadian earthquake suites 95 Figure 6.8: Incremental dynamic analysis curves for Western Canada suite 97 Figure 6.9: Fragility curves for Western Canada site for the magnification factor intensity measure 99
Figure A.1: Peak displaced shape of wind turbine tower subjected to LA03 & LA04 (Imperial Valley, 1979, Array #05) 108
LIST OF FIGURES
SEISMIC ANALYSIS OF WIND TURBINE TOWERS IN THE CANADIAN ENVIRONMENT - xiii -
Figure A.2: Incremental time-history displacement response of Vestas wind turbine tower subjected to LA03 & LA04 (Imperial Valley, 1979, Array #05) at hub height (80m) 109
Figure A.3: Orbit in x-z plane (in mm) for Vestas wind turbine tower subjected to LA03 & LA04 (Imperial Valley, 1979, Array #05) 110
Figure A.4: Peak displaced shape of wind turbine tower subjected to LA05 & LA06 (Imperial Valley, 1979, Array #06) 111
Figure A.5: Incremental time-history displacement response of Vestas wind turbine tower subjected to LA05 & LA06 (Imperial Valley, 1979, Array #06) at hub height (80m) 112
Figure A.6: Orbit in x-z plane (in mm) for Vestas wind turbine tower subjected to LA05 & LA06 (Imperial Valley, 1979, Array #06) 113
Figure A.7: Peak displaced shape of wind turbine tower subjected to LA07 & LA08 (Landers, 1992, Barstow) 114
Figure A.8: Incremental time-history displacement response of Vestas wind turbine tower subjected to LA07 & LA08 (Landers, 1992, Barstow) at hub height (80m) 115
Figure A.9: Orbit in x-z plane (in mm) for Vestas wind turbine tower subjected to LA07 & LA08 (Landers, 1992, Barstow) 116
Figure A.10: Peak displaced shape of wind turbine tower subjected to LA09 & LA10 (Landers, 1992, Yermo) 117
Figure A.11: Incremental time-history displacement response of Vestas wind turbine tower subjected to LA09 & LA10 (Landers, 1992, Yermo) at hub height (80m) 118
Figure A.12: Orbit in x-z plane (in mm) for Vestas wind turbine tower subjected to LA09 & LA10 (Landers, 1992, Yermo) 119
Figure A.13: Peak displaced shape of wind turbine tower subjected to LA11 & LA12 (Loma Prieta, 1989, Gilroy) 120
Figure A.14: Incremental time-history displacement response of Vestas wind turbine tower subjected to LA11 & LA12 (Loma Prieta, 1989, Gilroy) at hub height (80m) 121
Figure A.15: Orbit in x-z plane (in mm) for Vestas wind turbine tower subjected to LA11 & LA12 (Loma Prieta, 1989, Gilroy) 122
Figure A.16: Peak displaced shape of wind turbine tower subjected to LA13 & LA14 (Northridge, 1994, Newhill) 123
Figure A.17: Incremental time-history displacement response of Vestas wind turbine tower subjected to LA13 & LA14 (Northridge, 1994, Newhill) at hub height (80m) 124
Figure A.18: Orbit in x-z plane (in mm) for Vestas wind turbine tower subjected to LA13 & LA14 (Northridge, 1994, Newhill) 125
Figure A.19: Peak displaced shape of wind turbine tower subjected to LA15 & LA16 (Northridge, 1994, Rinaldi RS) 126
Figure A.20: Incremental time-history displacement response of Vestas wind turbine tower subjected to LA15 & LA16 (Northridge, 1994, Rinaldi RS) at hub height (80m) 127
Figure A.21: Orbit in x-z plane (in mm) for Vestas wind turbine tower subjected to LA15 & LA16 (Northridge, 1994, Rinaldi RS) 128
Figure A.22: Peak displaced shape of wind turbine tower subjected to LA17 & LA18 (Northridge, 1994, Sylmar) 129
Figure A.23: Incremental time-history displacement response of Vestas wind turbine tower subjected to LA17 & LA18 (Northridge, 1994, Sylmar) at hub height (80m) 130
Figure A.24: Orbit in x-z plane (in mm) for Vestas wind turbine tower subjected to LA17 & LA18 (Northridge, 1994, Sylmar) 131
LIST OF FIGURES
SEISMIC ANALYSIS OF WIND TURBINE TOWERS IN THE CANADIAN ENVIRONMENT - xiv -
Figure A.25: Peak displaced shape of wind turbine tower subjected to LA19 & LA20 (North Palm Springs, 1986) 132
Figure A.26: Incremental time-history displacement response of Vestas wind turbine tower subjected to LA19 & LA20 (North Palm Springs, 1986) at hub height (80m) 133
Figure A.27: Orbit in x-z plane (in mm) for Vestas wind turbine tower subjected to LA19 & LA20 (North Palm Springs, 1986) 134
Figure A.28: IDA curves for various intensity measures and peak displacement damage measure 135 Figure A.29: IDA curves for various intensity measures and residual displacement damage measure 136 Figure A.30: IDA curves for various intensity measures and peak rotation damage measure 137
Figure C.1: Peak displaced shape of wind turbine tower subjected to WCan01 142 Figure C.2: Incremental time-history displacement response of Vestas wind turbine tower subjected to
WCan01 at hub height (80m) 143 Figure C.3: Peak displaced shape of wind turbine tower subjected to WCan02 144 Figure C.4: Incremental time-history displacement response of Vestas wind turbine tower subjected to
WCan02 at hub height (80m) 145 Figure C.5: Peak displaced shape of wind turbine tower subjected to WCan03 146 Figure C.6: Incremental time-history displacement response of Vestas wind turbine tower subjected to
WCan03 at hub height (80m) 147 Figure C.7: Peak displaced shape of wind turbine tower subjected to WCan04 148 Figure C.8: Incremental time-history displacement response of Vestas wind turbine tower subjected to
WCan04 at hub height (80m) 149 Figure C.9: Peak displaced shape of wind turbine tower subjected to WCan05 150 Figure C.10: Incremental time-history displacement response of Vestas wind turbine tower subjected to
WCan05 at hub height (80m) 151 Figure C.11: Peak displaced shape of wind turbine tower subjected to WCan06 152 Figure C.12: Incremental time-history displacement response of Vestas wind turbine tower subjected to
WCan06 at hub height (80m) 153 Figure C.13: Peak displaced shape of wind turbine tower subjected to WCan07 154 Figure C.14: Incremental time-history displacement response of Vestas wind turbine tower subjected to
WCan07 at hub height (80m) 155 Figure C.15: Fragility curves for the Western Canada earthquake suite for PGV intensity measure 156 Figure C.16: Fragility curves for the Western Canada earthquake suite for PGA intensity measure 156

SEISMIC ANALYSIS OF WIND TURBINE TOWERS IN THE CANADIAN ENVIRONMENT - xv -
LIST OF SYMBOLS AND ABBREVIATIONS
AISC American Institute of Steel Construction
BSI British Standards Institution
CEN European Committee for Standardization (Comité Européen de Normalisation)
CSA Canadian Standards Association
GL Germanischer Lloyd
IEC International Electrotechnical Commission
NBCC National Building Code of Canada
CHS circular hollow section
DBE design-based earthquake
DM damage measure
DOF degree-of-freedom
DS damage state
FE finite element
FEA finite element analysis
FEM finite element method
HSS hollow structural section
IDA incremental dynamic analysis
IM intensity measure
LP load pattern
MCE maximum considered earthquake when referring to the Los Angeles area
MF magnification factor
PGA peak ground acceleration
PGV peak ground velocity
LIST OF SYMBOLS AND ABBREVIATIONS
SEISMIC ANALYSIS OF WIND TURBINE TOWERS IN THE CANADIAN ENVIRONMENT - xvi -
SRSS square root of the sum of the squares
SSI soil-structure interation
UHS uniform hazard spectra
A cross-sectional area
Ab nominal area of bolt
]c[ damping matrix
D outside diameter of a CHS
Dm centreline diameter of a CHS
E Young’s modulus of elasticity
I moment of inertia
Fc elastic compressive buckling stress defined based on Fy and D/t
( ))t(F dynamic load vector
Fu ultimate tensile stress
Fy yield tensile stress
Fy,eff effective yield tensile stress calculated to meet Class 3 D/t limits
g acceleration due to gravity, 9.81m/s2
h height above base
H hub height
hf height of stiffening flange from base of tower
]k[ stiffness matrix
t thickness
tf thickness of stiffening flange
Ti period of mode i
Lr length of member having refined finite element size
]m[ mass matrix
LIST OF SYMBOLS AND ABBREVIATIONS
SEISMIC ANALYSIS OF WIND TURBINE TOWERS IN THE CANADIAN ENVIRONMENT - xvii -
M moment
MFDS1 magnification factor at damage state 1
Mp plastic moment of a cross-section
Mu moment at ultimate capacity
My yield moment of a cross-section
n factor used in predicting scale factors that account for nonlinearity of response
P load
Pe Euler buckling load
Pu load at ultimate capacity
S elastic section modulus
SAtarg target spectral acceleration
SAsim spectral acceleration of simulated ground motion record
se element size
Tu ultimate bolt capacity
wf width of stiffening flange
)x( nodal displacement vector
)x( & nodal velocity vector
)x( && nodal acceleration vector
Z plastic section modulus
α coefficient used in Rayleigh damping
iα modal participation factor of mode i
β coefficient used in Rayleigh damping
∆ lateral deflection
∆max peak lateral deflection
∆max,avg,DS1 average peak lateral deflection for the first damage state
LIST OF SYMBOLS AND ABBREVIATIONS
SEISMIC ANALYSIS OF WIND TURBINE TOWERS IN THE CANADIAN ENVIRONMENT - xviii -
∆res residual lateral deflection
∆top lateral deflection at top of tower
ε true-strain; parameter used in slenderness limits
εnom engineering strain
εu ultimate strain at fracture
iζ modal damping ratio of mode i
θ rotation of tower as defined in Section 5.2.1.2
θmax maximum rotation of tower as defined in Section 5.2.1.2
θplan angle of tower in plan view (or top view, or x-z plane)
κ curvature
κp curvature at plastic moment: Mp/EI
µ average/mean, used in defining fragility curves
σ true-stress; standard deviation used in defining fragility curves
σnom engineering stress
σmises Von Mises stress
iϕ mode shape of mode i, normalized to mass matrix
ωi circular frequency of a mode i
SEISMIC ANALYSIS OF WIND TURBINE TOWERS IN THE CANADIAN ENVIRONMENT - 1 -
CHAPTER 1: INTRODUCTION
Wind energy has gained popularity worldwide as many countries aim to increase the production
of clean energy. As Canada follows suit, Canadian design codes are largely adopting international
standards for the design of wind turbine components. However, several gaps are evident due to
Canada’s unique environment. One such gap is the assessment of seismic risk pertaining to wind
turbine towers, as the major developments of wind turbines have been in non-seismic areas. The
seismic risk is of particular importance to owners of wind turbine developments, especially wind
turbine farms, since all the towers are identical. This means that a seismic event would affect all the
towers in the same manner – if one fails, they all fail. Such a failure would result in severe financial
losses, as well as social implications if wind energy takes over more of the energy production in
Canada.
Thus, the need for research in this area has become evident. Wind turbine towers are different
from other structures because they are characterized by a very tall and slender tubular tower. This
geometry results in a structure that cannot respond in a ductile manner, thus the wind turbine
tower’s capacity when subjected to dynamic loads must be characterized.
1.1 OVERVIEW OF THESIS
This thesis begins with a review of existing literature on wind turbine towers, specifically
pertaining to seismic provisions and behaviour under seismic loads. International design codes for
wind turbines are presented, along with Canadian design codes for steel structures that may be
applicable to wind turbine towers. Some of the current research on seismic response of wind
turbine towers is also presented, noting that none of the existing research has evaluated the seismic
event that may cause failure of a typical wind turbine tower.
Chapter 3 describes the development and validation of a finite element model and methods
employed. Most of the validation analyses are carried out on a simple tubular member of constant
cross-section. Chapter 4 provides details of the typical wind turbine tower analysed in this thesis
and describes a preliminary analysis of the tower that was carried out using pushover analysis. The
tower was then subjected to incremental dynamic analyses, based on an earthquake suite for the Los
Angeles area in California, USA. These analyses were used to derive a methodology for determining
the seismic hazard of steel wind turbine towers. Damage states of the wind turbine tower were
defined and fragility curves were created for each damage state, indicating the probability that a
CHAPTER 1: INTRODUCTION
SEISMIC ANALYSIS OF WIND TURBINE TOWERS IN THE CANADIAN ENVIRONMENT - 2 -
given intensity measure will cause exceedance of a particular damage state. Thus, a framework was
set up to assess the seismic hazard for wind turbine towers in any location.
The culmination of this project was the incremental dynamic analysis and seismic risk evaluation
at two Canadian locations. One location was in Western Canada, representing the most severe
seismic hazard in the country, and one was in Eastern Canada, representing a milder seismic hazard
but one where several wind farm developments are underway.
1.2 WIND TURBINE TYPE, COMPONENTS, AND TERMINOLOGY
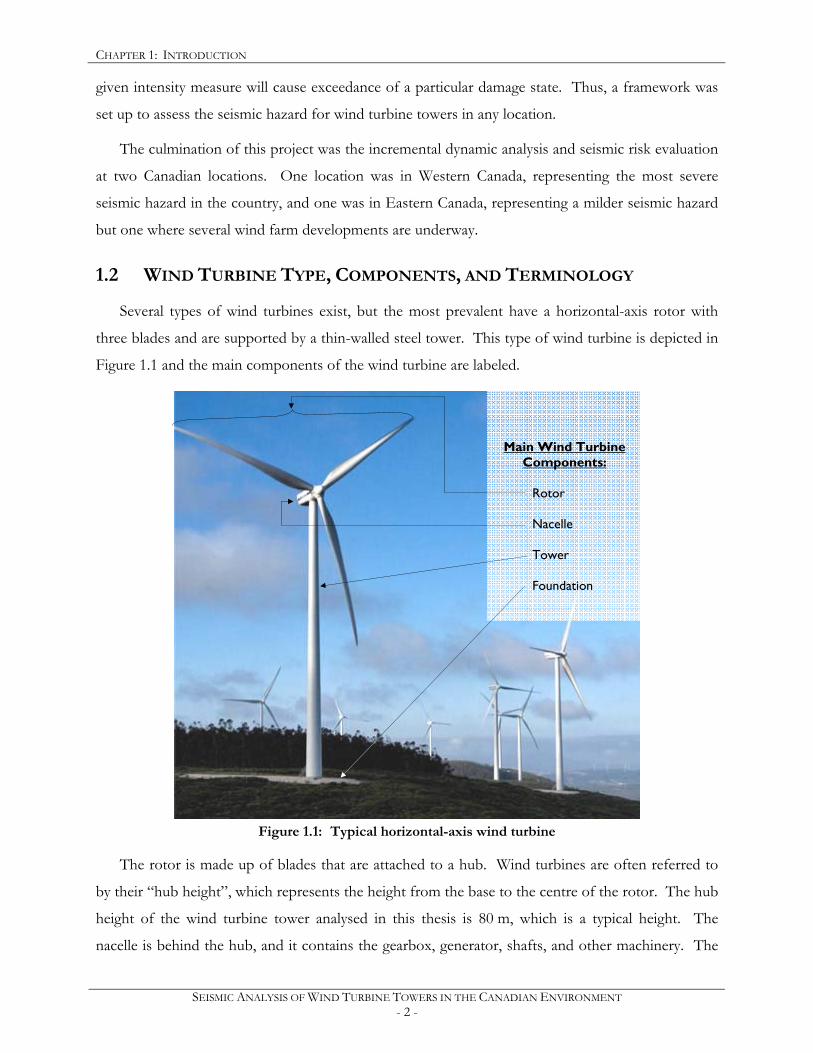
Several types of wind turbines exist, but the most prevalent have a horizontal-axis rotor with
three blades and are supported by a thin-walled steel tower. This type of wind turbine is depicted in
Figure 1.1 and the main components of the wind turbine are labeled.
Figure 1.1: Typical horizontal-axis wind turbine
The rotor is made up of blades that are attached to a hub. Wind turbines are often referred to
by their “hub height”, which represents the height from the base to the centre of the rotor. The hub
height of the wind turbine tower analysed in this thesis is 80 m, which is a typical height. The
nacelle is behind the hub, and it contains the gearbox, generator, shafts, and other machinery. The
Main Wind Turbine Components:
Rotor Nacelle Tower Foundation

CHAPTER 1: INTRODUCTION
SEISMIC ANALYSIS OF WIND TURBINE TOWERS IN THE CANADIAN ENVIRONMENT - 3 -
tower is made of a thin-walled tubular steel monopole and the foundation for onshore wind turbines
is typically an octagonal reinforced concrete slab. As previously mentioned, this thesis focuses on
the steel tower of the wind turbine.
SEISMIC ANALYSIS OF WIND TURBINE TOWERS IN THE CANADIAN ENVIRONMENT - 4 -
CHAPTER 2: LITERATURE REVIEW
2.1 INTERNATIONAL STANDARDS
Several standards for the design and safety requirements of wind turbines exist. The most
significant ones are discussed in this section, and particular attention is given to any seismic design
or analysis provisions.
2.1.1 INTERNATIONAL ELECTROTECHNICAL COMMISSION (IEC)
The International Electrotechnical Commission (IEC) is the leading organization that compiles
international standards for electrical technologies. The IEC documents act as a basis for national
standardization and also as a reference for international contracts. Founded in 1906, the IEC did
not become involved in the wind turbine industry until 1988, when a technical committee, TC 88,
was formed to compile guidelines for wind turbines. This technical committee has developed the
IEC 61400 series, which is comprised of 10 guidelines that cover various topics related to wind
turbine generators. The bulk of the design process for onshore wind turbines is addressed by Part 1,
“Design Requirements.”
Furthermore, the IEC specifies project and type certification schemes for wind turbines in the
IEC WT 01 document “IEC System for Conformity Testing and Certification of Wind Turbines,
Rules and Procedures.” This document refers to all of the IEC 61400 series technical standards,
while also referring to several standards from the International Organization for Standardization
(ISO) (IEC, 2001).
IEC61400-1, Wind Turbines – Part 1: Design Requirements
This part of IEC61400 specifies minimum design requirements to assure the engineering
integrity of wind turbines (IEC, 2005). Wind turbine classes are defined based on the reference
wind speed and the turbulence intensity that the wind turbine is expected to experience. The primary
consideration is wind loading, for which several wind conditions are described. Other
environmental conditions are also specified, wherein earthquakes are considered as one of the
“extreme other environmental conditions” (IEC, 2005). The standard wind turbine classes have no
minimum earthquake requirements, but assessment of earthquake conditions is outlined in Clause
11.6. Seismic analysis may be required depending on site-specific conditions, and earthquake
assessment is not required in locations that are excluded by the local seismic codes due to weak
seismic action. In locations where seismicity may be critical, the seismic loading must be combined
CHAPTER 2: LITERATURE REVIEW
SEISMIC ANALYSIS OF WIND TURBINE TOWERS IN THE CANADIAN ENVIRONMENT - 5 -
with a specified operational loading that occurs frequently during the turbine’s lifetime and that is
considered to be significant enough (IEC, 2005).
IEC 61400 specifies that the seismic loading be based on the ground acceleration for a 475-year
recurrence period and that response spectrum requirements be defined by the local building codes.
The evaluation of the seismic loads may be carried out either in the frequency-domain or in the
time-domain. Furthermore, a simplified conservative approach to calculate the seismic loads is
provided in Annex C, but this approach is only recommended if the tower is the only part of the
wind turbine that will experience significant loading due to seismic action (IEC, 2005).
2.1.2 GERMANISCHER LLOYD (GL)
Germanischer Lloyd (GL) is a certification organization based in Germany. They use their own
guidelines, as discussed below, in addition to the IEC standards and the German Institute for
Standardization (DIN) standards to certify wind turbines and their components. Their services are
offered worldwide.
GL Wind 2003, IV – Part 1, Guideline for the Certification of Wind Turbine Towers
This guideline is used in the design and certification of wind turbines. It is largely similar to
IEC61400-1, but it also describes the design process for each component of the wind turbine
separately. This guideline outlines the national requirements of several countries: Germany,
Denmark, France, the Netherlands, and India (GL, 2003).
The earthquake requirements in this guideline are very similar to those of IEC 61400-1.
Earthquakes are included in the list of design load cases, with a few minimum load cases specified.
If there are no local regulations regarding earthquake analysis, designers are referred to Eurocode 8
or the earthquake chapter in the American Petroleum Institute (API) recommended practice
document RP 2A (GL, 2003). Similarly to IEC 61400-1, the analysis may be either carried out in the
frequency-domain or the time-domain. The minimum number of modes that must be considered is
three. For analysis carried out in the time-domain, a minimum number of six simulations must be
performed per load case.
2.1.3 DET NORSKE VERITAS (DNV)
Det Norske Veritas (DNV) is an independent foundation that was established in Norway, but is
now considered an international body. DNV works with the IEC and other European standards
organizations to provide project certification, type certification, and risk management for the wind
CHAPTER 2: LITERATURE REVIEW
SEISMIC ANALYSIS OF WIND TURBINE TOWERS IN THE CANADIAN ENVIRONMENT - 6 -
turbine industry. These certification services are based on IEC WT 01. Aside from its involvement
with the IEC, the DNV develops its own standards, which are used to provide a link between
standards for wind turbines, standards for offshore structures, and several other building codes.
Several documents have been published by the DNV. The one that is most comprehensive for
onshore wind turbines is a guideline written by the DNV and Risø National Laboratory in Denmark,
“Guidelines for Design of Wind Turbines” (DNV and Risø, 2002). The DNV also publishes
standards, recommended practice documents, and classification notes. The DNV documents that
may be helpful in wind turbine tower design include:
• DNV-OS-J101, Design of Offshore Wind Turbine Structures
• DNV-OS-J102, Design and Manufacture of Wind Turbine Blades
• DNV-OS-C101, Design of Offshore Wind Turbine Structures, General (LFRD Method)
• DNV-OS-C201, Structural Design of Offshore Units (WSD Method)
• DNV-RP-C201, Bucking Strength of Plated Structures
• DNV-RP-C202, Bucking Strength of Shells
• DNV-RP-C203, Fatigue Design of Offshore Steel Structures
DNV/Risø, Guidelines for Design of Wind Turbines
These guidelines were created through the cooperation of DNV and Risø National Laboratory
to provide a unified basis for the design of wind turbines. The book provides fairly detailed
guidance on all technical items that need to be covered. It is mostly based on meeting the
requirements of the IEC, and also some Danish, Dutch, and German codes (DNV and Risø, 2002).
The earthquake requirements discussed in these guidelines are very similar to those from the
IEC. Pseudo response spectra are suggested as the method of determining the earthquake loads.
Although accelerations in one vertical and two horizontal directions generally need to be analysed,
the guideline suggests some simplifying assumptions. Since the vertical acceleration is not expected
to create much of a dynamic response, the tower may be analysed using the load created by the
maximum vertical acceleration to determine if buckling will be critical. Furthermore, the two
horizontal directions can be simplified to one horizontal direction, because the dynamic system is
fairly symmetrical. A simple model of the wind turbine is suggested as a vertical rod with a
concentrated mass on top. The mass consists of the nacelle and rotor mass and ¼ of the tower
mass (DNV and Risø, 2002). This simplified analysis could be used as a preliminary analysis for
CHAPTER 2: LITERATURE REVIEW
SEISMIC ANALYSIS OF WIND TURBINE TOWERS IN THE CANADIAN ENVIRONMENT - 7 -
designers to determine if earthquake loading might be critical and thus if a more detailed analysis is
necessary.
2.1.4 OTHER EUROPEAN STANDARDS
Other European standards have been fairly harmonized with the IEC codes and thus further
discussion of these is unnecessary.
2.2 CANADIAN STANDARDS
As the number of wind turbines being constructed in Canada increases, there has been much
discussion regarding which codes are applicable to the design of Canadian wind turbine towers.
Hatch Acres (2006) carried out a code review and gap analysis for wind turbines, assessing several
aspects of design of international and Canadian codes. The seismic provisions of relevant Canadian
design codes are discussed in this section.
2.2.1 CAN/CSA-C61400-1:08, WIND TURBINES – PART 1: DESIGN REQUIREMENTS
This standard is almost identical to the IEC standard of the same name, with a few Canadian
deviations. It was adopted by the Canadian Standards Association (CSA) in March 2008.
Furthermore, it replaces the 1987 standard, CAN/CSA-F416:87, Wind Energy Conversion Systems
(WECS) – Safety, Design, and Operation Criteria.
Canadian Modifications to IEC61400-1
The CSA-C61400-1 has introduced a few changes to make the IEC61400-1 suitable for Canada.
The main changes are due to the external conditions that the wind turbine will experience. More
severe icing and temperature conditions are acknowledged. The CSA has added several notes to the
earthquake-related clauses of the IEC, instructing designers how to obtain seismic loads, design
spectral accelerations, and seismic design data (CSA, 2008). Additionally, the National Building
Code of Canada (NBCC) is referenced in several instances, one of which is for the determination of
the seismic loads.
The CSA acknowledges that the NBCC does not address earthquake forces acting vertically, and
identifies this as a problem because wind turbines may have vibration modes with significant mass
participation factors in the vertical directions. However, the vertical component of a seismic event
is most likely not significant, but is investigated and discussed in Section 5.3.4. Furthermore, there is
a discrepancy between the recurrence period of the seismic event to be used in design. The
CHAPTER 2: LITERATURE REVIEW
SEISMIC ANALYSIS OF WIND TURBINE TOWERS IN THE CANADIAN ENVIRONMENT - 8 -
IEC61400-1, and thus the new CSA-C61400-1, suggests a 475-year recurrence period, whereas the
NBCC requires a 2500-year return period.
2.2.2 CAN/CSA S37-01, ANTENNAS, TOWERS, AND ANTENNA-SUPPORTING
STRUCTURES
This standard applies to structural antennas and towers. It does have a few requirements
regarding the effects of earthquakes and the dynamic effects of wind, but this code’s applicability to
this thesis is mostly related to determining the resistance of the tower (CSA, 2001).
2.2.3 CAN/CSA S473-04, STEEL (FIXED OFFSHORE) STRUCTURES
This is a standard that specifies the requirements for the design and fabrication of fixed steel
offshore structures, but is in the process of being replaced by an adopted ISO standard (CSA,
2009a). It acknowledges that supplementary requirements may be necessary for unusual structures,
which would be the case for wind turbine towers. It is more applicable to offshore wind turbines,
although some design information is applicable to onshore wind turbine towers as well, such as the
resistance of large, fabricated slender cross-section tubes under compression and bending (CSA,
2004). It also provides significant information about fatigue details relating to tubular joints and
various connection details.
2.2.4 CAN/CSA S16-09, DESIGN OF STEEL STRUCTURES
This standard provides rules and requirements for the design, fabrication, and erection of steel
structures based on limit states design. It specifically defines “steel structures” as structural
members and frames, and it is apparent that it is principally intended for buildings (CSA, 2009b).
Although this standard is frequently referenced by other CSA Structural Standards, it is not very
useful for the design and analysis of wind turbine structures. The one area where it may be useful is
for fatigue design, as it provides information regarding several fatigue details that are present in wind
turbine towers.
2.3 BOOK PUBLICATIONS
In recent years, several books about wind turbines have been published, most of which are very
detailed and valuable to designers of wind turbines. However, most also have little or no mention of
the effects of earthquakes on wind turbines. A few books of note are listed here:
• Wind Energy Handbook (2001), by T. Burton, D. Sharpe, N. Jenkins, E. Bossanyi
CHAPTER 2: LITERATURE REVIEW
SEISMIC ANALYSIS OF WIND TURBINE TOWERS IN THE CANADIAN ENVIRONMENT - 9 -
• Wind Energy Explained – Theory, Design and Application (2002), by .J.F. Manwell, J.G.
McGowan, A.L. Rogers
• Wind Turbines: Fundamentals, Technologies, Application, Economics (2006), by Erich Hau
• Aerodynamics of Wind Turbines (2000), by M.O.L. Hansen
2.4 CURRENT RESEARCH ON WIND TURBINE TOWERS
The majority of recent publications on wind turbine towers originates from universities and
research centres, with few contributions from the private sector. Some of this research that is
related to seismic behaviour of wind turbines is presented in this section.
2.4.1 COMPARISON OF SEISMIC ANALYSIS METHODS: FREQUENCY-DOMAIN VS. TIME-DOMAIN
Frequency-domain methods are typically favoured in design due to their ease of implementation.
Time-domain analyses have a higher computational demand and are often used in analysis of
structures, rather than in their design. Time-domain analyses are increasingly being used in the wind
turbine industry.
Currently, several wind turbine simulation software packages exist. The purpose of such
software is to analyse wind turbines under several loading cases to determine the design loads. They
range from basic to very sophisticated and are generally proprietary to companies, which carry out
the analyses and only provide the results. The more sophisticated packages can create a full
aeroelastic model of the wind turbine, including the blades, and subject it to turbulent wind loading.
The newest addition to most of these packages is wave and current loading, as offshore turbines are
becoming commonplace (van Wingerde et al., 2006; Lüddecke et al., 2008). A few companies also
recognize the need to incorporate earthquake loading into these software packages, as more wind
turbines are being erected on seismically active sites. Garrad Hassan in the UK is one such
company. Their software, GH Bladed, can apply an accelerogram (real or synthesized) to a model
along with other normal loading (Witcher, 2005). The ground motion is applied in any direction and
a secondary ground motion may be applied at 90° to the first. The structural dynamics of the wind
turbine are represented using a limited-degree-of-freedom modal model, and all forces and moments
at specified locations are output, as well as torques at critical locations (Witcher, 2005).
This time-domain method was validated against the frequency-domain, which is more
commonly employed. Witcher concluded that both methods were adequate, but discrepancies arose
CHAPTER 2: LITERATURE REVIEW
SEISMIC ANALYSIS OF WIND TURBINE TOWERS IN THE CANADIAN ENVIRONMENT - 10 -
when the system damping was not close to that of the design spectra, which is typically 5%. For
operating wind turbines, the aerodynamic damping is close to 5% (Witcher, 2005), and thus both
methods yield very similar results. For turbines that are not operating, the aerodynamic damping is
much lower. Most building codes do not provide a method to correct the level of damping when
using the frequency-domain method, so the time-domain method provides an advantage over the
frequency method because the correct level of damping can be applied (Witcher, 2005). Therefore,
Witcher (2005) concluded that conducting seismic analysis in the time-domain is acceptable, and in
fact preferred, because the correct aeroelastic interaction can be modelled.
A similar investigation was carried out by Windrad Engineering GmbH and Nordex Energy
GmbH (Ritschel et al., 2003). The method of modal approximation was compared with a time-
domain approach using the simulation program Flex5. The main reason for investigating this
comparison is because they believe modal approximation is not an adequate method for obtaining
design loads, especially the rotor and nacelle loads, as modal approximation ignores any action above
the tower top (Ritschel et al., 2003). Thus, any system modes which might take into account the
interaction of the tower and the blades are not considered. The results of this investigation suggest
that the modal approach is very conservative for the lower part of the tower (Ritschel et al., 2003).
Regarding the machine loads on the nacelle and the rotor, the time-domain method predicts high
vertical forces, which are not predicted by the modal approximation method because the vertical
component is ignored (Ritschel et al., 2003).
Both the time-domain method and the frequency-domain method were deemed to be adequate.
In this thesis, the time-domain method is used as the intent is to obtain information about the
response of the wind turbine tower, rather than to obtain design loads.
2.4.2 SHELL BUCKLING
Local bucking in the shell of the wind turbine tower using static, buckling, and seismic analyses
was investigated by Bazeos et al. (2002). They also assessed the influence of the door opening on
the overall behaviour of the tower. Furthermore, the effects of soil-structure interaction were also
investigated and are discussed in the next section.
Bazeos et al. (2002) found that the static analysis yielded positive results. The wind turbine was
subjected to pseudo-aerodynamic loads corresponding to survival conditions along with gravity load,
and the maximum stresses were found to be well below yield (Bazeos et al., 2002). The static
analysis also showed acceptable stress values throughout the tower and a maximum horizontal
deflection less than 1% of the total height, which is acceptable. The buckling analysis predicted local
CHAPTER 2: LITERATURE REVIEW
SEISMIC ANALYSIS OF WIND TURBINE TOWERS IN THE CANADIAN ENVIRONMENT - 11 -
buckling would occur at 1.33 times the static load (Bazeos et al., 2002). Lastly, seismic analyses were
carried out and the first mode was found to dominate the response to the seismic excitation, as was
expected. The maximum stresses were found to be very low for this analysis as well. Thus, Bazeos
et al. (2002) concluded that seismic analysis does not produce a critical response for this type of
structure. However, the magnitude of the design earthquake was not specified, making it difficult to
assess the results of these studies.
Shell buckling was also investigated by Lavassas et al. (2003), where the design of a prototype
steel wind turbine tower was evaluated. Shell buckling was not assessed under seismic loading. It
was concluded that assessment of shell buckling according to design codes is somewhat ambiguous.
Additionally, a simplified linear model was deemed insufficient because the stress concentrations at
the base of the tower are ignored.
2.4.3 DYNAMIC SOIL-STRUCTURE INTERACTION EFFECTS
Researchers have identified the importance of analyzing the soil-structure interaction (SSI) when
assessing the seismic resistance of wind turbines. Although the wind turbine tower was identified as
the most important structural component when analyzing dynamic response (Zhao and Maisser,
2006), the interaction between the structure, the foundation, and the soil around was also considered
to be very significant (Bazeos et al., 2002; Zhao and Maisser, 2006).
Time-history analysis was used for the seismic analysis to analyse the soil-structure interaction
effects, as it is applicable to both elastic linear and non-linear analysis. A weak earthquake was used
in the analysis by Zhao and Maisser (2006). The wind speeds, also as a time-history, were used to
determine the thrust and the torque on the tower top. For these loads, Zhao and Maisser (2006)
found that the peak tower displacement was dominated by the wind forces. The inclusion of SSI
resulted in reduced fundamental frequencies of the wind turbine. Thus, it was concluded that soil-
structure interaction has a large influence on the dynamic characteristics of the wind turbine tower,
particularly in areas with flexible soil, and that this interaction should be included in dynamic analysis
of wind turbines (Zhao and Maisser, 2006). This conclusion was also reached by Bazeos et al.
(2002).
Design codes generally specify response spectra depending on the soil characteristics. Thus it
may not be necessary to include SSI effects if seismic analysis is carried out in the frequency-domain.
For time-domain analyses, the soil-structure interaction should be assessed if the wind turbine
structure is erected on flexible soil.

CHAPTER 2: LITERATURE REVIEW
SEISMIC ANALYSIS OF WIND TURBINE TOWERS IN THE CANADIAN ENVIRONMENT - 12 -
2.5 SUMMARY
The existing codes offer some guidelines for seismic analysis of wind turbine towers, but
generally more guidance is needed, especially for areas of high seismicity. Some private companies
have identified this need and are incorporating seismic analysis in their wind turbine analysis
software. However, most existing research is concerned with verifying that a given wind turbine can
sustain low or moderate seismic loadings without assessing the limits of the wind turbine tower’s
seismic capabilities. Therefore, this thesis will focus on characterizing these limits for Canadian
locations by employing the finite element method (FEM).
The following chapter describes an essential part of any project that employs FEM: the
development and validation of the finite element model.
SEISMIC ANALYSIS OF WIND TURBINE TOWERS IN THE CANADIAN ENVIRONMENT - 13 -
CHAPTER 3: FINITE ELEMENT MODEL DEVELOPMENT AND
VALIDATION
Numerical models are useful for predicting the behaviour of complex structures or structures
with unusual loading, for which analytical methods are difficult to employ, and can be used to assess
the seismic capabilities of such structures. However, any numerical model must first be deemed
reliable. Material models, element formulations, and failure mechanisms must be verified and shown
to represent realistic behaviours.
Numerical models can be validated using a variety of methods. If experimental results are
available, those results are often used to calibrate the model. Otherwise, the validation must rely on
comparison with values calculated from various theoretical formulations. It must also be shown that
the post-peak behaviour is consistent with experimental results and that the expected failure
mechanism can be captured.
When dealing with wind turbines, very few experimental tests have been performed on the
supporting structure. The validation of any numerical study must hence be segmented, yet must
demonstrate accuracy and reliability.
3.1 GEOMETRY OF WIND TURBINE TOWERS
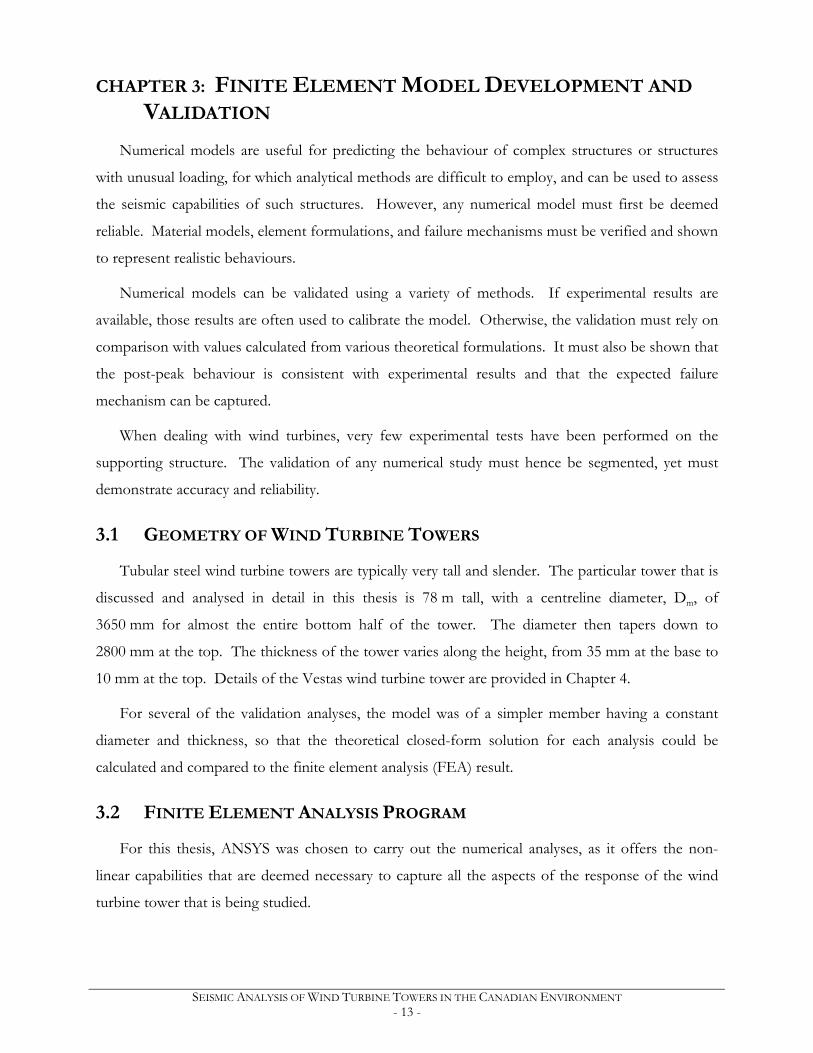
Tubular steel wind turbine towers are typically very tall and slender. The particular tower that is
discussed and analysed in detail in this thesis is 78 m tall, with a centreline diameter, Dm, of
3650 mm for almost the entire bottom half of the tower. The diameter then tapers down to
2800 mm at the top. The thickness of the tower varies along the height, from 35 mm at the base to
10 mm at the top. Details of the Vestas wind turbine tower are provided in Chapter 4.
For several of the validation analyses, the model was of a simpler member having a constant
diameter and thickness, so that the theoretical closed-form solution for each analysis could be
calculated and compared to the finite element analysis (FEA) result.
3.2 FINITE ELEMENT ANALYSIS PROGRAM
For this thesis, ANSYS was chosen to carry out the numerical analyses, as it offers the non-
linear capabilities that are deemed necessary to capture all the aspects of the response of the wind
turbine tower that is being studied.
CHAPTER 3: FINITE ELEMENT MODEL DEVELOPMENT AND VALIDATION
SEISMIC ANALYSIS OF WIND TURBINE TOWERS IN THE CANADIAN ENVIRONMENT - 14 -
3.3 MATERIAL PROPERTIES
Typical steel wind turbine towers are made from flat steel plates which are rolled into cylindrical
or conical pieces, and then welded longitudinally (Danish Wind Industry Association, 2003). The
cylindrical or conical pieces are then welded together circumferentially into sections of 20 to 30 m in
height, generally a length that is easily transportable. Each of these sections has flanges at the ends,
and the sections are bolted together on site as the tower is erected. Due to this fabrication process,
the material properties of the tower are similar to cold-formed tubular members. The stress-strain
curve of the material shows a low proportional limit, followed by gradual yielding, no clear yield
plateau, and significant strain hardening.
The material properties used for the analyses in this thesis come from the average of several
coupon tests of cold-formed circular HSS sections performed by Voth (2010). No material data
from an actual wind turbine tower was available. In the ANSYS analyses herein, the true-stress (σ)
vs. true-strain (ε) curve has been employed. This was obtained by modifying the engineering stress-
strain curve (σnom, εnom), as obtained from a tensile coupon test, in the following manner:
)1ln( nomε+=ε (Equation 3.1)
)1( nomnom ε+σ=σ (Equation 3.2)
These equations are only valid until necking of the coupon test occurs. After that point, the
stress distribution is no longer a simple uniaxial case, but a complex triaxial case (Aronofsky, 1951).
The method used by Voth (2010) to determine the post-necking material behaviour was developed
by Matic (1985). It was refined by Martinez-Saucedo et al. (2006), who suggested that the Matic
material properties should only be used in the post-necked region of the stress-strain curve. The
finite element (FE) material properties were thus determined through an iterative process, wherein
several FE analyses of a coupon with the Matic material properties were carried out and compared
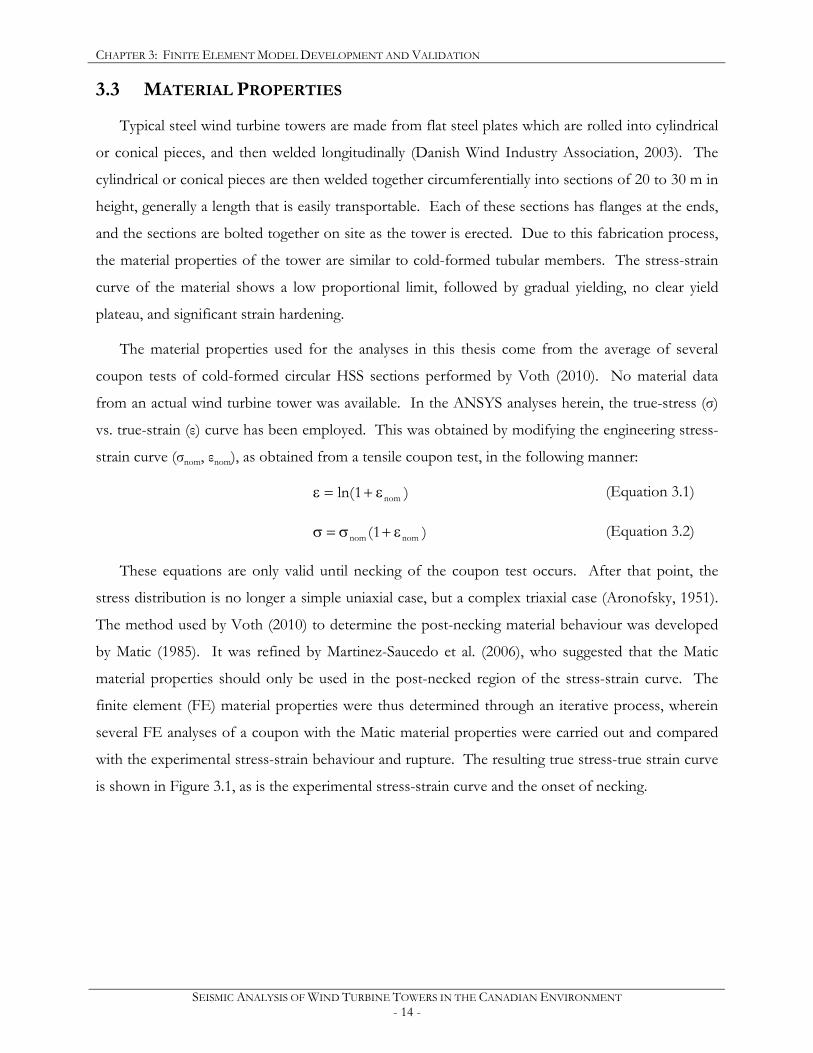
with the experimental stress-strain behaviour and rupture. The resulting true stress-true strain curve
is shown in Figure 3.1, as is the experimental stress-strain curve and the onset of necking.
CHAPTER 3: FINITE ELEMENT MODEL DEVELOPMENT AND VALIDATION
SEISMIC ANALYSIS OF WIND TURBINE TOWERS IN THE CANADIAN ENVIRONMENT - 15 -
0
100
200
300
400
500
600
700
800
0 0.1 0.2 0.3 0.4 0.5Strain (mm/mm)
Stress (MPa)
True stress-strain curve
Engineering stress-strain curve
Figure 3.1: Engineering and true stress-strain curve from Voth (2010) for cold-formed circular HSS
For the subsequent analyses, three sets of material properties were used, shown in Figure 3.2.
The first, gradual yielding, is the aforementioned true stress-strain curve from Voth (2010). The
second, having a yield plateau, was adapted from Voth (2010) by modifications as shown in Figure
3.2. The third curve is bilinear, was obtained from Elchalakani et al. (2002), and was only employed
in a few analyses that were geometrically comparable to an experimental specimen.
0
100
200
300
400
500
600
700
800
0 0.05 0.1 0.15 0.2 0.25 0.3 0.35 0.4Strain (mm/mm)
Stress (MPa)
Gradual Yielding (from Voth, 2010)
Stress-Strain Curve with Yield PlateauBilinear (from Elchalakani et al., 2002)
Figure 3.2: Stress-strain curves used in subsequent analyses
E = 211449 MPa Fy = 389 MPa Fu = 833 MPa εu = 1.1
E = 190900 MPa Fy = 408 MPa Fu = 510 MPa εu = 0.27
Yield plateau: 0.02 mm/mm
0
100
200
300
400
500
0 0.002 0.004 0.006 0.008
E
1
after necking
CHAPTER 3: FINITE ELEMENT MODEL DEVELOPMENT AND VALIDATION
SEISMIC ANALYSIS OF WIND TURBINE TOWERS IN THE CANADIAN ENVIRONMENT - 16 -
3.4 CHOICE OF ELEMENTS
The elements selected for this analysis are 8-noded shell elements and 20-noded solid elements,
which are further described in the following subsections. Furthermore, mass elements and rigid link
elements were employed, and it was verified that these elements exhibit the desired behaviour.
3.4.1 SHELL ELEMENTS
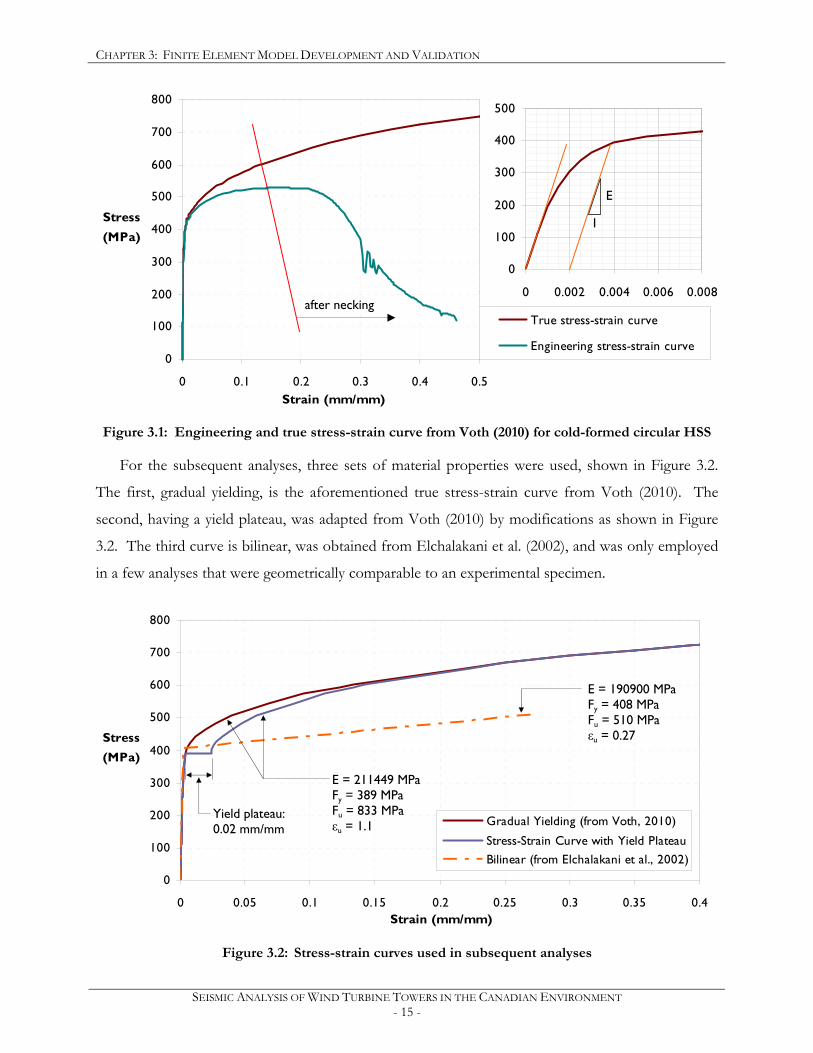
The wall of the tower was represented with 8-noded shell elements (SHELL281 in ANSYS), as it
was deemed that this element could likely reflect the behaviour of the tower, essentially a thin
conical shell structure. Due to the large diameter-to-thickness ratio along the tower height, the
tower wall acts fairly independently from the rest of the tower and more like a thin shell, with
potential for local buckling. This element has six degrees-of-freedom (DOFs) at each node –
translations in the x, y, and z directions, and rotations about the x, y, and z axes. A schematic of the
element and its DOFs is shown in Figure 3.3. The deformation shapes are quadratic, making this
shell element well-suited to model curved shells (ANSYS, 2007). The out-of-plane stress varies
linearly through the thickness and the transverse shear stresses are assumed to be constant through
the thickness.
Figure 3.3: Geometry of shell element used to represent tower walls (ANSYS, 2007)
Another element was also investigated (SHELL93 in ANSYS). Its geometry is identical to that
of the chosen shell element, but has fewer capabilities, albeit still adequate for modelling a tubular
tower. However, the SHELL281 element was chosen, as it has nonlinear stabilization properties,
which improves the stability of local buckling during static analyses (ANSYS, 2007). This element
was found to be more stable during transient analyses as well.
3.4.1.1 CLASSICAL PLATE THEORY
The elastic behaviour of thin plates is described by classical plate theory, also known as
Kirchhoff’s plate theory. This theory has several assumptions and limitations (Szilard, 2004).
I M
P
O
L
K N
J
Z
Y X
zo yo
xo
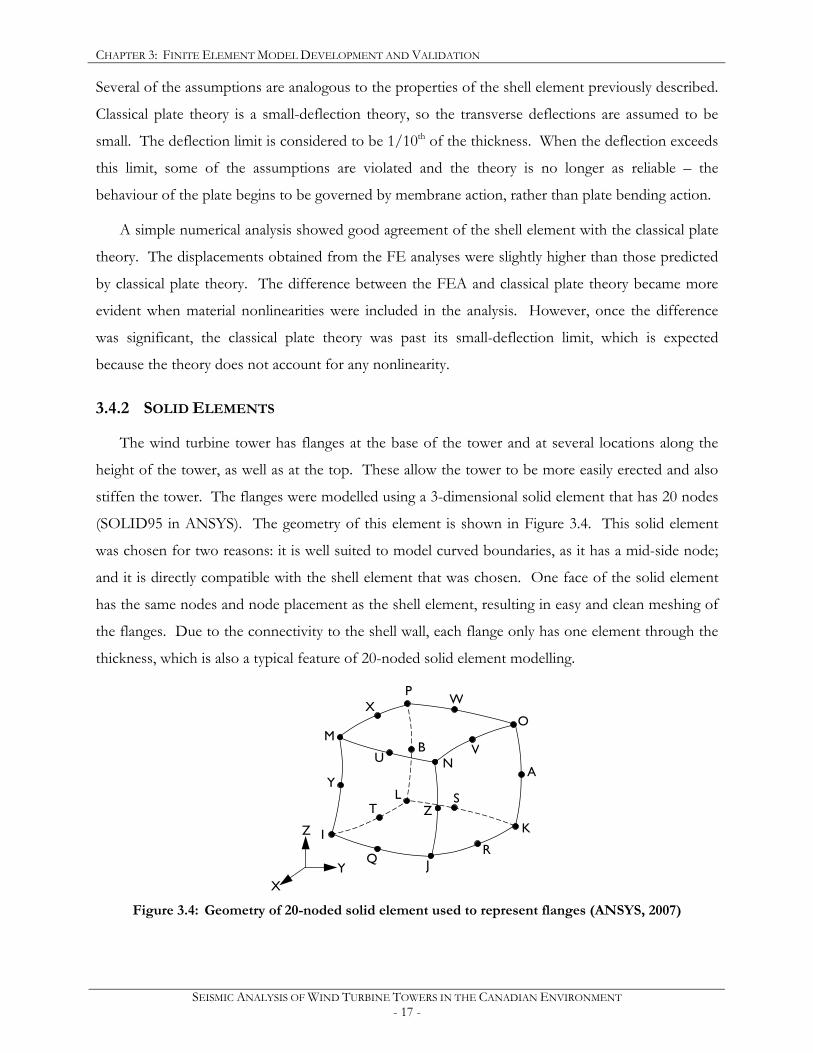
CHAPTER 3: FINITE ELEMENT MODEL DEVELOPMENT AND VALIDATION
SEISMIC ANALYSIS OF WIND TURBINE TOWERS IN THE CANADIAN ENVIRONMENT - 17 -
Several of the assumptions are analogous to the properties of the shell element previously described.
Classical plate theory is a small-deflection theory, so the transverse deflections are assumed to be
small. The deflection limit is considered to be 1/10th of the thickness. When the deflection exceeds
this limit, some of the assumptions are violated and the theory is no longer as reliable – the
behaviour of the plate begins to be governed by membrane action, rather than plate bending action.
A simple numerical analysis showed good agreement of the shell element with the classical plate
theory. The displacements obtained from the FE analyses were slightly higher than those predicted
by classical plate theory. The difference between the FEA and classical plate theory became more
evident when material nonlinearities were included in the analysis. However, once the difference
was significant, the classical plate theory was past its small-deflection limit, which is expected
because the theory does not account for any nonlinearity.
3.4.2 SOLID ELEMENTS
The wind turbine tower has flanges at the base of the tower and at several locations along the
height of the tower, as well as at the top. These allow the tower to be more easily erected and also
stiffen the tower. The flanges were modelled using a 3-dimensional solid element that has 20 nodes
(SOLID95 in ANSYS). The geometry of this element is shown in Figure 3.4. This solid element
was chosen for two reasons: it is well suited to model curved boundaries, as it has a mid-side node;
and it is directly compatible with the shell element that was chosen. One face of the solid element
has the same nodes and node placement as the shell element, resulting in easy and clean meshing of
the flanges. Due to the connectivity to the shell wall, each flange only has one element through the
thickness, which is also a typical feature of 20-noded solid element modelling.
Figure 3.4: Geometry of 20-noded solid element used to represent flanges (ANSYS, 2007)
M
Y
Q
J
R
K
A
O
W
P X
U
B N
V
S Z
T
L
I
Z
Y X
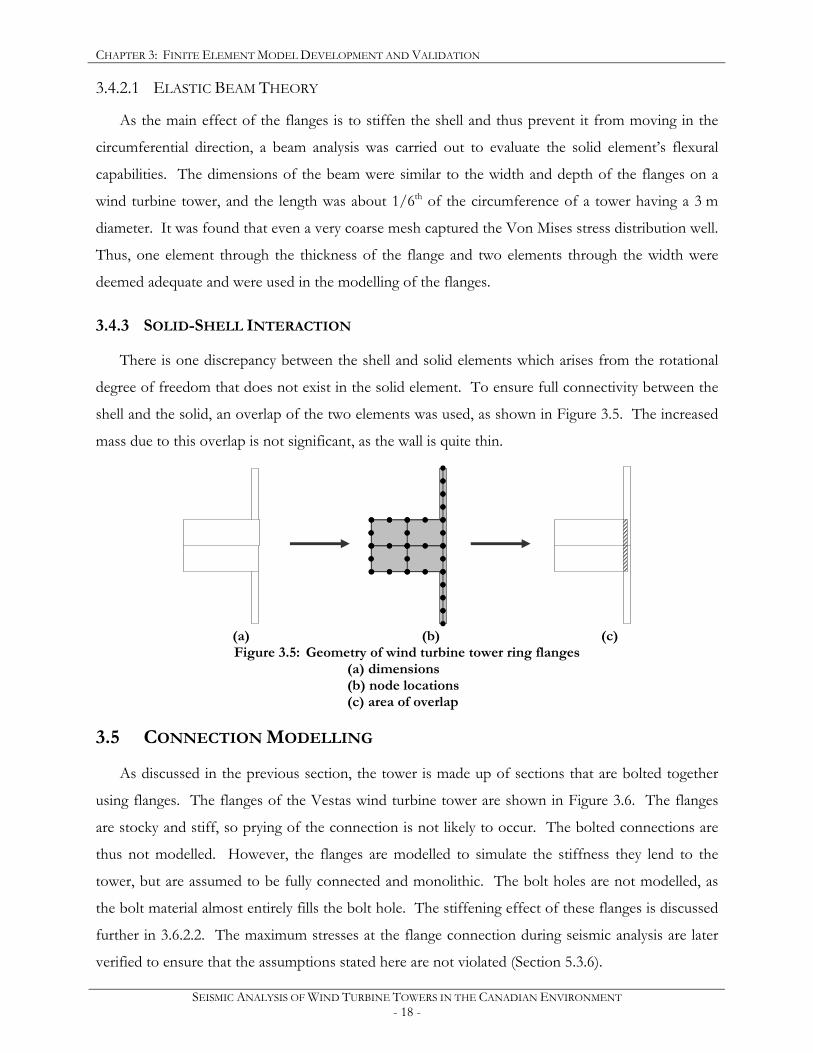
CHAPTER 3: FINITE ELEMENT MODEL DEVELOPMENT AND VALIDATION
SEISMIC ANALYSIS OF WIND TURBINE TOWERS IN THE CANADIAN ENVIRONMENT - 18 -
3.4.2.1 ELASTIC BEAM THEORY
As the main effect of the flanges is to stiffen the shell and thus prevent it from moving in the
circumferential direction, a beam analysis was carried out to evaluate the solid element’s flexural
capabilities. The dimensions of the beam were similar to the width and depth of the flanges on a
wind turbine tower, and the length was about 1/6th of the circumference of a tower having a 3 m
diameter. It was found that even a very coarse mesh captured the Von Mises stress distribution well.
Thus, one element through the thickness of the flange and two elements through the width were
deemed adequate and were used in the modelling of the flanges.
3.4.3 SOLID-SHELL INTERACTION
There is one discrepancy between the shell and solid elements which arises from the rotational
degree of freedom that does not exist in the solid element. To ensure full connectivity between the
shell and the solid, an overlap of the two elements was used, as shown in Figure 3.5. The increased
mass due to this overlap is not significant, as the wall is quite thin.
(a) (b) (c)
Figure 3.5: Geometry of wind turbine tower ring flanges (a) dimensions (b) node locations (c) area of overlap
3.5 CONNECTION MODELLING
As discussed in the previous section, the tower is made up of sections that are bolted together
using flanges. The flanges of the Vestas wind turbine tower are shown in Figure 3.6. The flanges
are stocky and stiff, so prying of the connection is not likely to occur. The bolted connections are
thus not modelled. However, the flanges are modelled to simulate the stiffness they lend to the
tower, but are assumed to be fully connected and monolithic. The bolt holes are not modelled, as
the bolt material almost entirely fills the bolt hole. The stiffening effect of these flanges is discussed
further in 3.6.2.2. The maximum stresses at the flange connection during seismic analysis are later
verified to ensure that the assumptions stated here are not violated (Section 5.3.6).
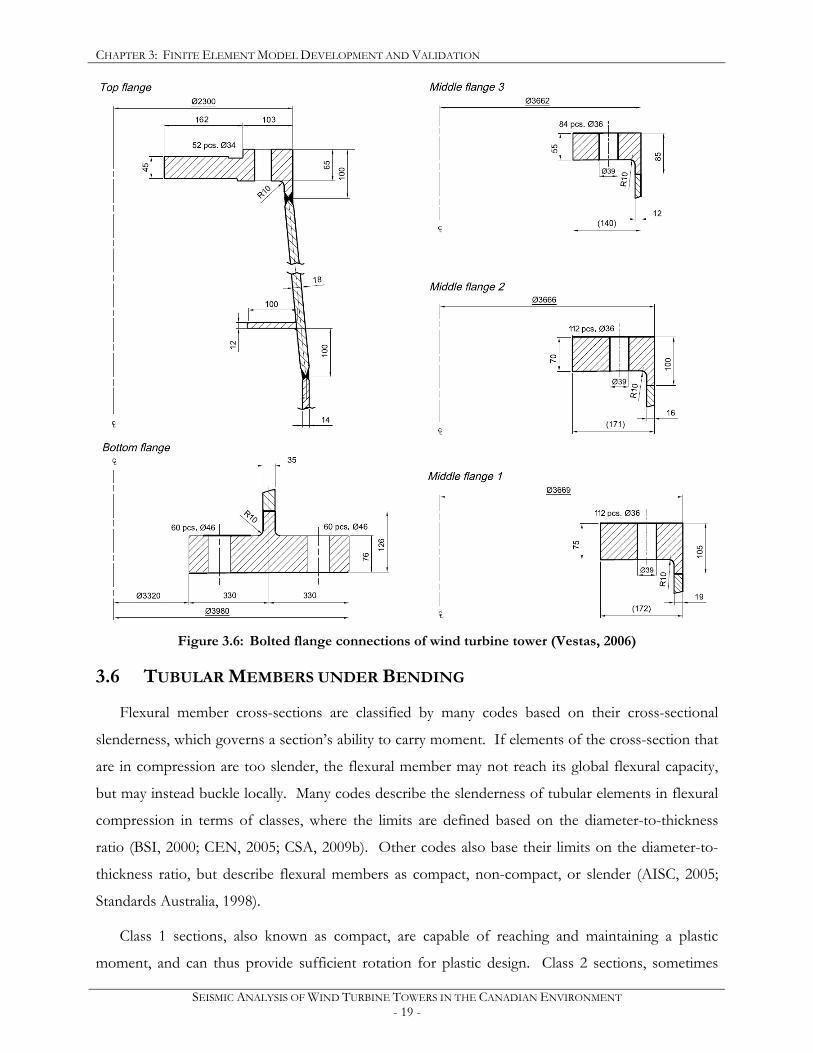
CHAPTER 3: FINITE ELEMENT MODEL DEVELOPMENT AND VALIDATION
SEISMIC ANALYSIS OF WIND TURBINE TOWERS IN THE CANADIAN ENVIRONMENT - 19 -
Figure 3.6: Bolted flange connections of wind turbine tower (Vestas, 2006)
3.6 TUBULAR MEMBERS UNDER BENDING
Flexural member cross-sections are classified by many codes based on their cross-sectional
slenderness, which governs a section’s ability to carry moment. If elements of the cross-section that
are in compression are too slender, the flexural member may not reach its global flexural capacity,
but may instead buckle locally. Many codes describe the slenderness of tubular elements in flexural
compression in terms of classes, where the limits are defined based on the diameter-to-thickness
ratio (BSI, 2000; CEN, 2005; CSA, 2009b). Other codes also base their limits on the diameter-to-
thickness ratio, but describe flexural members as compact, non-compact, or slender (AISC, 2005;
Standards Australia, 1998).
Class 1 sections, also known as compact, are capable of reaching and maintaining a plastic
moment, and can thus provide sufficient rotation for plastic design. Class 2 sections, sometimes
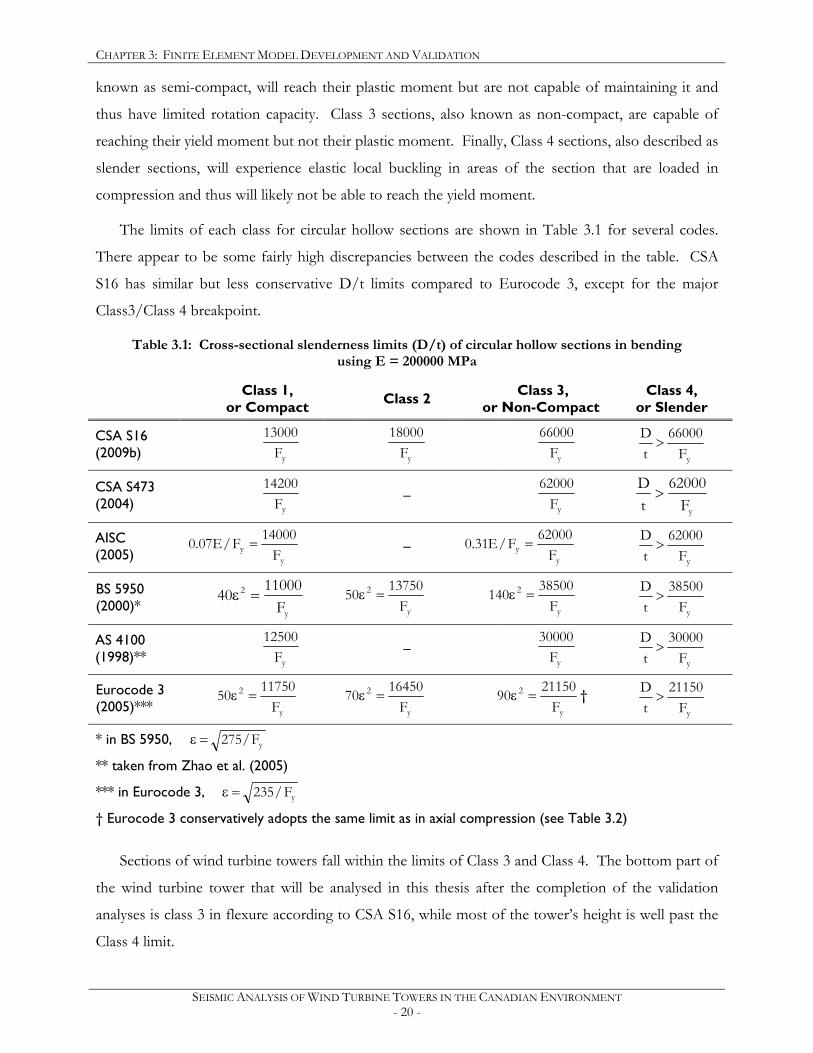
CHAPTER 3: FINITE ELEMENT MODEL DEVELOPMENT AND VALIDATION
SEISMIC ANALYSIS OF WIND TURBINE TOWERS IN THE CANADIAN ENVIRONMENT - 20 -
known as semi-compact, will reach their plastic moment but are not capable of maintaining it and
thus have limited rotation capacity. Class 3 sections, also known as non-compact, are capable of
reaching their yield moment but not their plastic moment. Finally, Class 4 sections, also described as
slender sections, will experience elastic local buckling in areas of the section that are loaded in
compression and thus will likely not be able to reach the yield moment.
The limits of each class for circular hollow sections are shown in Table 3.1 for several codes.
There appear to be some fairly high discrepancies between the codes described in the table. CSA
S16 has similar but less conservative D/t limits compared to Eurocode 3, except for the major
Class3/Class 4 breakpoint.
Table 3.1: Cross-sectional slenderness limits (D/t) of circular hollow sections in bending using E = 200000 MPa
Class 1, or Compact Class 2 Class 3,
or Non-Compact Class 4,
or Slender
CSA S16 (2009b)
yF13000
yF
18000
yF66000
yF
66000tD>
CSA S473 (2004)
yF14200
– yF
62000
yF62000
tD
>
AISC (2005) y
y F14000F/E07.0 = –
yy F
62000F/E31.0 = yF
62000tD>
BS 5950 (2000)*
y
2
F1100040 =ε
y
2
F1375050 =ε
y
2
F38500140 =ε
yF38500
tD>
AS 4100 (1998)**
yF12500
– yF
30000
yF30000
tD>
Eurocode 3 (2005)***
y
2
F1175050 =ε
y
2
F1645070 =ε
y
2
F2115090 =ε †
yF21150
tD>
* in BS 5950, yF/275=ε
** taken from Zhao et al. (2005)
*** in Eurocode 3, yF/235=ε
† Eurocode 3 conservatively adopts the same limit as in axial compression (see Table 3.2)
Sections of wind turbine towers fall within the limits of Class 3 and Class 4. The bottom part of
the wind turbine tower that will be analysed in this thesis after the completion of the validation
analyses is class 3 in flexure according to CSA S16, while most of the tower’s height is well past the
Class 4 limit.
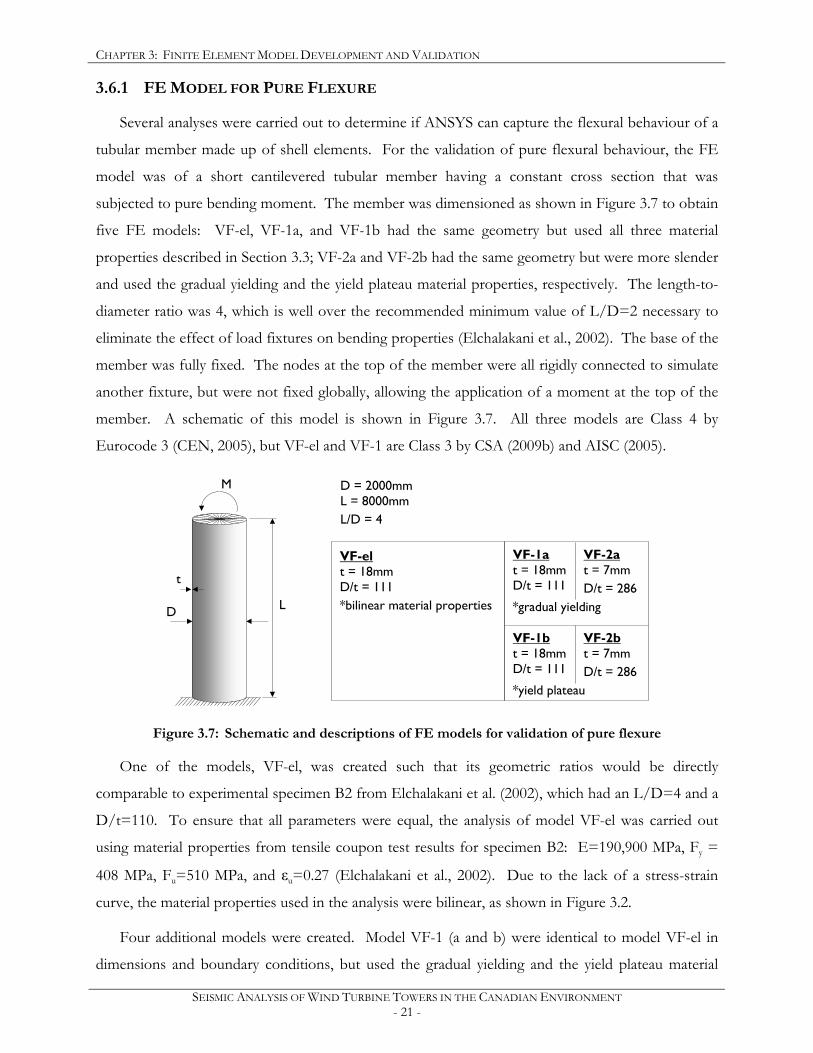
CHAPTER 3: FINITE ELEMENT MODEL DEVELOPMENT AND VALIDATION
SEISMIC ANALYSIS OF WIND TURBINE TOWERS IN THE CANADIAN ENVIRONMENT - 21 -
3.6.1 FE MODEL FOR PURE FLEXURE
Several analyses were carried out to determine if ANSYS can capture the flexural behaviour of a
tubular member made up of shell elements. For the validation of pure flexural behaviour, the FE
model was of a short cantilevered tubular member having a constant cross section that was
subjected to pure bending moment. The member was dimensioned as shown in Figure 3.7 to obtain
five FE models: VF-el, VF-1a, and VF-1b had the same geometry but used all three material
properties described in Section 3.3; VF-2a and VF-2b had the same geometry but were more slender
and used the gradual yielding and the yield plateau material properties, respectively. The length-to-
diameter ratio was 4, which is well over the recommended minimum value of L/D=2 necessary to
eliminate the effect of load fixtures on bending properties (Elchalakani et al., 2002). The base of the
member was fully fixed. The nodes at the top of the member were all rigidly connected to simulate
another fixture, but were not fixed globally, allowing the application of a moment at the top of the
member. A schematic of this model is shown in Figure 3.7. All three models are Class 4 by
Eurocode 3 (CEN, 2005), but VF-el and VF-1 are Class 3 by CSA (2009b) and AISC (2005).
Figure 3.7: Schematic and descriptions of FE models for validation of pure flexure
One of the models, VF-el, was created such that its geometric ratios would be directly
comparable to experimental specimen B2 from Elchalakani et al. (2002), which had an L/D=4 and a
D/t=110. To ensure that all parameters were equal, the analysis of model VF-el was carried out
using material properties from tensile coupon test results for specimen B2: E=190,900 MPa, Fy =
408 MPa, Fu=510 MPa, and εu=0.27 (Elchalakani et al., 2002). Due to the lack of a stress-strain
curve, the material properties used in the analysis were bilinear, as shown in Figure 3.2.
Four additional models were created. Model VF-1 (a and b) were identical to model VF-el in
dimensions and boundary conditions, but used the gradual yielding and the yield plateau material
VF-1a t = 18mm D/t = 111
*gradual yielding
VF-1b t = 18mm D/t = 111
*yield plateau
D = 2000mm L = 8000mm L/D = 4
VF-2a t = 7mm D/t = 286
VF-el t = 18mm D/t = 111 *bilinear material properties D L
t
M
VF-2b t = 7mm D/t = 286
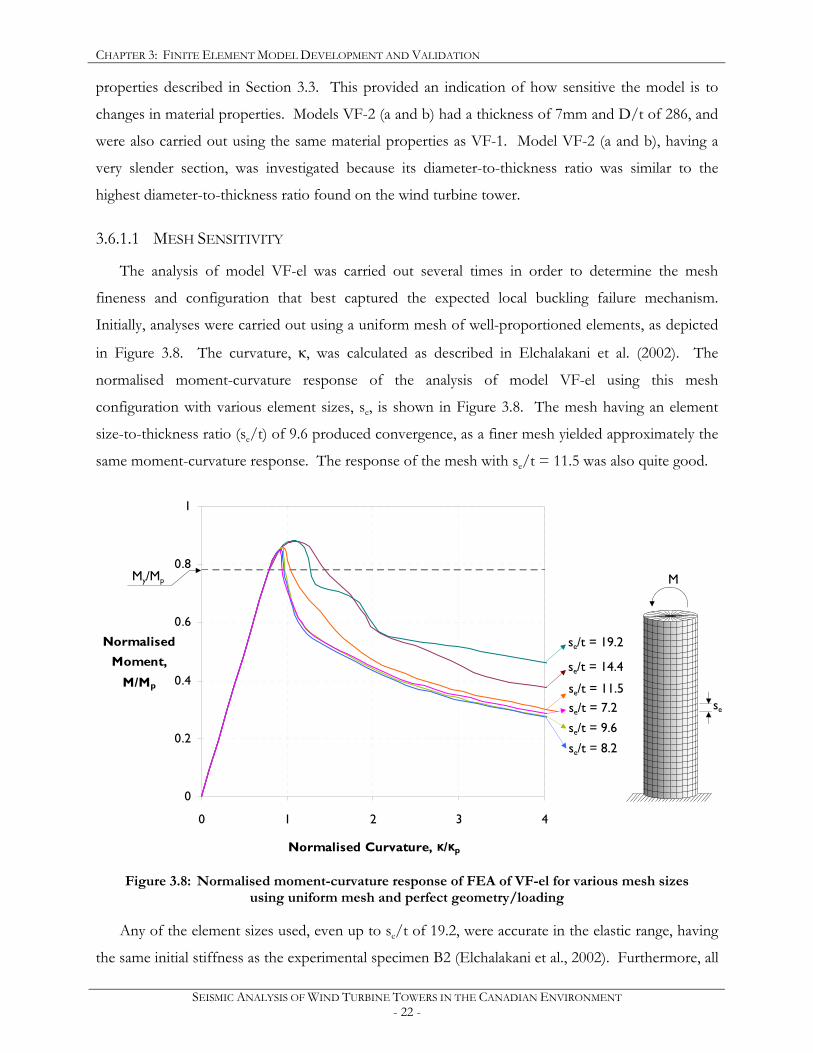
CHAPTER 3: FINITE ELEMENT MODEL DEVELOPMENT AND VALIDATION
SEISMIC ANALYSIS OF WIND TURBINE TOWERS IN THE CANADIAN ENVIRONMENT - 22 -
properties described in Section 3.3. This provided an indication of how sensitive the model is to
changes in material properties. Models VF-2 (a and b) had a thickness of 7mm and D/t of 286, and
were also carried out using the same material properties as VF-1. Model VF-2 (a and b), having a
very slender section, was investigated because its diameter-to-thickness ratio was similar to the
highest diameter-to-thickness ratio found on the wind turbine tower.
3.6.1.1 MESH SENSITIVITY
The analysis of model VF-el was carried out several times in order to determine the mesh
fineness and configuration that best captured the expected local buckling failure mechanism.
Initially, analyses were carried out using a uniform mesh of well-proportioned elements, as depicted
in Figure 3.8. The curvature, κ, was calculated as described in Elchalakani et al. (2002). The
normalised moment-curvature response of the analysis of model VF-el using this mesh
configuration with various element sizes, se, is shown in Figure 3.8. The mesh having an element
size-to-thickness ratio (se/t) of 9.6 produced convergence, as a finer mesh yielded approximately the
same moment-curvature response. The response of the mesh with se/t = 11.5 was also quite good.
0
0.2
0.4
0.6
0.8
1
0 1 2 3 4
Normalised Curvature, κ/κp
Normalised Moment,
M/Mp
Figure 3.8: Normalised moment-curvature response of FEA of VF-el for various mesh sizes
using uniform mesh and perfect geometry/loading
Any of the element sizes used, even up to se/t of 19.2, were accurate in the elastic range, having
the same initial stiffness as the experimental specimen B2 (Elchalakani et al., 2002). Furthermore, all
M
se
se/t = 19.2
se/t = 14.4
se/t = 11.5
se/t = 9.6
se/t = 8.2
se/t = 7.2
My/Mp
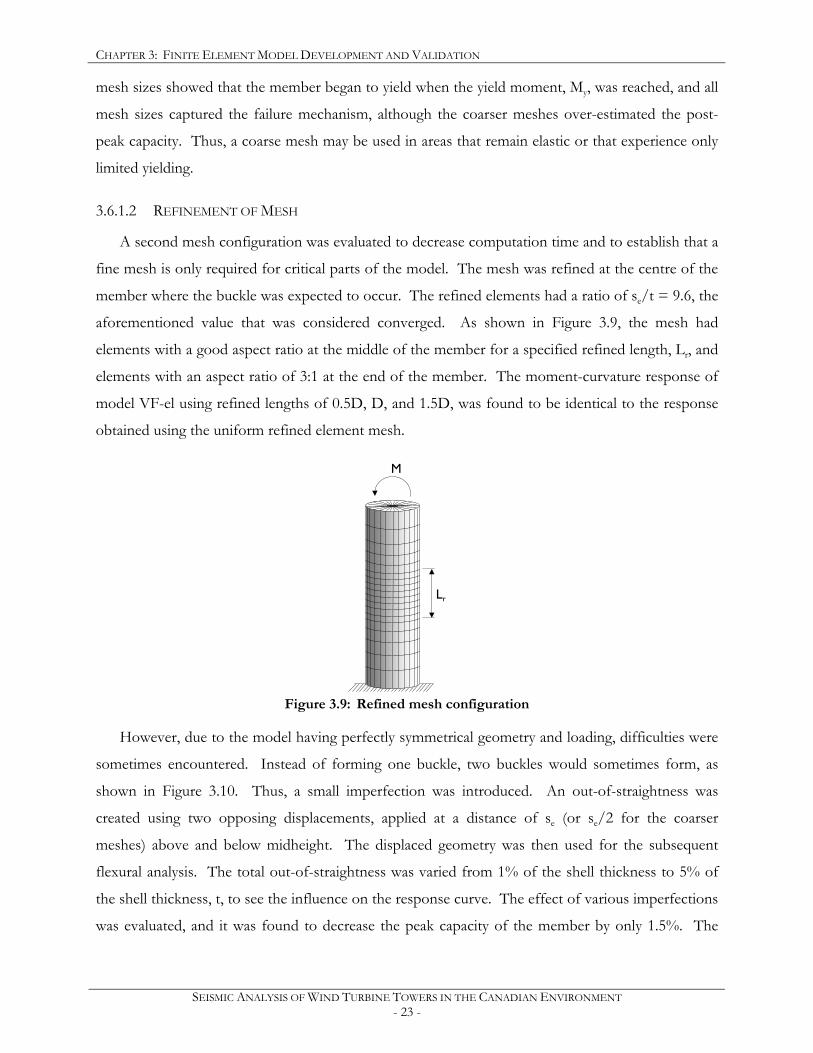
CHAPTER 3: FINITE ELEMENT MODEL DEVELOPMENT AND VALIDATION
SEISMIC ANALYSIS OF WIND TURBINE TOWERS IN THE CANADIAN ENVIRONMENT - 23 -
mesh sizes showed that the member began to yield when the yield moment, My, was reached, and all
mesh sizes captured the failure mechanism, although the coarser meshes over-estimated the post-
peak capacity. Thus, a coarse mesh may be used in areas that remain elastic or that experience only
limited yielding.
3.6.1.2 REFINEMENT OF MESH
A second mesh configuration was evaluated to decrease computation time and to establish that a
fine mesh is only required for critical parts of the model. The mesh was refined at the centre of the
member where the buckle was expected to occur. The refined elements had a ratio of se/t = 9.6, the
aforementioned value that was considered converged. As shown in Figure 3.9, the mesh had
elements with a good aspect ratio at the middle of the member for a specified refined length, Lr, and
elements with an aspect ratio of 3:1 at the end of the member. The moment-curvature response of
model VF-el using refined lengths of 0.5D, D, and 1.5D, was found to be identical to the response
obtained using the uniform refined element mesh.
Figure 3.9: Refined mesh configuration
However, due to the model having perfectly symmetrical geometry and loading, difficulties were
sometimes encountered. Instead of forming one buckle, two buckles would sometimes form, as
shown in Figure 3.10. Thus, a small imperfection was introduced. An out-of-straightness was
created using two opposing displacements, applied at a distance of se (or se/2 for the coarser
meshes) above and below midheight. The displaced geometry was then used for the subsequent
flexural analysis. The total out-of-straightness was varied from 1% of the shell thickness to 5% of
the shell thickness, t, to see the influence on the response curve. The effect of various imperfections
was evaluated, and it was found to decrease the peak capacity of the member by only 1.5%. The
M
Lr
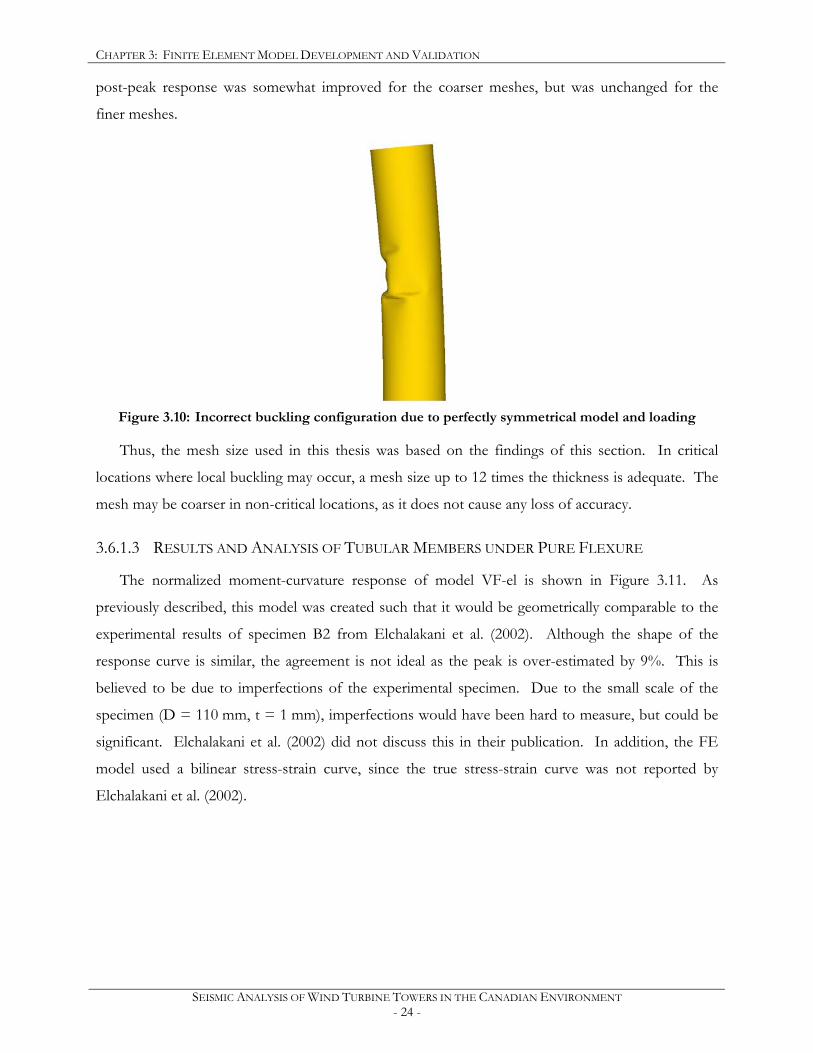
CHAPTER 3: FINITE ELEMENT MODEL DEVELOPMENT AND VALIDATION
SEISMIC ANALYSIS OF WIND TURBINE TOWERS IN THE CANADIAN ENVIRONMENT - 24 -
post-peak response was somewhat improved for the coarser meshes, but was unchanged for the
finer meshes.
Figure 3.10: Incorrect buckling configuration due to perfectly symmetrical model and loading
Thus, the mesh size used in this thesis was based on the findings of this section. In critical
locations where local buckling may occur, a mesh size up to 12 times the thickness is adequate. The
mesh may be coarser in non-critical locations, as it does not cause any loss of accuracy.
3.6.1.3 RESULTS AND ANALYSIS OF TUBULAR MEMBERS UNDER PURE FLEXURE
The normalized moment-curvature response of model VF-el is shown in Figure 3.11. As
previously described, this model was created such that it would be geometrically comparable to the
experimental results of specimen B2 from Elchalakani et al. (2002). Although the shape of the
response curve is similar, the agreement is not ideal as the peak is over-estimated by 9%. This is
believed to be due to imperfections of the experimental specimen. Due to the small scale of the
specimen (D = 110 mm, t = 1 mm), imperfections would have been hard to measure, but could be
significant. Elchalakani et al. (2002) did not discuss this in their publication. In addition, the FE
model used a bilinear stress-strain curve, since the true stress-strain curve was not reported by
Elchalakani et al. (2002).
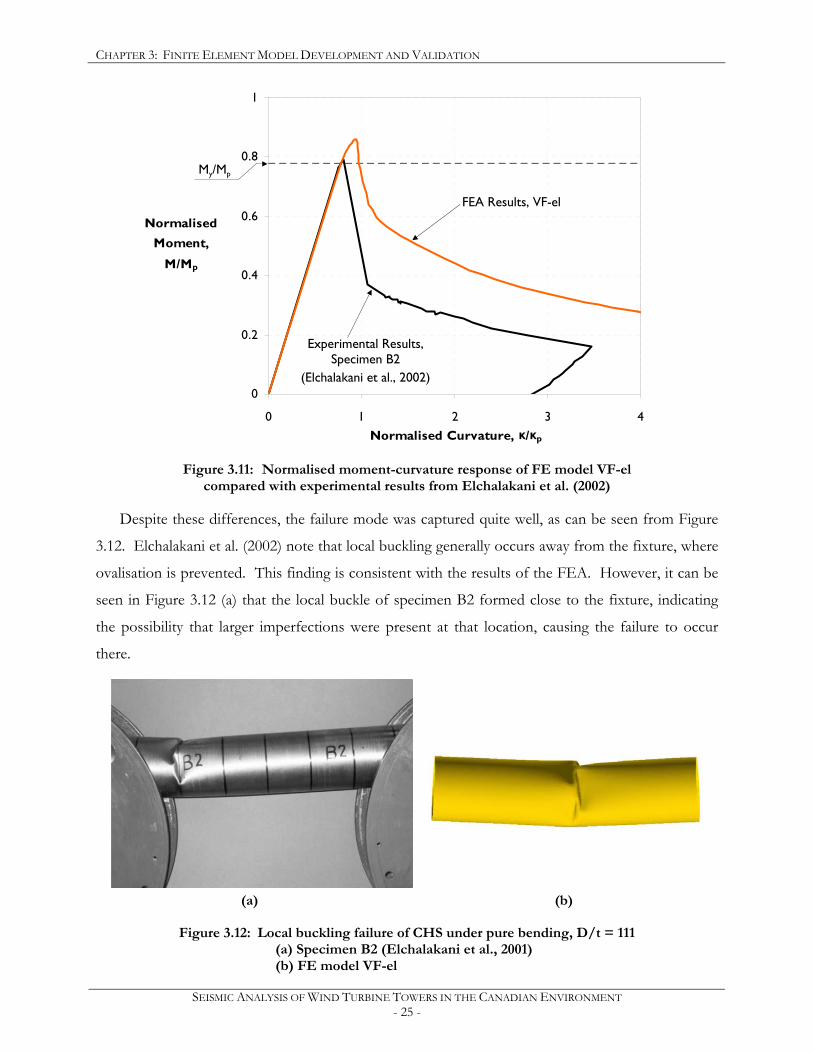
CHAPTER 3: FINITE ELEMENT MODEL DEVELOPMENT AND VALIDATION
SEISMIC ANALYSIS OF WIND TURBINE TOWERS IN THE CANADIAN ENVIRONMENT - 25 -
0
0.2
0.4
0.6
0.8
1
0 1 2 3 4Normalised Curvature, κ/κp
Normalised Moment,
M/Mp
Figure 3.11: Normalised moment-curvature response of FE model VF-el
compared with experimental results from Elchalakani et al. (2002)
Despite these differences, the failure mode was captured quite well, as can be seen from Figure
3.12. Elchalakani et al. (2002) note that local buckling generally occurs away from the fixture, where
ovalisation is prevented. This finding is consistent with the results of the FEA. However, it can be
seen in Figure 3.12 (a) that the local buckle of specimen B2 formed close to the fixture, indicating
the possibility that larger imperfections were present at that location, causing the failure to occur
there.
(a) (b)
Figure 3.12: Local buckling failure of CHS under pure bending, D/t = 111 (a) Specimen B2 (Elchalakani et al., 2001) (b) FE model VF-el
Experimental Results, Specimen B2
(Elchalakani et al., 2002)
My/Mp
FEA Results, VF-el
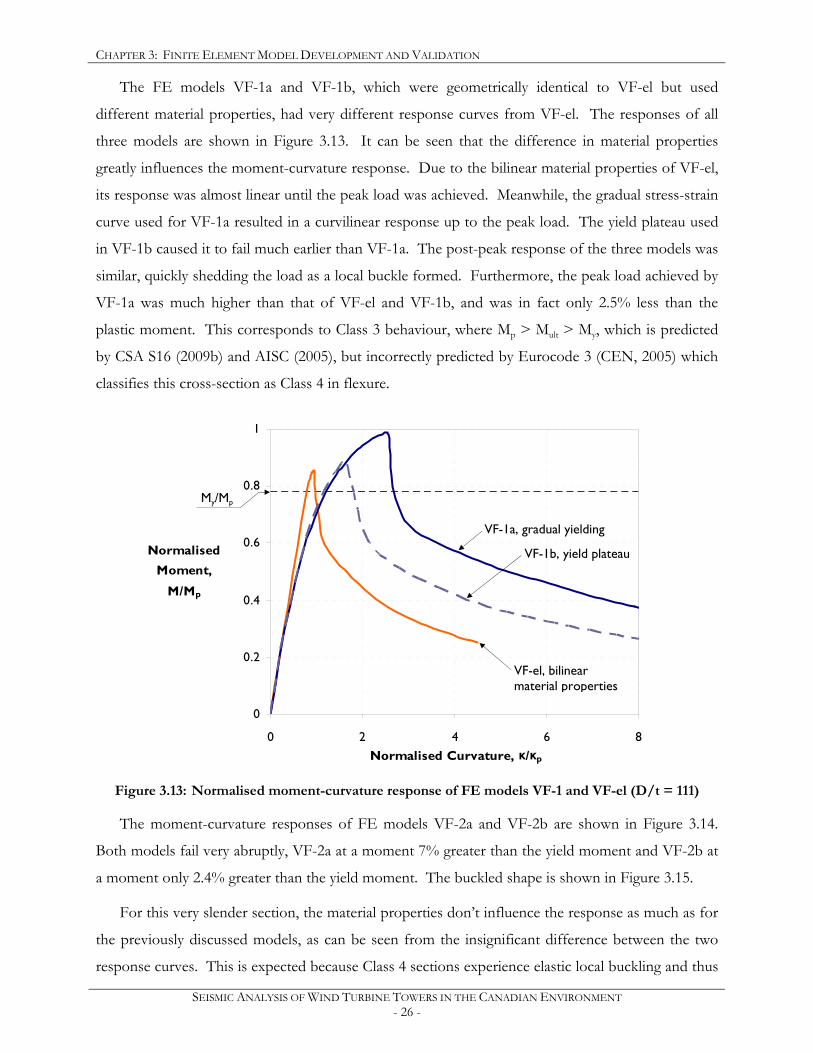
CHAPTER 3: FINITE ELEMENT MODEL DEVELOPMENT AND VALIDATION
SEISMIC ANALYSIS OF WIND TURBINE TOWERS IN THE CANADIAN ENVIRONMENT - 26 -
The FE models VF-1a and VF-1b, which were geometrically identical to VF-el but used
different material properties, had very different response curves from VF-el. The responses of all
three models are shown in Figure 3.13. It can be seen that the difference in material properties
greatly influences the moment-curvature response. Due to the bilinear material properties of VF-el,
its response was almost linear until the peak load was achieved. Meanwhile, the gradual stress-strain
curve used for VF-1a resulted in a curvilinear response up to the peak load. The yield plateau used
in VF-1b caused it to fail much earlier than VF-1a. The post-peak response of the three models was
similar, quickly shedding the load as a local buckle formed. Furthermore, the peak load achieved by
VF-1a was much higher than that of VF-el and VF-1b, and was in fact only 2.5% less than the
plastic moment. This corresponds to Class 3 behaviour, where Mp > Mult > My, which is predicted
by CSA S16 (2009b) and AISC (2005), but incorrectly predicted by Eurocode 3 (CEN, 2005) which
classifies this cross-section as Class 4 in flexure.
0
0.2
0.4
0.6
0.8
1
0 2 4 6 8Normalised Curvature, κ/κp
Normalised Moment,
M/Mp
Figure 3.13: Normalised moment-curvature response of FE models VF-1 and VF-el (D/t = 111)
The moment-curvature responses of FE models VF-2a and VF-2b are shown in Figure 3.14.
Both models fail very abruptly, VF-2a at a moment 7% greater than the yield moment and VF-2b at
a moment only 2.4% greater than the yield moment. The buckled shape is shown in Figure 3.15.
For this very slender section, the material properties don’t influence the response as much as for
the previously discussed models, as can be seen from the insignificant difference between the two
response curves. This is expected because Class 4 sections experience elastic local buckling and thus
My/Mp
VF-1a, gradual yielding
VF-el, bilinear material properties
VF-1b, yield plateau
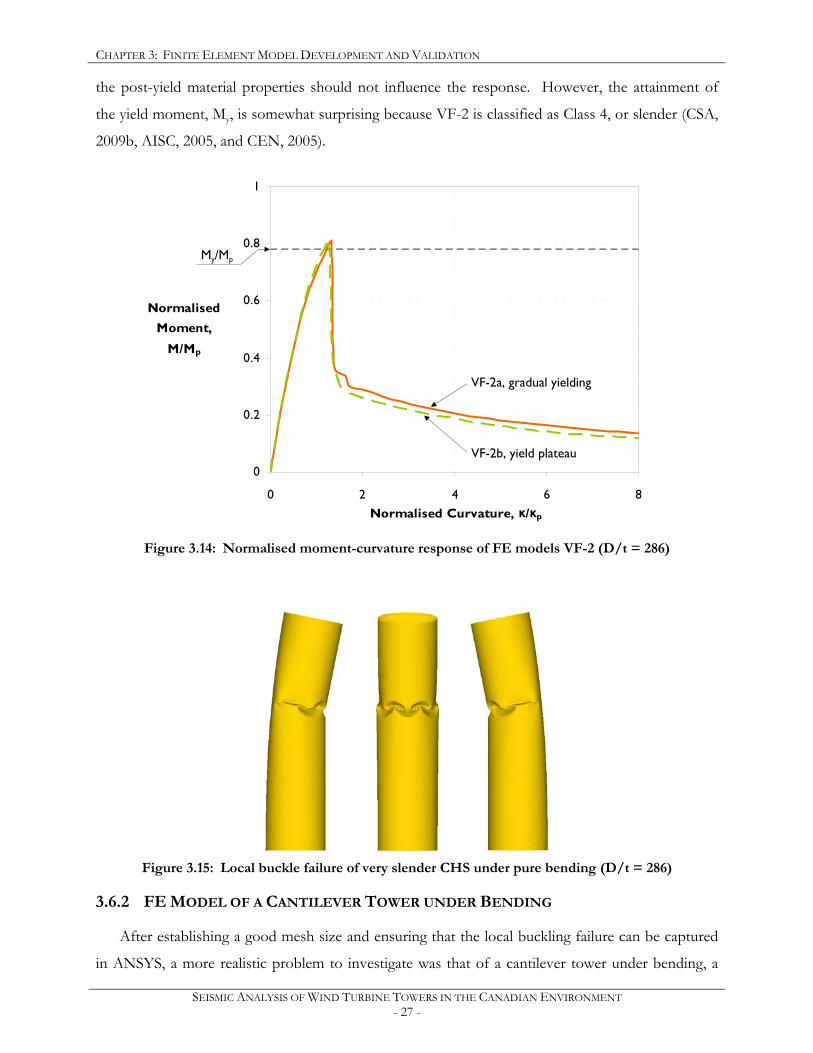
CHAPTER 3: FINITE ELEMENT MODEL DEVELOPMENT AND VALIDATION
SEISMIC ANALYSIS OF WIND TURBINE TOWERS IN THE CANADIAN ENVIRONMENT - 27 -
the post-yield material properties should not influence the response. However, the attainment of
the yield moment, My, is somewhat surprising because VF-2 is classified as Class 4, or slender (CSA,
2009b, AISC, 2005, and CEN, 2005).
0
0.2
0.4
0.6
0.8
1
0 2 4 6 8Normalised Curvature, κ/κp
Normalised Moment,
M/Mp
Figure 3.14: Normalised moment-curvature response of FE models VF-2 (D/t = 286)
Figure 3.15: Local buckle failure of very slender CHS under pure bending (D/t = 286)
3.6.2 FE MODEL OF A CANTILEVER TOWER UNDER BENDING
After establishing a good mesh size and ensuring that the local buckling failure can be captured
in ANSYS, a more realistic problem to investigate was that of a cantilever tower under bending, a
My/Mp
VF-2a, gradual yielding
VF-2b, yield plateau

CHAPTER 3: FINITE ELEMENT MODEL DEVELOPMENT AND VALIDATION
SEISMIC ANALYSIS OF WIND TURBINE TOWERS IN THE CANADIAN ENVIRONMENT - 28 -
load case that a wind turbine tower is regularly subjected to. To validate the ability of the program
to capture the behaviour of what is essentially a cantilevered beam made of shell elements, two
models were created, VB-1 and VB-2. These two models have cross-sectional dimensions similar to
VF-1 and VF-2, respectively, but the length of the member is much longer, 60 m. No initial
imperfections were added to the geometry, as asymmetry is created by the load due to the shear
variation along the length. A schematic is shown in Figure 3.16, along with details of the FE
models.
A flange of proportions similar to a wind turbine tower flange was added to model VB-1 at the
location where the buckle formed, creating a third model, VBS-1. The geometry of the flange and
details of the model are shown in Figure 3.16. All three models were analysed twice: once with
material properties having gradual yielding, and a second time with material properties having a yield
plateau.
Figure 3.16: Schematic and descriptions of FE models for validation of bending behaviour
3.6.2.1 RESULTS AND ANALYSIS OF CANTILEVER TOWER UNDER BENDING
The response curves of all three models described above are plotted in Figure 3.17. In each
case, the moment is taken at the base to reflect the capacity of the tower and not necessarily that of
the section that fails. The response curves of the unstiffened towers are very similar to their pure
flexure counterparts. The peak load of VB-1 appears to be higher than the peak load achieved in
pure flexure. However, this is not true because the moment in Figure 3.17 is the base moment and
not the moment at the section where the tower buckled, at 4.5 m from the base. Hence, the plotted
moment, M, is proportional to the applied lateral load, P. The peak load of VB-2 is the same as that
achieved in pure flexure. The buckle of VB-2 formed much higher, at 8.6 m from the base. Thus
the peak moment at the location of failure was much less than that achieved in pure flexure, which is
to be expected.
D = 2000mm L = 60m
VB-2 t = 7mm D/t = 276
VB-1 t = 18mm D/t = 111 D L
t
P
VBS-1 t = 18mm D/t = 111 hf = 4.48m wf = 94mm tf = 35mm
wf
tf
hf
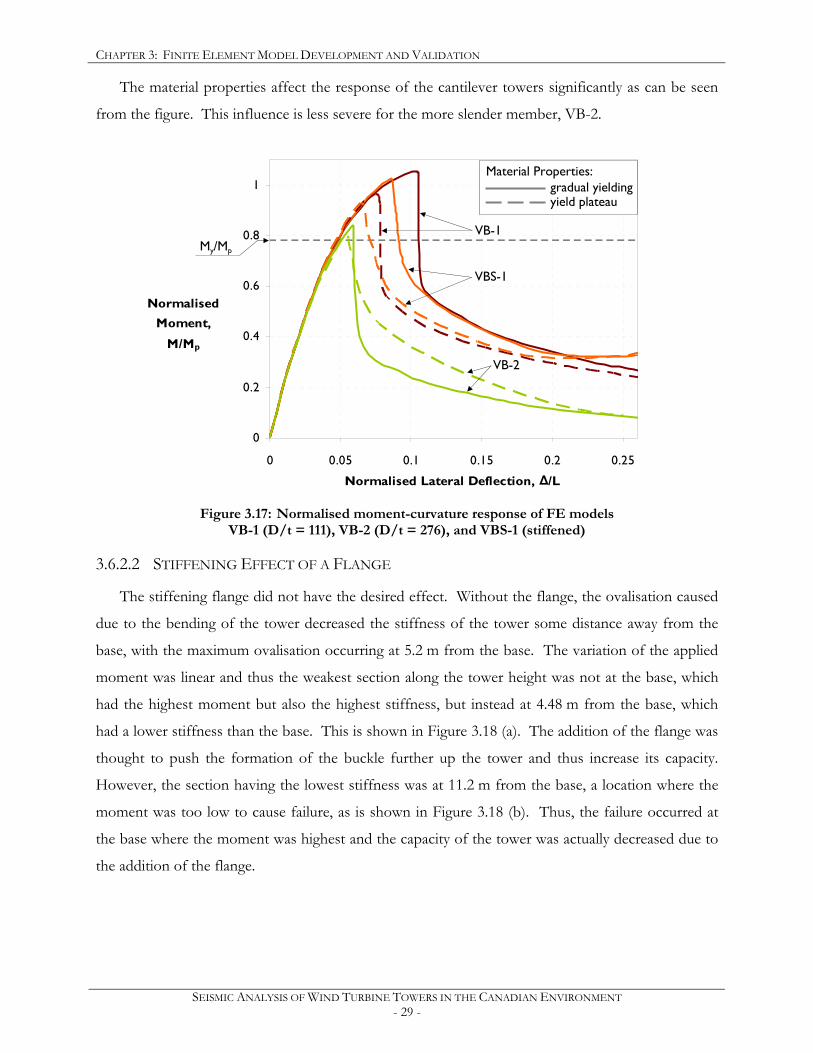
CHAPTER 3: FINITE ELEMENT MODEL DEVELOPMENT AND VALIDATION
SEISMIC ANALYSIS OF WIND TURBINE TOWERS IN THE CANADIAN ENVIRONMENT - 29 -
The material properties affect the response of the cantilever towers significantly as can be seen
from the figure. This influence is less severe for the more slender member, VB-2.
0
0.2
0.4
0.6
0.8
1
0 0.05 0.1 0.15 0.2 0.25
Normalised Lateral Deflection, ∆/L
Normalised Moment,
M/Mp
Figure 3.17: Normalised moment-curvature response of FE models
VB-1 (D/t = 111), VB-2 (D/t = 276), and VBS-1 (stiffened)
3.6.2.2 STIFFENING EFFECT OF A FLANGE
The stiffening flange did not have the desired effect. Without the flange, the ovalisation caused
due to the bending of the tower decreased the stiffness of the tower some distance away from the
base, with the maximum ovalisation occurring at 5.2 m from the base. The variation of the applied
moment was linear and thus the weakest section along the tower height was not at the base, which
had the highest moment but also the highest stiffness, but instead at 4.48 m from the base, which
had a lower stiffness than the base. This is shown in Figure 3.18 (a). The addition of the flange was
thought to push the formation of the buckle further up the tower and thus increase its capacity.
However, the section having the lowest stiffness was at 11.2 m from the base, a location where the
moment was too low to cause failure, as is shown in Figure 3.18 (b). Thus, the failure occurred at
the base where the moment was highest and the capacity of the tower was actually decreased due to
the addition of the flange.
My/Mp VB-1
VBS-1
VB-2
gradual yielding yield plateau
Material Properties:
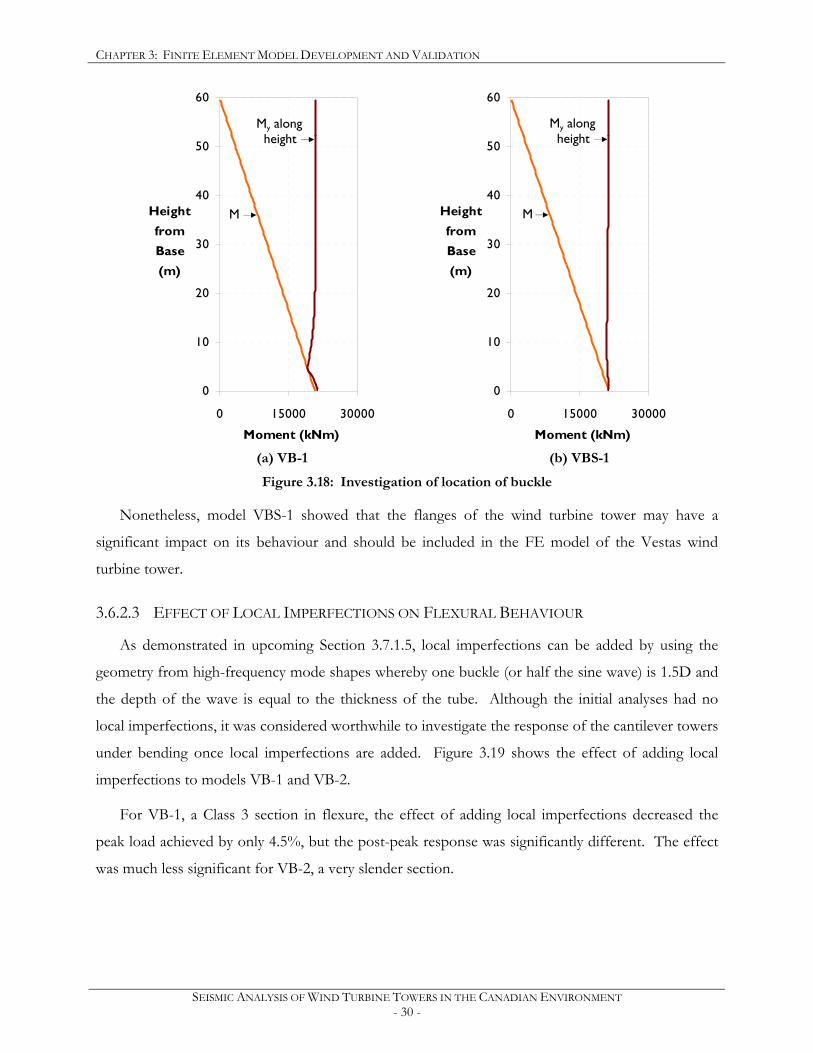
CHAPTER 3: FINITE ELEMENT MODEL DEVELOPMENT AND VALIDATION
SEISMIC ANALYSIS OF WIND TURBINE TOWERS IN THE CANADIAN ENVIRONMENT - 30 -
0
10
20
30
40
50
60
0 15000 30000
Moment (kNm)
Height from Base (m)
0
10
20
30
40
50
60
0 15000 30000
Moment (kNm)
Height from Base (m)
(a) VB-1 (b) VBS-1
Figure 3.18: Investigation of location of buckle
Nonetheless, model VBS-1 showed that the flanges of the wind turbine tower may have a
significant impact on its behaviour and should be included in the FE model of the Vestas wind
turbine tower.
3.6.2.3 EFFECT OF LOCAL IMPERFECTIONS ON FLEXURAL BEHAVIOUR
As demonstrated in upcoming Section 3.7.1.5, local imperfections can be added by using the
geometry from high-frequency mode shapes whereby one buckle (or half the sine wave) is 1.5D and
the depth of the wave is equal to the thickness of the tube. Although the initial analyses had no
local imperfections, it was considered worthwhile to investigate the response of the cantilever towers
under bending once local imperfections are added. Figure 3.19 shows the effect of adding local
imperfections to models VB-1 and VB-2.
For VB-1, a Class 3 section in flexure, the effect of adding local imperfections decreased the
peak load achieved by only 4.5%, but the post-peak response was significantly different. The effect
was much less significant for VB-2, a very slender section.
M
My along height
M
My along height
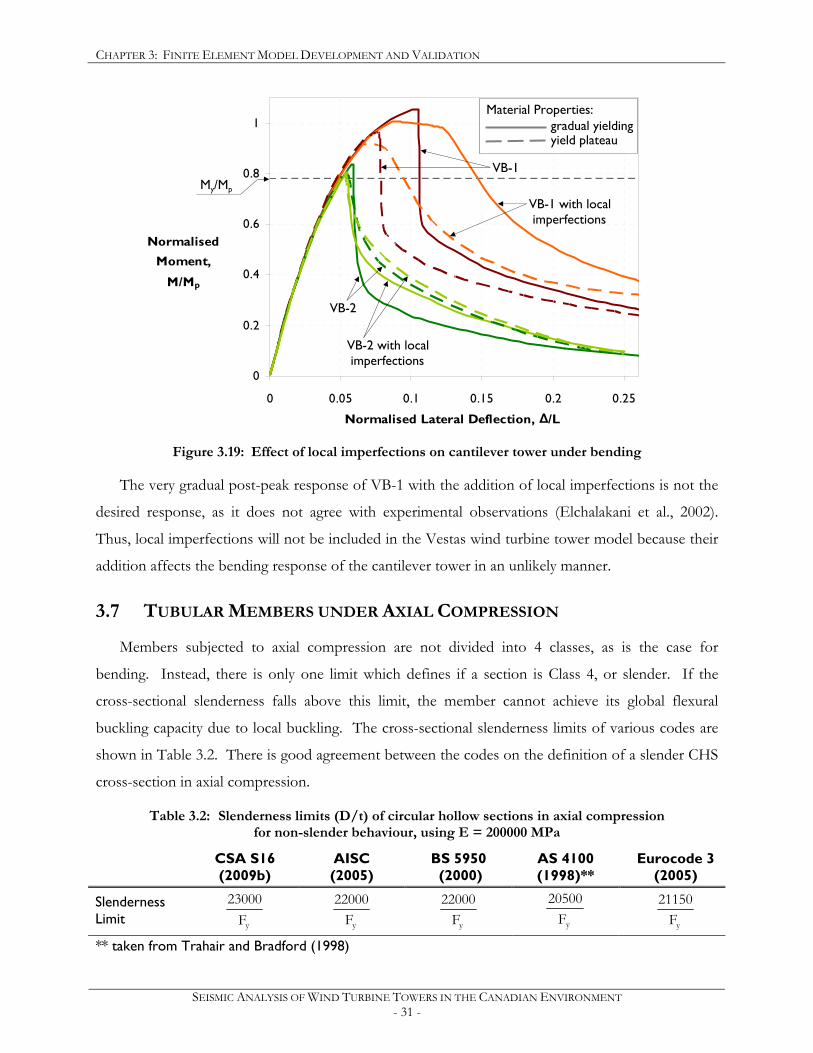
CHAPTER 3: FINITE ELEMENT MODEL DEVELOPMENT AND VALIDATION
SEISMIC ANALYSIS OF WIND TURBINE TOWERS IN THE CANADIAN ENVIRONMENT - 31 -
0
0.2
0.4
0.6
0.8
1
0 0.05 0.1 0.15 0.2 0.25
Normalised Lateral Deflection, ∆/L
Normalised Moment,
M/Mp
Figure 3.19: Effect of local imperfections on cantilever tower under bending
The very gradual post-peak response of VB-1 with the addition of local imperfections is not the
desired response, as it does not agree with experimental observations (Elchalakani et al., 2002).
Thus, local imperfections will not be included in the Vestas wind turbine tower model because their
addition affects the bending response of the cantilever tower in an unlikely manner.
3.7 TUBULAR MEMBERS UNDER AXIAL COMPRESSION
Members subjected to axial compression are not divided into 4 classes, as is the case for
bending. Instead, there is only one limit which defines if a section is Class 4, or slender. If the
cross-sectional slenderness falls above this limit, the member cannot achieve its global flexural
buckling capacity due to local buckling. The cross-sectional slenderness limits of various codes are
shown in Table 3.2. There is good agreement between the codes on the definition of a slender CHS
cross-section in axial compression.
Table 3.2: Slenderness limits (D/t) of circular hollow sections in axial compression for non-slender behaviour, using E = 200000 MPa
CSA S16 (2009b)
AISC (2005)
BS 5950 (2000)
AS 4100 (1998)**
Eurocode 3 (2005)
Slenderness Limit yF
23000
yF22000
yF
22000
yF20500
yF
21150
** taken from Trahair and Bradford (1998)
gradual yielding yield plateau
Material Properties:
My/Mp VB-1
VB-2
VB-1 with local imperfections
VB-2 with local imperfections
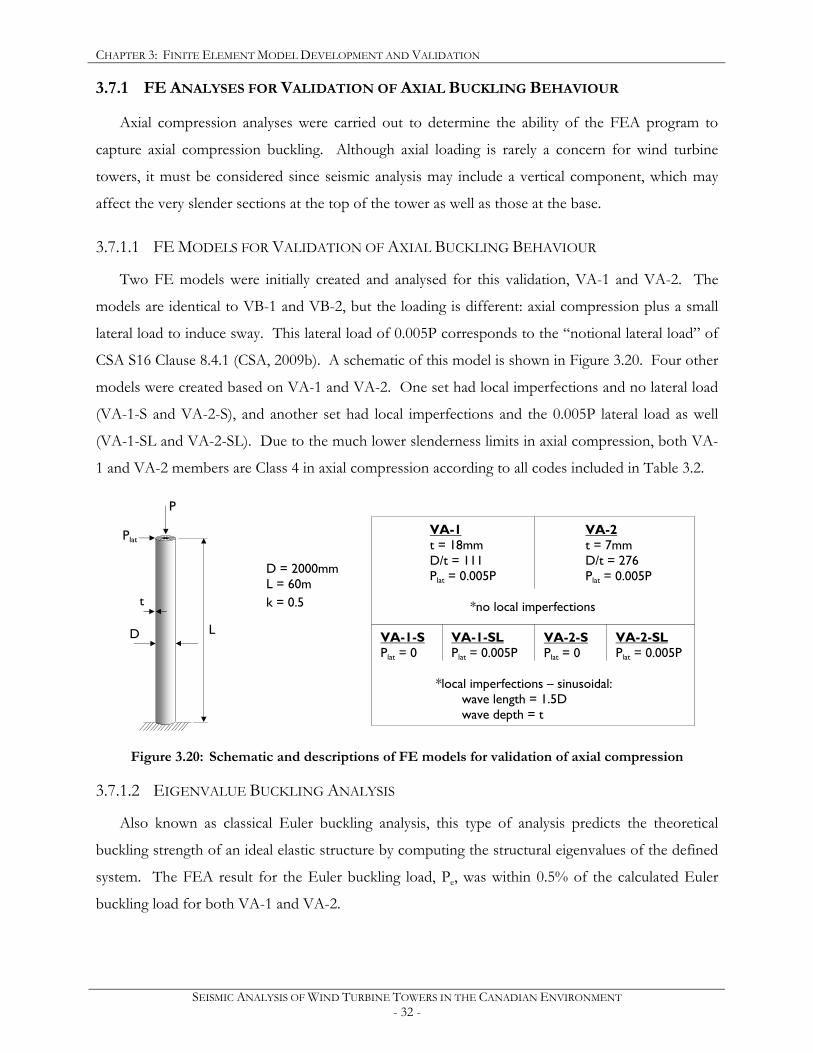
CHAPTER 3: FINITE ELEMENT MODEL DEVELOPMENT AND VALIDATION
SEISMIC ANALYSIS OF WIND TURBINE TOWERS IN THE CANADIAN ENVIRONMENT - 32 -
3.7.1 FE ANALYSES FOR VALIDATION OF AXIAL BUCKLING BEHAVIOUR
Axial compression analyses were carried out to determine the ability of the FEA program to
capture axial compression buckling. Although axial loading is rarely a concern for wind turbine
towers, it must be considered since seismic analysis may include a vertical component, which may
affect the very slender sections at the top of the tower as well as those at the base.
3.7.1.1 FE MODELS FOR VALIDATION OF AXIAL BUCKLING BEHAVIOUR
Two FE models were initially created and analysed for this validation, VA-1 and VA-2. The
models are identical to VB-1 and VB-2, but the loading is different: axial compression plus a small
lateral load to induce sway. This lateral load of 0.005P corresponds to the “notional lateral load” of
CSA S16 Clause 8.4.1 (CSA, 2009b). A schematic of this model is shown in Figure 3.20. Four other
models were created based on VA-1 and VA-2. One set had local imperfections and no lateral load
(VA-1-S and VA-2-S), and another set had local imperfections and the 0.005P lateral load as well
(VA-1-SL and VA-2-SL). Due to the much lower slenderness limits in axial compression, both VA-
1 and VA-2 members are Class 4 in axial compression according to all codes included in Table 3.2.
Figure 3.20: Schematic and descriptions of FE models for validation of axial compression
3.7.1.2 EIGENVALUE BUCKLING ANALYSIS
Also known as classical Euler buckling analysis, this type of analysis predicts the theoretical
buckling strength of an ideal elastic structure by computing the structural eigenvalues of the defined
system. The FEA result for the Euler buckling load, Pe, was within 0.5% of the calculated Euler
buckling load for both VA-1 and VA-2.
D = 2000mm L = 60m k = 0.5
VA-1 t = 18mm D/t = 111 Plat = 0.005P *no local imperfections
D L
t
P
Plat
VA-2 t = 7mm D/t = 276 Plat = 0.005P
VA-1-S Plat = 0 *local imperfections – sinusoidal: wave length = 1.5D wave depth = t
VA-2-S Plat = 0
VA-1-SL Plat = 0.005P
VA-2-SL Plat = 0.005P
CHAPTER 3: FINITE ELEMENT MODEL DEVELOPMENT AND VALIDATION
SEISMIC ANALYSIS OF WIND TURBINE TOWERS IN THE CANADIAN ENVIRONMENT - 33 -
3.7.1.3 NONLINEAR BUCKLING ANALYSIS – GEOMETRIC AND MATERIAL
NONLINEARITIES
Euler buckling analysis over-predicts the elastic buckling load of a structure because it does not
account for imperfections and initial out-of-straightness of columns. Equations have been
developed to account for this and to predict a more realistic capacity of a column against buckling.
To determine this value using finite element analysis, a geometric non-linear, large-deflection static
analysis must be employed. The load is gradually increased until a load is reached where the
structure is unstable. This type of analysis may also include nonlinear material properties, to
approach the behaviour of a real column.
3.7.1.4 GEOMETRIC IMPERFECTIONS FOR GLOBAL BUCKLING
To simulate some initial imperfections to induce global buckling, a lateral load of 0.5% of the
axial load was added at the top of the cantilever tower. According to CSA S16-09 (2009b), 0.5% is
an adequate notional load to simulate such translational effects in a structure. This value was
furthermore confirmed by running two analyses with an initial out-of-straightness of 5 mm and of
10 mm at the top of the cantilever tower. Both analyses followed the same load-deflection path.
Conversely, an analysis with only 0.1% lateral load was found to differ significantly from the other
cases investigated.
3.7.1.5 GEOMETRIC IMPERFECTIONS FOR LOCAL BUCKLING
Imperfections were also added along the height of the tower to make local failure possible in the
case that local buckling occurred before global buckling.
To determine the amount of local imperfections required to induce local buckling, model VA-1
was reduced to a quarter of its initial length. Its geometry was then updated with high-frequency
mode shapes having three to six buckles (or 1.5 to 3 sine waves) along the length of the member.
The length of the sine wave was thus varied from 2.5D to 1.25D. Additionally, the depth of the
wave was varied from 0.25t to 2t. There was no lateral load at the top to induce global buckling.
The effect of varying the sine wave length and depth is shown in Figure 3.21.
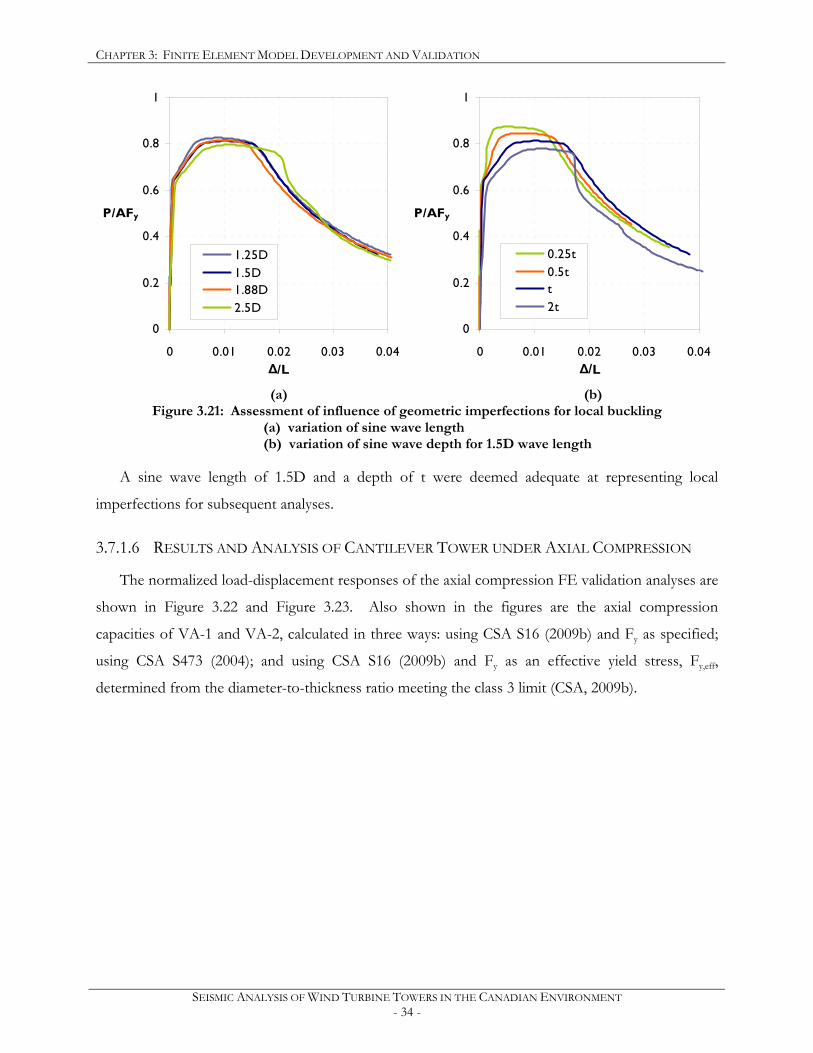
CHAPTER 3: FINITE ELEMENT MODEL DEVELOPMENT AND VALIDATION
SEISMIC ANALYSIS OF WIND TURBINE TOWERS IN THE CANADIAN ENVIRONMENT - 34 -
0
0.2
0.4
0.6
0.8
1
0 0.01 0.02 0.03 0.04∆/L
P/AFy
1.25D1.5D1.88D2.5D
0
0.2
0.4
0.6
0.8
1
0 0.01 0.02 0.03 0.04∆/L
P/AFy
0.25t0.5t t2t
(a) (b)
Figure 3.21: Assessment of influence of geometric imperfections for local buckling (a) variation of sine wave length (b) variation of sine wave depth for 1.5D wave length
A sine wave length of 1.5D and a depth of t were deemed adequate at representing local
imperfections for subsequent analyses.
3.7.1.6 RESULTS AND ANALYSIS OF CANTILEVER TOWER UNDER AXIAL COMPRESSION
The normalized load-displacement responses of the axial compression FE validation analyses are
shown in Figure 3.22 and Figure 3.23. Also shown in the figures are the axial compression
capacities of VA-1 and VA-2, calculated in three ways: using CSA S16 (2009b) and Fy as specified;
using CSA S473 (2004); and using CSA S16 (2009b) and Fy as an effective yield stress, Fy,eff,
determined from the diameter-to-thickness ratio meeting the class 3 limit (CSA, 2009b).
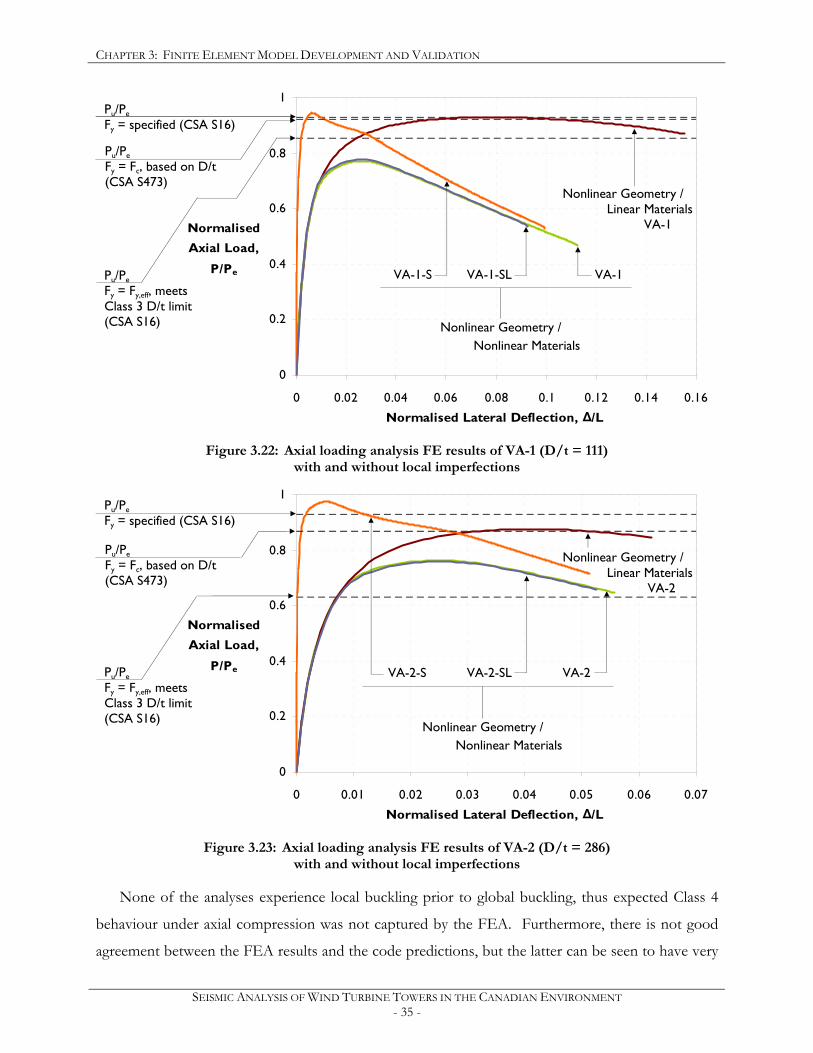
CHAPTER 3: FINITE ELEMENT MODEL DEVELOPMENT AND VALIDATION
SEISMIC ANALYSIS OF WIND TURBINE TOWERS IN THE CANADIAN ENVIRONMENT - 35 -
0
0.2
0.4
0.6
0.8
1
0 0.02 0.04 0.06 0.08 0.1 0.12 0.14 0.16
Normalised Lateral Deflection, ∆/L
Normalised Axial Load,
P/Pe
Figure 3.22: Axial loading analysis FE results of VA-1 (D/t = 111)
with and without local imperfections
0
0.2
0.4
0.6
0.8
1
0 0.01 0.02 0.03 0.04 0.05 0.06 0.07
Normalised Lateral Deflection, ∆/L
Normalised Axial Load,
P/Pe
Figure 3.23: Axial loading analysis FE results of VA-2 (D/t = 286)
with and without local imperfections
None of the analyses experience local buckling prior to global buckling, thus expected Class 4
behaviour under axial compression was not captured by the FEA. Furthermore, there is not good
agreement between the FEA results and the code predictions, but the latter can be seen to have very
Pu/Pe Fy = specified (CSA S16)
Nonlinear Geometry / Linear Materials VA-1
Nonlinear Geometry / Nonlinear Materials
Pu/Pe Fy = Fy,eff, meets Class 3 D/t limit (CSA S16)
Pu/Pe Fy = Fc, based on D/t (CSA S473)
VA-1-S VA-1 VA-1-SL
Nonlinear Geometry / Linear Materials VA-2
Nonlinear Geometry / Nonlinear Materials
VA-2-S VA-2 VA-2-SL
Pu/Pe Fy = specified (CSA S16)
Pu/Pe Fy = Fy,eff, meets Class 3 D/t limit (CSA S16)
Pu/Pe Fy = Fc, based on D/t (CSA S473)
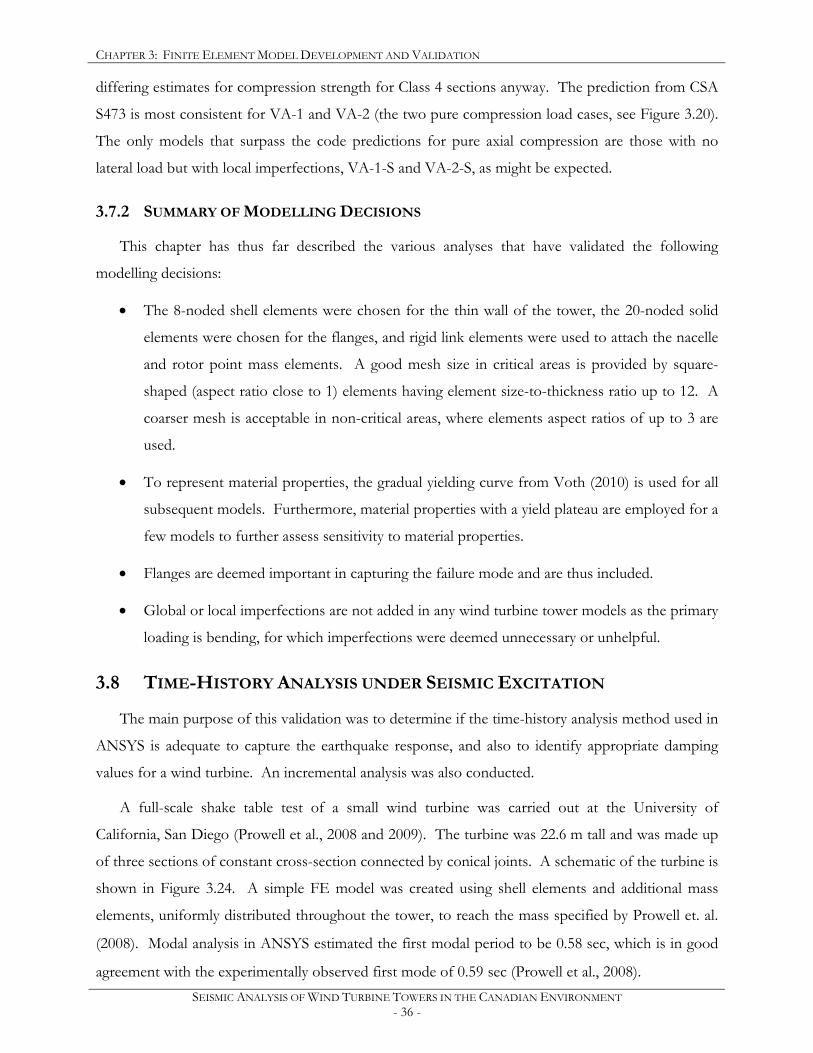
CHAPTER 3: FINITE ELEMENT MODEL DEVELOPMENT AND VALIDATION
SEISMIC ANALYSIS OF WIND TURBINE TOWERS IN THE CANADIAN ENVIRONMENT - 36 -
differing estimates for compression strength for Class 4 sections anyway. The prediction from CSA
S473 is most consistent for VA-1 and VA-2 (the two pure compression load cases, see Figure 3.20).
The only models that surpass the code predictions for pure axial compression are those with no
lateral load but with local imperfections, VA-1-S and VA-2-S, as might be expected.
3.7.2 SUMMARY OF MODELLING DECISIONS
This chapter has thus far described the various analyses that have validated the following
modelling decisions:
• The 8-noded shell elements were chosen for the thin wall of the tower, the 20-noded solid
elements were chosen for the flanges, and rigid link elements were used to attach the nacelle
and rotor point mass elements. A good mesh size in critical areas is provided by square-
shaped (aspect ratio close to 1) elements having element size-to-thickness ratio up to 12. A
coarser mesh is acceptable in non-critical areas, where elements aspect ratios of up to 3 are
used.
• To represent material properties, the gradual yielding curve from Voth (2010) is used for all
subsequent models. Furthermore, material properties with a yield plateau are employed for a
few models to further assess sensitivity to material properties.
• Flanges are deemed important in capturing the failure mode and are thus included.
• Global or local imperfections are not added in any wind turbine tower models as the primary
loading is bending, for which imperfections were deemed unnecessary or unhelpful.
3.8 TIME-HISTORY ANALYSIS UNDER SEISMIC EXCITATION
The main purpose of this validation was to determine if the time-history analysis method used in
ANSYS is adequate to capture the earthquake response, and also to identify appropriate damping
values for a wind turbine. An incremental analysis was also conducted.
A full-scale shake table test of a small wind turbine was carried out at the University of
California, San Diego (Prowell et al., 2008 and 2009). The turbine was 22.6 m tall and was made up
of three sections of constant cross-section connected by conical joints. A schematic of the turbine is
shown in Figure 3.24. A simple FE model was created using shell elements and additional mass
elements, uniformly distributed throughout the tower, to reach the mass specified by Prowell et. al.
(2008). Modal analysis in ANSYS estimated the first modal period to be 0.58 sec, which is in good
agreement with the experimentally observed first mode of 0.59 sec (Prowell et al., 2008).

CHAPTER 3: FINITE ELEMENT MODEL DEVELOPMENT AND VALIDATION
SEISMIC ANALYSIS OF WIND TURBINE TOWERS IN THE CANADIAN ENVIRONMENT - 37 -
The model was subjected to the same ground motions as the shake table test corresponding to
the results presented in Prowell et al. (2008), 143% of the east-west component of the 1992 strike-
slip Landers Earthquake. Recently, Prowell et al. (2009) have also presented results for the 100%
and 200% level of the Landers earthquake, but the analyses in this section were compared to the
2008 publication. The ground motion record, obtained from the US Geological Survey database,
was 80 sec long and the analyses had an addition 15 sec of free vibration.
Figure 3.24: Details of small wind turbine tested at UCSD
3.8.1 DAMPING IN ANSYS
The basic equation of motion that is solved during a transient dynamic analysis of any implicit
FE solver is expressed as:
( ))t(F)x](k[)x](c[)x](m[ =++ &&& (Equation 3.3)
where ]m[ = mass matrix
]c[ = damping matrix
]k[ = stiffness matrix
( ))t(F = dynamic load vector
)x( , )x( & , )x( && = nodal displacement, velocity, and acceleration vectors
6m
6m
6m
1.9m
1.9m
hub height: 22.6m
Top Section D = 1100mm t = 5.3mm
Middle Section D = 1600mm t = 5.3mm
Lower Section D = 1600mm t = 5.3mm
upper joint accelerometer
top of nacelle accelerometer

CHAPTER 3: FINITE ELEMENT MODEL DEVELOPMENT AND VALIDATION
SEISMIC ANALYSIS OF WIND TURBINE TOWERS IN THE CANADIAN ENVIRONMENT - 38 -
The damping matrix is generally difficult to evaluate. A common way of defining the damping
matrix is by using Rayleigh damping, which is a linear combination of the mass matrix and the
stiffness matrix using two coefficients, α and β:
]k[]m[]c[ β+α= (Equation 3.4)
The modal damping ratio, ζi, of a mode i can then be expressed in terms of the coefficients α
and β, and the circular frequency, ωi, of that mode as follows:
22i
ii
βω+
ωα
=ζ (Equation 3.5)
The above equation can be solved to obtain the desired damping ratio in two modes by solving
for the coefficients α and β to achieve the specified damping ratios. For subsequent analyses, the
damping value specified is for the first and second modes. However, it should be noted that this
may result in more damping of the higher modes.
3.8.1.1 COMPARISON OF EFFECT OF DAMPING
Based on experimental results, Prowell et al. (2008) calculated the amount of viscous damping to
be between 0.4 and 0.6% of critical for the small wind turbine described above. This is also similar
to the estimated value of 0.5% used by Bazeos et al. (2002) in their dynamic analysis of a wind
turbine. However, industry guidelines suggest the use of 1% of critical damping (IEC, 2005).
Several analyses were carried out with damping ratios tuned to the first and second modes at
0.5%, 1%, and 1.5% of critical. The FEA results and the experimental results are plotted in Figure
3.25 and Figure 3.26 for the acceleration at the top of the nacelle and at the upper joint, respectively,
for the first 20 sec of the earthquake. This duration was chosen to allow for comparison with the
results presented in Prowell et al. (2008). The duration of the earthquake record was 50 sec, and the
analysis was continued for an additional 15 sec to allow the tower’s vibrations to stop. Some results
of the time-history analyses with various damping values are listed in Table 3.3.
Table 3.3: Summary of results of time-history analyses for the UCSD tower comparing different damping values
Peak Displacement
Peak Stress
Residual Deformation
Damping
Ratio ∆max (% H) σmises (MPa) ∆res (% H)
Peak Acceleration at Hub Height**
0.5% 0.26 % 93 0.03 % 0.71g 1.0% 0.23 % 80 0.02 % 0.59g 1.5% 0.17 % 63 0.02 % 0.46g
** peak acceleration occurred after 20 sec and is not shown in Figure 3.25
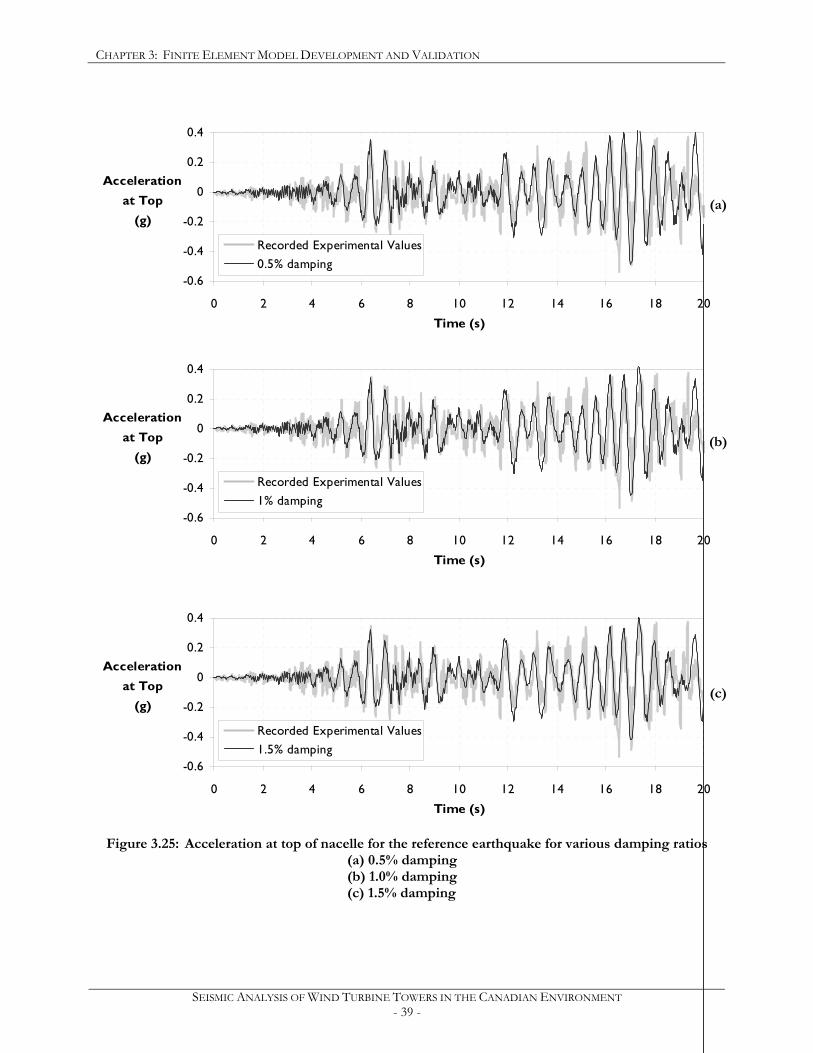
CHAPTER 3: FINITE ELEMENT MODEL DEVELOPMENT AND VALIDATION
SEISMIC ANALYSIS OF WIND TURBINE TOWERS IN THE CANADIAN ENVIRONMENT - 39 -
-0.6
-0.4
-0.2
0
0.2
0.4
0 2 4 6 8 10 12 14 16 18 20
Time (s)
Accelerationat Top
(g)
Recorded Experimental Values0.5% damping
-0.6
-0.4
-0.2
0
0.2
0.4
0 2 4 6 8 10 12 14 16 18 20
Time (s)
Accelerationat Top
(g)
Recorded Experimental Values1% damping
-0.6
-0.4
-0.2
0
0.2
0.4
0 2 4 6 8 10 12 14 16 18 20
Time (s)
Accelerationat Top
(g)
Recorded Experimental Values1.5% damping
Figure 3.25: Acceleration at top of nacelle for the reference earthquake for various damping ratios
(a) 0.5% damping (b) 1.0% damping (c) 1.5% damping
(a)
(b)
(c)
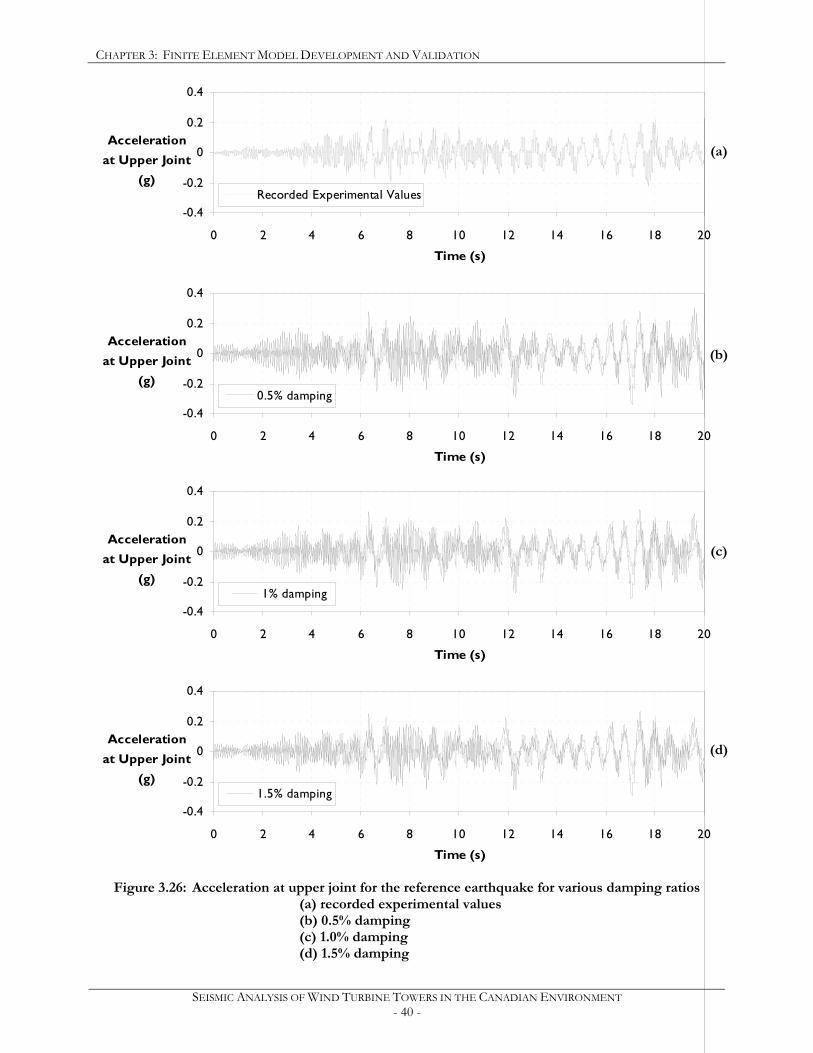
CHAPTER 3: FINITE ELEMENT MODEL DEVELOPMENT AND VALIDATION
SEISMIC ANALYSIS OF WIND TURBINE TOWERS IN THE CANADIAN ENVIRONMENT - 40 -
-0.4
-0.2
0
0.2
0.4
0 2 4 6 8 10 12 14 16 18 20
Time (s)
Accelerationat Upper Joint
(g)Recorded Experimental Values
-0.4
-0.2
0
0.2
0.4
0 2 4 6 8 10 12 14 16 18 20
Time (s)
Accelerationat Upper Joint
(g)0.5% damping
-0.4
-0.2
0
0.2
0.4
0 2 4 6 8 10 12 14 16 18 20
Time (s)
Accelerationat Upper Joint
(g)1% damping
-0.4
-0.2
0
0.2
0.4
0 2 4 6 8 10 12 14 16 18 20
Time (s)
Accelerationat Upper Joint
(g)1.5% damping
Figure 3.26: Acceleration at upper joint for the reference earthquake for various damping ratios
(a) recorded experimental values (b) 0.5% damping (c) 1.0% damping (d) 1.5% damping
(a)
(b)
(c)
(d)
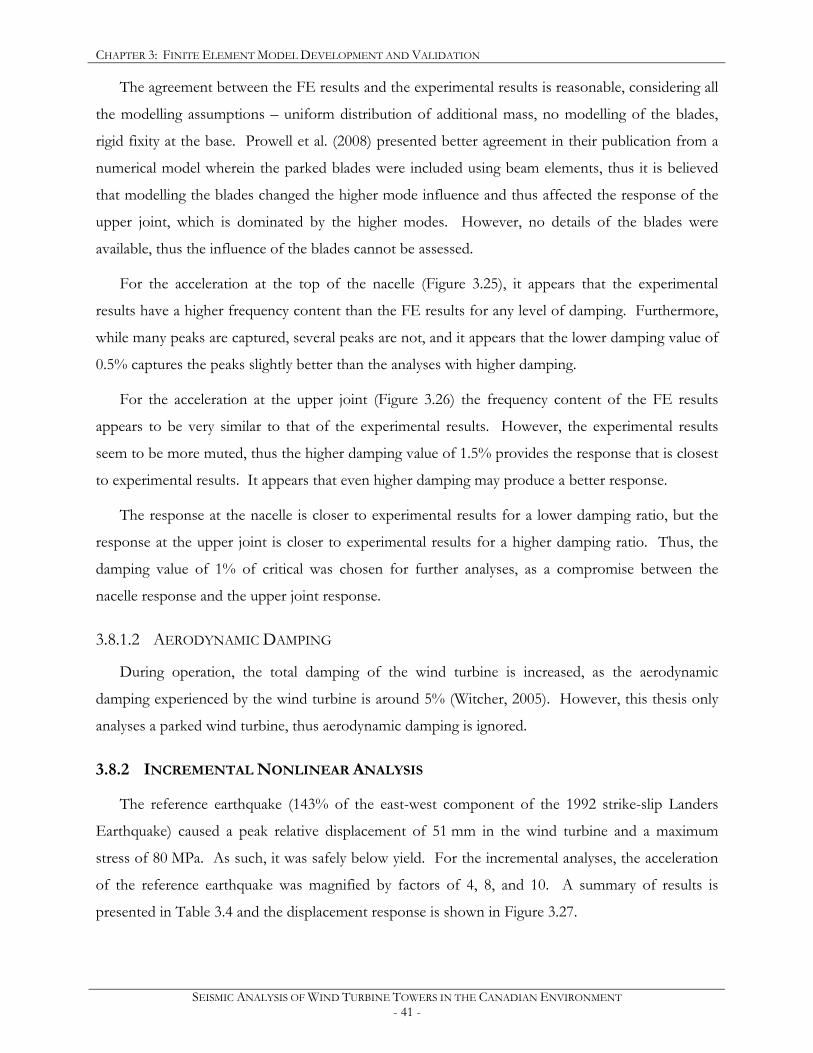
CHAPTER 3: FINITE ELEMENT MODEL DEVELOPMENT AND VALIDATION
SEISMIC ANALYSIS OF WIND TURBINE TOWERS IN THE CANADIAN ENVIRONMENT - 41 -
The agreement between the FE results and the experimental results is reasonable, considering all
the modelling assumptions – uniform distribution of additional mass, no modelling of the blades,
rigid fixity at the base. Prowell et al. (2008) presented better agreement in their publication from a
numerical model wherein the parked blades were included using beam elements, thus it is believed
that modelling the blades changed the higher mode influence and thus affected the response of the
upper joint, which is dominated by the higher modes. However, no details of the blades were
available, thus the influence of the blades cannot be assessed.
For the acceleration at the top of the nacelle (Figure 3.25), it appears that the experimental
results have a higher frequency content than the FE results for any level of damping. Furthermore,
while many peaks are captured, several peaks are not, and it appears that the lower damping value of
0.5% captures the peaks slightly better than the analyses with higher damping.
For the acceleration at the upper joint (Figure 3.26) the frequency content of the FE results
appears to be very similar to that of the experimental results. However, the experimental results
seem to be more muted, thus the higher damping value of 1.5% provides the response that is closest
to experimental results. It appears that even higher damping may produce a better response.
The response at the nacelle is closer to experimental results for a lower damping ratio, but the
response at the upper joint is closer to experimental results for a higher damping ratio. Thus, the
damping value of 1% of critical was chosen for further analyses, as a compromise between the
nacelle response and the upper joint response.
3.8.1.2 AERODYNAMIC DAMPING
During operation, the total damping of the wind turbine is increased, as the aerodynamic
damping experienced by the wind turbine is around 5% (Witcher, 2005). However, this thesis only
analyses a parked wind turbine, thus aerodynamic damping is ignored.
3.8.2 INCREMENTAL NONLINEAR ANALYSIS
The reference earthquake (143% of the east-west component of the 1992 strike-slip Landers
Earthquake) caused a peak relative displacement of 51 mm in the wind turbine and a maximum
stress of 80 MPa. As such, it was safely below yield. For the incremental analyses, the acceleration
of the reference earthquake was magnified by factors of 4, 8, and 10. A summary of results is
presented in Table 3.4 and the displacement response is shown in Figure 3.27.
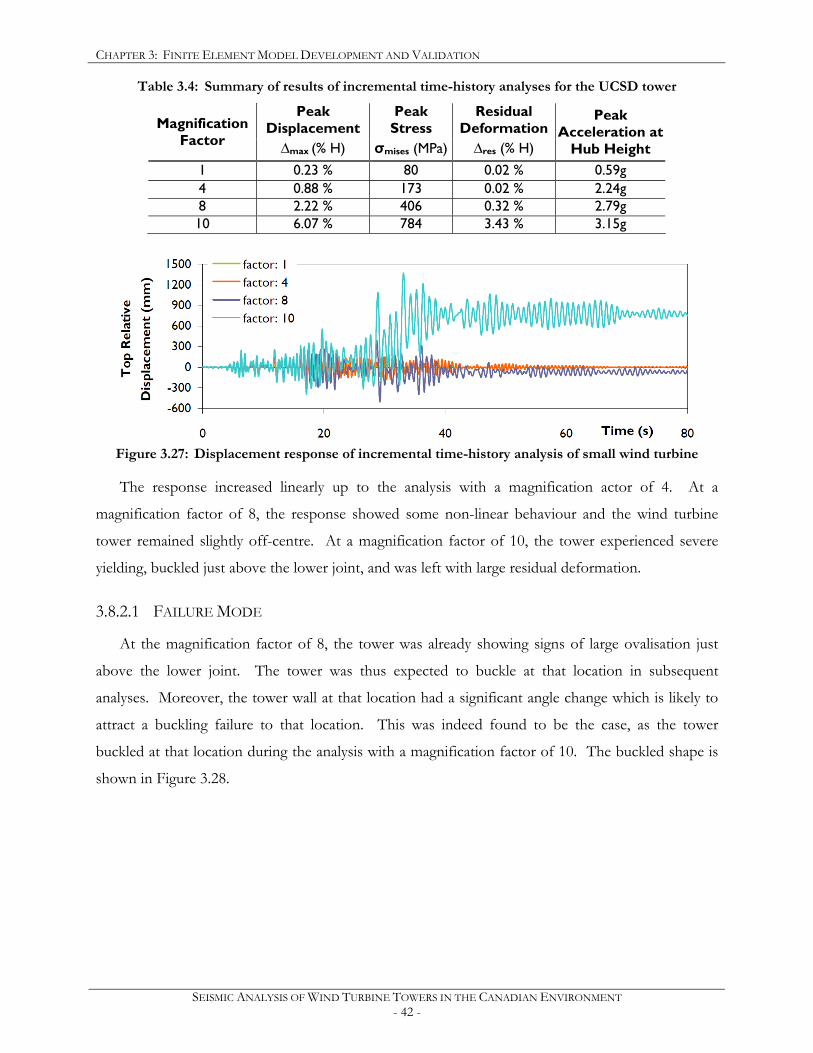
CHAPTER 3: FINITE ELEMENT MODEL DEVELOPMENT AND VALIDATION
SEISMIC ANALYSIS OF WIND TURBINE TOWERS IN THE CANADIAN ENVIRONMENT - 42 -
Table 3.4: Summary of results of incremental time-history analyses for the UCSD tower
Peak Displacement
Peak Stress
Residual Deformation Magnification
Factor ∆max (% H) σmises (MPa) ∆res (% H)
Peak Acceleration at
Hub Height 1 0.23 % 80 0.02 % 0.59g 4 0.88 % 173 0.02 % 2.24g 8 2.22 % 406 0.32 % 2.79g 10 6.07 % 784 3.43 % 3.15g
Figure 3.27: Displacement response of incremental time-history analysis of small wind turbine
The response increased linearly up to the analysis with a magnification actor of 4. At a
magnification factor of 8, the response showed some non-linear behaviour and the wind turbine
tower remained slightly off-centre. At a magnification factor of 10, the tower experienced severe
yielding, buckled just above the lower joint, and was left with large residual deformation.
3.8.2.1 FAILURE MODE
At the magnification factor of 8, the tower was already showing signs of large ovalisation just
above the lower joint. The tower was thus expected to buckle at that location in subsequent
analyses. Moreover, the tower wall at that location had a significant angle change which is likely to
attract a buckling failure to that location. This was indeed found to be the case, as the tower
buckled at that location during the analysis with a magnification factor of 10. The buckled shape is
shown in Figure 3.28.
CHAPTER 3: FINITE ELEMENT MODEL DEVELOPMENT AND VALIDATION
SEISMIC ANALYSIS OF WIND TURBINE TOWERS IN THE CANADIAN ENVIRONMENT - 43 -
Figure 3.28: Buckled shape of UCSD wind turbine tower – analysis at a magnification factor of 10
3.9 SUMMARY
The finite element decisions described in this chapter have been validated and shown to capture
several behaviours that are essential to the analysis of a thin-walled steel wind turbine tower.
Geometric and material nonlinearities were incorporated, and the elements chosen were shown to
adequately represent the expected behaviours. Mesh sensitivity studies were carried out on fully
nonlinear models to determine that a ratio of element size-to-thickness of less than or equal to 12 is
required for areas where local buckling may occur, but that this ratio can be much higher in other
areas. Refinement of the mesh was found to be acceptable, but care must be taken that the
transition zone between mesh sizes does not affect the failure.
Comparison of one FE model for pure flexure with an experimental specimen suggested that the
FE analysis slightly over-estimated the peak capacity in flexure. However, the response path was as
expected and the failure mode was captured very closely. Comparison of geometrically-identical
models with different material properties showed that the numerical analysis is very much dependant
on the nonlinear material properties. Gradual yielding material properties were chosen for
subsequent analyses as they are considered representative of cold-rolled plates, as would be used in a
typical wind turbine tower.
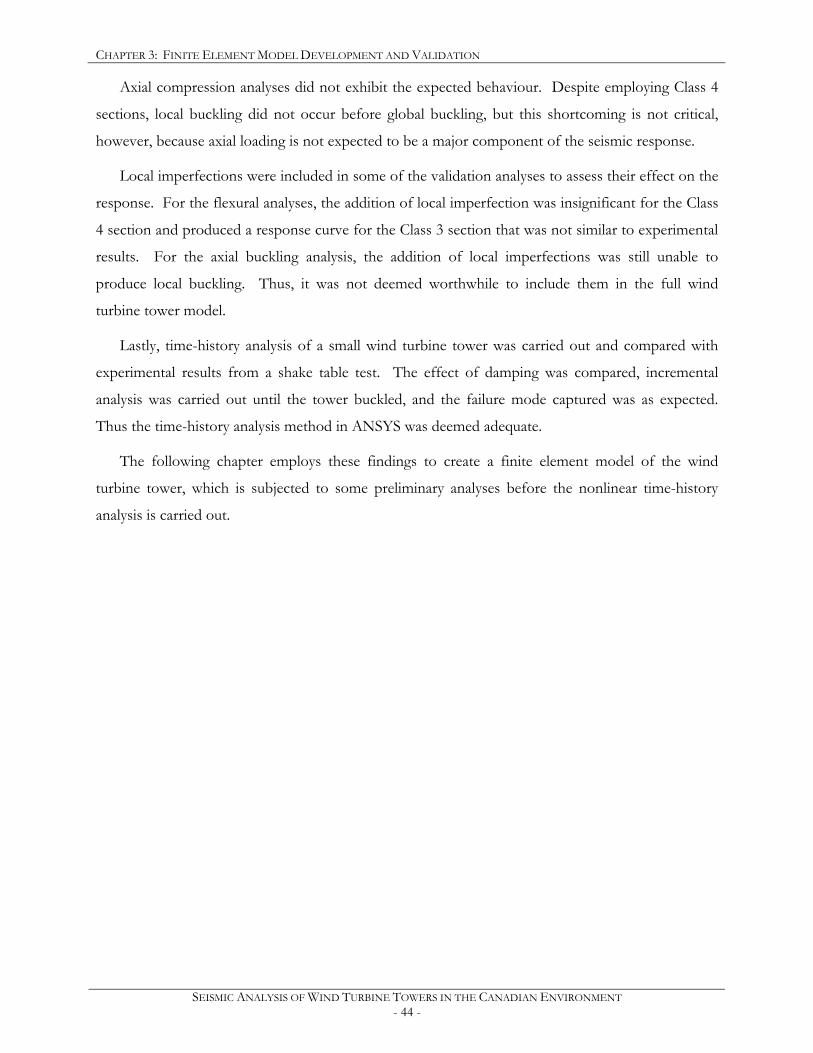
CHAPTER 3: FINITE ELEMENT MODEL DEVELOPMENT AND VALIDATION
SEISMIC ANALYSIS OF WIND TURBINE TOWERS IN THE CANADIAN ENVIRONMENT - 44 -
Axial compression analyses did not exhibit the expected behaviour. Despite employing Class 4
sections, local buckling did not occur before global buckling, but this shortcoming is not critical,
however, because axial loading is not expected to be a major component of the seismic response.
Local imperfections were included in some of the validation analyses to assess their effect on the
response. For the flexural analyses, the addition of local imperfection was insignificant for the Class
4 section and produced a response curve for the Class 3 section that was not similar to experimental
results. For the axial buckling analysis, the addition of local imperfections was still unable to
produce local buckling. Thus, it was not deemed worthwhile to include them in the full wind
turbine tower model.
Lastly, time-history analysis of a small wind turbine tower was carried out and compared with
experimental results from a shake table test. The effect of damping was compared, incremental
analysis was carried out until the tower buckled, and the failure mode captured was as expected.
Thus the time-history analysis method in ANSYS was deemed adequate.
The following chapter employs these findings to create a finite element model of the wind
turbine tower, which is subjected to some preliminary analyses before the nonlinear time-history
analysis is carried out.
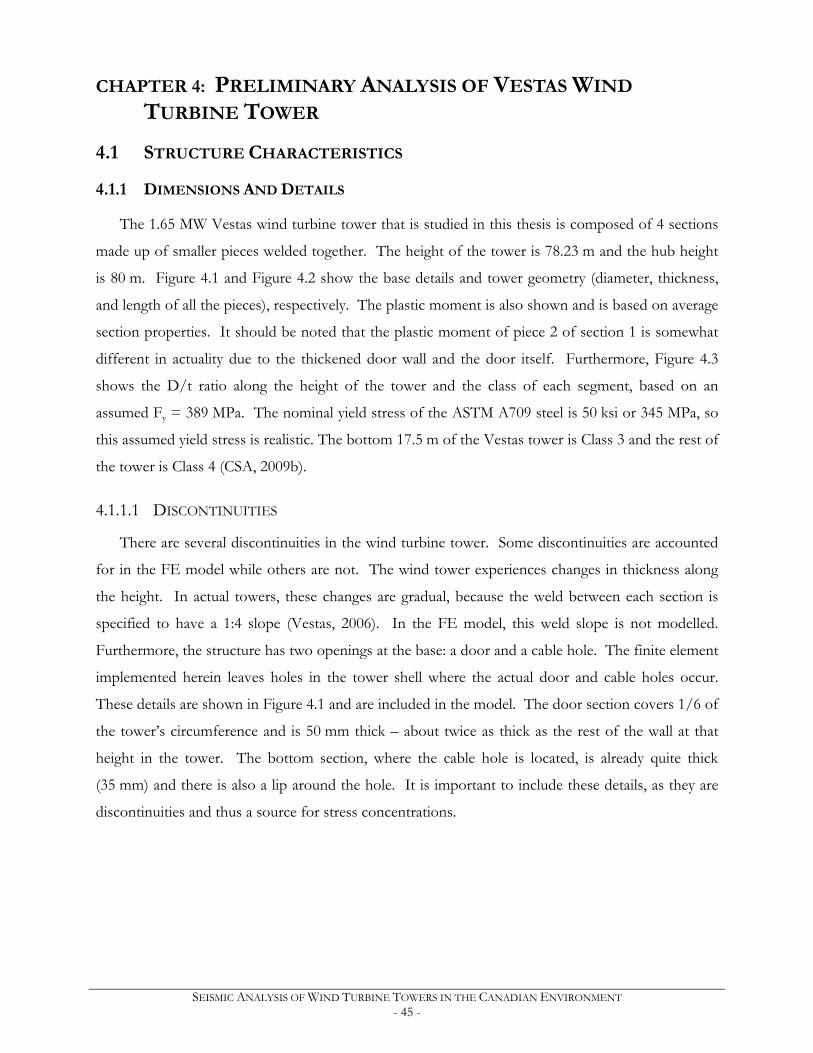
SEISMIC ANALYSIS OF WIND TURBINE TOWERS IN THE CANADIAN ENVIRONMENT - 45 -
CHAPTER 4: PRELIMINARY ANALYSIS OF VESTAS WIND
TURBINE TOWER
4.1 STRUCTURE CHARACTERISTICS
4.1.1 DIMENSIONS AND DETAILS
The 1.65 MW Vestas wind turbine tower that is studied in this thesis is composed of 4 sections
made up of smaller pieces welded together. The height of the tower is 78.23 m and the hub height
is 80 m. Figure 4.1 and Figure 4.2 show the base details and tower geometry (diameter, thickness,
and length of all the pieces), respectively. The plastic moment is also shown and is based on average
section properties. It should be noted that the plastic moment of piece 2 of section 1 is somewhat
different in actuality due to the thickened door wall and the door itself. Furthermore, Figure 4.3
shows the D/t ratio along the height of the tower and the class of each segment, based on an
assumed Fy = 389 MPa. The nominal yield stress of the ASTM A709 steel is 50 ksi or 345 MPa, so
this assumed yield stress is realistic. The bottom 17.5 m of the Vestas tower is Class 3 and the rest of
the tower is Class 4 (CSA, 2009b).
4.1.1.1 DISCONTINUITIES
There are several discontinuities in the wind turbine tower. Some discontinuities are accounted
for in the FE model while others are not. The wind tower experiences changes in thickness along
the height. In actual towers, these changes are gradual, because the weld between each section is
specified to have a 1:4 slope (Vestas, 2006). In the FE model, this weld slope is not modelled.
Furthermore, the structure has two openings at the base: a door and a cable hole. The finite element
implemented herein leaves holes in the tower shell where the actual door and cable holes occur.
These details are shown in Figure 4.1 and are included in the model. The door section covers 1/6 of
the tower’s circumference and is 50 mm thick – about twice as thick as the rest of the wall at that
height in the tower. The bottom section, where the cable hole is located, is already quite thick
(35 mm) and there is also a lip around the hole. It is important to include these details, as they are
discontinuities and thus a source for stress concentrations.
CHAPTER 4: PRELIMINARY ANALYSIS OF VESTAS WIND TURBINE TOWER
SEISMIC ANALYSIS OF WIND TURBINE TOWERS IN THE CANADIAN ENVIRONMENT - 46 -
(a) (b) (c)
Figure 4.1: Details at base of Vestas wind turbine tower (a) front view / door (b) side view door (c) back view / cable hole
CHAPTER 4: PRELIMINARY ANALYSIS OF VESTAS WIND TURBINE TOWER
SEISMIC ANALYSIS OF WIND TURBINE TOWERS IN THE CANADIAN ENVIRONMENT - 47 -
.
Figure 4.2: Wind turbine tower dimensions and layout (Vestas, 2006)
11 2000 18 42600
10 1441 14 39200
9 1442 10 29400
8 2318 10 31400
7 2311 11 37200
4 6 2305 11 40000
5 2299 11 42900
4 2293 12 50000
3 2286 12 53400
2 2280 12 56800
1 2359 13 65400
9 2460 13 67300
8 2480 13 67300
7 2480 13 67300
6 2480 13 67300
3 5 2480 13 67300
4 2480 14 72500
3 2480 14 72500
2 2480 15 77700
1 2580 16 82900
4 2535 16 82900
2 3 2480 17 88100
2 2480 17 88100
1 2585 18 93200
9 2480 19 98400
8 2480 19 98400
7 2480 20 103600
6 2480 21 108800
1 5 2480 21 108800
4 2967 22 114000
3 2968 23 119100
2 2980 24 124300
1 1101 35 181300
78230 2282
76230 2650
74789 2718
73347 2786
71029 2895
68718 3004
66413 3112
64114 3220
61821 3328
59535 3436
57255 3543
54896 3650
52436
49956
47476
44996
42516
40036
37556
35076
32496 3650
29961
27481
25001
22416 3650
19936
17456
14976
12496
10016
7049
4081
1101
0 3650
height from Dm piece
base (mm) (mm) length (mm)
thickness (mm)
Mp (kNm) piece section
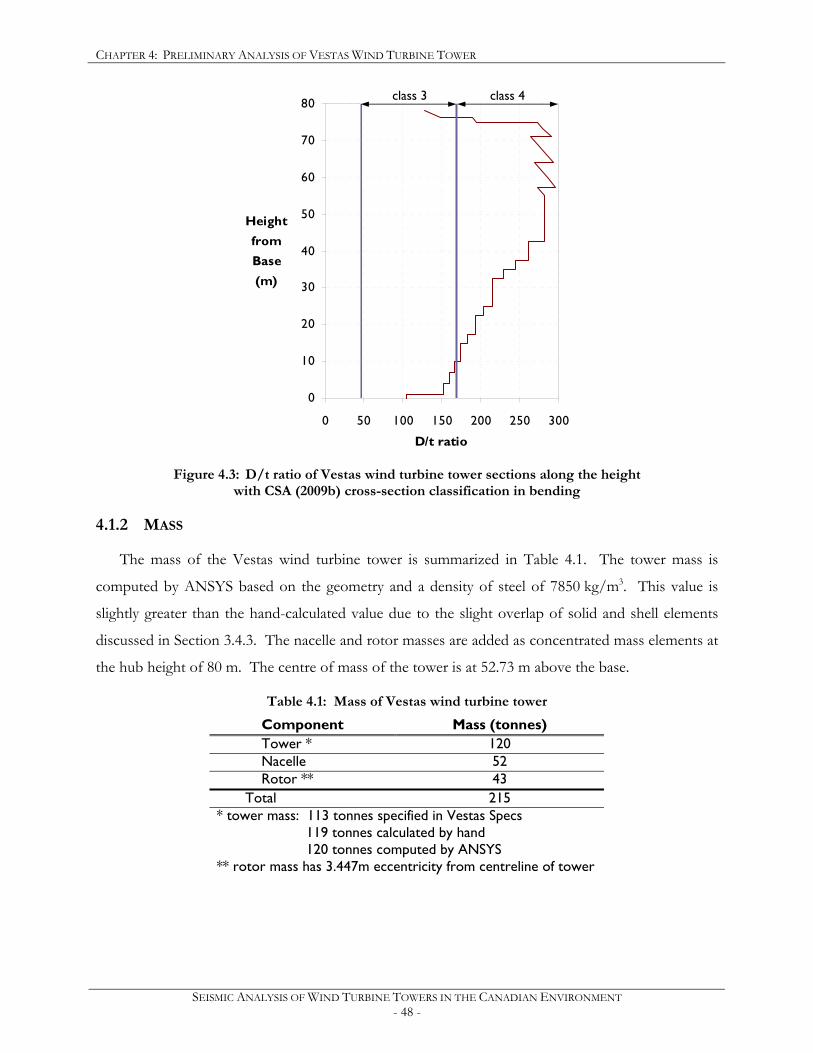
CHAPTER 4: PRELIMINARY ANALYSIS OF VESTAS WIND TURBINE TOWER
SEISMIC ANALYSIS OF WIND TURBINE TOWERS IN THE CANADIAN ENVIRONMENT - 48 -
0
10
20
30
40
50
60
70
80
0 50 100 150 200 250 300
D/t ratio
Height from Base (m)
Figure 4.3: D/t ratio of Vestas wind turbine tower sections along the height
with CSA (2009b) cross-section classification in bending
4.1.2 MASS
The mass of the Vestas wind turbine tower is summarized in Table 4.1. The tower mass is
computed by ANSYS based on the geometry and a density of steel of 7850 kg/m3. This value is
slightly greater than the hand-calculated value due to the slight overlap of solid and shell elements
discussed in Section 3.4.3. The nacelle and rotor masses are added as concentrated mass elements at
the hub height of 80 m. The centre of mass of the tower is at 52.73 m above the base.
Table 4.1: Mass of Vestas wind turbine tower
Component Mass (tonnes) Tower * 120 Nacelle 52 Rotor ** 43 Total 215 * tower mass: 113 tonnes specified in Vestas Specs 119 tonnes calculated by hand 120 tonnes computed by ANSYS ** rotor mass has 3.447m eccentricity from centreline of tower
class 3 class 4
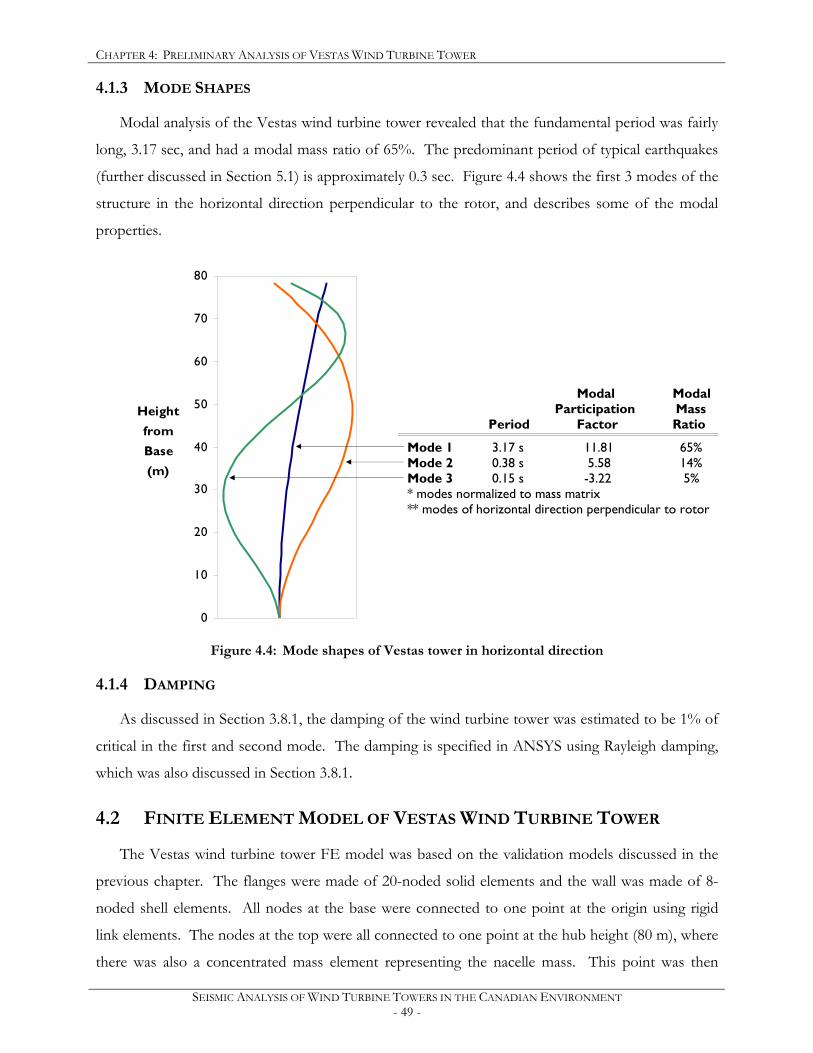
CHAPTER 4: PRELIMINARY ANALYSIS OF VESTAS WIND TURBINE TOWER
SEISMIC ANALYSIS OF WIND TURBINE TOWERS IN THE CANADIAN ENVIRONMENT - 49 -
4.1.3 MODE SHAPES
Modal analysis of the Vestas wind turbine tower revealed that the fundamental period was fairly
long, 3.17 sec, and had a modal mass ratio of 65%. The predominant period of typical earthquakes
(further discussed in Section 5.1) is approximately 0.3 sec. Figure 4.4 shows the first 3 modes of the
structure in the horizontal direction perpendicular to the rotor, and describes some of the modal
properties.
0
10
20
30
40
50
60
70
80
Height from Base (m)
Figure 4.4: Mode shapes of Vestas tower in horizontal direction
4.1.4 DAMPING
As discussed in Section 3.8.1, the damping of the wind turbine tower was estimated to be 1% of
critical in the first and second mode. The damping is specified in ANSYS using Rayleigh damping,
which was also discussed in Section 3.8.1.
4.2 FINITE ELEMENT MODEL OF VESTAS WIND TURBINE TOWER
The Vestas wind turbine tower FE model was based on the validation models discussed in the
previous chapter. The flanges were made of 20-noded solid elements and the wall was made of 8-
noded shell elements. All nodes at the base were connected to one point at the origin using rigid
link elements. The nodes at the top were all connected to one point at the hub height (80 m), where
there was also a concentrated mass element representing the nacelle mass. This point was then
Modal Modal Participation Mass Period Factor Ratio
Mode 1 3.17 s 11.81 65% Mode 2 0.38 s 5.58 14% Mode 3 0.15 s -3.22 5% * modes normalized to mass matrix ** modes of horizontal direction perpendicular to rotor
CHAPTER 4: PRELIMINARY ANALYSIS OF VESTAS WIND TURBINE TOWER
SEISMIC ANALYSIS OF WIND TURBINE TOWERS IN THE CANADIAN ENVIRONMENT - 50 -
rigidly connected to another point mass at the same height, but 3.447 m away from the centreline of
the tower. This point represented the rotor mass and is shown at the top of Figure 4.5.
The mesh of the tower had an aspect ratio of 1 for the bottom section of the tower. Above the
bottom section, the aspect ratio was 3, but the mesh was refined as it approached the flanges such
that the ratio would be 1 near the flanges. The mesh had a highly variable element size-to-thickness
ratio (se/t) due to the variation in thickness. The mesh is shown in Figure 4.5, along with the
approximate se/t and the aspect ratio along the height. The element size was taken as the smaller
dimension of the elements. The element size-to-thickness ratio at the base was slightly higher than
the ratio decided upon in the previous chapter, but it was verified that this mesh was still able to
capture the desired buckling behaviour of the tower.
The material properties employed for the subsequent analyses are those having gradual yielding,
as discussed in Section 3.3.

CHAPTER 4: PRELIMINARY ANALYSIS OF VESTAS WIND TURBINE TOWER
SEISMIC ANALYSIS OF WIND TURBINE TOWERS IN THE CANADIAN ENVIRONMENT - 51 -
Figure 4.5: Mesh of Vestas wind turbine tower
se/t se/t
11 11
16 16
24
24
23
24
25
23
24
25
24
24
24
24
24
24
24
24
23 23
23
21 21
20
20 20
19 19
19
18 18
17 17
17
16
15 15
15
14
14 13
13
9 9
aspect ratio ≈ 1
aspect ratio ≈ 2
aspect ratio ≈ 1
aspect ratio ≈ 3
aspect ratio ≈ 3
aspect ratio ≈ 1
aspect ratio ≈ 1
rotor mass element nacelle mass element
CHAPTER 4: PRELIMINARY ANALYSIS OF VESTAS WIND TURBINE TOWER
SEISMIC ANALYSIS OF WIND TURBINE TOWERS IN THE CANADIAN ENVIRONMENT - 52 -
4.3 PUSHOVER ANALYSIS
4.3.1 BACKGROUND
Pushover analysis is a simplified inelastic analytical procedure that was developed to estimate the
seismic response of structures. Elastic analysis does not accurately predict forces and deformations
after a structure begins to be damaged during an earthquake. Inelastic time-history analysis is
considered one of the most realistic analytical approaches to evaluate the performance of a structure
during seismic activity, but it is also very complex and time-consuming (Tso and Moghadam, 1998).
Thus, pushover analysis was developed as the compromise between the two. There are several uses
for pushover analysis: to identify regions where inelastic deformations are expected to be high, to
identify strength irregularities, to obtain realistic estimations of force demands, to predict the
sequence of failure of the structural components, and to determine the capacity curve of the
structure (Antoniou and Pinho, 2004). There are also several interpretations on how to carry out
this type of analysis.
The conventional method is to apply and monotonically increase a predefined lateral load
pattern. This pattern is kept constant throughout the analysis. This procedure has been criticized
for certain limitations, such as its inability to account for the progressive stiffness degradation, which
leads to a significant increase in the period of the structure and in its modal characteristics.
Furthermore, it has been shown that deformation predictions can be quite inaccurate if higher
modes are important or if the structure is loaded heavily into the non-linear post-yield range
(Antoniou and Pinho, 2004). Another problem with conventional pushover analysis is that it does
not account for all sources of energy dissipation associated with a dynamic response, since it is a
static method. Only material straining is captured, while kinetic energy, viscous damping, and
duration effects are neglected.
Attempting to overcome these limitations, several pushover methods considering higher mode
effects have been developed: multi-modal pushover (MMP) (Sasaki et al., 1998), pushover results
combination (PRC) (Moghadam, 2002), modal pushover analysis (MPA) (Chopra and Goel 2002),
consecutive modal pushover (CMP) (Poursha et al., 2009). All the aforementioned higher mode
methods require several pushover analyses to be carried out corresponding to the different modes,
and then combine the results.
There are also a few methods that take the higher modes into account by determining an
invariant load pattern based on the higher mode shapes. The upper-bound pushover analysis
procedure (Jan et al., 2004) determines the load pattern by combining the first two modes based on

CHAPTER 4: PRELIMINARY ANALYSIS OF VESTAS WIND TURBINE TOWER
SEISMIC ANALYSIS OF WIND TURBINE TOWERS IN THE CANADIAN ENVIRONMENT - 53 -
their modal participation factors, and the design elastic displacement response spectrum.
Furthermore, the method of modal combinations (MMC) (Kalkan and Kunnath, 2004) is similar to
the upper-bound method, but allows the inclusion of more modes and uses the elastic acceleration
spectrum. The simplest multimode load pattern is described by Barros and Almeida (2005) and is
obtained by the linear addition of the desired number of mode shapes scaled by their respective
modal participation factors.
The methods discussed above that take into account higher mode effects do not consider
damage accumulation and the resulting modification of the modal parameters. This has led to the
development of many fully adaptive methods, where the load distribution changes as the structure is
deformed. Unfortunately, many of these methods have been shown to provide only a slight increase
in accuracy, while demanding huge computational efforts (Antoniou and Pinho, 2004). At this level
of complexity and computational demand, it has been argued that it may be easier and more accurate
to carry out a non-linear time history analysis.
4.3.2 PUSHOVER ANALYSIS OF WIND TURBINE TOWER
Most of the pushover procedures discussed, even the conventional ones, have been developed
and validated for buildings and bridges. None have been tailored for a structure similar to a wind
turbine tower. As such, a very complex pushover analysis was not carried out. Instead, a multimode
load pattern (Barros and Almeida, 2005) was used to determine the capacity of the tower and to get
a rough idea of how the wind turbine tower structure behaves. The load pattern consisted of a
linear combination of the first three modes in the horizontal direction, as follows:
iiLP ϕα∑= (Equation 4.1)
where LP = load pattern
iα = modal participation factor of mode i
iϕ = mode shape of mode i, normalized to mass matrix
The resulting load pattern using the first three modes in the horizontal direction is shown in
Figure 4.7. The resultant of this force pattern acts at 45.9 m above the ground. The pushover
analysis was carried out at 22.5° intervals around the circumference of the tower (Figure 4.6) to
determine the weakest angle of incidence. Additionally, a pushover analysis was carried out without
modelling the door and cable hole at the bottom of the tower to determine if those details are
indeed necessary in the model of the Vestas wind turbine tower.
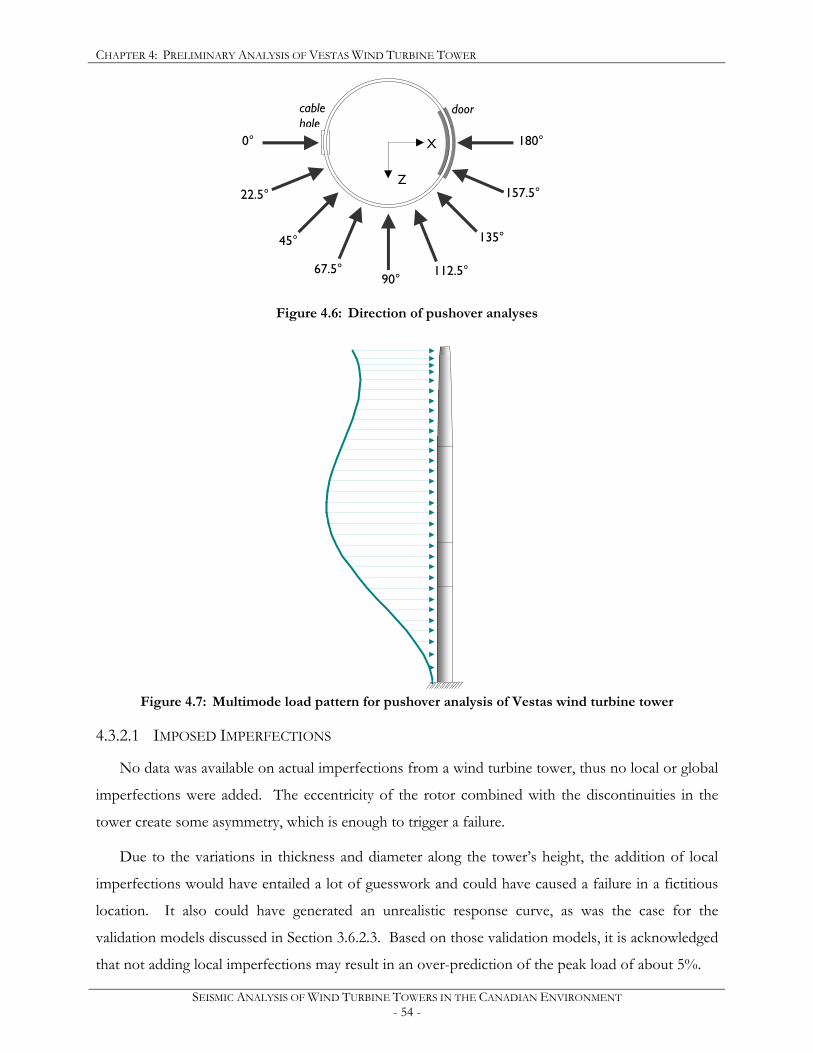
CHAPTER 4: PRELIMINARY ANALYSIS OF VESTAS WIND TURBINE TOWER
SEISMIC ANALYSIS OF WIND TURBINE TOWERS IN THE CANADIAN ENVIRONMENT - 54 -
Figure 4.6: Direction of pushover analyses
Figure 4.7: Multimode load pattern for pushover analysis of Vestas wind turbine tower
4.3.2.1 IMPOSED IMPERFECTIONS
No data was available on actual imperfections from a wind turbine tower, thus no local or global
imperfections were added. The eccentricity of the rotor combined with the discontinuities in the
tower create some asymmetry, which is enough to trigger a failure.
Due to the variations in thickness and diameter along the tower’s height, the addition of local
imperfections would have entailed a lot of guesswork and could have caused a failure in a fictitious
location. It also could have generated an unrealistic response curve, as was the case for the
validation models discussed in Section 3.6.2.3. Based on those validation models, it is acknowledged
that not adding local imperfections may result in an over-prediction of the peak load of about 5%.
0°
22.5°
45°
67.5° 90°
112.5°
135°
157.5°
180°
door cable hole
X
Z
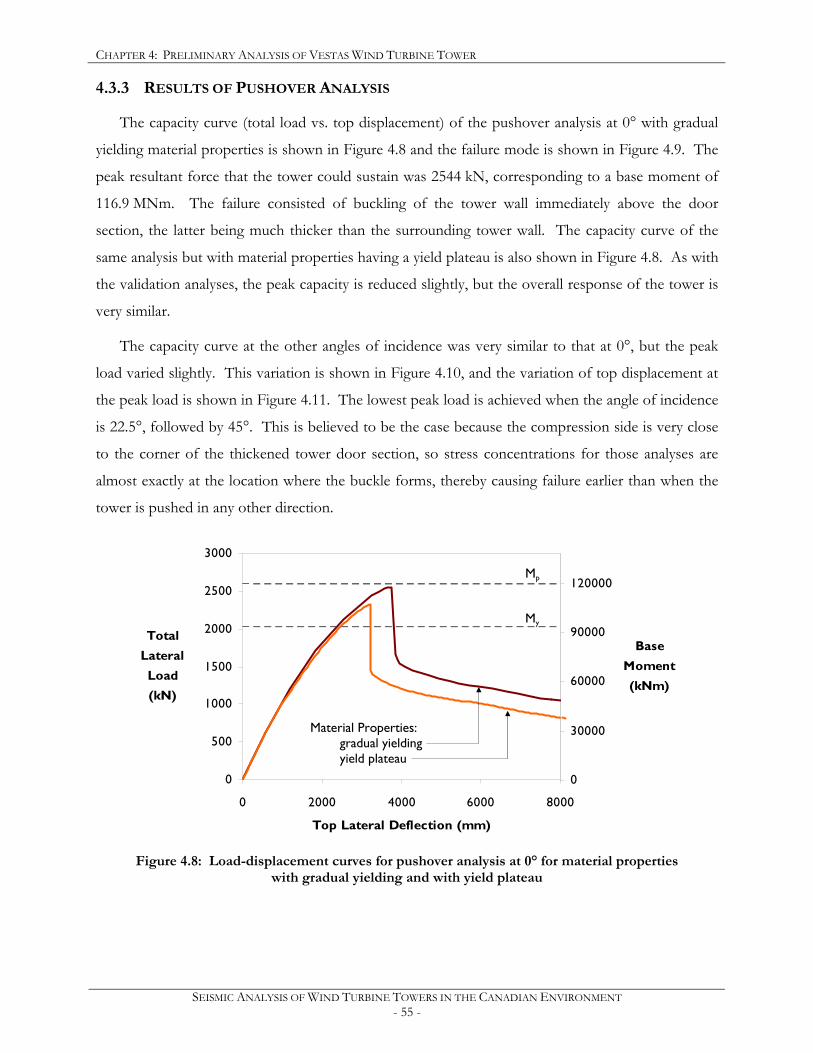
CHAPTER 4: PRELIMINARY ANALYSIS OF VESTAS WIND TURBINE TOWER
SEISMIC ANALYSIS OF WIND TURBINE TOWERS IN THE CANADIAN ENVIRONMENT - 55 -
0
30000
60000
90000
120000
Base Moment(kNm)
4.3.3 RESULTS OF PUSHOVER ANALYSIS
The capacity curve (total load vs. top displacement) of the pushover analysis at 0° with gradual
yielding material properties is shown in Figure 4.8 and the failure mode is shown in Figure 4.9. The
peak resultant force that the tower could sustain was 2544 kN, corresponding to a base moment of
116.9 MNm. The failure consisted of buckling of the tower wall immediately above the door
section, the latter being much thicker than the surrounding tower wall. The capacity curve of the
same analysis but with material properties having a yield plateau is also shown in Figure 4.8. As with
the validation analyses, the peak capacity is reduced slightly, but the overall response of the tower is
very similar.
The capacity curve at the other angles of incidence was very similar to that at 0°, but the peak
load varied slightly. This variation is shown in Figure 4.10, and the variation of top displacement at
the peak load is shown in Figure 4.11. The lowest peak load is achieved when the angle of incidence
is 22.5°, followed by 45°. This is believed to be the case because the compression side is very close
to the corner of the thickened tower door section, so stress concentrations for those analyses are
almost exactly at the location where the buckle forms, thereby causing failure earlier than when the
tower is pushed in any other direction.
0
500
1000
1500
2000
2500
3000
0 2000 4000 6000 8000
Top Lateral Deflection (mm)
Total LateralLoad (kN)
Figure 4.8: Load-displacement curves for pushover analysis at 0° for material properties
with gradual yielding and with yield plateau
Mp
My
Material Properties: gradual yielding yield plateau
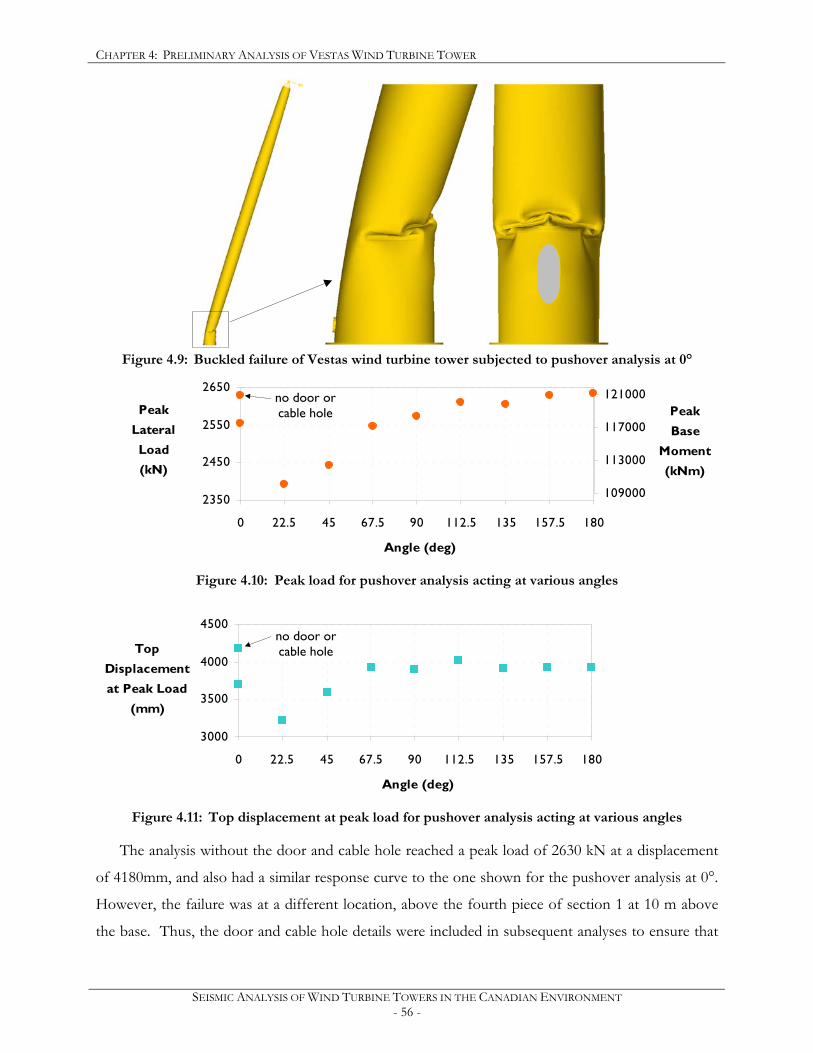
CHAPTER 4: PRELIMINARY ANALYSIS OF VESTAS WIND TURBINE TOWER
SEISMIC ANALYSIS OF WIND TURBINE TOWERS IN THE CANADIAN ENVIRONMENT - 56 -
109000
113000
117000
121000Peak Base
Moment (kNm)
Figure 4.9: Buckled failure of Vestas wind turbine tower subjected to pushover analysis at 0°
2350
2450
2550
2650
0 22.5 45 67.5 90 112.5 135 157.5 180
Angle (deg)
Peak LateralLoad (kN)
Figure 4.10: Peak load for pushover analysis acting at various angles
3000
3500
4000
4500
0 22.5 45 67.5 90 112.5 135 157.5 180
Angle (deg)
Top Displacement at Peak Load
(mm)
Figure 4.11: Top displacement at peak load for pushover analysis acting at various angles
The analysis without the door and cable hole reached a peak load of 2630 kN at a displacement
of 4180mm, and also had a similar response curve to the one shown for the pushover analysis at 0°.
However, the failure was at a different location, above the fourth piece of section 1 at 10 m above
the base. Thus, the door and cable hole details were included in subsequent analyses to ensure that
no door or cable hole
no door or cable hole
CHAPTER 4: PRELIMINARY ANALYSIS OF VESTAS WIND TURBINE TOWER
SEISMIC ANALYSIS OF WIND TURBINE TOWERS IN THE CANADIAN ENVIRONMENT - 57 -
the location of local buckling failures occurs according to the details of the actual wind turbine
tower.
4.3.3.1 INTERPRETATION OF PUSHOVER ANALYSIS RESULTS
The maximum base moment that can be sustained by the Vestas wind turbine tower before
collapse is 110 MNm, as approximated by the pushover analysis. The theoretically-calculated yield
moment of the section that failed is 93 MNm, and the plastic moment is 119 MNm. Thus, the
moment reached by the tower was 18% higher than the yield moment and 8% lower than the plastic
moment. This behaviour was expected because the bottom 17 m of the tower, which is where the
failure occurred, is Class 3 in bending.
Yielding of the material around the door opening begins at a top displacement of about
1900 mm, and yielding of the tower wall away from the openings begins at a top displacement of
2400 mm. Thus, for subsequent seismic analyses, residual displacements must be evaluated if the
top relative displacement is greater than 1900 mm.
4.4 SUMMARY
The Vestas wind turbine tower was presented in detail and modelling decisions were discussed.
Discontinuities in the tower were considered sufficiently asymmetric to trigger failures in the tower,
and additional imperfections were not added. The tower was subjected to a pushover analysis with a
multimode load pattern, and it was decided to include the door and cable hole details at the bottom
of the tower in order to capture any failure modes that may be affected by those details. The onset
of yielding at a top displacement of 1900 mm (or 2.4% of the hub height of 80 m) suggests that any
seismic excitation that produces a top displacement greater than that value will result in permanent
residual deformations. The following chapter investigates the response of the tower subjected to a
suite of ground motion records and further verifies the conclusions of the pushover analyses.
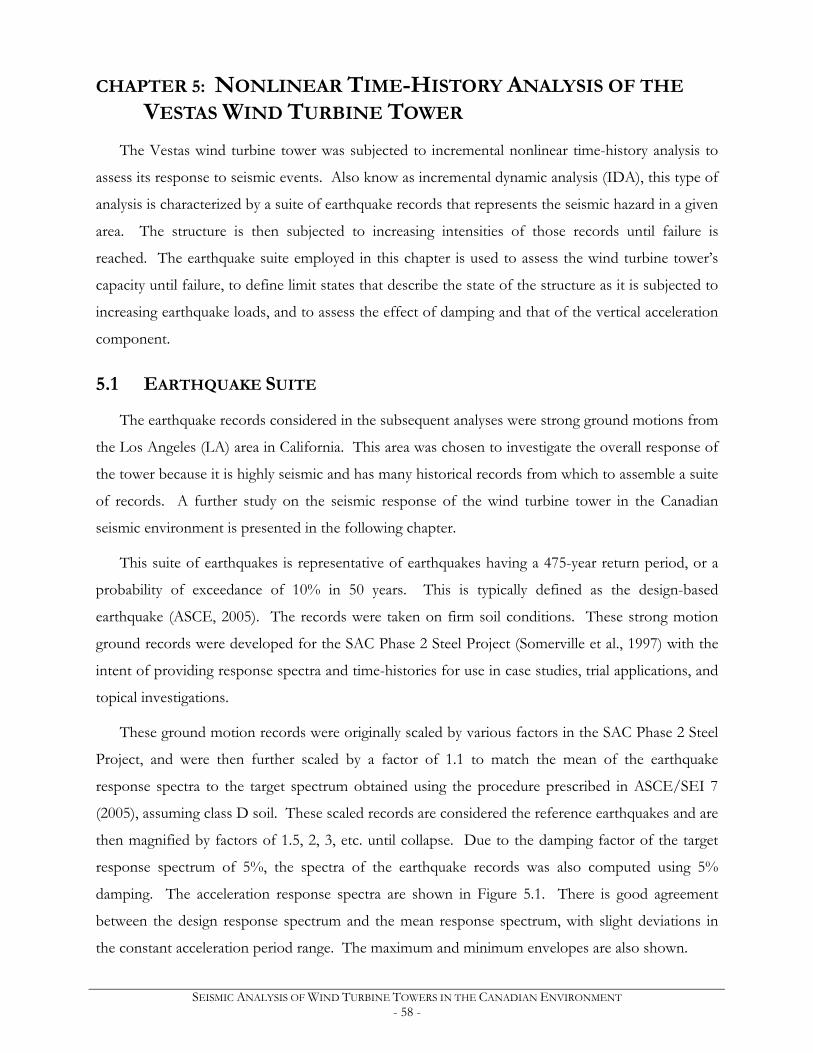
SEISMIC ANALYSIS OF WIND TURBINE TOWERS IN THE CANADIAN ENVIRONMENT - 58 -
CHAPTER 5: NONLINEAR TIME-HISTORY ANALYSIS OF THE
VESTAS WIND TURBINE TOWER
The Vestas wind turbine tower was subjected to incremental nonlinear time-history analysis to
assess its response to seismic events. Also know as incremental dynamic analysis (IDA), this type of
analysis is characterized by a suite of earthquake records that represents the seismic hazard in a given
area. The structure is then subjected to increasing intensities of those records until failure is
reached. The earthquake suite employed in this chapter is used to assess the wind turbine tower’s
capacity until failure, to define limit states that describe the state of the structure as it is subjected to
increasing earthquake loads, and to assess the effect of damping and that of the vertical acceleration
component.
5.1 EARTHQUAKE SUITE
The earthquake records considered in the subsequent analyses were strong ground motions from
the Los Angeles (LA) area in California. This area was chosen to investigate the overall response of
the tower because it is highly seismic and has many historical records from which to assemble a suite
of records. A further study on the seismic response of the wind turbine tower in the Canadian
seismic environment is presented in the following chapter.
This suite of earthquakes is representative of earthquakes having a 475-year return period, or a
probability of exceedance of 10% in 50 years. This is typically defined as the design-based
earthquake (ASCE, 2005). The records were taken on firm soil conditions. These strong motion
ground records were developed for the SAC Phase 2 Steel Project (Somerville et al., 1997) with the
intent of providing response spectra and time-histories for use in case studies, trial applications, and
topical investigations.
These ground motion records were originally scaled by various factors in the SAC Phase 2 Steel
Project, and were then further scaled by a factor of 1.1 to match the mean of the earthquake
response spectra to the target spectrum obtained using the procedure prescribed in ASCE/SEI 7
(2005), assuming class D soil. These scaled records are considered the reference earthquakes and are
then magnified by factors of 1.5, 2, 3, etc. until collapse. Due to the damping factor of the target
response spectrum of 5%, the spectra of the earthquake records was also computed using 5%
damping. The acceleration response spectra are shown in Figure 5.1. There is good agreement
between the design response spectrum and the mean response spectrum, with slight deviations in
the constant acceleration period range. The maximum and minimum envelopes are also shown.
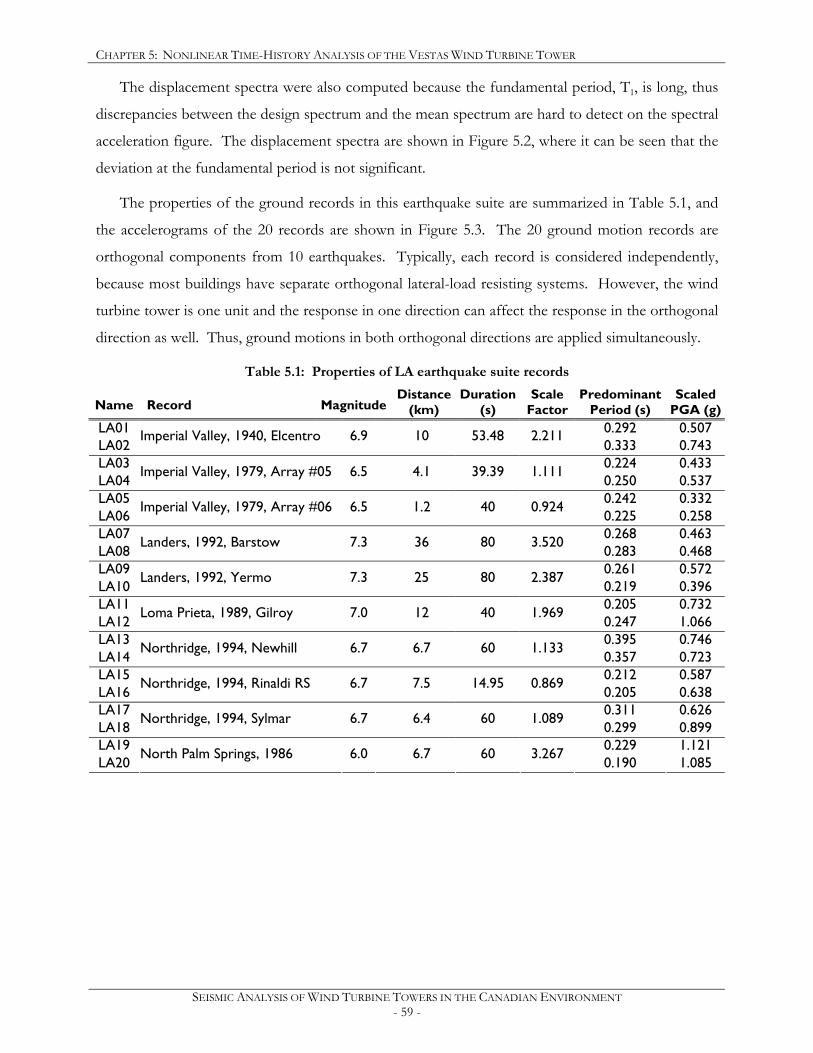
CHAPTER 5: NONLINEAR TIME-HISTORY ANALYSIS OF THE VESTAS WIND TURBINE TOWER
SEISMIC ANALYSIS OF WIND TURBINE TOWERS IN THE CANADIAN ENVIRONMENT - 59 -
The displacement spectra were also computed because the fundamental period, T1, is long, thus
discrepancies between the design spectrum and the mean spectrum are hard to detect on the spectral
acceleration figure. The displacement spectra are shown in Figure 5.2, where it can be seen that the
deviation at the fundamental period is not significant.
The properties of the ground records in this earthquake suite are summarized in Table 5.1, and
the accelerograms of the 20 records are shown in Figure 5.3. The 20 ground motion records are
orthogonal components from 10 earthquakes. Typically, each record is considered independently,
because most buildings have separate orthogonal lateral-load resisting systems. However, the wind
turbine tower is one unit and the response in one direction can affect the response in the orthogonal
direction as well. Thus, ground motions in both orthogonal directions are applied simultaneously.
Table 5.1: Properties of LA earthquake suite records
Name
Record
Magnitude
Distance (km)
Duration (s)
Scale Factor
Predominant Period (s)
Scaled PGA (g)
LA01 0.292 0.507 LA02
Imperial Valley, 1940, Elcentro 6.9 10 53.48 2.211 0.333 0.743
LA03 0.224 0.433 LA04
Imperial Valley, 1979, Array #05 6.5 4.1 39.39 1.111 0.250 0.537
LA05 0.242 0.332 LA06
Imperial Valley, 1979, Array #06 6.5 1.2 40 0.924 0.225 0.258
LA07 0.268 0.463 LA08
Landers, 1992, Barstow 7.3 36 80 3.520 0.283 0.468
LA09 0.261 0.572 LA10
Landers, 1992, Yermo 7.3 25 80 2.387 0.219 0.396
LA11 0.205 0.732 LA12
Loma Prieta, 1989, Gilroy 7.0 12 40 1.969 0.247 1.066
LA13 0.395 0.746 LA14
Northridge, 1994, Newhill 6.7 6.7 60 1.133 0.357 0.723
LA15 0.212 0.587 LA16
Northridge, 1994, Rinaldi RS 6.7 7.5 14.95 0.869 0.205 0.638
LA17 0.311 0.626 LA18
Northridge, 1994, Sylmar 6.7 6.4 60 1.089 0.299 0.899
LA19 0.229 1.121 LA20
North Palm Springs, 1986 6.0 6.7 60 3.267 0.190 1.085
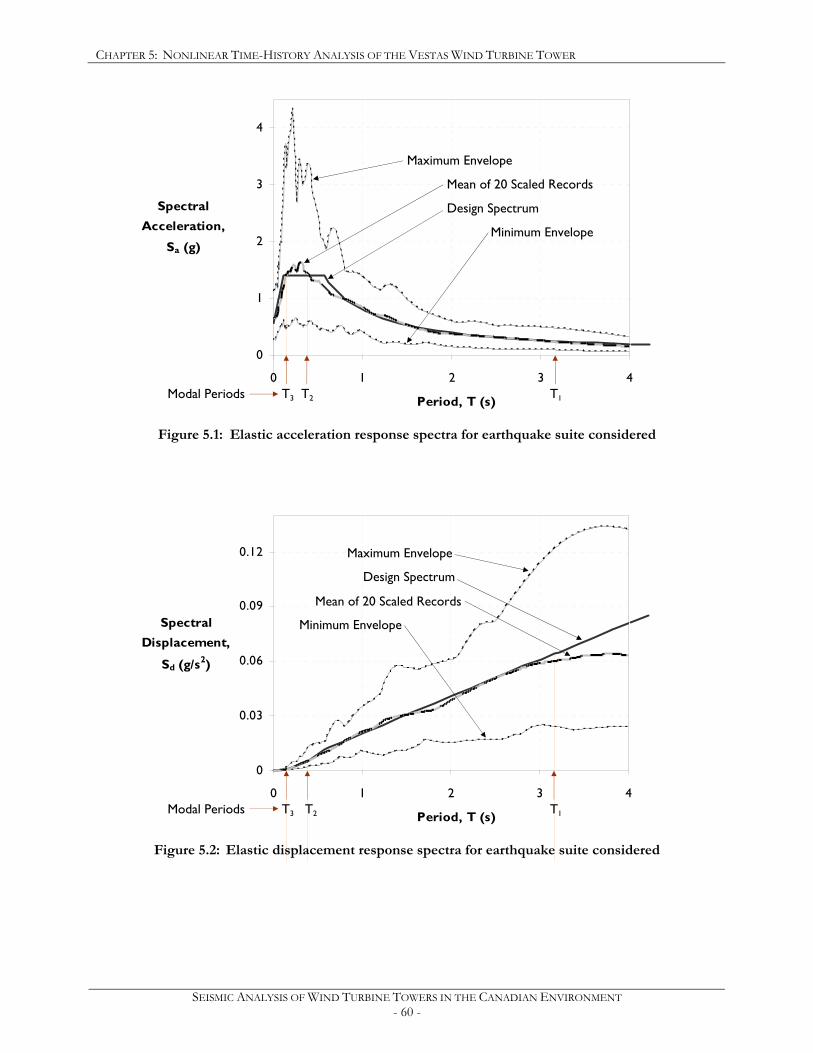
CHAPTER 5: NONLINEAR TIME-HISTORY ANALYSIS OF THE VESTAS WIND TURBINE TOWER
SEISMIC ANALYSIS OF WIND TURBINE TOWERS IN THE CANADIAN ENVIRONMENT - 60 -
0
1
2
3
4
0 1 2 3 4
Period, T (s)
Spectral Acceleration,
Sa (g)
Figure 5.1: Elastic acceleration response spectra for earthquake suite considered
0
0.03
0.06
0.09
0.12
0 1 2 3 4
Period, T (s)
Spectral Displacement,
Sd (g/s2)
Figure 5.2: Elastic displacement response spectra for earthquake suite considered
Maximum Envelope
Mean of 20 Scaled Records
Minimum Envelope
Design Spectrum
Modal Periods T3 T2 T1
Maximum Envelope
Mean of 20 Scaled Records
Design Spectrum
Minimum Envelope
Modal Periods T3 T2 T1
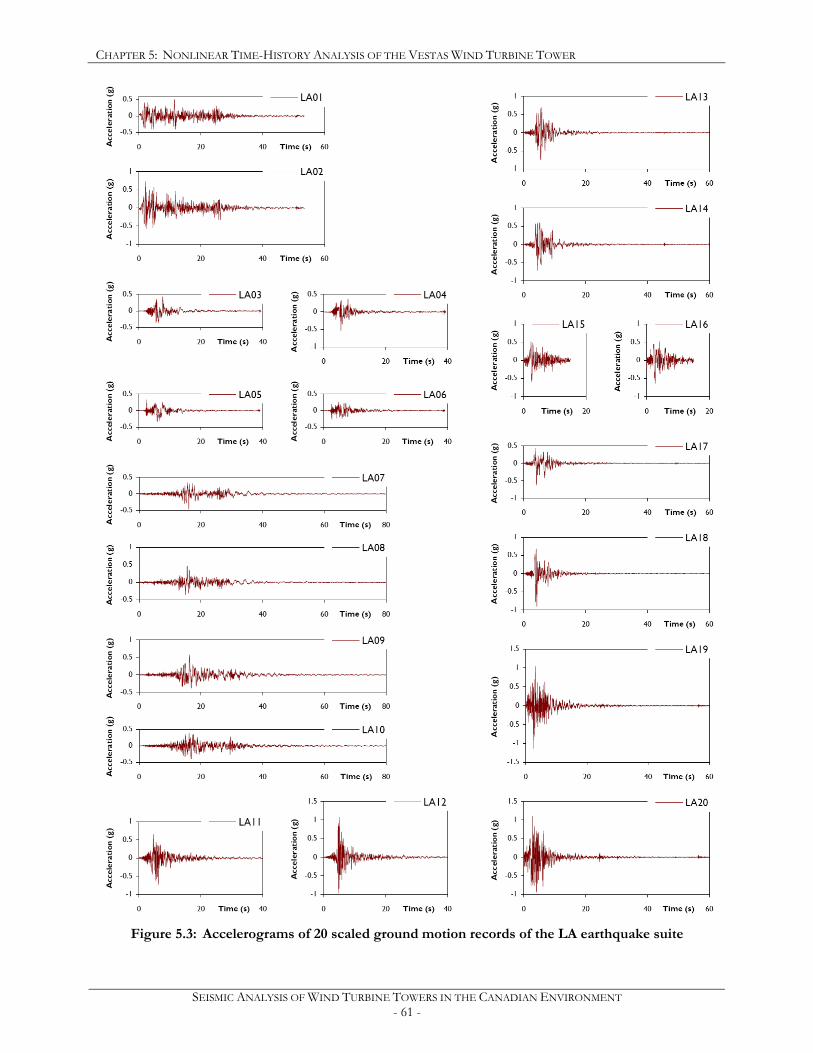
CHAPTER 5: NONLINEAR TIME-HISTORY ANALYSIS OF THE VESTAS WIND TURBINE TOWER
SEISMIC ANALYSIS OF WIND TURBINE TOWERS IN THE CANADIAN ENVIRONMENT - 61 -
Figure 5.3: Accelerograms of 20 scaled ground motion records of the LA earthquake suite
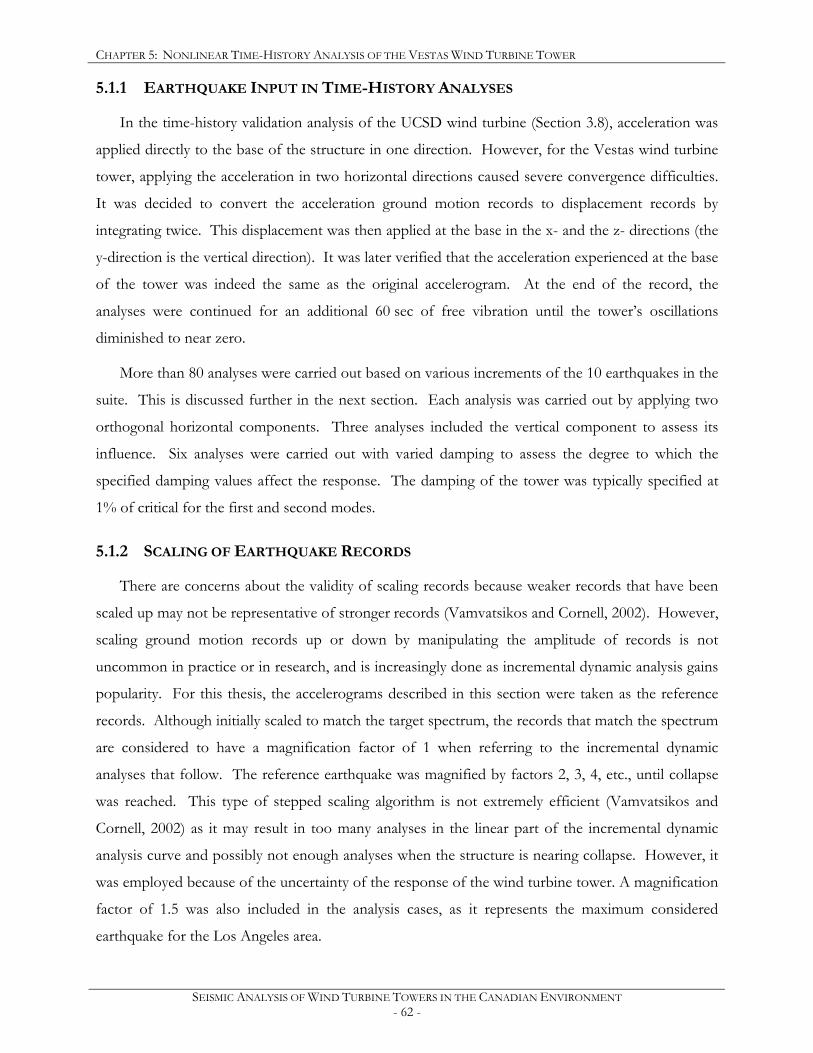
CHAPTER 5: NONLINEAR TIME-HISTORY ANALYSIS OF THE VESTAS WIND TURBINE TOWER
SEISMIC ANALYSIS OF WIND TURBINE TOWERS IN THE CANADIAN ENVIRONMENT - 62 -
5.1.1 EARTHQUAKE INPUT IN TIME-HISTORY ANALYSES
In the time-history validation analysis of the UCSD wind turbine (Section 3.8), acceleration was
applied directly to the base of the structure in one direction. However, for the Vestas wind turbine
tower, applying the acceleration in two horizontal directions caused severe convergence difficulties.
It was decided to convert the acceleration ground motion records to displacement records by
integrating twice. This displacement was then applied at the base in the x- and the z- directions (the
y-direction is the vertical direction). It was later verified that the acceleration experienced at the base
of the tower was indeed the same as the original accelerogram. At the end of the record, the
analyses were continued for an additional 60 sec of free vibration until the tower’s oscillations
diminished to near zero.
More than 80 analyses were carried out based on various increments of the 10 earthquakes in the
suite. This is discussed further in the next section. Each analysis was carried out by applying two
orthogonal horizontal components. Three analyses included the vertical component to assess its
influence. Six analyses were carried out with varied damping to assess the degree to which the
specified damping values affect the response. The damping of the tower was typically specified at
1% of critical for the first and second modes.
5.1.2 SCALING OF EARTHQUAKE RECORDS
There are concerns about the validity of scaling records because weaker records that have been
scaled up may not be representative of stronger records (Vamvatsikos and Cornell, 2002). However,
scaling ground motion records up or down by manipulating the amplitude of records is not
uncommon in practice or in research, and is increasingly done as incremental dynamic analysis gains
popularity. For this thesis, the accelerograms described in this section were taken as the reference
records. Although initially scaled to match the target spectrum, the records that match the spectrum
are considered to have a magnification factor of 1 when referring to the incremental dynamic
analyses that follow. The reference earthquake was magnified by factors 2, 3, 4, etc., until collapse
was reached. This type of stepped scaling algorithm is not extremely efficient (Vamvatsikos and
Cornell, 2002) as it may result in too many analyses in the linear part of the incremental dynamic
analysis curve and possibly not enough analyses when the structure is nearing collapse. However, it
was employed because of the uncertainty of the response of the wind turbine tower. A magnification
factor of 1.5 was also included in the analysis cases, as it represents the maximum considered
earthquake for the Los Angeles area.
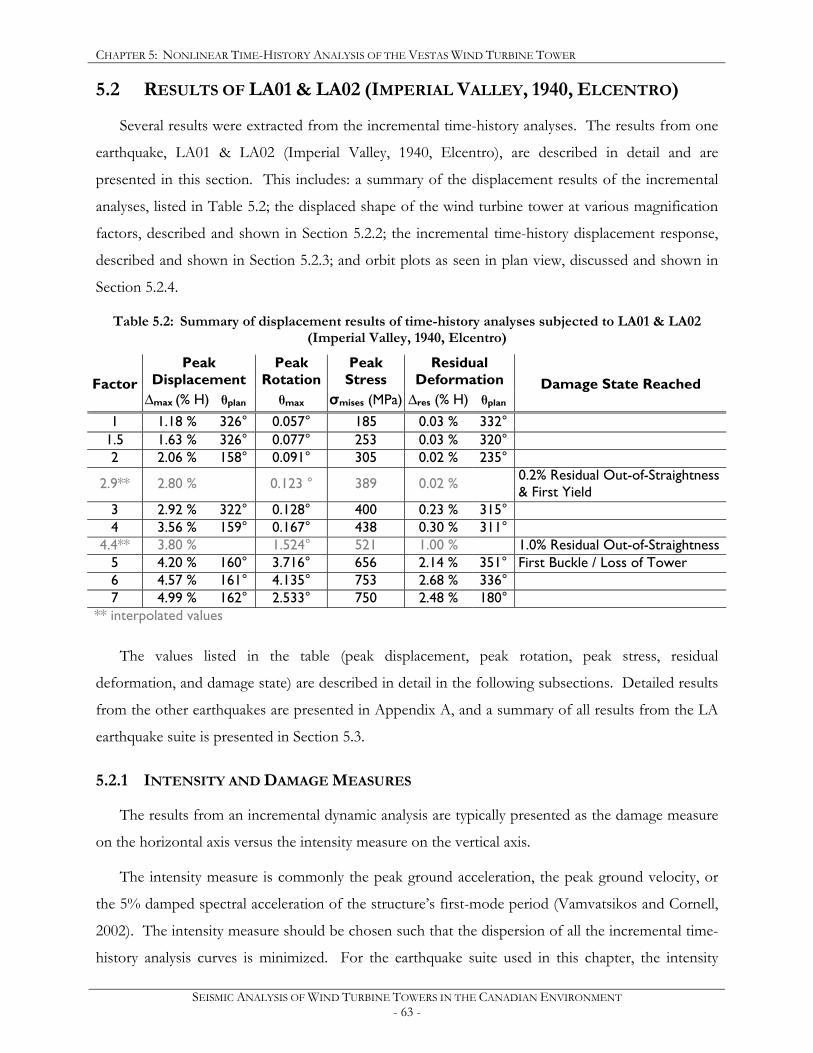
CHAPTER 5: NONLINEAR TIME-HISTORY ANALYSIS OF THE VESTAS WIND TURBINE TOWER
SEISMIC ANALYSIS OF WIND TURBINE TOWERS IN THE CANADIAN ENVIRONMENT - 63 -
5.2 RESULTS OF LA01 & LA02 (IMPERIAL VALLEY, 1940, ELCENTRO)
Several results were extracted from the incremental time-history analyses. The results from one
earthquake, LA01 & LA02 (Imperial Valley, 1940, Elcentro), are described in detail and are
presented in this section. This includes: a summary of the displacement results of the incremental
analyses, listed in Table 5.2; the displaced shape of the wind turbine tower at various magnification
factors, described and shown in Section 5.2.2; the incremental time-history displacement response,
described and shown in Section 5.2.3; and orbit plots as seen in plan view, discussed and shown in
Section 5.2.4.
Table 5.2: Summary of displacement results of time-history analyses subjected to LA01 & LA02 (Imperial Valley, 1940, Elcentro)
Peak Displacement
Peak Rotation
Peak Stress
Residual Deformation Factor
∆max (% H) θplan θmax σmises (MPa) ∆res (% H) θplan Damage State Reached
1 1.18 % 326° 0.057° 185 0.03 % 332°
1.5 1.63 % 326° 0.077° 253 0.03 % 320° 2 2.06 % 158° 0.091° 305 0.02 % 235°
2.9** 2.80 % 0.123 ° 389 0.02 % 0.2% Residual Out-of-Straightness & First Yield
3 2.92 % 322° 0.128° 400 0.23 % 315° 4 3.56 % 159° 0.167° 438 0.30 % 311°
4.4** 3.80 % 1.524° 521 1.00 % 1.0% Residual Out-of-Straightness 5 4.20 % 160° 3.716° 656 2.14 % 351° First Buckle / Loss of Tower 6 4.57 % 161° 4.135° 753 2.68 % 336° 7 4.99 % 162° 2.533° 750 2.48 % 180°
** interpolated values
The values listed in the table (peak displacement, peak rotation, peak stress, residual
deformation, and damage state) are described in detail in the following subsections. Detailed results
from the other earthquakes are presented in Appendix A, and a summary of all results from the LA
earthquake suite is presented in Section 5.3.
5.2.1 INTENSITY AND DAMAGE MEASURES
The results from an incremental dynamic analysis are typically presented as the damage measure
on the horizontal axis versus the intensity measure on the vertical axis.
The intensity measure is commonly the peak ground acceleration, the peak ground velocity, or
the 5% damped spectral acceleration of the structure’s first-mode period (Vamvatsikos and Cornell,
2002). The intensity measure should be chosen such that the dispersion of all the incremental time-
history analysis curves is minimized. For the earthquake suite used in this chapter, the intensity
CHAPTER 5: NONLINEAR TIME-HISTORY ANALYSIS OF THE VESTAS WIND TURBINE TOWER
SEISMIC ANALYSIS OF WIND TURBINE TOWERS IN THE CANADIAN ENVIRONMENT - 64 -
measure employed was the magnification factor. Since all the earthquakes were chosen to represent
the design response spectrum, the magnification factor represents the intensity of the ground
motion with respect to the intensity of the design-based earthquake. Other intensity measures
investigated were the peak ground displacement, the peak ground velocity, and the peak ground
acceleration. The IDA curves employing all of these intensity measures are included in Appendix A,
Section A.10. It was found that the dispersion of the curves was smallest when the magnification
factor was used as the intensity measure, followed closely by the peak ground velocity.
The damage measure is typically the peak roof drift of a structure or its peak interstorey drift
angle (Vamvatsikos and Cornell, 2002). Several damage measures were considered: the peak
displacement, the peak rotation, and the residual displacement. These damages measures are
discussed below. Along with the peak stress, these damage measures constituted the results that
were obtained from the analysis and are presented in tabular format for all earthquakes.
5.2.1.1 PEAK DISPLACEMENT
For each analysis, the displacement at hub height (80 m) in the three orthogonal directions (x, y,
and z) was obtained for each time increment throughout the analysis. The resultant displacement
was computed based on the two lateral displacements, and the maximum displacement was thus
obtained for each analysis. The peak displacement (∆max) is described as a percentage of the hub
height and the angle of the wind turbine tower in plan view (θplan, shown in Figure 5.4). This angle
should not be confused with the angle of incidence employed in the previous chapter, where an
angle of incidence of 22.5° (equivalent to θplan=22.5° and θplan=337.5°) was found to be the weakest
direction of the tower. However, the angle of the tower in plan view was included in the results to
determine if there is a weaker direction.
Figure 5.4: Top view of tower showing definition of angle in plan view
door cable hole
X
Z
θplan
CHAPTER 5: NONLINEAR TIME-HISTORY ANALYSIS OF THE VESTAS WIND TURBINE TOWER
SEISMIC ANALYSIS OF WIND TURBINE TOWERS IN THE CANADIAN ENVIRONMENT - 65 -
5.2.1.2 PEAK ROTATION
The rotation of the beam, θ, was computed at a specific time through the analysis, typically at the
time the peak displacement occurred. Initially, the rotation of the beam was computed at several
instances, but it was found that the peak rotation always occurred simultaneously with the peak
displacement if the tower buckled prior to the peak displacement occurrence.
To calculate the rotation, the displacement of the wind turbine tower was obtained at 33
elevations along its height. These elevations correspond to the dividing lines between the pieces of
the tower as described in Section 4.1.1. It is important to note that the distance between each point
is not the same. However, in the area of the tower that governs the peak rotation (from 1.1 m to
54.9 m in height), the average of this distance is 2.56m, and the minimum and maximum values are
2.46 m and 2.98 m, respectively. Thus, measuring the rotation of the tower based on these segments
is adequate. Furthermore, the displacement of the tower at each location along the height was taken
as the average of 12 evenly spaced points around the circumference at that elevation. This ensured
that the deformed shape represented the centreline of the tower and was not influenced by any
ovalisation that may have occurred.
The angle of each segment with respect to the vertical was determined. For the analyses where
the tower did not buckle, the peak rotation was computed as the greatest difference in this angle
between two adjacent segments. Figure 5.5 (a) shows the peak displaced shape for the IDA with a
magnification factor of 2, and it is evident that the transition between each segment is smooth and
thus the peak rotation was small. For the analyses where buckling did occur, the segments used to
determine the rotation are not adjacent, as the rotation of the segments very close to the buckle was
not considered accurate due to ovalisation of the tower and flattening on the tower wall on the side
opposite the buckle. Two or three segments were thus ignored. Two segments were ignored if the
buckle occurred exactly at the joint between two segments, while three segments were ignored if the
buckle occurred within one segment. For the IDA with magnification factor of 5, which had the
displaced shape at the peak rotation as shown in Figure 5.5 (b), three segments were ignored because
the buckle occurred within one segment, and the two above and below it were also influenced by the
effects described above. The two segments used to calculate the rotation are shown with a thick line
in the figure.

CHAPTER 5: NONLINEAR TIME-HISTORY ANALYSIS OF THE VESTAS WIND TURBINE TOWER
SEISMIC ANALYSIS OF WIND TURBINE TOWERS IN THE CANADIAN ENVIRONMENT - 66 -
0
10
20
30
40
50
60
70
80
0 1 2
Lateral Displacement (m)
Height above Base (m)
0
10
20
30
40
50
60
70
80
0 1 2 3
Lateral Displacement (m)
Height above Base (m)
(a) (b)
Figure 5.5: Displaced shape of wind turbine tower used to determine the peak rotation for LA01 & LA02 (Imperial Valley, 1940, Elcentro)
(a) magnification factor 2 (b) magnification factor 5
5.2.1.3 PEAK STRESS
The peak stress listed is the peak Von Mises stress (σmises). Although this is not one of the
damage measures, it is included in the results summary tables because it indicates how much the
material has yielded. Prior to buckling, the peak stress typically occurs at the side of the door hole
opening on the inside of the tower. In the incremental analyses where the tower buckles, the peak
stress is typically at the location of the buckle.
height of
buckle
peak rotation, θmax
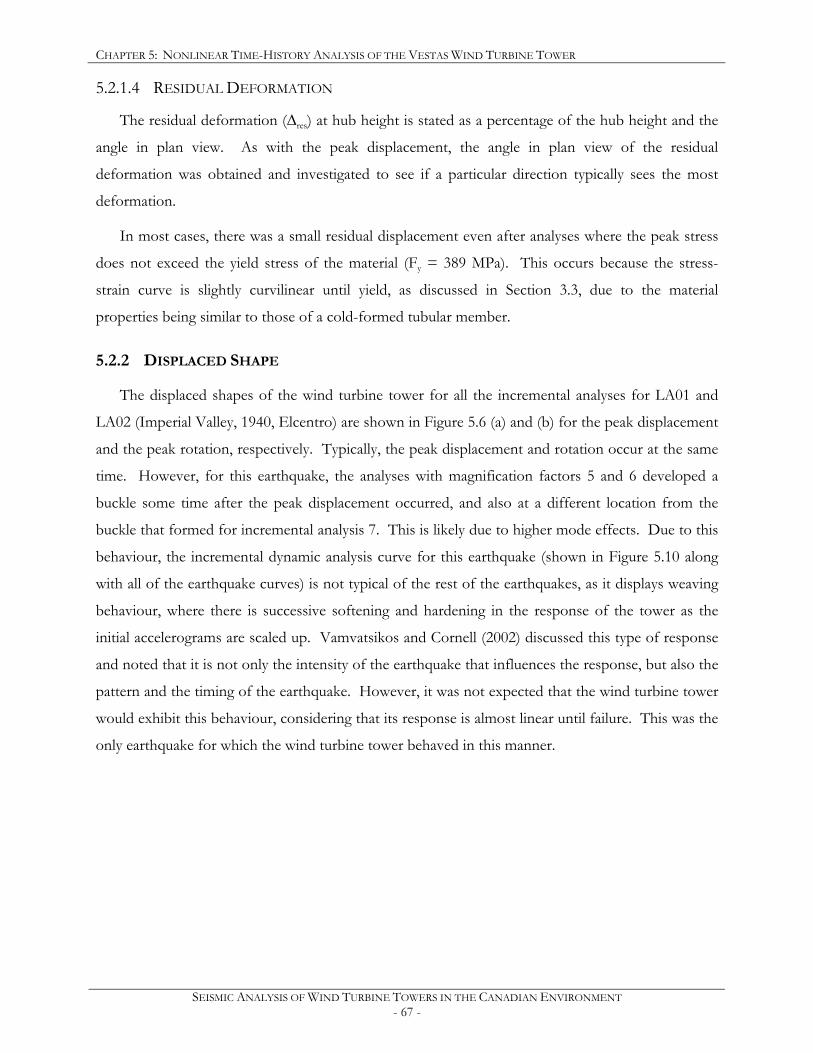
CHAPTER 5: NONLINEAR TIME-HISTORY ANALYSIS OF THE VESTAS WIND TURBINE TOWER
SEISMIC ANALYSIS OF WIND TURBINE TOWERS IN THE CANADIAN ENVIRONMENT - 67 -
5.2.1.4 RESIDUAL DEFORMATION
The residual deformation (∆res) at hub height is stated as a percentage of the hub height and the
angle in plan view. As with the peak displacement, the angle in plan view of the residual
deformation was obtained and investigated to see if a particular direction typically sees the most
deformation.
In most cases, there was a small residual displacement even after analyses where the peak stress
does not exceed the yield stress of the material (Fy = 389 MPa). This occurs because the stress-
strain curve is slightly curvilinear until yield, as discussed in Section 3.3, due to the material
properties being similar to those of a cold-formed tubular member.
5.2.2 DISPLACED SHAPE
The displaced shapes of the wind turbine tower for all the incremental analyses for LA01 and
LA02 (Imperial Valley, 1940, Elcentro) are shown in Figure 5.6 (a) and (b) for the peak displacement
and the peak rotation, respectively. Typically, the peak displacement and rotation occur at the same
time. However, for this earthquake, the analyses with magnification factors 5 and 6 developed a
buckle some time after the peak displacement occurred, and also at a different location from the
buckle that formed for incremental analysis 7. This is likely due to higher mode effects. Due to this
behaviour, the incremental dynamic analysis curve for this earthquake (shown in Figure 5.10 along
with all of the earthquake curves) is not typical of the rest of the earthquakes, as it displays weaving
behaviour, where there is successive softening and hardening in the response of the tower as the
initial accelerograms are scaled up. Vamvatsikos and Cornell (2002) discussed this type of response
and noted that it is not only the intensity of the earthquake that influences the response, but also the
pattern and the timing of the earthquake. However, it was not expected that the wind turbine tower
would exhibit this behaviour, considering that its response is almost linear until failure. This was the
only earthquake for which the wind turbine tower behaved in this manner.
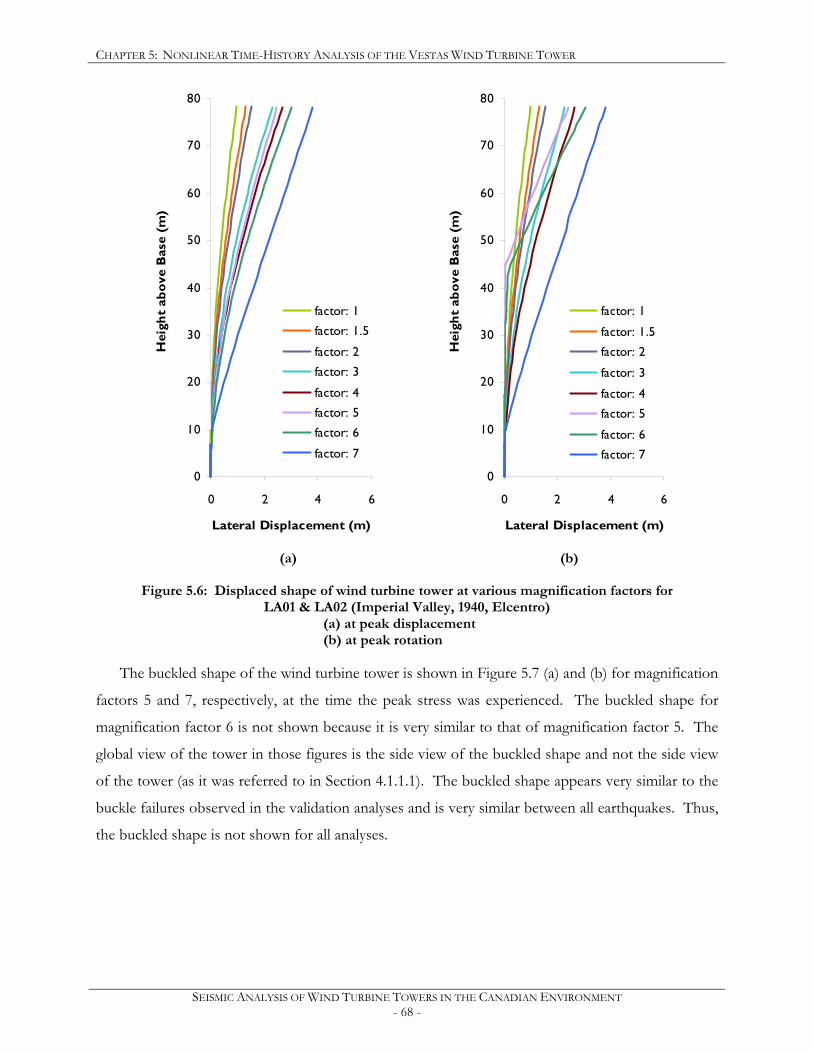
CHAPTER 5: NONLINEAR TIME-HISTORY ANALYSIS OF THE VESTAS WIND TURBINE TOWER
SEISMIC ANALYSIS OF WIND TURBINE TOWERS IN THE CANADIAN ENVIRONMENT - 68 -
0
10
20
30
40
50
60
70
80
0 2 4 6
Lateral Displacement (m)
Hei
ght
abov
e B
ase
(m)
factor: 1
factor: 1.5
factor: 2
factor: 3
factor: 4
factor: 5
factor: 6
factor: 7
0
10
20
30
40
50
60
70
80
0 2 4 6
Lateral Displacement (m)
Hei
ght
abov
e B
ase
(m)
factor: 1
factor: 1.5
factor: 2
factor: 3
factor: 4
factor: 5
factor: 6
factor: 7
(a) (b)
Figure 5.6: Displaced shape of wind turbine tower at various magnification factors for LA01 & LA02 (Imperial Valley, 1940, Elcentro)
(a) at peak displacement (b) at peak rotation
The buckled shape of the wind turbine tower is shown in Figure 5.7 (a) and (b) for magnification
factors 5 and 7, respectively, at the time the peak stress was experienced. The buckled shape for
magnification factor 6 is not shown because it is very similar to that of magnification factor 5. The
global view of the tower in those figures is the side view of the buckled shape and not the side view
of the tower (as it was referred to in Section 4.1.1.1). The buckled shape appears very similar to the
buckle failures observed in the validation analyses and is very similar between all earthquakes. Thus,
the buckled shape is not shown for all analyses.

CHAPTER 5: NONLINEAR TIME-HISTORY ANALYSIS OF THE VESTAS WIND TURBINE TOWER
SEISMIC ANALYSIS OF WIND TURBINE TOWERS IN THE CANADIAN ENVIRONMENT - 69 -
Figure 5.7: Bucked shape of Vestas wind turbine tower analysis for
LA01 & LA02 (Imperial Valley, 1940, Elcentro) (a) magnification factor 5, t = 44.64 s (b) magnification factor 7, t = 56 s
5.2.3 TIME-HISTORY DISPLACEMENT RESPONSE
The time-history displacement response of the Vestas wind turbine tower at hub height (80 m)
in orthogonal horizontal directions (x and z) is shown in Figure 5.8 (a) and (b) for the x- and z-
directions, respectively, for magnification factors 4 to 7. The response of the tower was fairly linear
up to the magnification factor of 4, thus the response for factors 1 to 3 are not plotted. For some
analyses, the response is linear up to a different magnification factor, thus the time-history
displacement response figures are not of the same factors for all earthquakes. It is apparent from
this figure that the failure of incremental analysis 7 was different from that of analysis 5 and 6, as the
buckle forms in the opposite x-direction. Once again, this behaviour is not typical, and the failures
side view front view opposite side view
(a)
(b)
side view front view opposite side view
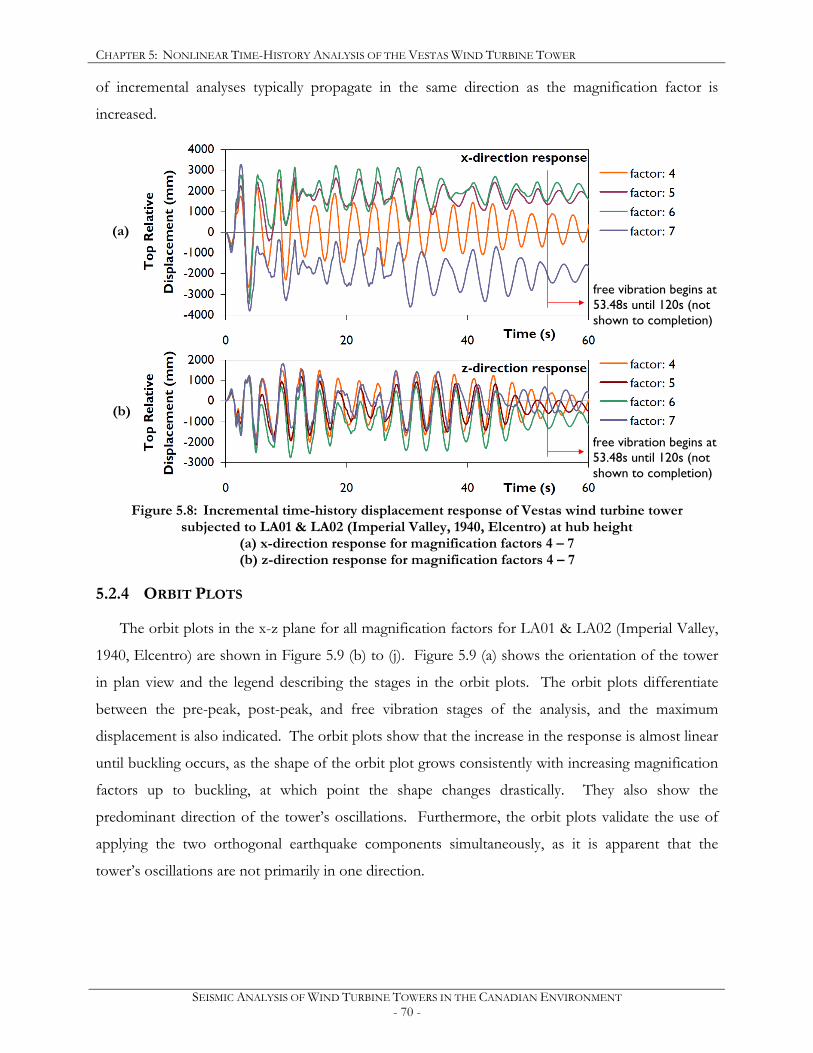
CHAPTER 5: NONLINEAR TIME-HISTORY ANALYSIS OF THE VESTAS WIND TURBINE TOWER
SEISMIC ANALYSIS OF WIND TURBINE TOWERS IN THE CANADIAN ENVIRONMENT - 70 -
of incremental analyses typically propagate in the same direction as the magnification factor is
increased.
Figure 5.8: Incremental time-history displacement response of Vestas wind turbine tower
subjected to LA01 & LA02 (Imperial Valley, 1940, Elcentro) at hub height (a) x-direction response for magnification factors 4 – 7 (b) z-direction response for magnification factors 4 – 7
5.2.4 ORBIT PLOTS
The orbit plots in the x-z plane for all magnification factors for LA01 & LA02 (Imperial Valley,
1940, Elcentro) are shown in Figure 5.9 (b) to (j). Figure 5.9 (a) shows the orientation of the tower
in plan view and the legend describing the stages in the orbit plots. The orbit plots differentiate
between the pre-peak, post-peak, and free vibration stages of the analysis, and the maximum
displacement is also indicated. The orbit plots show that the increase in the response is almost linear
until buckling occurs, as the shape of the orbit plot grows consistently with increasing magnification
factors up to buckling, at which point the shape changes drastically. They also show the
predominant direction of the tower’s oscillations. Furthermore, the orbit plots validate the use of
applying the two orthogonal earthquake components simultaneously, as it is apparent that the
tower’s oscillations are not primarily in one direction.
free vibration begins at 53.48s until 120s (not shown to completion)
(a)
(b)
free vibration begins at 53.48s until 120s (not shown to completion)

CHAPTER 5: NONLINEAR TIME-HISTORY ANALYSIS OF THE VESTAS WIND TURBINE TOWER
SEISMIC ANALYSIS OF WIND TURBINE TOWERS IN THE CANADIAN ENVIRONMENT - 71 -
Figure 5.9: Orbit in x-z plane (in mm) for Vestas wind turbine tower subjected to LA01 & LA02 (Imperial Valley, 1940, Elcentro)
(a) top view of tower and legend (e) factor: 3 (i) factor: 7 (b) factor: 1 (f) factor: 4 (c) factor: 1.5 (g) factor: 5 (d) factor: 2 (h) factor: 6
door cable hole X
Z
(a)
(f) factor: 4
(g) factor: 5
(h) factor: 6
(b) factor: 1
(d) factor: 2
(e) factor: 3
(c) factor: 1.5
(i) factor: 7
tower buckles
tower buckles
CHAPTER 5: NONLINEAR TIME-HISTORY ANALYSIS OF THE VESTAS WIND TURBINE TOWER
SEISMIC ANALYSIS OF WIND TURBINE TOWERS IN THE CANADIAN ENVIRONMENT - 72 -
5.2.5 DEFINITION OF DAMAGE STATES FOR WIND TURBINE TOWERS
Limit states are typically defined using prescribed values to ensure safety of occupants and
stability of buildings. However, wind turbine towers do not fall in the same category as buildings, as
they are generally not occupied. Therefore, four damage states were defined instead of limit states
to provide an indication of the damage sustained by the wind turbine tower.
5.2.5.1 0.2% RESIDUAL OUT-OF-STRAIGHTNESS
The acceptable out-of-straightness for wind turbine towers is not well defined, but this value for
other structures varies in Canadian standards between 0.1% (CSA S473, 2004; CSA S16, 2009b) and
0.2 % (CSA S37, 2001). This out-of-straightness is typically defined for erection purposes. As
discussed in Section 5.2.1.4, there is some residual deformation before the yield stress is reached due
to the curvilinear material properties. Thus, an out-of-straightness limit of 0.1% was considered to
be too severe.
For this thesis, a residual out-of-straightness of 0.2% was taken as the first damage state. Linear
interpolation between the two analyses that enveloped a residual displacement of 0.2% of hub height
was carried out to determine the damage and intensity measures at this damage state.
5.2.5.2 FIRST YIELD
Linear interpolation between the two analyses that enveloped a peak yield stress, Fy = 389 MPa,
was carried out to define the values of the second damage state.
5.2.5.3 1.0% RESIDUAL OUT-OF-STRAIGHTNESS
Yielding of the tower typically falls within the 0.2% residual out-of-straightness (the first damage
state) and 1.0% residual out of straightness. Due to the uncertainty of the material properties of the
wind turbine tower, this damage states was investigated as well. Similar to the previous two damage
states, linear interpolation was employed to obtain the values that define 1% residual out-of-
straightness.
5.2.5.4 FIRST BUCKLE / LOSS OF TOWER
The last damage state corresponds to the first incremental analysis where the tower buckles.
The wind turbine tower is considered as a complete loss after this damage state is reached, given the
fact that the sections comprising the tower are class 3 or class 4. However, the tower is likely still
standing after the first buckle is formed. For this damage state, there is no linear interpolation, and
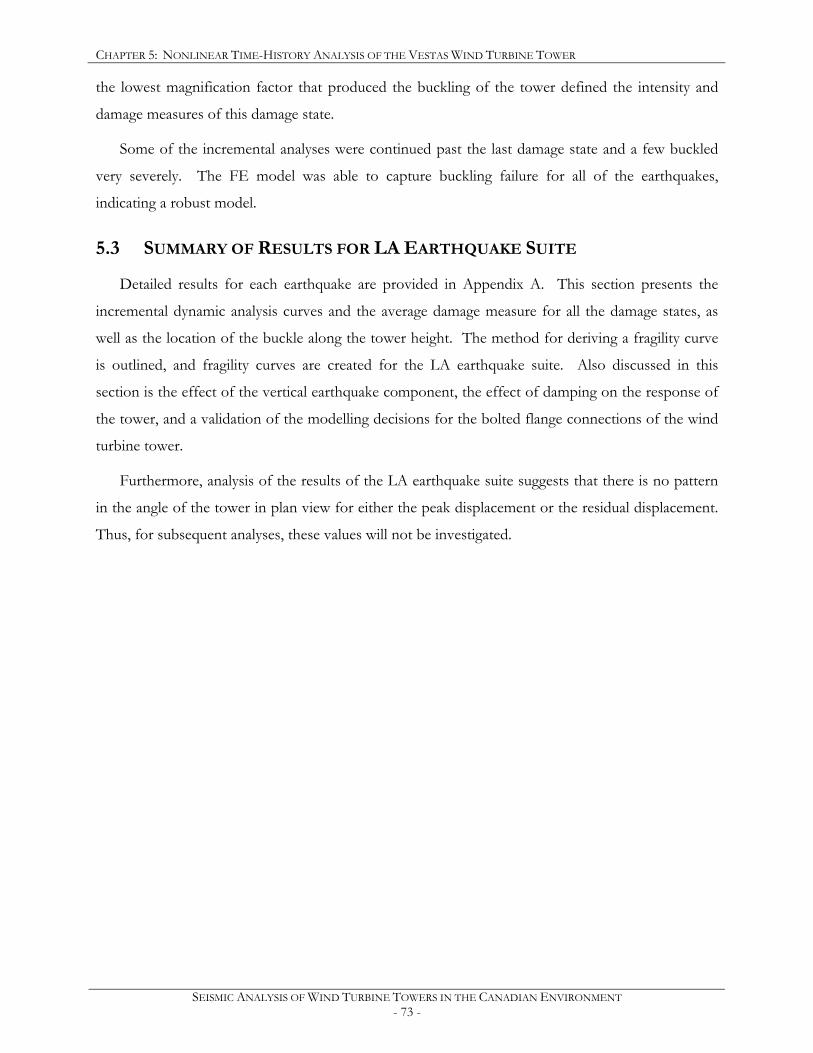
CHAPTER 5: NONLINEAR TIME-HISTORY ANALYSIS OF THE VESTAS WIND TURBINE TOWER
SEISMIC ANALYSIS OF WIND TURBINE TOWERS IN THE CANADIAN ENVIRONMENT - 73 -
the lowest magnification factor that produced the buckling of the tower defined the intensity and
damage measures of this damage state.
Some of the incremental analyses were continued past the last damage state and a few buckled
very severely. The FE model was able to capture buckling failure for all of the earthquakes,
indicating a robust model.
5.3 SUMMARY OF RESULTS FOR LA EARTHQUAKE SUITE
Detailed results for each earthquake are provided in Appendix A. This section presents the
incremental dynamic analysis curves and the average damage measure for all the damage states, as
well as the location of the buckle along the tower height. The method for deriving a fragility curve
is outlined, and fragility curves are created for the LA earthquake suite. Also discussed in this
section is the effect of the vertical earthquake component, the effect of damping on the response of
the tower, and a validation of the modelling decisions for the bolted flange connections of the wind
turbine tower.
Furthermore, analysis of the results of the LA earthquake suite suggests that there is no pattern
in the angle of the tower in plan view for either the peak displacement or the residual displacement.
Thus, for subsequent analyses, these values will not be investigated.
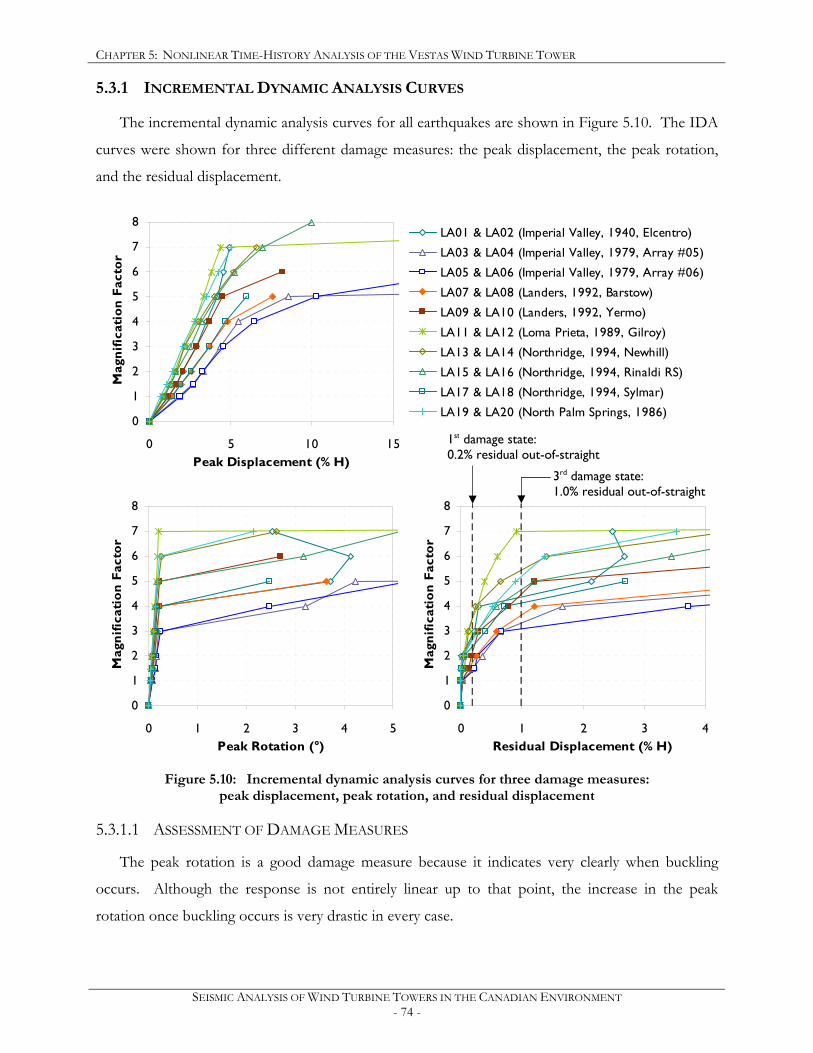
CHAPTER 5: NONLINEAR TIME-HISTORY ANALYSIS OF THE VESTAS WIND TURBINE TOWER
SEISMIC ANALYSIS OF WIND TURBINE TOWERS IN THE CANADIAN ENVIRONMENT - 74 -
5.3.1 INCREMENTAL DYNAMIC ANALYSIS CURVES
The incremental dynamic analysis curves for all earthquakes are shown in Figure 5.10. The IDA
curves were shown for three different damage measures: the peak displacement, the peak rotation,
and the residual displacement.
0
1
2
3
4
5
6
7
8
0 5 10 15Peak Displacement (% H)
Mag
nific
atio
n Fa
ctor
LA01 & LA02 (Imperial Valley, 1940, Elcentro)
LA03 & LA04 (Imperial Valley, 1979, Array #05)
LA05 & LA06 (Imperial Valley, 1979, Array #06)
LA07 & LA08 (Landers, 1992, Barstow)
LA09 & LA10 (Landers, 1992, Yermo)
LA11 & LA12 (Loma Prieta, 1989, Gilroy)
LA13 & LA14 (Northridge, 1994, Newhill)
LA15 & LA16 (Northridge, 1994, Rinaldi RS)
LA17 & LA18 (Northridge, 1994, Sylmar)
LA19 & LA20 (North Palm Springs, 1986)
0
1
2
3
4
5
6
7
8
0 1 2 3 4 5Peak Rotation (°)
Mag
nific
atio
n Fa
ctor
0
1
2
3
4
5
6
7
8
0 1 2 3 4Residual Displacement (% H)
Mag
nific
atio
n Fa
ctor
Figure 5.10: Incremental dynamic analysis curves for three damage measures:
peak displacement, peak rotation, and residual displacement
5.3.1.1 ASSESSMENT OF DAMAGE MEASURES
The peak rotation is a good damage measure because it indicates very clearly when buckling
occurs. Although the response is not entirely linear up to that point, the increase in the peak
rotation once buckling occurs is very drastic in every case.
1st damage state: 0.2% residual out-of-straight 3rd damage state:
1.0% residual out-of-straight

CHAPTER 5: NONLINEAR TIME-HISTORY ANALYSIS OF THE VESTAS WIND TURBINE TOWER
SEISMIC ANALYSIS OF WIND TURBINE TOWERS IN THE CANADIAN ENVIRONMENT - 75 -
The residual displacement is an important damage measure because it is used to define two of
the damage states. Also, the second damage state, representing the first yield limit, is also easily
identifiable using this damage measure, as those analyses typically have a residual displacement
between 0.2% and 1.0%. Of the three damage measures, the residual displacement has the least
dispersion, which is an important factor.
The peak displacement appears to be the least indicative damage measure. There are a few
analyses where the tower buckled and where the peak displacement IDA curves do not give any
indication of this, depending on the height where the buckle formed.
5.3.1.2 AVERAGE DAMAGE MEASURES
The average damage measures for each damage state for the LA earthquake suite are shown in
Table 5.3, along with the minimum and maximum values of the damage measures. It is apparent
that the spread of the damage measures in any damage state was quite significant.
Table 5.3: Minimum, average, and maximum values of damage measures at each damage state
Damage State
Peak Displacement ∆max (% H)
Peak Rotation θmax
Peak Stress
σmises (MPa)
Residual Displacement ∆res (% H)
0.2% Residual Out-of-Straightness
min: 1.85 % average: 2.50 %
max: 3.02 %
min: 0.089° average: 0.120°
max: 0.142°
min: 228 average: 341
max: 387 0.2 %
First Yield
min: 2.71 % average: 3.01 %
max: 3.46 %
min: 0.124° average: 0.144°
max: 0.163° 389
min: 0.20% average: 0.34%
max: 0.75%
1% Residual Out-of-Straightness
min: 3.71% average: 4.34 %
max: 4.88 %
min: 0.177° average: 0.532°
max: 1.524°
min: 431 average: 473
max: 531 1.0 %
First Buckle / Loss of Tower
min: 4.20 % average: 6.23 %
max: 8.23 %
min: 2.46° average: 2.99°
max: 3.72°
min: 467 average: 655
max: 743
min: 1.66 % average: 3.74 %
max: 6.22 %
5.3.2 LOCATION OF BUCKLE FOR 4TH DAMAGE STATE
Buckling of the wind turbine tower was expected to occur close to the base of the tower. Based
on the failure of the pushover analysis carried out in the previous chapter, the buckle should form
just above the door section. However, the time-history analyses suggest a different location. The
location of the first buckle is listed in Table 5.4 for the LA earthquake suite, and it is apparent that
the buckle is equally likely to form 10 m above the base, between the fourth and fifth pieces of the
wind turbine tower, and about 43 m above the base.
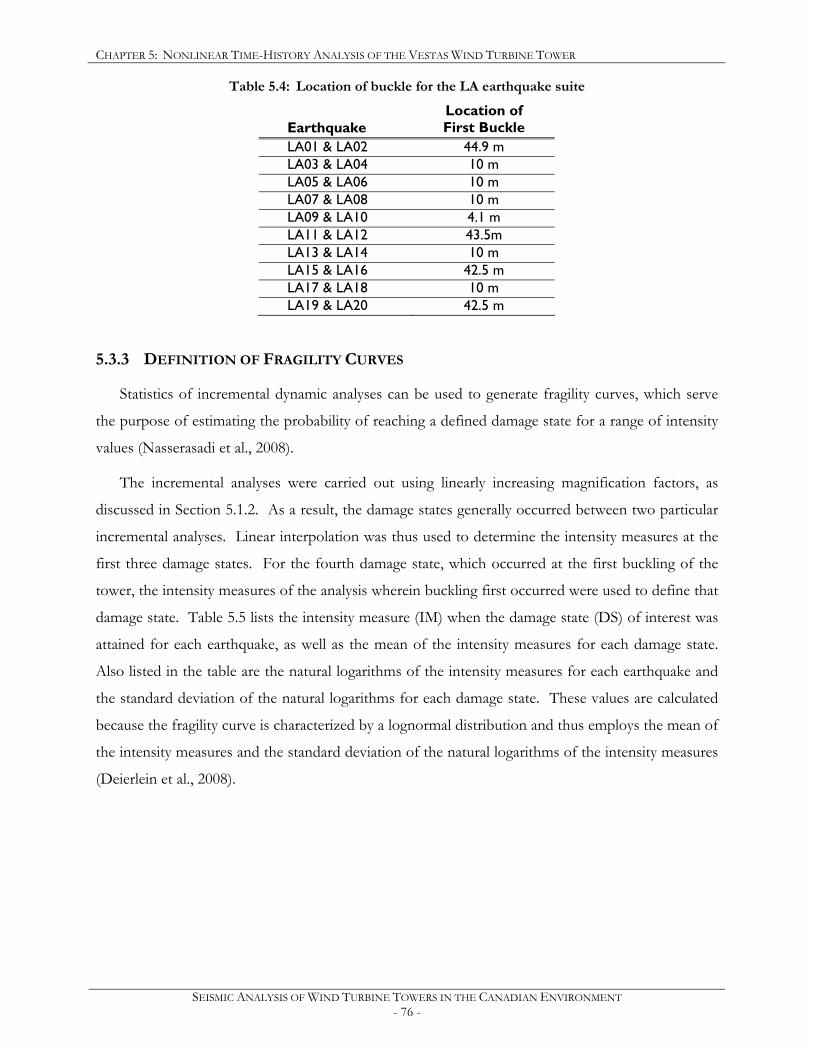
CHAPTER 5: NONLINEAR TIME-HISTORY ANALYSIS OF THE VESTAS WIND TURBINE TOWER
SEISMIC ANALYSIS OF WIND TURBINE TOWERS IN THE CANADIAN ENVIRONMENT - 76 -
Table 5.4: Location of buckle for the LA earthquake suite
Earthquake Location of First Buckle
LA01 & LA02 44.9 m LA03 & LA04 10 m LA05 & LA06 10 m LA07 & LA08 10 m LA09 & LA10 4.1 m LA11 & LA12 43.5m LA13 & LA14 10 m LA15 & LA16 42.5 m LA17 & LA18 10 m LA19 & LA20 42.5 m
5.3.3 DEFINITION OF FRAGILITY CURVES
Statistics of incremental dynamic analyses can be used to generate fragility curves, which serve
the purpose of estimating the probability of reaching a defined damage state for a range of intensity
values (Nasserasadi et al., 2008).
The incremental analyses were carried out using linearly increasing magnification factors, as
discussed in Section 5.1.2. As a result, the damage states generally occurred between two particular
incremental analyses. Linear interpolation was thus used to determine the intensity measures at the
first three damage states. For the fourth damage state, which occurred at the first buckling of the
tower, the intensity measures of the analysis wherein buckling first occurred were used to define that
damage state. Table 5.5 lists the intensity measure (IM) when the damage state (DS) of interest was
attained for each earthquake, as well as the mean of the intensity measures for each damage state.
Also listed in the table are the natural logarithms of the intensity measures for each earthquake and
the standard deviation of the natural logarithms for each damage state. These values are calculated
because the fragility curve is characterized by a lognormal distribution and thus employs the mean of
the intensity measures and the standard deviation of the natural logarithms of the intensity measures
(Deierlein et al., 2008).
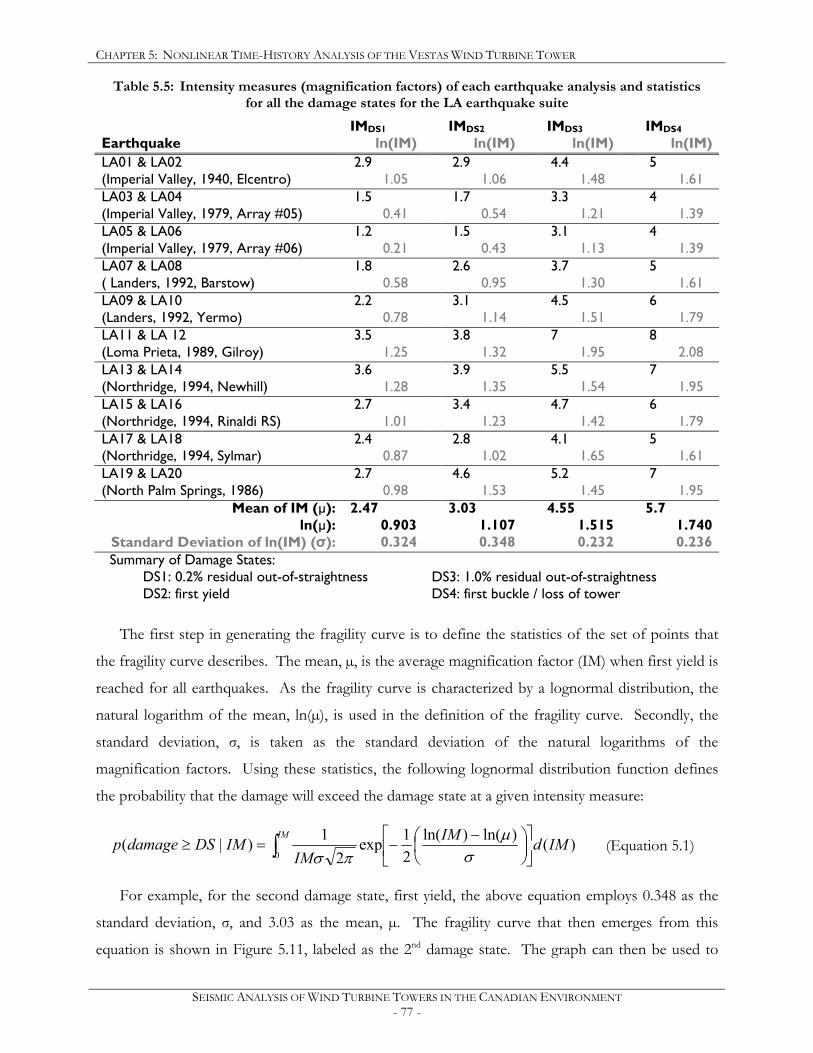
CHAPTER 5: NONLINEAR TIME-HISTORY ANALYSIS OF THE VESTAS WIND TURBINE TOWER
SEISMIC ANALYSIS OF WIND TURBINE TOWERS IN THE CANADIAN ENVIRONMENT - 77 -
Table 5.5: Intensity measures (magnification factors) of each earthquake analysis and statistics for all the damage states for the LA earthquake suite
Earthquake IMDS1
ln(IM) IMDS2
ln(IM) IMDS3
ln(IM) IMDS4
ln(IM) LA01 & LA02 (Imperial Valley, 1940, Elcentro)
2.9 1.05
2.9 1.06
4.4 1.48
5 1.61
LA03 & LA04 (Imperial Valley, 1979, Array #05)
1.5 0.41
1.7 0.54
3.3 1.21
4 1.39
LA05 & LA06 (Imperial Valley, 1979, Array #06)
1.2 0.21
1.5 0.43
3.1 1.13
4 1.39
LA07 & LA08 ( Landers, 1992, Barstow)
1.8 0.58
2.6 0.95
3.7 1.30
5 1.61
LA09 & LA10 (Landers, 1992, Yermo)
2.2 0.78
3.1 1.14
4.5 1.51
6 1.79
LA11 & LA 12 (Loma Prieta, 1989, Gilroy)
3.5 1.25
3.8 1.32
7 1.95
8 2.08
LA13 & LA14 (Northridge, 1994, Newhill)
3.6 1.28
3.9 1.35
5.5 1.54
7 1.95
LA15 & LA16 (Northridge, 1994, Rinaldi RS)
2.7 1.01
3.4 1.23
4.7 1.42
6 1.79
LA17 & LA18 (Northridge, 1994, Sylmar)
2.4 0.87
2.8 1.02
4.1 1.65
5 1.61
LA19 & LA20 (North Palm Springs, 1986)
2.7 0.98
4.6 1.53
5.2 1.45
7 1.95
Mean of IM (µ): 2.47 3.03 4.55 5.7 ln(µ): 0.903 1.107 1.515 1.740
Standard Deviation of ln(IM) (σ): 0.324 0.348 0.232 0.236 Summary of Damage States:
DS1: 0.2% residual out-of-straightness DS2: first yield
DS3: 1.0% residual out-of-straightness DS4: first buckle / loss of tower
The first step in generating the fragility curve is to define the statistics of the set of points that
the fragility curve describes. The mean, µ, is the average magnification factor (IM) when first yield is
reached for all earthquakes. As the fragility curve is characterized by a lognormal distribution, the
natural logarithm of the mean, ln(µ), is used in the definition of the fragility curve. Secondly, the
standard deviation, σ, is taken as the standard deviation of the natural logarithms of the
magnification factors. Using these statistics, the following lognormal distribution function defines
the probability that the damage will exceed the damage state at a given intensity measure:
)()ln()ln(21exp
21)|(
0IMdIM
IMIMDSdamagep
IM
−
−=≥ ∫ σµ
πσ (Equation 5.1)
For example, for the second damage state, first yield, the above equation employs 0.348 as the
standard deviation, σ, and 3.03 as the mean, µ. The fragility curve that then emerges from this
equation is shown in Figure 5.11, labeled as the 2nd damage state. The graph can then be used to
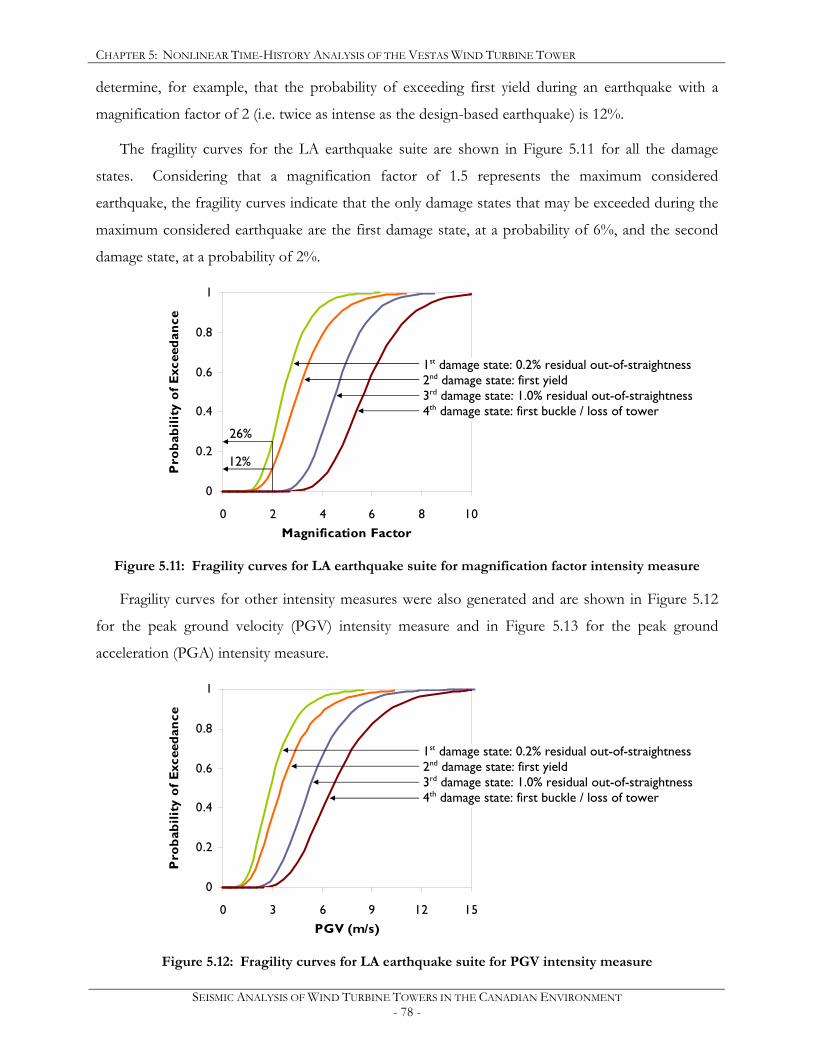
CHAPTER 5: NONLINEAR TIME-HISTORY ANALYSIS OF THE VESTAS WIND TURBINE TOWER
SEISMIC ANALYSIS OF WIND TURBINE TOWERS IN THE CANADIAN ENVIRONMENT - 78 -
determine, for example, that the probability of exceeding first yield during an earthquake with a
magnification factor of 2 (i.e. twice as intense as the design-based earthquake) is 12%.
The fragility curves for the LA earthquake suite are shown in Figure 5.11 for all the damage
states. Considering that a magnification factor of 1.5 represents the maximum considered
earthquake, the fragility curves indicate that the only damage states that may be exceeded during the
maximum considered earthquake are the first damage state, at a probability of 6%, and the second
damage state, at a probability of 2%.
0
0.2
0.4
0.6
0.8
1
0 2 4 6 8 10Magnification Factor
Pro
babi
lity
of E
xcee
danc
e
Figure 5.11: Fragility curves for LA earthquake suite for magnification factor intensity measure
Fragility curves for other intensity measures were also generated and are shown in Figure 5.12
for the peak ground velocity (PGV) intensity measure and in Figure 5.13 for the peak ground
acceleration (PGA) intensity measure.
0
0.2
0.4
0.6
0.8
1
0 3 6 9 12 15PGV (m/s)
Pro
babi
lity
of E
xcee
danc
e
Figure 5.12: Fragility curves for LA earthquake suite for PGV intensity measure
1st damage state: 0.2% residual out-of-straightness 2nd damage state: first yield 3rd damage state: 1.0% residual out-of-straightness 4th damage state: first buckle / loss of tower
1st damage state: 0.2% residual out-of-straightness 2nd damage state: first yield 3rd damage state: 1.0% residual out-of-straightness 4th damage state: first buckle / loss of tower 26%
12%
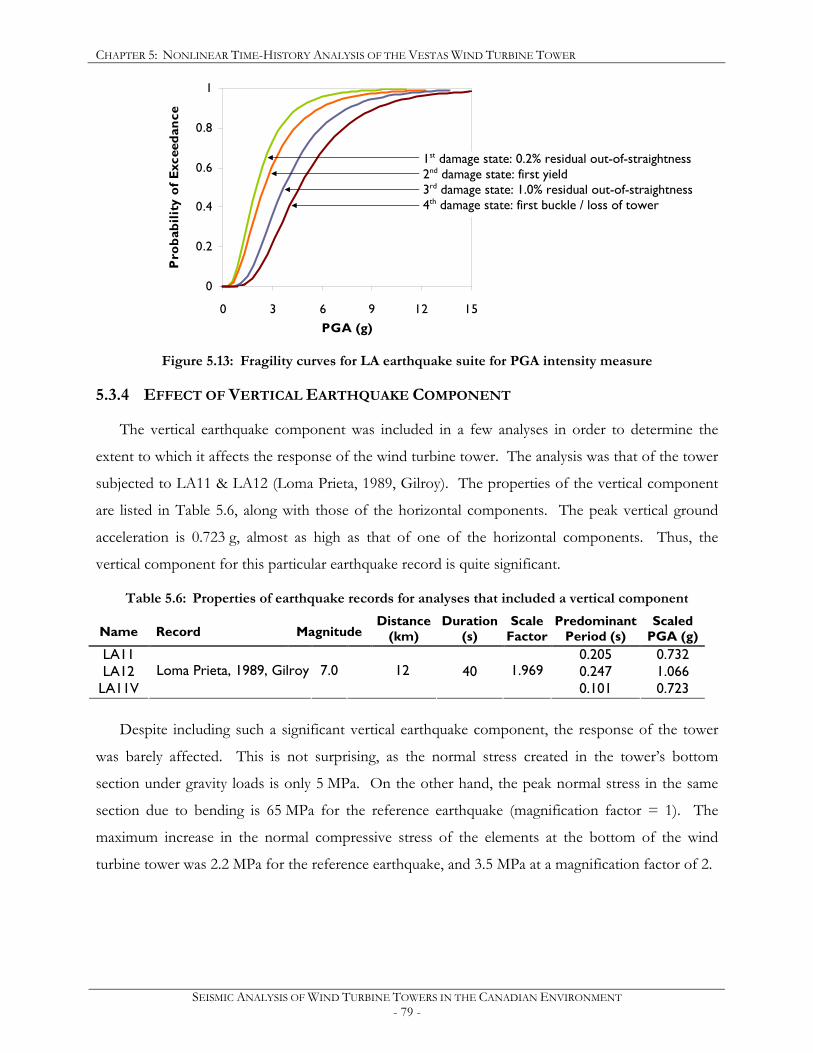
CHAPTER 5: NONLINEAR TIME-HISTORY ANALYSIS OF THE VESTAS WIND TURBINE TOWER
SEISMIC ANALYSIS OF WIND TURBINE TOWERS IN THE CANADIAN ENVIRONMENT - 79 -
0
0.2
0.4
0.6
0.8
1
0 3 6 9 12 15PGA (g)
Pro
babi
lity
of E
xcee
danc
e
Figure 5.13: Fragility curves for LA earthquake suite for PGA intensity measure
5.3.4 EFFECT OF VERTICAL EARTHQUAKE COMPONENT
The vertical earthquake component was included in a few analyses in order to determine the
extent to which it affects the response of the wind turbine tower. The analysis was that of the tower
subjected to LA11 & LA12 (Loma Prieta, 1989, Gilroy). The properties of the vertical component
are listed in Table 5.6, along with those of the horizontal components. The peak vertical ground
acceleration is 0.723 g, almost as high as that of one of the horizontal components. Thus, the
vertical component for this particular earthquake record is quite significant.
Table 5.6: Properties of earthquake records for analyses that included a vertical component
Name
Record
Magnitude
Distance (km)
Duration (s)
Scale Factor
Predominant Period (s)
Scaled PGA (g)
LA11 0.205 0.732 LA12 40 0.247 1.066
LA11V Loma Prieta, 1989, Gilroy 7.0 12
1.969
0.101 0.723
Despite including such a significant vertical earthquake component, the response of the tower
was barely affected. This is not surprising, as the normal stress created in the tower’s bottom
section under gravity loads is only 5 MPa. On the other hand, the peak normal stress in the same
section due to bending is 65 MPa for the reference earthquake (magnification factor = 1). The
maximum increase in the normal compressive stress of the elements at the bottom of the wind
turbine tower was 2.2 MPa for the reference earthquake, and 3.5 MPa at a magnification factor of 2.
1st damage state: 0.2% residual out-of-straightness 2nd damage state: first yield 3rd damage state: 1.0% residual out-of-straightness 4th damage state: first buckle / loss of tower
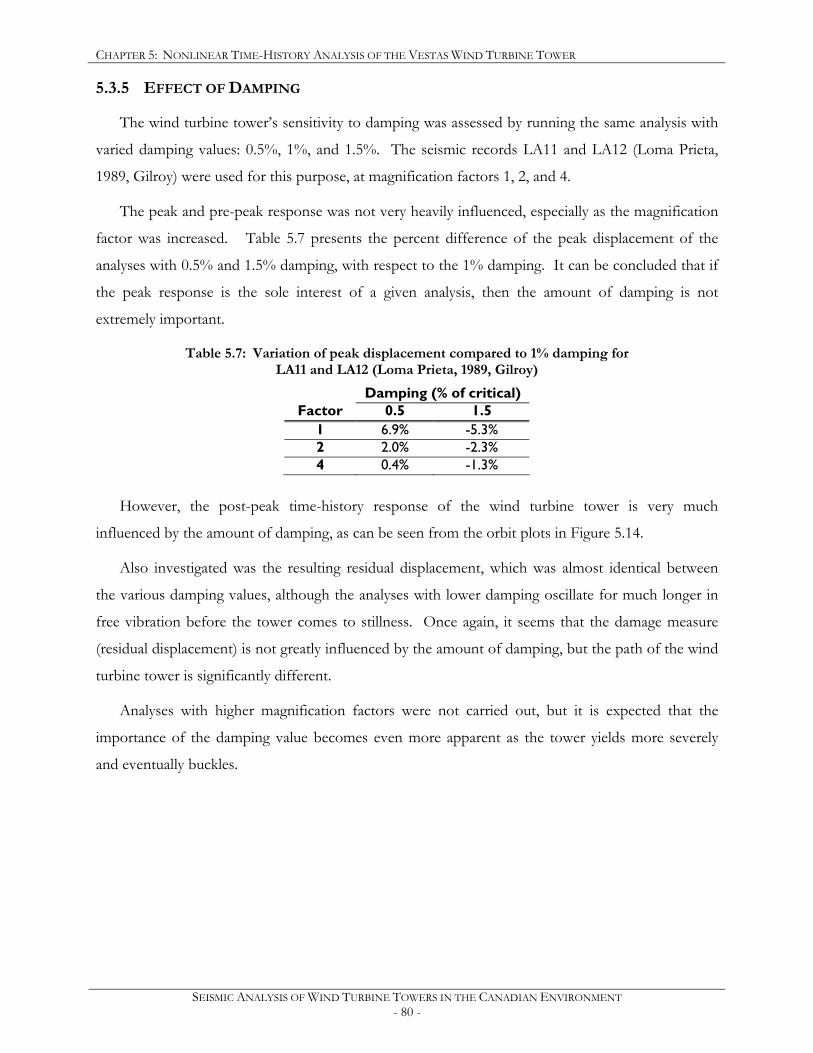
CHAPTER 5: NONLINEAR TIME-HISTORY ANALYSIS OF THE VESTAS WIND TURBINE TOWER
SEISMIC ANALYSIS OF WIND TURBINE TOWERS IN THE CANADIAN ENVIRONMENT - 80 -
5.3.5 EFFECT OF DAMPING
The wind turbine tower’s sensitivity to damping was assessed by running the same analysis with
varied damping values: 0.5%, 1%, and 1.5%. The seismic records LA11 and LA12 (Loma Prieta,
1989, Gilroy) were used for this purpose, at magnification factors 1, 2, and 4.
The peak and pre-peak response was not very heavily influenced, especially as the magnification
factor was increased. Table 5.7 presents the percent difference of the peak displacement of the
analyses with 0.5% and 1.5% damping, with respect to the 1% damping. It can be concluded that if
the peak response is the sole interest of a given analysis, then the amount of damping is not
extremely important.
Table 5.7: Variation of peak displacement compared to 1% damping for LA11 and LA12 (Loma Prieta, 1989, Gilroy)
Damping (% of critical) Factor 0.5 1.5
1 6.9% -5.3% 2 2.0% -2.3% 4 0.4% -1.3%
However, the post-peak time-history response of the wind turbine tower is very much
influenced by the amount of damping, as can be seen from the orbit plots in Figure 5.14.
Also investigated was the resulting residual displacement, which was almost identical between
the various damping values, although the analyses with lower damping oscillate for much longer in
free vibration before the tower comes to stillness. Once again, it seems that the damage measure
(residual displacement) is not greatly influenced by the amount of damping, but the path of the wind
turbine tower is significantly different.
Analyses with higher magnification factors were not carried out, but it is expected that the
importance of the damping value becomes even more apparent as the tower yields more severely
and eventually buckles.
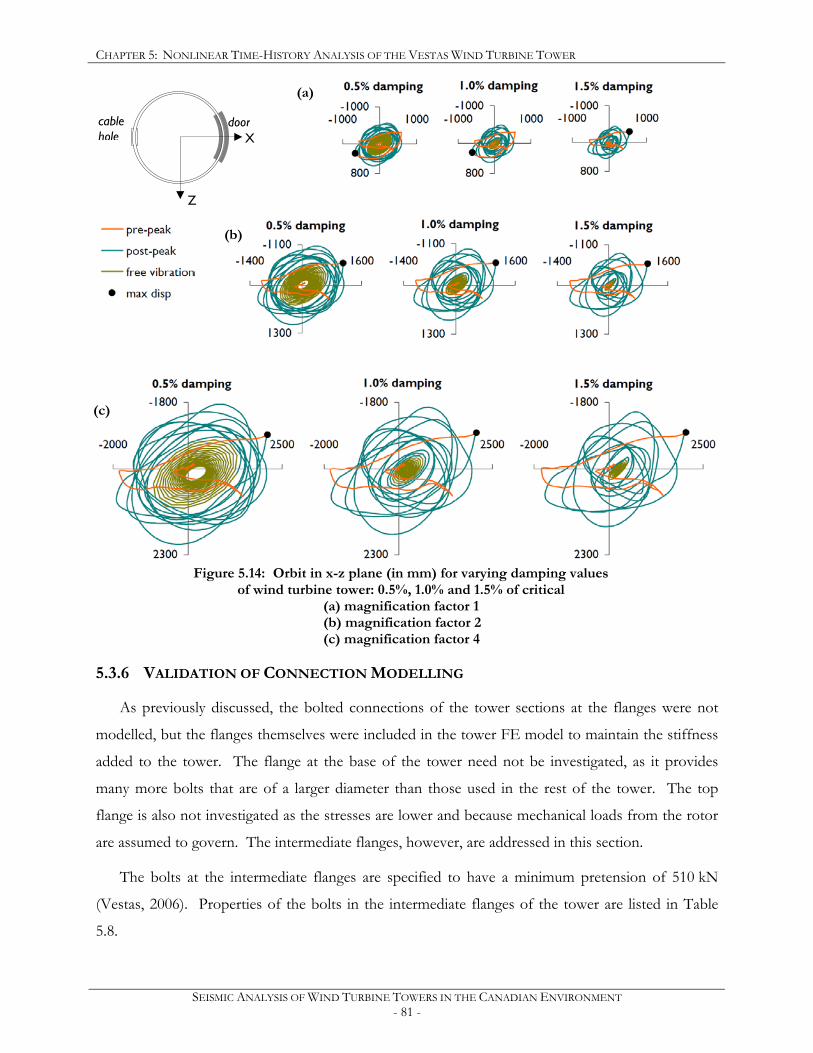
CHAPTER 5: NONLINEAR TIME-HISTORY ANALYSIS OF THE VESTAS WIND TURBINE TOWER
SEISMIC ANALYSIS OF WIND TURBINE TOWERS IN THE CANADIAN ENVIRONMENT - 81 -
Figure 5.14: Orbit in x-z plane (in mm) for varying damping values
of wind turbine tower: 0.5%, 1.0% and 1.5% of critical (a) magnification factor 1 (b) magnification factor 2 (c) magnification factor 4
5.3.6 VALIDATION OF CONNECTION MODELLING
As previously discussed, the bolted connections of the tower sections at the flanges were not
modelled, but the flanges themselves were included in the tower FE model to maintain the stiffness
added to the tower. The flange at the base of the tower need not be investigated, as it provides
many more bolts that are of a larger diameter than those used in the rest of the tower. The top
flange is also not investigated as the stresses are lower and because mechanical loads from the rotor
are assumed to govern. The intermediate flanges, however, are addressed in this section.
The bolts at the intermediate flanges are specified to have a minimum pretension of 510 kN
(Vestas, 2006). Properties of the bolts in the intermediate flanges of the tower are listed in Table
5.8.
(c)
(b)
(a)
door cable hole X
Z
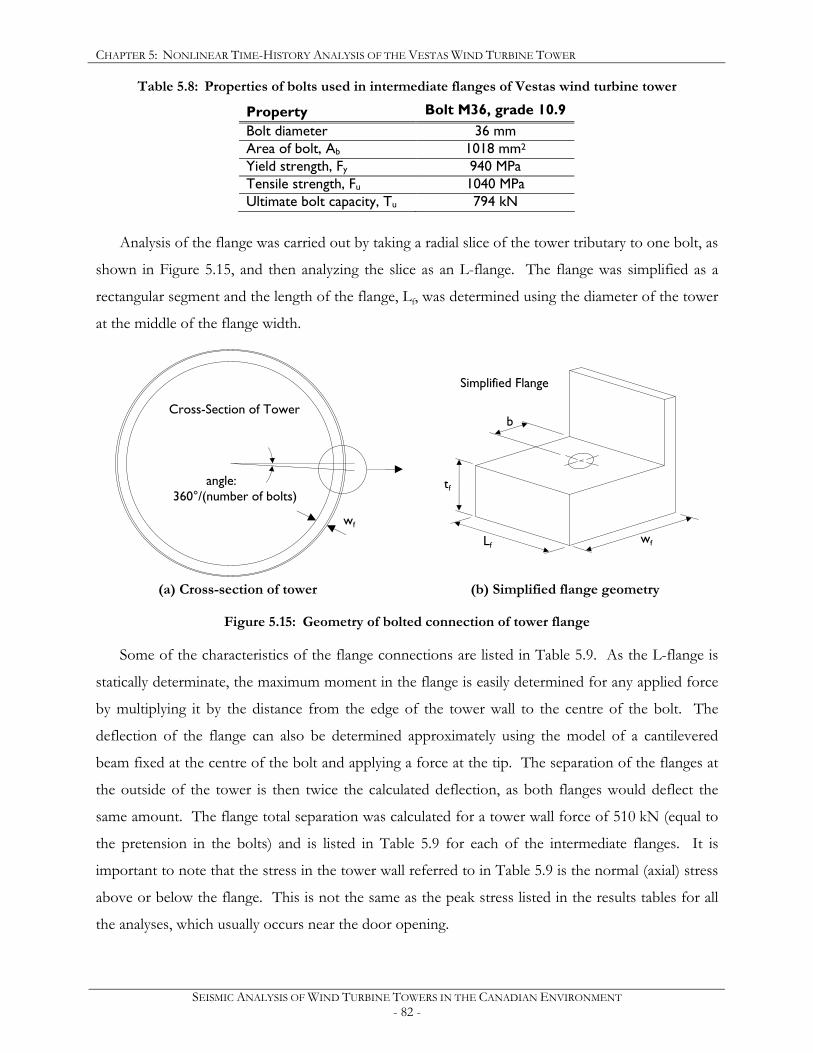
CHAPTER 5: NONLINEAR TIME-HISTORY ANALYSIS OF THE VESTAS WIND TURBINE TOWER
SEISMIC ANALYSIS OF WIND TURBINE TOWERS IN THE CANADIAN ENVIRONMENT - 82 -
Table 5.8: Properties of bolts used in intermediate flanges of Vestas wind turbine tower
Property Bolt M36, grade 10.9 Bolt diameter 36 mm Area of bolt, Ab 1018 mm2 Yield strength, Fy 940 MPa Tensile strength, Fu 1040 MPa Ultimate bolt capacity, Tu 794 kN
Analysis of the flange was carried out by taking a radial slice of the tower tributary to one bolt, as
shown in Figure 5.15, and then analyzing the slice as an L-flange. The flange was simplified as a
rectangular segment and the length of the flange, Lf, was determined using the diameter of the tower
at the middle of the flange width.
(a) Cross-section of tower (b) Simplified flange geometry
Figure 5.15: Geometry of bolted connection of tower flange
Some of the characteristics of the flange connections are listed in Table 5.9. As the L-flange is
statically determinate, the maximum moment in the flange is easily determined for any applied force
by multiplying it by the distance from the edge of the tower wall to the centre of the bolt. The
deflection of the flange can also be determined approximately using the model of a cantilevered
beam fixed at the centre of the bolt and applying a force at the tip. The separation of the flanges at
the outside of the tower is then twice the calculated deflection, as both flanges would deflect the
same amount. The flange total separation was calculated for a tower wall force of 510 kN (equal to
the pretension in the bolts) and is listed in Table 5.9 for each of the intermediate flanges. It is
important to note that the stress in the tower wall referred to in Table 5.9 is the normal (axial) stress
above or below the flange. This is not the same as the peak stress listed in the results tables for all
the analyses, which usually occurs near the door opening.
wf
Lf
tf
Cross-Section of Tower
Simplified Flange
wf
angle: 360°/(number of bolts)
b
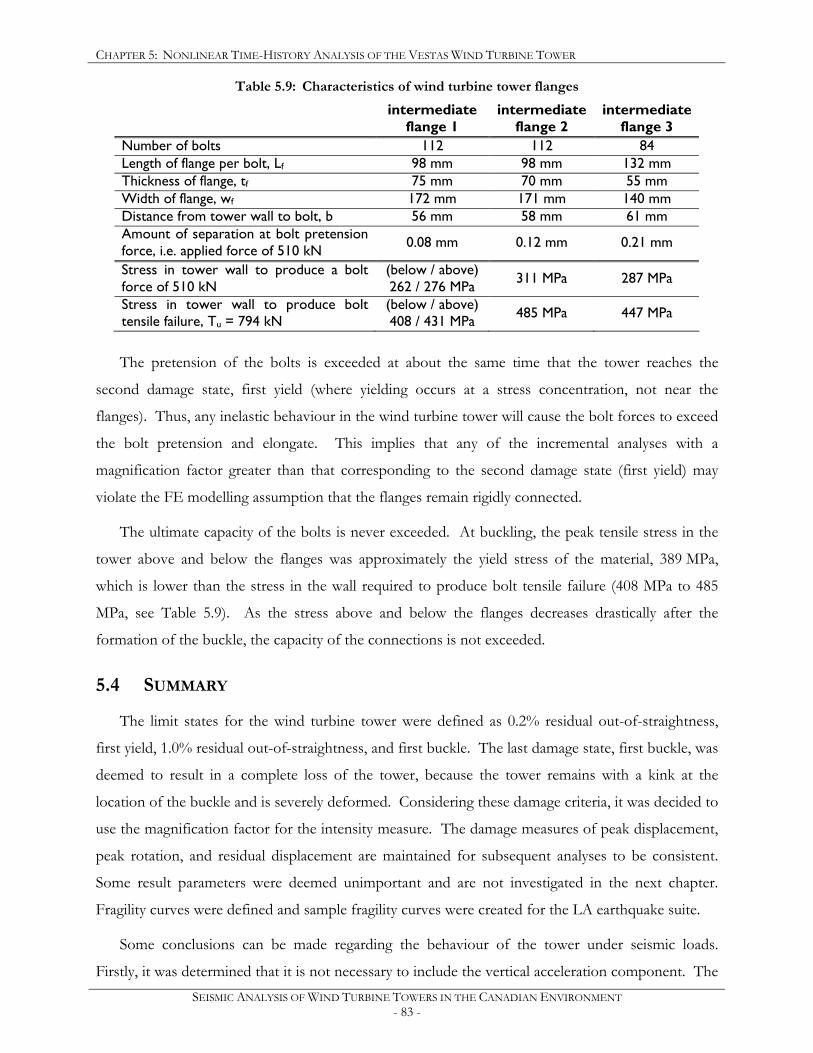
CHAPTER 5: NONLINEAR TIME-HISTORY ANALYSIS OF THE VESTAS WIND TURBINE TOWER
SEISMIC ANALYSIS OF WIND TURBINE TOWERS IN THE CANADIAN ENVIRONMENT - 83 -
Table 5.9: Characteristics of wind turbine tower flanges
intermediate flange 1
intermediate flange 2
intermediate flange 3
Number of bolts 112 112 84 Length of flange per bolt, Lf 98 mm 98 mm 132 mm Thickness of flange, tf 75 mm 70 mm 55 mm Width of flange, wf 172 mm 171 mm 140 mm Distance from tower wall to bolt, b 56 mm 58 mm 61 mm Amount of separation at bolt pretension force, i.e. applied force of 510 kN 0.08 mm 0.12 mm 0.21 mm
Stress in tower wall to produce a bolt force of 510 kN
(below / above) 262 / 276 MPa 311 MPa 287 MPa
Stress in tower wall to produce bolt tensile failure, Tu = 794 kN
(below / above) 408 / 431 MPa 485 MPa 447 MPa
The pretension of the bolts is exceeded at about the same time that the tower reaches the
second damage state, first yield (where yielding occurs at a stress concentration, not near the
flanges). Thus, any inelastic behaviour in the wind turbine tower will cause the bolt forces to exceed
the bolt pretension and elongate. This implies that any of the incremental analyses with a
magnification factor greater than that corresponding to the second damage state (first yield) may
violate the FE modelling assumption that the flanges remain rigidly connected.
The ultimate capacity of the bolts is never exceeded. At buckling, the peak tensile stress in the
tower above and below the flanges was approximately the yield stress of the material, 389 MPa,
which is lower than the stress in the wall required to produce bolt tensile failure (408 MPa to 485
MPa, see Table 5.9). As the stress above and below the flanges decreases drastically after the
formation of the buckle, the capacity of the connections is not exceeded.
5.4 SUMMARY
The limit states for the wind turbine tower were defined as 0.2% residual out-of-straightness,
first yield, 1.0% residual out-of-straightness, and first buckle. The last damage state, first buckle, was
deemed to result in a complete loss of the tower, because the tower remains with a kink at the
location of the buckle and is severely deformed. Considering these damage criteria, it was decided to
use the magnification factor for the intensity measure. The damage measures of peak displacement,
peak rotation, and residual displacement are maintained for subsequent analyses to be consistent.
Some result parameters were deemed unimportant and are not investigated in the next chapter.
Fragility curves were defined and sample fragility curves were created for the LA earthquake suite.
Some conclusions can be made regarding the behaviour of the tower under seismic loads.
Firstly, it was determined that it is not necessary to include the vertical acceleration component. The
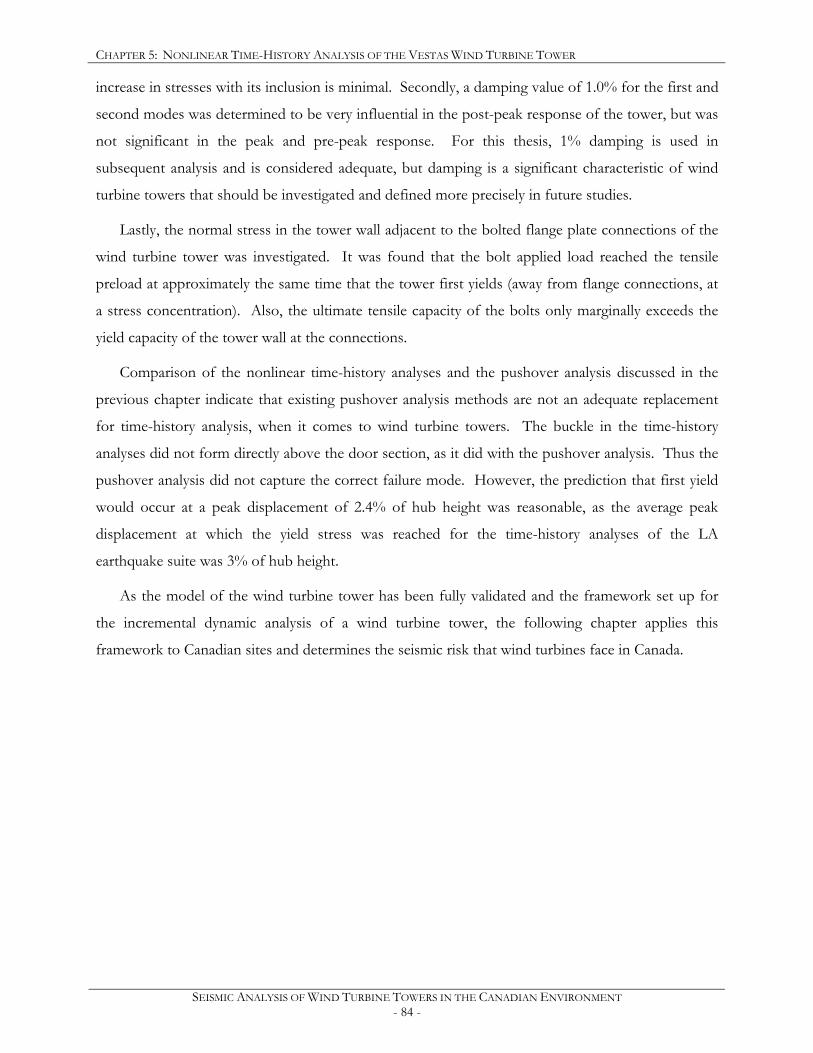
CHAPTER 5: NONLINEAR TIME-HISTORY ANALYSIS OF THE VESTAS WIND TURBINE TOWER
SEISMIC ANALYSIS OF WIND TURBINE TOWERS IN THE CANADIAN ENVIRONMENT - 84 -
increase in stresses with its inclusion is minimal. Secondly, a damping value of 1.0% for the first and
second modes was determined to be very influential in the post-peak response of the tower, but was
not significant in the peak and pre-peak response. For this thesis, 1% damping is used in
subsequent analysis and is considered adequate, but damping is a significant characteristic of wind
turbine towers that should be investigated and defined more precisely in future studies.
Lastly, the normal stress in the tower wall adjacent to the bolted flange plate connections of the
wind turbine tower was investigated. It was found that the bolt applied load reached the tensile
preload at approximately the same time that the tower first yields (away from flange connections, at
a stress concentration). Also, the ultimate tensile capacity of the bolts only marginally exceeds the
yield capacity of the tower wall at the connections.
Comparison of the nonlinear time-history analyses and the pushover analysis discussed in the
previous chapter indicate that existing pushover analysis methods are not an adequate replacement
for time-history analysis, when it comes to wind turbine towers. The buckle in the time-history
analyses did not form directly above the door section, as it did with the pushover analysis. Thus the
pushover analysis did not capture the correct failure mode. However, the prediction that first yield
would occur at a peak displacement of 2.4% of hub height was reasonable, as the average peak
displacement at which the yield stress was reached for the time-history analyses of the LA
earthquake suite was 3% of hub height.
As the model of the wind turbine tower has been fully validated and the framework set up for
the incremental dynamic analysis of a wind turbine tower, the following chapter applies this
framework to Canadian sites and determines the seismic risk that wind turbines face in Canada.
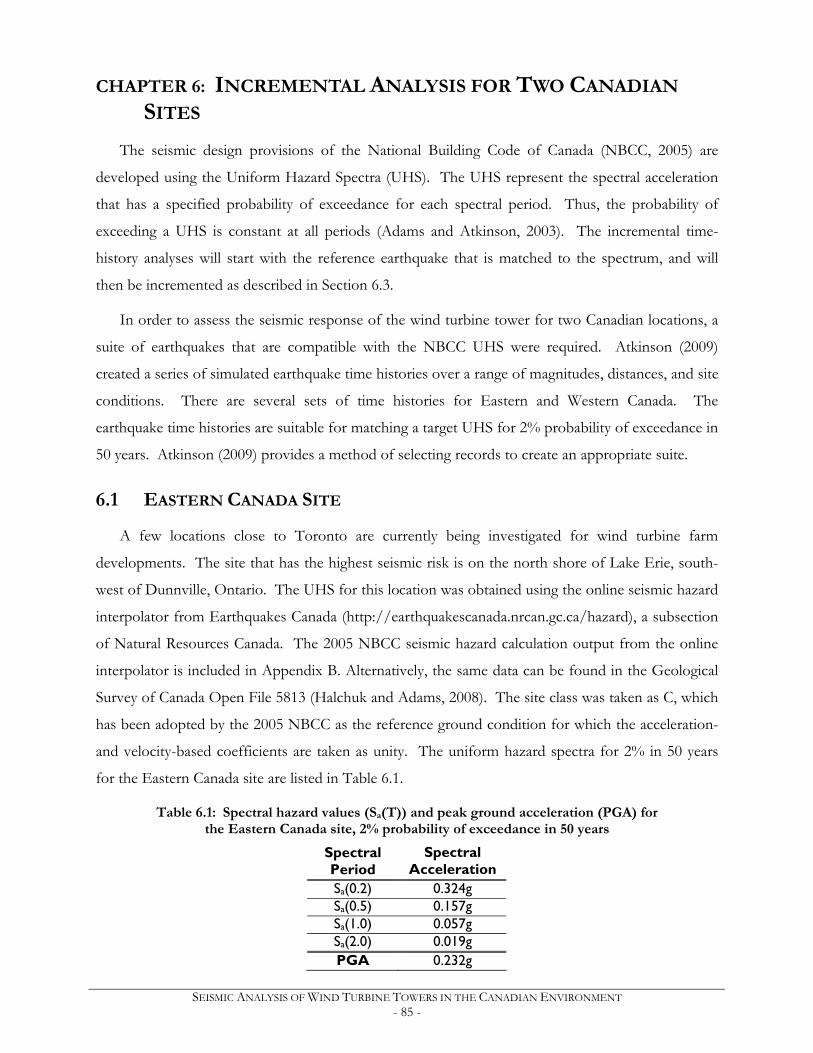
SEISMIC ANALYSIS OF WIND TURBINE TOWERS IN THE CANADIAN ENVIRONMENT - 85 -
CHAPTER 6: INCREMENTAL ANALYSIS FOR TWO CANADIAN
SITES
The seismic design provisions of the National Building Code of Canada (NBCC, 2005) are
developed using the Uniform Hazard Spectra (UHS). The UHS represent the spectral acceleration
that has a specified probability of exceedance for each spectral period. Thus, the probability of
exceeding a UHS is constant at all periods (Adams and Atkinson, 2003). The incremental time-
history analyses will start with the reference earthquake that is matched to the spectrum, and will
then be incremented as described in Section 6.3.
In order to assess the seismic response of the wind turbine tower for two Canadian locations, a
suite of earthquakes that are compatible with the NBCC UHS were required. Atkinson (2009)
created a series of simulated earthquake time histories over a range of magnitudes, distances, and site
conditions. There are several sets of time histories for Eastern and Western Canada. The
earthquake time histories are suitable for matching a target UHS for 2% probability of exceedance in
50 years. Atkinson (2009) provides a method of selecting records to create an appropriate suite.
6.1 EASTERN CANADA SITE
A few locations close to Toronto are currently being investigated for wind turbine farm
developments. The site that has the highest seismic risk is on the north shore of Lake Erie, south-
west of Dunnville, Ontario. The UHS for this location was obtained using the online seismic hazard
interpolator from Earthquakes Canada (http://earthquakescanada.nrcan.gc.ca/hazard), a subsection
of Natural Resources Canada. The 2005 NBCC seismic hazard calculation output from the online
interpolator is included in Appendix B. Alternatively, the same data can be found in the Geological
Survey of Canada Open File 5813 (Halchuk and Adams, 2008). The site class was taken as C, which
has been adopted by the 2005 NBCC as the reference ground condition for which the acceleration-
and velocity-based coefficients are taken as unity. The uniform hazard spectra for 2% in 50 years
for the Eastern Canada site are listed in Table 6.1.
Table 6.1: Spectral hazard values (Sa(T)) and peak ground acceleration (PGA) for the Eastern Canada site, 2% probability of exceedance in 50 years
Spectral Period
Spectral Acceleration
Sa(0.2) 0.324g Sa(0.5) 0.157g Sa(1.0) 0.057g Sa(2.0) 0.019g PGA 0.232g
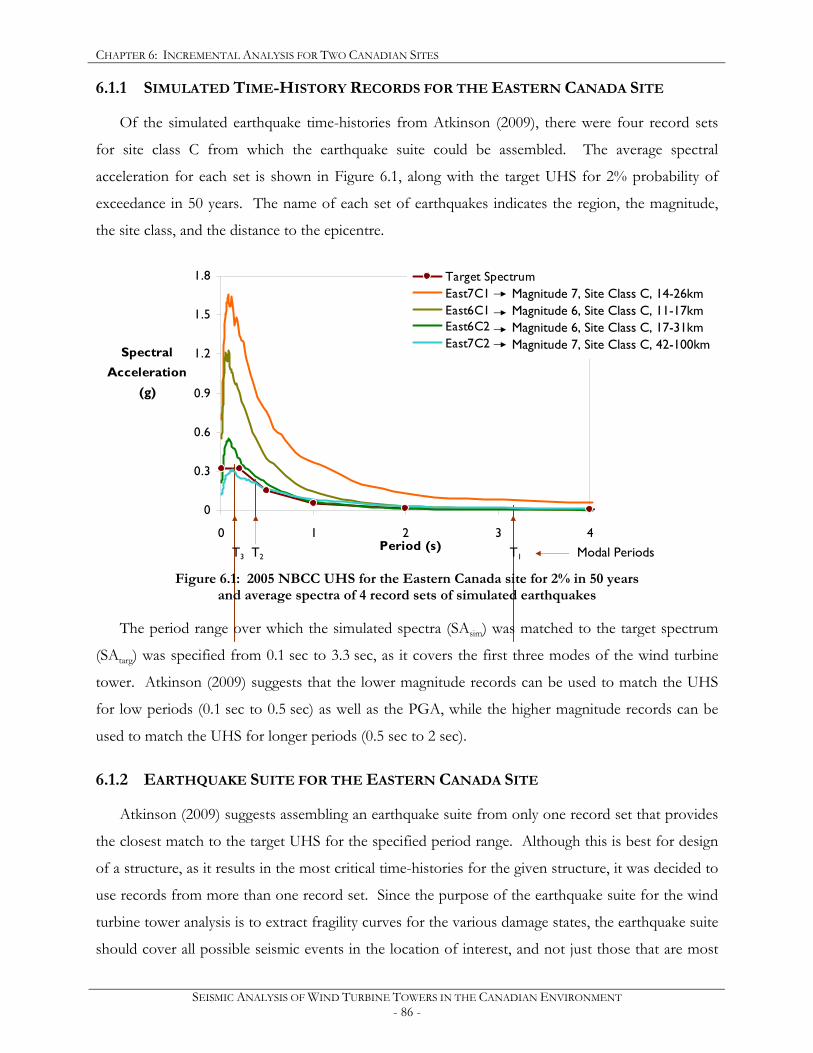
CHAPTER 6: INCREMENTAL ANALYSIS FOR TWO CANADIAN SITES
SEISMIC ANALYSIS OF WIND TURBINE TOWERS IN THE CANADIAN ENVIRONMENT - 86 -
6.1.1 SIMULATED TIME-HISTORY RECORDS FOR THE EASTERN CANADA SITE
Of the simulated earthquake time-histories from Atkinson (2009), there were four record sets
for site class C from which the earthquake suite could be assembled. The average spectral
acceleration for each set is shown in Figure 6.1, along with the target UHS for 2% probability of
exceedance in 50 years. The name of each set of earthquakes indicates the region, the magnitude,
the site class, and the distance to the epicentre.
0
0.3
0.6
0.9
1.2
1.5
1.8
0 1 2 3 4Period (s)
Spectral Acceleration
(g)
Target SpectrumEast7C1East6C1East6C2East7C2
Figure 6.1: 2005 NBCC UHS for the Eastern Canada site for 2% in 50 years
and average spectra of 4 record sets of simulated earthquakes
The period range over which the simulated spectra (SAsim) was matched to the target spectrum
(SAtarg) was specified from 0.1 sec to 3.3 sec, as it covers the first three modes of the wind turbine
tower. Atkinson (2009) suggests that the lower magnitude records can be used to match the UHS
for low periods (0.1 sec to 0.5 sec) as well as the PGA, while the higher magnitude records can be
used to match the UHS for longer periods (0.5 sec to 2 sec).
6.1.2 EARTHQUAKE SUITE FOR THE EASTERN CANADA SITE
Atkinson (2009) suggests assembling an earthquake suite from only one record set that provides
the closest match to the target UHS for the specified period range. Although this is best for design
of a structure, as it results in the most critical time-histories for the given structure, it was decided to
use records from more than one record set. Since the purpose of the earthquake suite for the wind
turbine tower analysis is to extract fragility curves for the various damage states, the earthquake suite
should cover all possible seismic events in the location of interest, and not just those that are most
T3 T2 T1 Modal Periods
Magnitude 7, Site Class C, 14-26km Magnitude 6, Site Class C, 11-17km Magnitude 6, Site Class C, 17-31km Magnitude 7, Site Class C, 42-100km
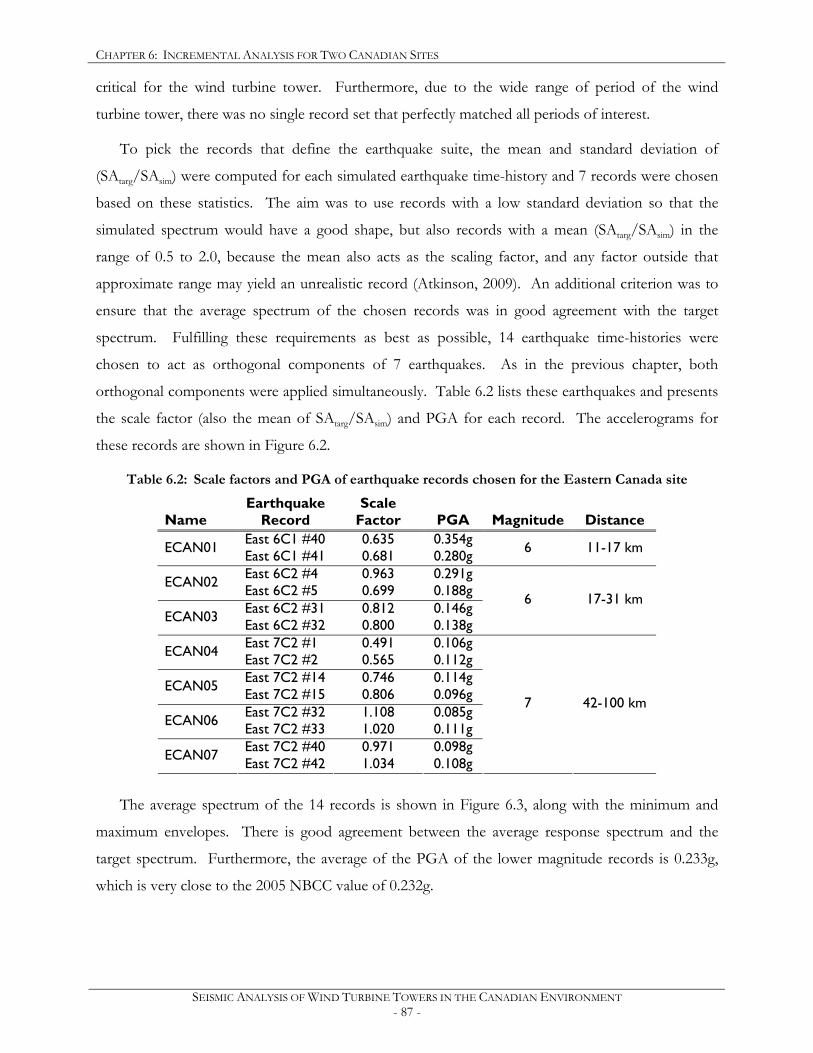
CHAPTER 6: INCREMENTAL ANALYSIS FOR TWO CANADIAN SITES
SEISMIC ANALYSIS OF WIND TURBINE TOWERS IN THE CANADIAN ENVIRONMENT - 87 -
critical for the wind turbine tower. Furthermore, due to the wide range of period of the wind
turbine tower, there was no single record set that perfectly matched all periods of interest.
To pick the records that define the earthquake suite, the mean and standard deviation of
(SAtarg/SAsim) were computed for each simulated earthquake time-history and 7 records were chosen
based on these statistics. The aim was to use records with a low standard deviation so that the
simulated spectrum would have a good shape, but also records with a mean (SAtarg/SAsim) in the
range of 0.5 to 2.0, because the mean also acts as the scaling factor, and any factor outside that
approximate range may yield an unrealistic record (Atkinson, 2009). An additional criterion was to
ensure that the average spectrum of the chosen records was in good agreement with the target
spectrum. Fulfilling these requirements as best as possible, 14 earthquake time-histories were
chosen to act as orthogonal components of 7 earthquakes. As in the previous chapter, both
orthogonal components were applied simultaneously. Table 6.2 lists these earthquakes and presents
the scale factor (also the mean of SAtarg/SAsim) and PGA for each record. The accelerograms for
these records are shown in Figure 6.2.
Table 6.2: Scale factors and PGA of earthquake records chosen for the Eastern Canada site
Name Earthquake
Record Scale
Factor PGA Magnitude Distance
ECAN01 East 6C1 #40 East 6C1 #41
0.635 0.681
0.354g 0.280g 6 11-17 km
ECAN02 East 6C2 #4 East 6C2 #5
0.963 0.699
0.291g 0.188g
ECAN03 East 6C2 #31 East 6C2 #32
0.812 0.800
0.146g 0.138g
6 17-31 km
ECAN04 East 7C2 #1 East 7C2 #2
0.491 0.565
0.106g 0.112g
ECAN05 East 7C2 #14 East 7C2 #15
0.746 0.806
0.114g 0.096g
ECAN06 East 7C2 #32 East 7C2 #33
1.108 1.020
0.085g 0.111g
ECAN07 East 7C2 #40 East 7C2 #42
0.971 1.034
0.098g 0.108g
7 42-100 km
The average spectrum of the 14 records is shown in Figure 6.3, along with the minimum and
maximum envelopes. There is good agreement between the average response spectrum and the
target spectrum. Furthermore, the average of the PGA of the lower magnitude records is 0.233g,
which is very close to the 2005 NBCC value of 0.232g.
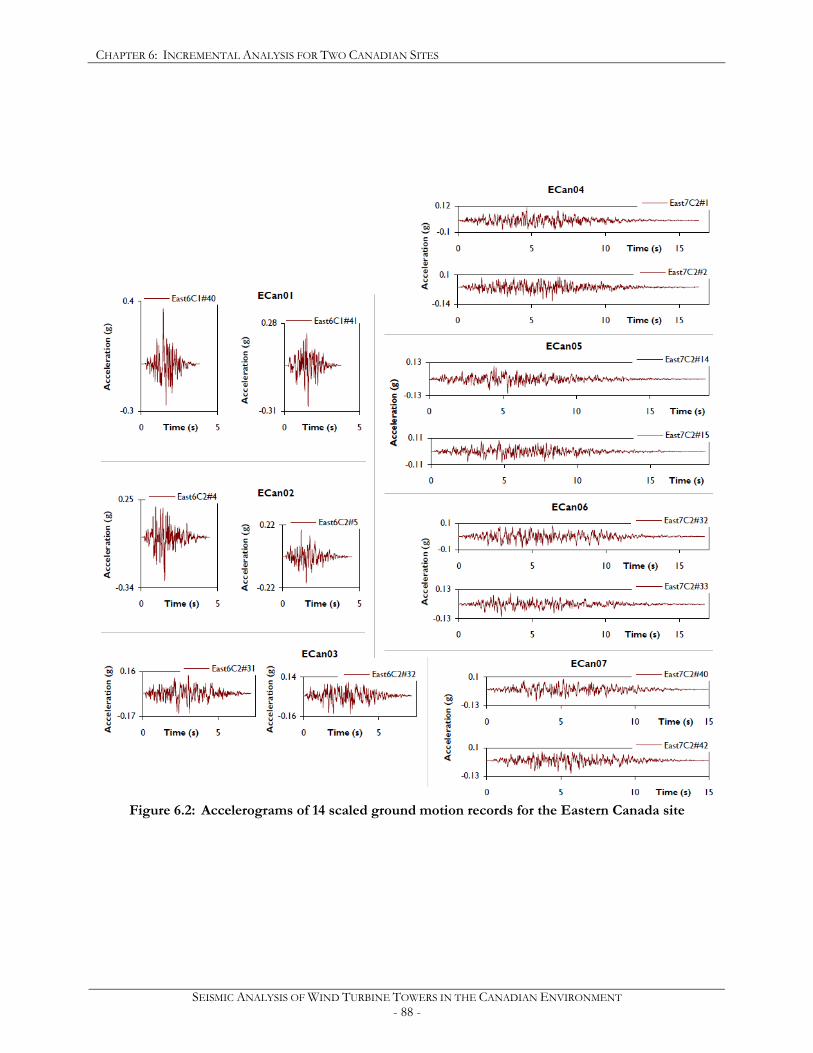
CHAPTER 6: INCREMENTAL ANALYSIS FOR TWO CANADIAN SITES
SEISMIC ANALYSIS OF WIND TURBINE TOWERS IN THE CANADIAN ENVIRONMENT - 88 -
Figure 6.2: Accelerograms of 14 scaled ground motion records for the Eastern Canada site
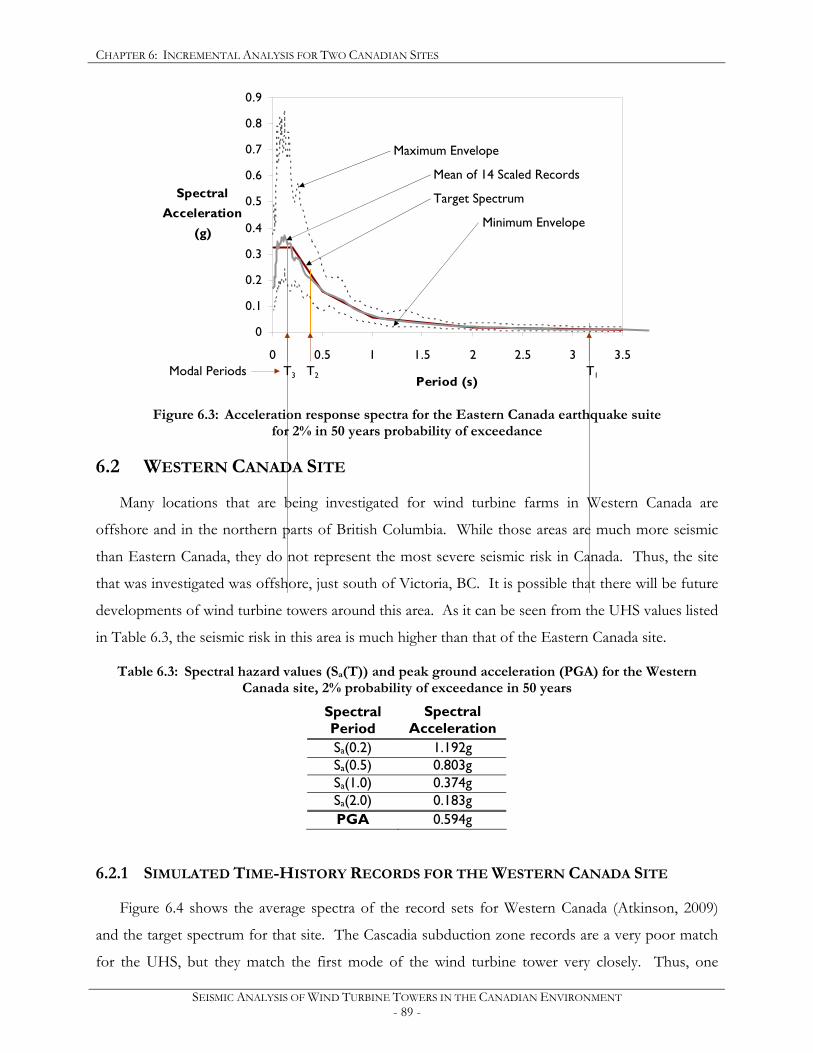
CHAPTER 6: INCREMENTAL ANALYSIS FOR TWO CANADIAN SITES
SEISMIC ANALYSIS OF WIND TURBINE TOWERS IN THE CANADIAN ENVIRONMENT - 89 -
0
0.1
0.2
0.3
0.4
0.5
0.6
0.7
0.8
0.9
0 0.5 1 1.5 2 2.5 3 3.5
Period (s)
Spectral Acceleration
(g)
Figure 6.3: Acceleration response spectra for the Eastern Canada earthquake suite
for 2% in 50 years probability of exceedance
6.2 WESTERN CANADA SITE
Many locations that are being investigated for wind turbine farms in Western Canada are
offshore and in the northern parts of British Columbia. While those areas are much more seismic
than Eastern Canada, they do not represent the most severe seismic risk in Canada. Thus, the site
that was investigated was offshore, just south of Victoria, BC. It is possible that there will be future
developments of wind turbine towers around this area. As it can be seen from the UHS values listed
in Table 6.3, the seismic risk in this area is much higher than that of the Eastern Canada site.
Table 6.3: Spectral hazard values (Sa(T)) and peak ground acceleration (PGA) for the Western Canada site, 2% probability of exceedance in 50 years
Spectral Period
Spectral Acceleration
Sa(0.2) 1.192g Sa(0.5) 0.803g Sa(1.0) 0.374g Sa(2.0) 0.183g PGA 0.594g
6.2.1 SIMULATED TIME-HISTORY RECORDS FOR THE WESTERN CANADA SITE
Figure 6.4 shows the average spectra of the record sets for Western Canada (Atkinson, 2009)
and the target spectrum for that site. The Cascadia subduction zone records are a very poor match
for the UHS, but they match the first mode of the wind turbine tower very closely. Thus, one
Maximum Envelope
Mean of 14 Scaled Records
Target Spectrum
Minimum Envelope
Modal Periods T3 T2 T1
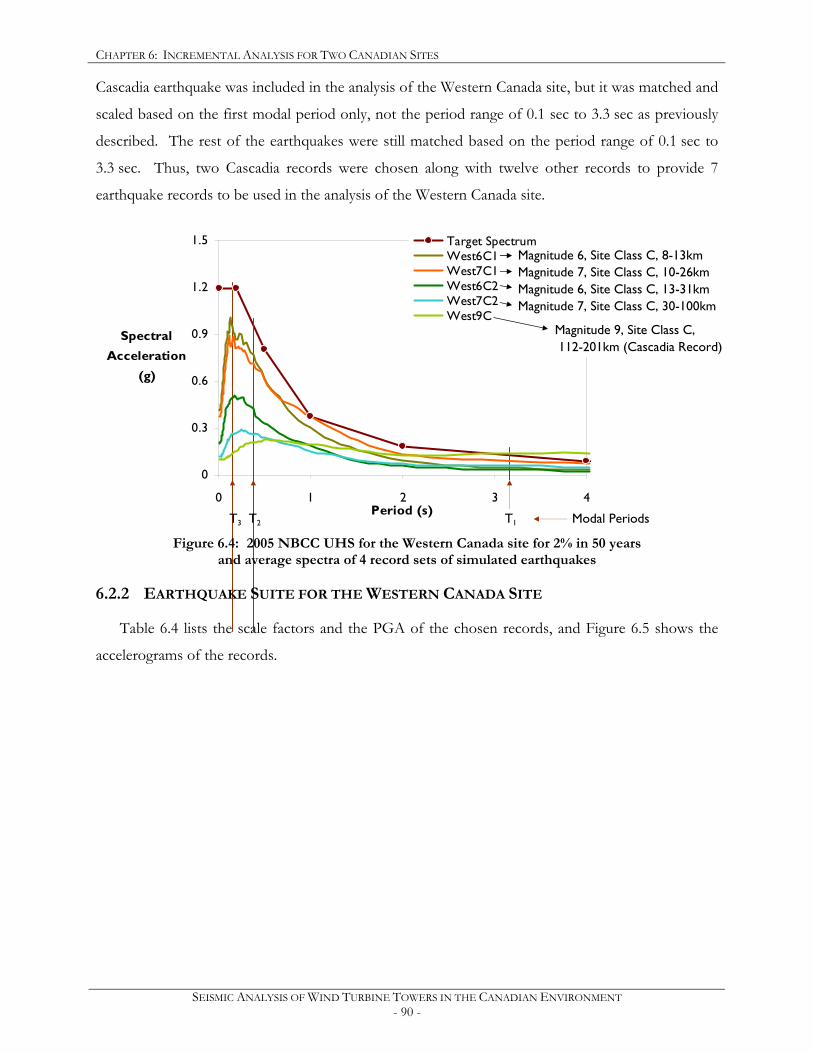
CHAPTER 6: INCREMENTAL ANALYSIS FOR TWO CANADIAN SITES
SEISMIC ANALYSIS OF WIND TURBINE TOWERS IN THE CANADIAN ENVIRONMENT - 90 -
Cascadia earthquake was included in the analysis of the Western Canada site, but it was matched and
scaled based on the first modal period only, not the period range of 0.1 sec to 3.3 sec as previously
described. The rest of the earthquakes were still matched based on the period range of 0.1 sec to
3.3 sec. Thus, two Cascadia records were chosen along with twelve other records to provide 7
earthquake records to be used in the analysis of the Western Canada site.
0
0.3
0.6
0.9
1.2
1.5
0 1 2 3 4Period (s)
Spectral Acceleration
(g)
Target SpectrumWest6C1West7C1West6C2West7C2West9C
Figure 6.4: 2005 NBCC UHS for the Western Canada site for 2% in 50 years
and average spectra of 4 record sets of simulated earthquakes
6.2.2 EARTHQUAKE SUITE FOR THE WESTERN CANADA SITE
Table 6.4 lists the scale factors and the PGA of the chosen records, and Figure 6.5 shows the
accelerograms of the records.
T3 T2 T1 Modal Periods
Magnitude 6, Site Class C, 8-13km Magnitude 7, Site Class C, 10-26km Magnitude 6, Site Class C, 13-31km Magnitude 7, Site Class C, 30-100km
Magnitude 9, Site Class C, 112-201km (Cascadia Record)
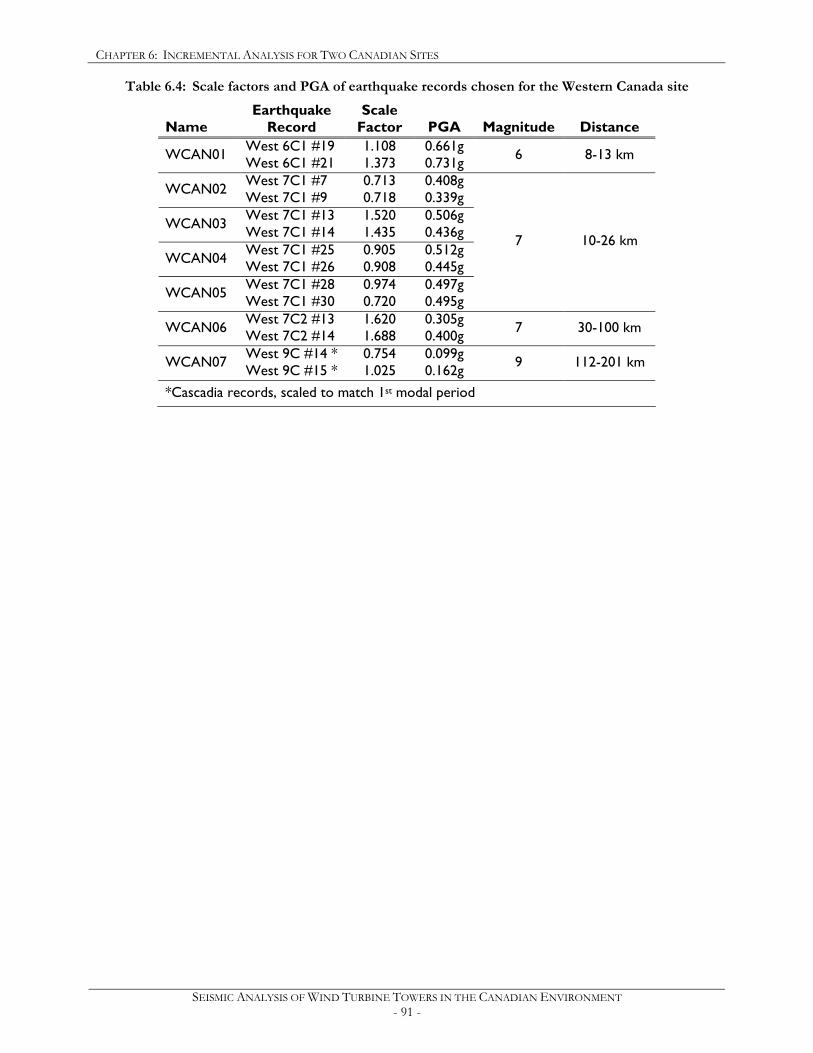
CHAPTER 6: INCREMENTAL ANALYSIS FOR TWO CANADIAN SITES
SEISMIC ANALYSIS OF WIND TURBINE TOWERS IN THE CANADIAN ENVIRONMENT - 91 -
Table 6.4: Scale factors and PGA of earthquake records chosen for the Western Canada site
Name Earthquake
Record Scale
Factor PGA Magnitude Distance
WCAN01 West 6C1 #19 West 6C1 #21
1.108 1.373
0.661g 0.731g 6 8-13 km
WCAN02 West 7C1 #7 West 7C1 #9
0.713 0.718
0.408g 0.339g
WCAN03 West 7C1 #13 West 7C1 #14
1.520 1.435
0.506g 0.436g
WCAN04 West 7C1 #25 West 7C1 #26
0.905 0.908
0.512g 0.445g
WCAN05 West 7C1 #28 West 7C1 #30
0.974 0.720
0.497g 0.495g
7 10-26 km
WCAN06 West 7C2 #13 West 7C2 #14
1.620 1.688
0.305g 0.400g 7 30-100 km
WCAN07 West 9C #14 * West 9C #15 *
0.754 1.025
0.099g 0.162g 9 112-201 km
*Cascadia records, scaled to match 1st modal period
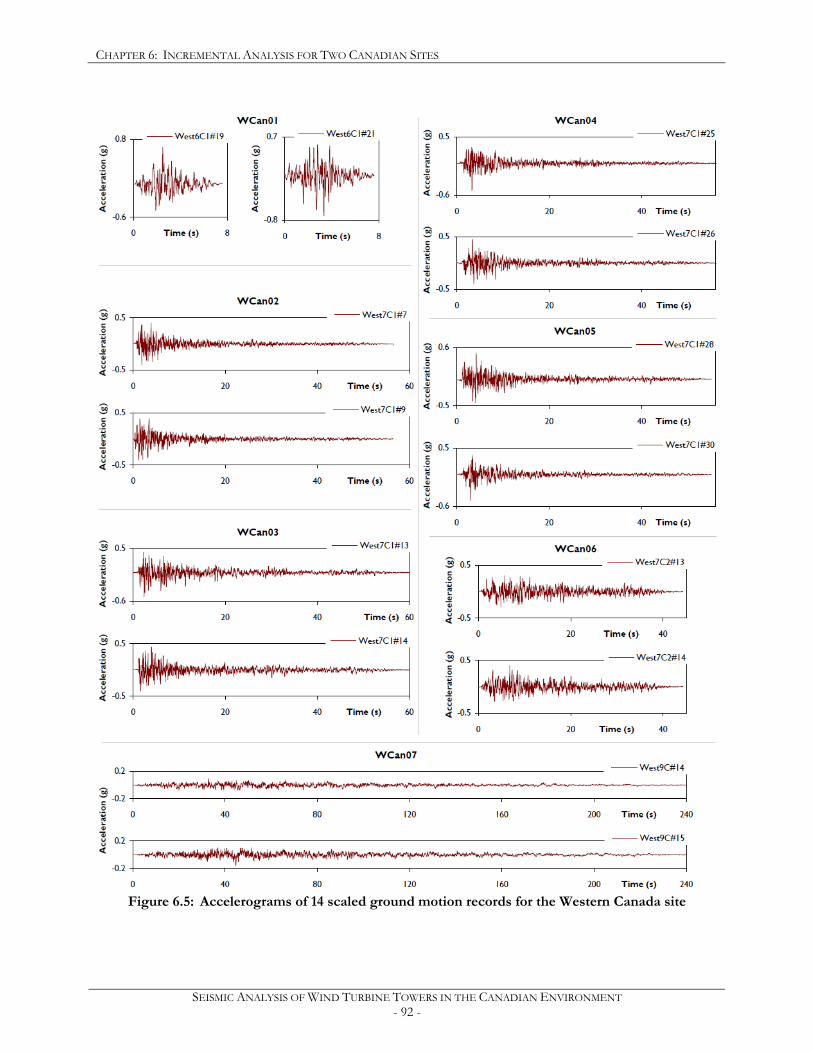
CHAPTER 6: INCREMENTAL ANALYSIS FOR TWO CANADIAN SITES
SEISMIC ANALYSIS OF WIND TURBINE TOWERS IN THE CANADIAN ENVIRONMENT - 92 -
Figure 6.5: Accelerograms of 14 scaled ground motion records for the Western Canada site
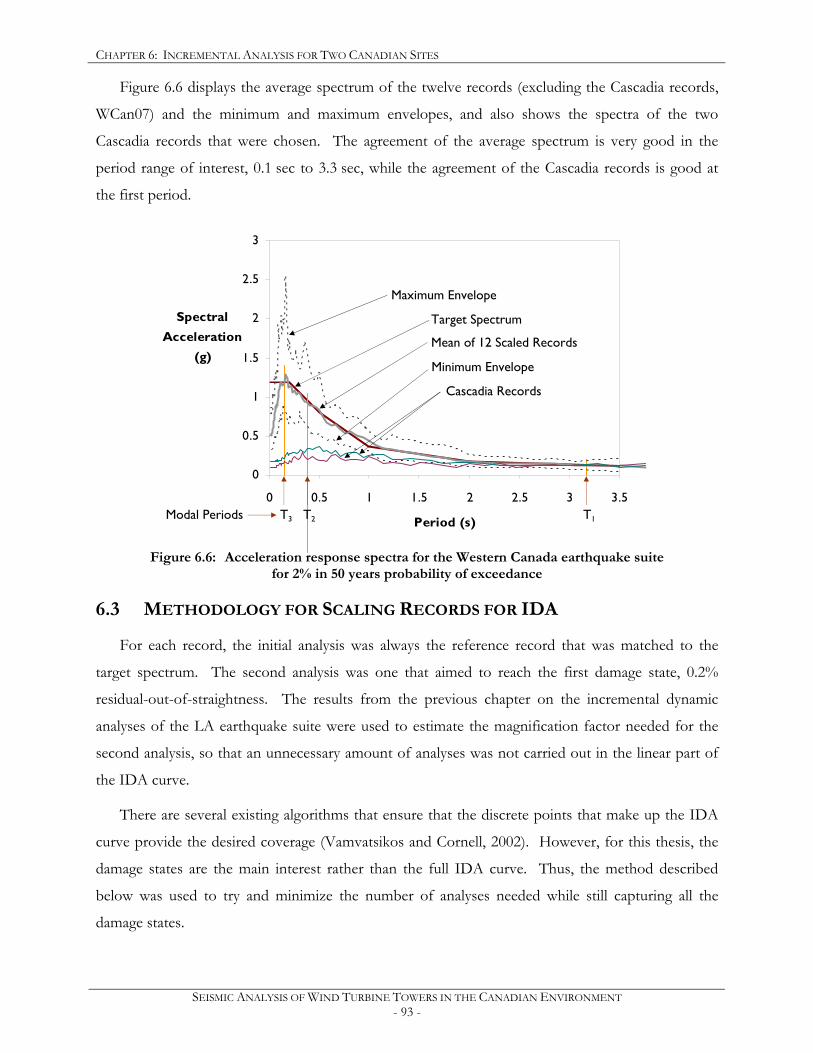
CHAPTER 6: INCREMENTAL ANALYSIS FOR TWO CANADIAN SITES
SEISMIC ANALYSIS OF WIND TURBINE TOWERS IN THE CANADIAN ENVIRONMENT - 93 -
Figure 6.6 displays the average spectrum of the twelve records (excluding the Cascadia records,
WCan07) and the minimum and maximum envelopes, and also shows the spectra of the two
Cascadia records that were chosen. The agreement of the average spectrum is very good in the
period range of interest, 0.1 sec to 3.3 sec, while the agreement of the Cascadia records is good at
the first period.
0
0.5
1
1.5
2
2.5
3
0 0.5 1 1.5 2 2.5 3 3.5
Period (s)
Spectral Acceleration
(g)
Figure 6.6: Acceleration response spectra for the Western Canada earthquake suite
for 2% in 50 years probability of exceedance
6.3 METHODOLOGY FOR SCALING RECORDS FOR IDA
For each record, the initial analysis was always the reference record that was matched to the
target spectrum. The second analysis was one that aimed to reach the first damage state, 0.2%
residual-out-of-straightness. The results from the previous chapter on the incremental dynamic
analyses of the LA earthquake suite were used to estimate the magnification factor needed for the
second analysis, so that an unnecessary amount of analyses was not carried out in the linear part of
the IDA curve.
There are several existing algorithms that ensure that the discrete points that make up the IDA
curve provide the desired coverage (Vamvatsikos and Cornell, 2002). However, for this thesis, the
damage states are the main interest rather than the full IDA curve. Thus, the method described
below was used to try and minimize the number of analyses needed while still capturing all the
damage states.
Maximum Envelope
Target Spectrum
Minimum Envelope
Modal Periods T3 T2 T1
Mean of 12 Scaled Records
Cascadia Records
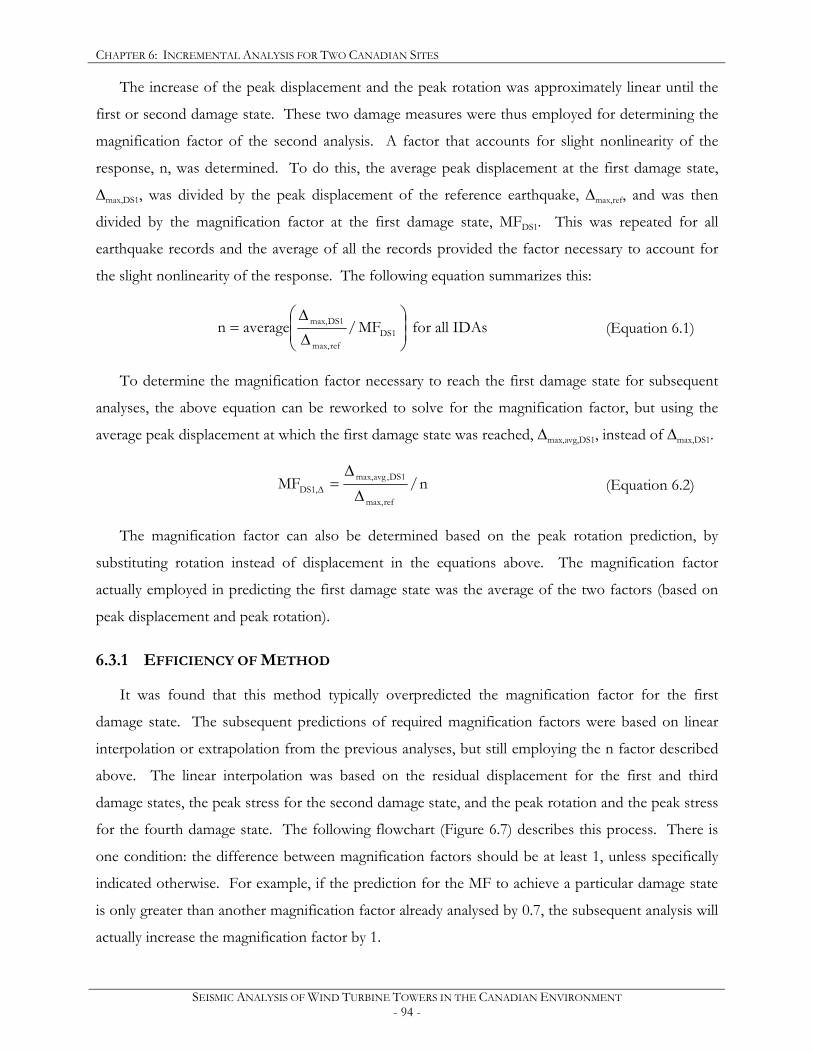
CHAPTER 6: INCREMENTAL ANALYSIS FOR TWO CANADIAN SITES
SEISMIC ANALYSIS OF WIND TURBINE TOWERS IN THE CANADIAN ENVIRONMENT - 94 -
The increase of the peak displacement and the peak rotation was approximately linear until the
first or second damage state. These two damage measures were thus employed for determining the
magnification factor of the second analysis. A factor that accounts for slight nonlinearity of the
response, n, was determined. To do this, the average peak displacement at the first damage state,
∆max,DS1, was divided by the peak displacement of the reference earthquake, ∆max,ref, and was then
divided by the magnification factor at the first damage state, MFDS1. This was repeated for all
earthquake records and the average of all the records provided the factor necessary to account for
the slight nonlinearity of the response. The following equation summarizes this:
∆
∆= 1DS
refmax,
1DSmax, MF/averagen for all IDAs (Equation 6.1)
To determine the magnification factor necessary to reach the first damage state for subsequent
analyses, the above equation can be reworked to solve for the magnification factor, but using the
average peak displacement at which the first damage state was reached, ∆max,avg,DS1, instead of ∆max,DS1.
n/MFrefmax,
1DS,avgmax,,1DS ∆
∆=∆ (Equation 6.2)
The magnification factor can also be determined based on the peak rotation prediction, by
substituting rotation instead of displacement in the equations above. The magnification factor
actually employed in predicting the first damage state was the average of the two factors (based on
peak displacement and peak rotation).
6.3.1 EFFICIENCY OF METHOD
It was found that this method typically overpredicted the magnification factor for the first
damage state. The subsequent predictions of required magnification factors were based on linear
interpolation or extrapolation from the previous analyses, but still employing the n factor described
above. The linear interpolation was based on the residual displacement for the first and third
damage states, the peak stress for the second damage state, and the peak rotation and the peak stress
for the fourth damage state. The following flowchart (Figure 6.7) describes this process. There is
one condition: the difference between magnification factors should be at least 1, unless specifically
indicated otherwise. For example, if the prediction for the MF to achieve a particular damage state
is only greater than another magnification factor already analysed by 0.7, the subsequent analysis will
actually increase the magnification factor by 1.
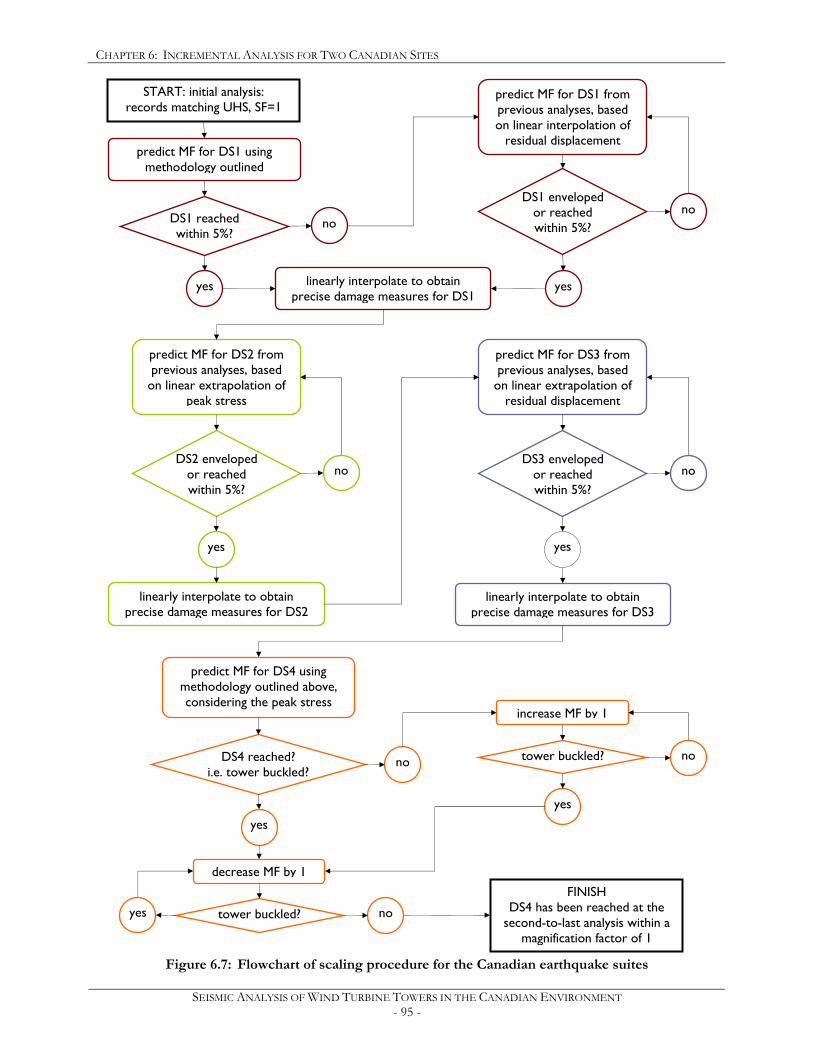
CHAPTER 6: INCREMENTAL ANALYSIS FOR TWO CANADIAN SITES
SEISMIC ANALYSIS OF WIND TURBINE TOWERS IN THE CANADIAN ENVIRONMENT - 95 -
Figure 6.7: Flowchart of scaling procedure for the Canadian earthquake suites
no
predict MF for DS1 from previous analyses, based on linear interpolation of
residual displacement
DS1 envelopedor reached within 5%?
linearly interpolate to obtain precise damage measures for DS3
predict MF for DS4 using methodology outlined above, considering the peak stress
DS4 reached? i.e. tower buckled?
no
yes
predict MF for DS2 from previous analyses, based
on linear extrapolation of peak stress
DS2 envelopedor reached within 5%?
no
yes
linearly interpolate to obtain precise damage measures for DS2
predict MF for DS3 from previous analyses, based
on linear extrapolation of residual displacement
DS3 envelopedor reached within 5%?
no
yes
predict MF for DS1 using methodology outlined
DS1 reached within 5%?
yes
no
linearly interpolate to obtain precise damage measures for DS1
yes
increase MF by 1
decrease MF by 1
tower buckled?yes
tower buckled? no
yes
no
START: initial analysis: records matching UHS, SF=1
FINISH DS4 has been reached at the
second-to-last analysis within a magnification factor of 1
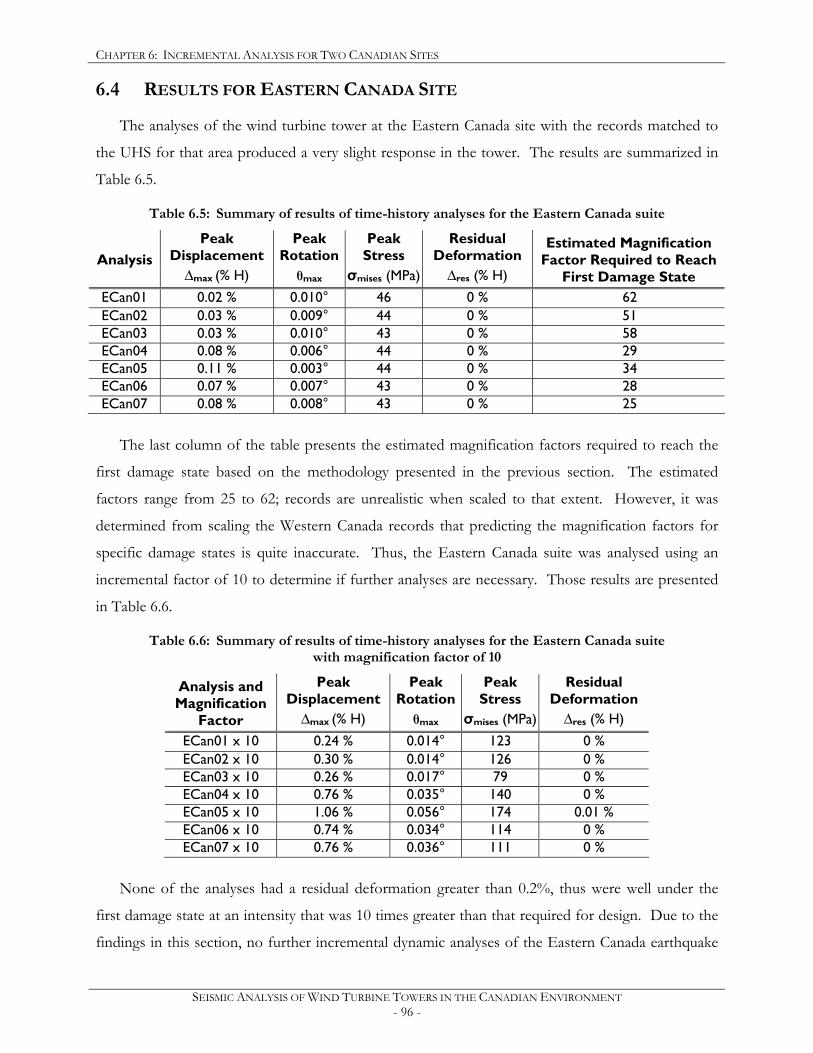
CHAPTER 6: INCREMENTAL ANALYSIS FOR TWO CANADIAN SITES
SEISMIC ANALYSIS OF WIND TURBINE TOWERS IN THE CANADIAN ENVIRONMENT - 96 -
6.4 RESULTS FOR EASTERN CANADA SITE
The analyses of the wind turbine tower at the Eastern Canada site with the records matched to
the UHS for that area produced a very slight response in the tower. The results are summarized in
Table 6.5.
Table 6.5: Summary of results of time-history analyses for the Eastern Canada suite
Peak Displacement
Peak Rotation
Peak Stress
Residual Deformation Analysis
∆max (% H) θmax σmises (MPa) ∆res (% H)
Estimated Magnification Factor Required to Reach
First Damage State ECan01 0.02 % 0.010° 46 0 % 62 ECan02 0.03 % 0.009° 44 0 % 51 ECan03 0.03 % 0.010° 43 0 % 58 ECan04 0.08 % 0.006° 44 0 % 29 ECan05 0.11 % 0.003° 44 0 % 34 ECan06 0.07 % 0.007° 43 0 % 28 ECan07 0.08 % 0.008° 43 0 % 25
The last column of the table presents the estimated magnification factors required to reach the
first damage state based on the methodology presented in the previous section. The estimated
factors range from 25 to 62; records are unrealistic when scaled to that extent. However, it was
determined from scaling the Western Canada records that predicting the magnification factors for
specific damage states is quite inaccurate. Thus, the Eastern Canada suite was analysed using an
incremental factor of 10 to determine if further analyses are necessary. Those results are presented
in Table 6.6.
Table 6.6: Summary of results of time-history analyses for the Eastern Canada suite with magnification factor of 10
Peak Displacement
Peak Rotation
Peak Stress
Residual Deformation
Analysis and Magnification
Factor ∆max (% H) θmax σmises (MPa) ∆res (% H) ECan01 x 10 0.24 % 0.014° 123 0 % ECan02 x 10 0.30 % 0.014° 126 0 % ECan03 x 10 0.26 % 0.017° 79 0 % ECan04 x 10 0.76 % 0.035° 140 0 % ECan05 x 10 1.06 % 0.056° 174 0.01 % ECan06 x 10 0.74 % 0.034° 114 0 % ECan07 x 10 0.76 % 0.036° 111 0 %
None of the analyses had a residual deformation greater than 0.2%, thus were well under the
first damage state at an intensity that was 10 times greater than that required for design. Due to the
findings in this section, no further incremental dynamic analyses of the Eastern Canada earthquake
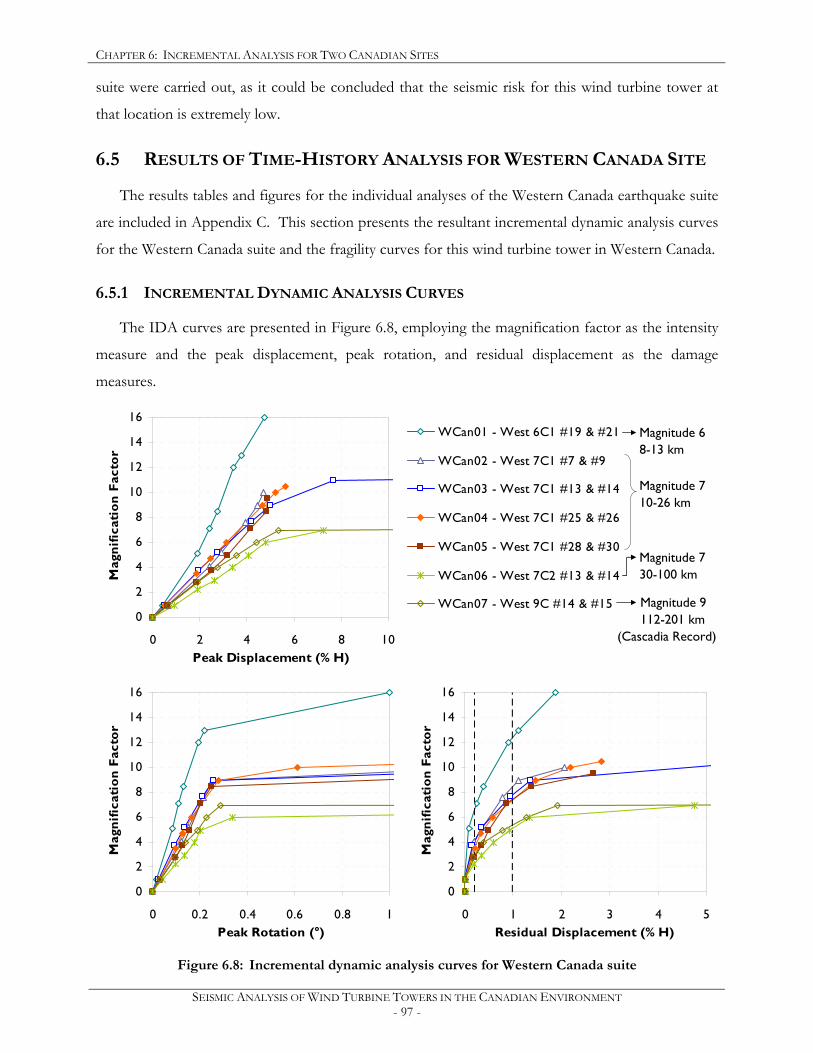
CHAPTER 6: INCREMENTAL ANALYSIS FOR TWO CANADIAN SITES
SEISMIC ANALYSIS OF WIND TURBINE TOWERS IN THE CANADIAN ENVIRONMENT - 97 -
suite were carried out, as it could be concluded that the seismic risk for this wind turbine tower at
that location is extremely low.
6.5 RESULTS OF TIME-HISTORY ANALYSIS FOR WESTERN CANADA SITE
The results tables and figures for the individual analyses of the Western Canada earthquake suite
are included in Appendix C. This section presents the resultant incremental dynamic analysis curves
for the Western Canada suite and the fragility curves for this wind turbine tower in Western Canada.
6.5.1 INCREMENTAL DYNAMIC ANALYSIS CURVES
The IDA curves are presented in Figure 6.8, employing the magnification factor as the intensity
measure and the peak displacement, peak rotation, and residual displacement as the damage
measures.
0
2
4
6
8
10
12
14
16
0 2 4 6 8 10Peak Displacement (% H)
Mag
nific
atio
n Fa
ctor
WCan01 - West 6C1 #19 & #21
WCan02 - West 7C1 #7 & #9
WCan03 - West 7C1 #13 & #14
WCan04 - West 7C1 #25 & #26
WCan05 - West 7C1 #28 & #30
WCan06 - West 7C2 #13 & #14
WCan07 - West 9C #14 & #15
0
2
4
6
8
10
12
14
16
0 0.2 0.4 0.6 0.8 1Peak Rotation (°)
Mag
nific
atio
n Fa
ctor
0
2
4
6
8
10
12
14
16
0 1 2 3 4 5Residual Displacement (% H)
Mag
nific
atio
n Fa
ctor
Figure 6.8: Incremental dynamic analysis curves for Western Canada suite
Magnitude 6 8-13 km Magnitude 7 10-26 km
Magnitude 7 30-100 km
Magnitude 9 112-201 km
(Cascadia Record)
CHAPTER 6: INCREMENTAL ANALYSIS FOR TWO CANADIAN SITES
SEISMIC ANALYSIS OF WIND TURBINE TOWERS IN THE CANADIAN ENVIRONMENT - 98 -
The dispersion of the IDA curves is quite high because the suite was made up of records from 4
records sets, as described in Section 6.2. Earthquake records from the same record set have very
low dispersion, as can be seen from the IDA curves for WCan02, WCan03, WCan04 and WCan05.
These four analyses were based on record set 7C1 (Magnitude 7 on Site Class C and at distance of
10-26 km).
The most significant outlier is WCan01, which is from the record set of ground motions at the
closest distance. That record set, 6C1, is characterized by high spectral accelerations in the low
frequency range. The results from WCan01 thus confirm that a lower magnitude earthquake record
at a close distance will have the least impact on the wind turbine tower, as suggested by Atkinson
(2009).
WCan06 and WCan07 are also of interest as they represent the opposite of WCan01, both
regarding the records and the results of the IDA. They are based on record sets of a higher
magnitude and at significantly larger distances, and the results constitute the most critical response
of the wind turbine tower. This is consistent for all the damage measures shown in Figure 6.8. It in
also interesting to note that the Cascadia Record (WCan07) was slightly less intense for the wind
turbine tower than the Magnitude 7, 30-100 km record (WCan06). This may be due to the influence
of higher modes, for which WCan06 was much more intense.
6.5.1.1 AVERAGE DAMAGE MEASURES
The average damage measures for the Western Canada earthquake suite for each damage state
are listed in Table 6.7, along with the minimum and maximum values of the damage measures. As
previously stated, the peak stress may appear very high; however, that is typically the stress at a stress
concentration, not in the tower wall. The averages listed are not very close to those of the LA
earthquake suite (Table 5.3 in the previous chapter), thus it is not surprising that predicting the
magnification factors was not very accurate.
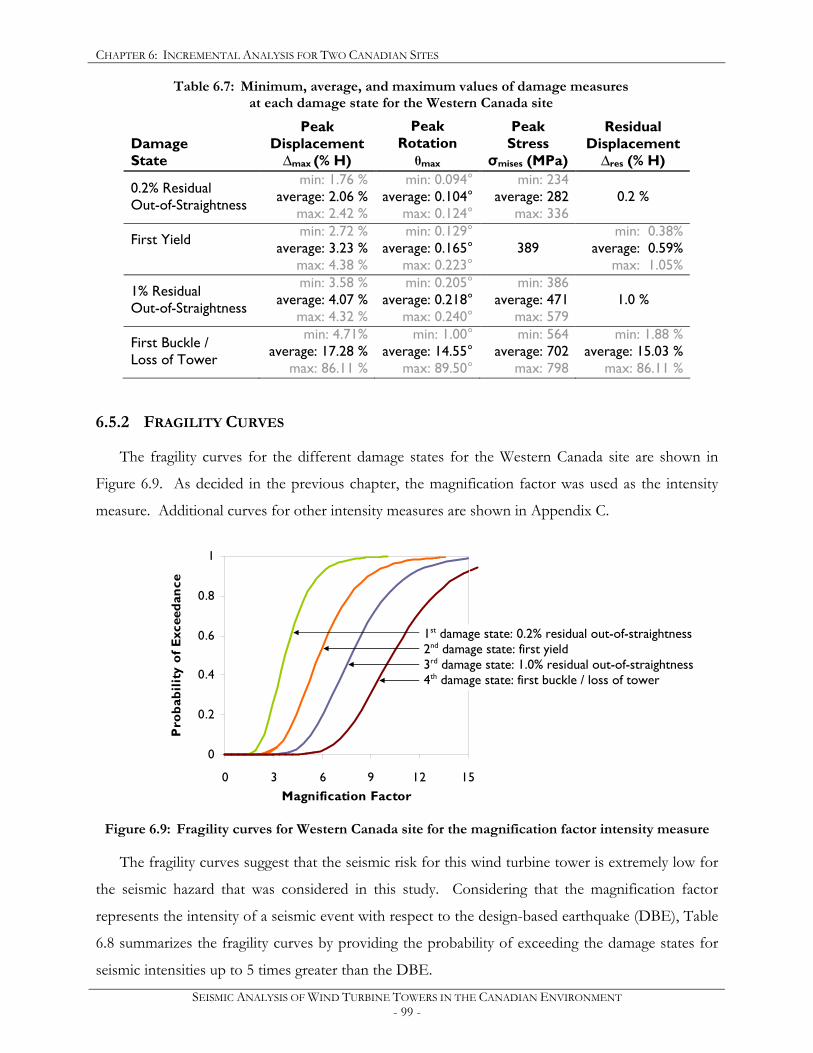
CHAPTER 6: INCREMENTAL ANALYSIS FOR TWO CANADIAN SITES
SEISMIC ANALYSIS OF WIND TURBINE TOWERS IN THE CANADIAN ENVIRONMENT - 99 -
Table 6.7: Minimum, average, and maximum values of damage measures at each damage state for the Western Canada site
Damage State
Peak Displacement ∆max (% H)
Peak Rotation θmax
Peak Stress
σmises (MPa)
Residual Displacement ∆res (% H)
0.2% Residual Out-of-Straightness
min: 1.76 % average: 2.06 %
max: 2.42 %
min: 0.094° average: 0.104°
max: 0.124°
min: 234 average: 282
max: 336 0.2 %
First Yield
min: 2.72 % average: 3.23 %
max: 4.38 %
min: 0.129° average: 0.165°
max: 0.223° 389
min: 0.38% average: 0.59%
max: 1.05%
1% Residual Out-of-Straightness
min: 3.58 % average: 4.07 %
max: 4.32 %
min: 0.205° average: 0.218°
max: 0.240°
min: 386 average: 471
max: 579 1.0 %
First Buckle / Loss of Tower
min: 4.71% average: 17.28 %
max: 86.11 %
min: 1.00° average: 14.55°
max: 89.50°
min: 564 average: 702
max: 798
min: 1.88 % average: 15.03 %
max: 86.11 %
6.5.2 FRAGILITY CURVES
The fragility curves for the different damage states for the Western Canada site are shown in
Figure 6.9. As decided in the previous chapter, the magnification factor was used as the intensity
measure. Additional curves for other intensity measures are shown in Appendix C.
0
0.2
0.4
0.6
0.8
1
0 3 6 9 12 15Magnification Factor
Pro
babi
lity
of E
xcee
danc
e
Figure 6.9: Fragility curves for Western Canada site for the magnification factor intensity measure
The fragility curves suggest that the seismic risk for this wind turbine tower is extremely low for
the seismic hazard that was considered in this study. Considering that the magnification factor
represents the intensity of a seismic event with respect to the design-based earthquake (DBE), Table
6.8 summarizes the fragility curves by providing the probability of exceeding the damage states for
seismic intensities up to 5 times greater than the DBE.
1st damage state: 0.2% residual out-of-straightness 2nd damage state: first yield 3rd damage state: 1.0% residual out-of-straightness 4th damage state: first buckle / loss of tower
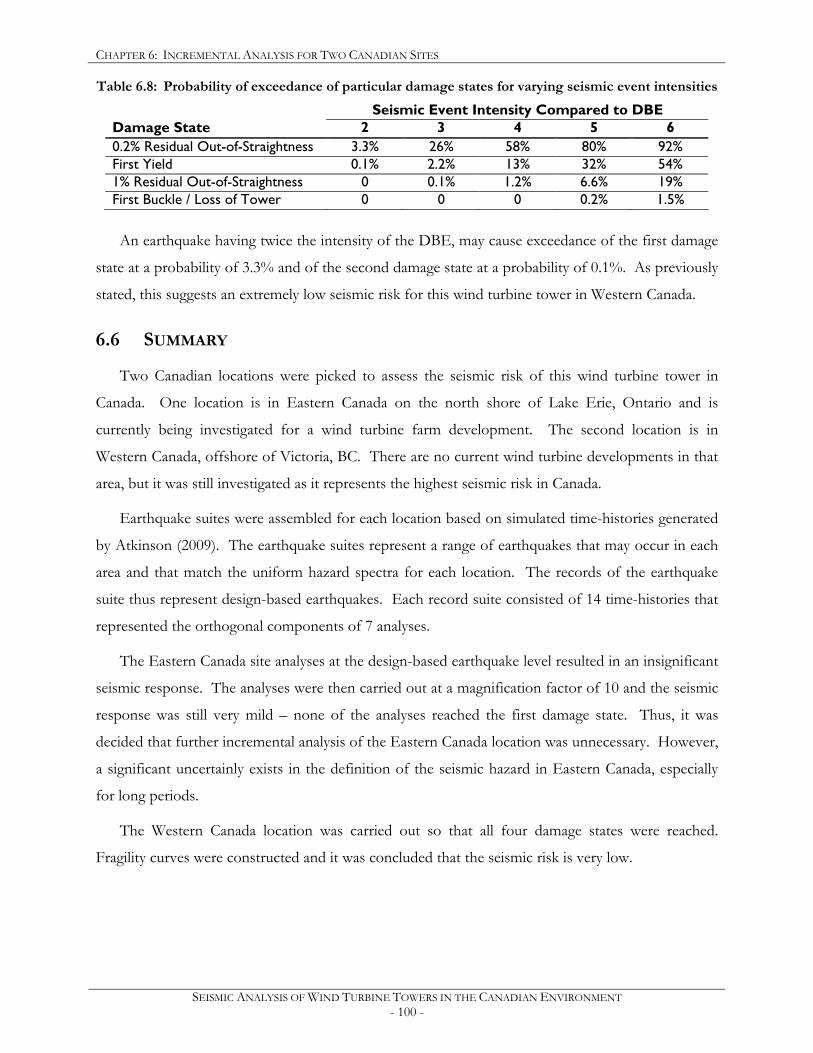
CHAPTER 6: INCREMENTAL ANALYSIS FOR TWO CANADIAN SITES
SEISMIC ANALYSIS OF WIND TURBINE TOWERS IN THE CANADIAN ENVIRONMENT - 100 -
Table 6.8: Probability of exceedance of particular damage states for varying seismic event intensities
Seismic Event Intensity Compared to DBE Damage State 2 3 4 5 6 0.2% Residual Out-of-Straightness 3.3% 26% 58% 80% 92% First Yield 0.1% 2.2% 13% 32% 54% 1% Residual Out-of-Straightness 0 0.1% 1.2% 6.6% 19% First Buckle / Loss of Tower 0 0 0 0.2% 1.5%
An earthquake having twice the intensity of the DBE, may cause exceedance of the first damage
state at a probability of 3.3% and of the second damage state at a probability of 0.1%. As previously
stated, this suggests an extremely low seismic risk for this wind turbine tower in Western Canada.
6.6 SUMMARY
Two Canadian locations were picked to assess the seismic risk of this wind turbine tower in
Canada. One location is in Eastern Canada on the north shore of Lake Erie, Ontario and is
currently being investigated for a wind turbine farm development. The second location is in
Western Canada, offshore of Victoria, BC. There are no current wind turbine developments in that
area, but it was still investigated as it represents the highest seismic risk in Canada.
Earthquake suites were assembled for each location based on simulated time-histories generated
by Atkinson (2009). The earthquake suites represent a range of earthquakes that may occur in each
area and that match the uniform hazard spectra for each location. The records of the earthquake
suite thus represent design-based earthquakes. Each record suite consisted of 14 time-histories that
represented the orthogonal components of 7 analyses.
The Eastern Canada site analyses at the design-based earthquake level resulted in an insignificant
seismic response. The analyses were then carried out at a magnification factor of 10 and the seismic
response was still very mild – none of the analyses reached the first damage state. Thus, it was
decided that further incremental analysis of the Eastern Canada location was unnecessary. However,
a significant uncertainly exists in the definition of the seismic hazard in Eastern Canada, especially
for long periods.
The Western Canada location was carried out so that all four damage states were reached.
Fragility curves were constructed and it was concluded that the seismic risk is very low.
SEISMIC ANALYSIS OF WIND TURBINE TOWERS IN THE CANADIAN ENVIRONMENT - 101 -
CHAPTER 7: CONCLUSIONS AND RECOMMENDATIONS
This thesis investigated the behaviour of the tubular steel wind turbine tower of a typical
1.65MW parked wind turbine under seismic loading, and evaluated its seismic risk for two Canadian
locations. A finite element model was thoroughly validated and the expected failure mode, inelastic
buckling in flexure, was adequately captured. Earthquake suites were assembled and used to carry
out nonlinear incremental dynamic analysis. Fragility curves were defined for four potential damage
states of the wind turbine tower: 0.2% residual out-of-straightness, first yield at a stress
concentration, 1% residual out-of-straightness, and first buckle. The results obtained, discussed
shortly, represent the seismic hazard of the investigated wind turbine tower in a few locations.
However, the main contribution of this thesis is the framework that was set up to assess the seismic
risk of any tubular steel wind turbine tower subject to any level of seismic hazard.
The incremental analyses for either location in Canada suggest that the seismic risk for the wind
turbine tower that was investigated is very small. This is due to the long fundamental period of the
tower and the very short predominant period of most earthquakes. The response of the wind
turbine tower subjected to the Eastern Canada (Ontario) earthquake suite of records was almost
insignificant. The seismic response was very slight and did not reach the first damage state even
with a magnification factor of 10 with respect to the design-based earthquake. However, the design
spectrum in Eastern Canada has an extremely low spectral acceleration in the long-period range and
may change as the definition of the seismic hazard improves. The incremental analyses carried out
with the Western Canada earthquake suite, corresponding to the highest seismic risk in Canada,
suggest that the probability of exceeding 0.2% residual-out-of-straightness is only 3.3% after a
seismic event that is twice as intense as the design-based earthquake. Thus, the 1.65MW Vestas
wind turbine tower has a very low seismic risk in Canada under the current definition of the seismic
hazard.
However, the analyses demonstrated that these structures must be designed for large safety
factors against any overloading, as they are prone to collapse when the tower is excited beyond its
elastic limit. As the design of wind turbine towers is quickly evolving, with a tendency for taller
structures, the seismic response may become more critical. This thesis outlines a methodology to
carry out a thorough investigation into the probability of reaching predetermined damage states
under seismic loading.
Future research is required in several areas. The damping of wind turbine towers should be
determined more precisely, as it significantly influences the response path of the wind turbine tower
CHAPTER 7: CONCLUSIONS AND RECOMMENDATIONS
SEISMIC ANALYSIS OF WIND TURBINE TOWERS IN THE CANADIAN ENVIRONMENT - 102 -
during a seismic event. The bolted flange connections of the wind turbine tower may also be further
investigated, as the flanges are expected to experience prying before the tower fails by buckling.
Furthermore, a pushover analysis suited to wind turbine towers may be developed. Lastly, there was
some uncertainty in the damage states defined. In future studies, the damage states of the wind
turbine tower may be re-defined in conjunction with requirements of other components of the wind
turbine to ensure safe operation.
.

SEISMIC ANALYSIS OF WIND TURBINE TOWERS IN THE CANADIAN ENVIRONMENT - 103 -
REFERENCES
Adams, J., and Atkinson, G. 2003. “Development of Seismic Hazard Maps for the Proposed 2005 Edition of the National Building Code of Canada.” Canadian Journal of Civil Engineering, Vol. 30, No. 2, pp. 255–271.
Atkinson, G.M. 2009. “Earthquake Time Histories Compatible with the 2005 National Building Code of Canada uniform Hazard Spectrum.” Canadian Journal of Civil Engineering, Vol. 36, No. 6, pp. 991–1001.
ANSYS® Multiphysics. 2007. “ANSYS Element Reference.” Release 11.0, Documentation for ANSYS. ANSYS Inc.
Antoniou S., and Pinho R. 2004. “Advantages and Limitations of Adaptive and Non-Adaptive Force-Based Pushover Procedures.” Journal of Earthquake Engineering, Vol. 8, No. 4, pp. 497–522.
American Institute of Steel Construction (AISC). 2005. Specification for Structural Steel Buildings. ANSI/AISC 360-05. AISC, Chicago, USA.
Aronofsky, J. 1951. “Evaluation of Stress Distribution in the Symmetrical Neck of Flat Tensile Bars.” Journal of Applied Mechanics, Vol. 3, pp. 75–84.
American Society of Civil Engineers (ASCE). 2005. Minimum Design Loads for Building and Other Structures. ASCE/SEI 7-05. ASCE, Virginia, USA.
Barros, R.C., and Almeida, R. 2005. “Pushover Analysis of Asymmetric Three-Dimensional Building Frames.” Journal of Civil Engineering and Management, Vol. 11, No. 1, pp. 3–12.
Bazeos, N., Hatzigeorgiou, G.D., Hondros, I.D., Karamaneas, H., Karabalis, D.L., and Beskos, D.E. 2002. “Static, Seismic and Stability Analyses of a Prototype Wind Turbine Steel Tower.” Engineering Structures, Vol. 24, No. 8, pp. 1015–1025.
British Standards Institution (BSI). 2000. Structural Use of Steelwork in Building, Part 1: Code of Practice for Design – Rolled and Welded Sections. BS 5950-1:2000. BSI, London, UK.
Burton, T., Sharpe, D., Jenkins, N., and Bossanyi, E. 2001. Wind Energy Handbook. John Wiley and Sons, West Sussex, UK.
Canadian Standards Association (CSA). 2001. Antennas, Towers, and Antenna-Supporting Structures. CAN/CSA S37-01. CSA, Toronto, Canada.
Canadian Standards Association (CSA). 2004. Steel (Fixed Offshore) Structures. CAN/CSA S473-04. CSA, Toronto, Canada.
Canadian Standard Association (CSA). 2008. Wind Turbines – Part 1: Design Requirements. CAN/CSA C61400-1:08. CSA, Toronto, Canada.
Canadian Standards Association (CSA). 2009a. Petroleum and Natural Gas Industries – Fixed Steel Offshore Structures. CAN/CSA-Z19902-09. CSA, Toronto, Canada.
Canadian Standards Association (CSA). 2009b. Design of Steel Structures. CAN/CSA-S16-09. CSA, Toronto, Canada.
Chopra, A.K., and Goel, R.K. 2002. “A Modal Pushover Analysis Procedure for Estimating Seismic Demands for Buildings.” Earthquake Engineering and Structural Dynamics, Vol. 31, No. 3, pp. 561–582.
Danish Wind Industry Association. 19 September 2003. “Manufacturing Wind Turbine Towers”. Guided Tour on Wind Energy. <http://www.windpower.org/en/tour/manu/towerm.htm> 8 April 2009.
REFERENCES
SEISMIC ANALYSIS OF WIND TURBINE TOWERS IN THE CANADIAN ENVIRONMENT - 104 -
Deierlein, G.G., Liel, A.B., Haselton, C.B., and Kircher, C.A. 2008. “ATC-63 Methodology for Evaluating Seismic Collapse Safety of Archetype Buildings.” ASCE-SEI Structures Congress, April 24-26, 2008, Vancouver, BC, 10 pp.
Det Norske Veritas (DNV). 2002a. Bucking Strength of Plated Structures. DNV-RP-C201. DNV, Olso, Norway.
Det Norske Veritas (DNV). 2002b. Bucking Strength of Shells. DNV-RP-C202. DNV, Olso, Norway.
Det Norske Veritas (DNV). 2006. Design and Manufacture of Wind Turbine Blades. DNV-OS-J102. DNV, Olso, Norway.
Det Norske Veritas (DNV). 2007. Design of Offshore Wind Turbine Structures. DNV-OS-J101. DNV, Olso, Norway.
Det Norske Veritas (DNV). 2008a. Design of Offshore Wind Turbine Structures, General (LFRD Method). DNV-OS-C101. DNV, Olso, Norway.
Det Norske Veritas (DNV). 2008c. Fatigue Design of Offshore Steel Structures. DNV-RP-C203. DNV, Olso, Norway.
Det Norske Veritas (DNV). 2008b. Structural Design of Offshore Units (WSD Method). DNV-OS-C201. DNV, Olso, Norway.
Det Norske Veritas (DNV) and Risø National Laboratory. 2002. Guidelines for Design of Wind Turbines, 2nd Edition. DNV, Copenhagen, Denmark and Wind Energy Department, Risø National Laboratory, Denmark.
Earthquakes Canada. 2009. “Earthquake Hazard.” <http://earthquakescanada.nrcan.gc.ca/hazard-alea/interpolat/index-eng.php>
Elchalakani M., Zhao X.L., and Grzebieta, R. 2002. “Bending Tests to Determine Slenderness Limits for Cold-Formed Circular Hollow Sections.” Journal of Constructional Steel Research, Elsevier Science Ltd., Vol. 58, No. 11, pp. 1407–1430.
European Committee for Standardisation (CEN). 2005. Eurocode 3: Design of Steel Structures, Part 1.1: General Rules and Rules for Buildings. EN 1993-1-1:2005. British Standards Institution, London, UK.
European Committee for Standardisation (CEN). 2003. Eurocode 8: Design of Structures for Earthquake Resistances, Part 1: General Rules, Seismic Actions and Rules for Buildings. EN 1998-1:2003. British Standards Institution, London, UK.
Filiatrault, A. 2002. Elements of Earthquake Engineering and Structural Dynamics, Second Edition. Polytechnic International Press, Montreal, Canada.
Germanischer Lloyd (GL) WindEnergie. 2003. IV – Industrial Services, Part 1 – Guideline for the Certification of Wind Turbines. GL WindEnergie GmbH, Hamburg, Germany.
Halchuk, S., and Adams, J. 2008. “Fourth Generation Seismic Hazard Maps of Canada: Maps and Grid Values to be Used with the 2005 National Building Code of Canada.” Geological Survey of Canada Open File 5813, 33 pp.
Hansen, M.O.L. 2008. Aerodynamics of Wind Turbines, 2nd Edition. Earthscan, London, UK.
REFERENCES
SEISMIC ANALYSIS OF WIND TURBINE TOWERS IN THE CANADIAN ENVIRONMENT - 105 -
Hatch Acres. 2006. Wind Turbine Code Review and Gap Analysis. Canadian Standards Association, Toronto, Canada.
Hau, E. 2006. Wind Turbines: Fundamentals, Technologies, Application, Economics, 2nd Edition. Springer, Berlin, Germany.
International Electrotechnical Commission (IEC). 2001. IEC System for Conformity Testing and Certification of Wind Turbines - Rules and Procedures. IEC WT 01:2001-04. IEC, Geneva, Switzerland.
International Electrotechnical Commission (IEC). 2005. Wind Turbines – Part 1: Design Requirements, 3rd Edition. IEC 61400-1:2005-08. IEC, Geneva, Switzerland.
Jan, T.S., Liu, M.W., and Kao, Y.C. 2004. “An Upper Bound Pushover Analysis Procedure for Estimating the Seismic Demands of High-Rise Buildings.” Engineering Structures, Vol. 26, No. 1, pp. 117-128.
Joannides, F., and Weller, A. 2002. Structural Steel Design to BS 5950: Part 1. Thomas Telford, London, UK.
Kalkan, E., and Kunnath, S.K. 2004. “Method of Modal Combinations for Pushover Analysis of Buildings.” 13th World Conference on Earthquake Engineering, Vancouver, Canada, Proceedings Paper Reference 2713.
Kappos, A.J. 2002. Dynamic Loading and Design of Structures. Taylor and Francis Group, New York, USA.
Lavassas, I., Nikolaidis, G., Zervas, P., Efthimiou, E., Doudoumis, I.N., and Baniotopoulos C.C. 2003. “Analysis and Design of the Prototype of a Steel 1-MW Wind Turbine Tower.” Engineering Structures, Vol. 25, No. 8, pp. 1097–1106.
Lüddecke, F., Rücker, W., Seidel, M., and Assheuer, J. 2008. “Tragverhalten von Stahlgussbauteilen in Offshore-Windenergie-Anlagen unter Vorwiegend Ruhender und Nicht Ruhender Beanspruchung.” Stahlbau, Vol. 77, No. 9, pp. 639–646.
Manwell, J.F., McGowan, J.G, and Rogers, A.L. 2002. Wind Energy Explained – Theory, Design and Application. John Wiley and Sons, West Sussex, UK.
Matic, P. 1985. “Numerically Predicting Ductile Material Behaviour from Tensile Specimen Response.” Theoretical and Applied Fracture Mechanics, Vol. 4, pp. 13–28.
Martinez-Saucedo, G., Packer, J.A., and Willibald, S. 2006. “Parametric Finite Element Study of Slotted End Connections to Circular Hollow Sections. Engineering Structures, Vol. 28, No. 14, pp. 1956–1971.
Moghadam A.S. 2002. “A Pushover Procedure for Tall Buildings.” 12th European Conference on Earthquake Engineering, London, UK. Elsevier Science Ltd., Oxford, UK, Proceedings Paper Reference 395.
Nasserasadi, K., Ghafory-Ashtiany, M., Eshghi, S., and Zolfaghari, M.R. 2008. “Developing Seismic Fragility Function of Structures by Stochastic Approach.” Journal of Applied Sciences, Vol. 8, No. 6, 975–983.
National Building Code of Canada (NBCC). 2005. National Research Council of Canada, Ottawa, Canada.
Poursha, M., Khoshnoudian, F., and Moghadam, A.S. 2009. “A Consecutive Modal Pushover Procedure for Estimating Seismic Demands of Tall Buildings.” Engineering Structures, Vol. 31, No. 2, pp. 591–599.

REFERENCES
SEISMIC ANALYSIS OF WIND TURBINE TOWERS IN THE CANADIAN ENVIRONMENT - 106 -
Prowell, I., Veletzos, M., Elgamal, A., and Restrepo, J. 2008. “Shake Table Test of a 65 kW Wind Turbine and Computational Simulation.” 14th World Conference on Earthquake Engineering, Beijing, China, Paper ID 12-01-0178.
Prowell, I., Veletzos, M., Elgamal, A., and Restrepo, J. 2009. “Experimental and Numerical Seismic Response of a 65 kW Wind Turbine.” Journal of Earthquake Engineering, Vol. 13, No. 8, pp. 1172–1190.
Ritschel, U., Warnke, I., Kirchner J., and Meussen, B. 2003. “Wind Turbines and Earthquakes.” Proceedings of the World Wind Energy Conference (WWEC) 2003, Cape Town, South Africa.
Sasaki K.K., Freeman S.A., and Paret T.F. 1998. “Multi-Mode Pushover Procedure (MMP) – a Method to Identify the Effects of Higher Modes in a Pushover Analysis.” 6th US National Conference on Earthquake Engineering, Seattle, USA. Earthquake Engineering Research Institute, Oakland, USA, Proceedings Paper Reference 271.
Standards Australia. 1998. Steel Structures. Australian Standard AS 4100. Standards Australia, Sydney, Australia.
Somerville, P., Punyamurthula, S., and Sun, J. 1997. “Development of Ground Motion Time Histories for Phase 2 of the FEMA/SAC Steel Project.” Report No. SAC/BD-97/04, SAC Joint Venture, Sacramento, California, USA.
Szilard, R. 2004. Theories and Applications of Plate Analysis: Classical, Numerical, and Engineering Methods. John Wiley, Hoboken, USA.
Trahair, N. S., and Bradford, M. A. 1998. The Behaviour and Design of Steel Structures to AS 4100. 3rd Australian Edition. Spon Press, London, UK.
Tso, W.K., and Moghadam, A.S. 1998. “Pushover Procedure for Seismic Analysis of Buildings.” Progress in Structural Engineering and Materials, Vol. 1, No. 3, pp. 337–344.
Vamvatsikos, D, and Cornell, C.A. 2002. “Incremental Dynamic Analysis.” Earthquake Engineering and Structural Dynamics, Vol. 31, No. 3, pp. 491–514.
Vamvatsikos, D, and Cornell, C.A. 2004. “Applied Incremental Dynamic Analysis.” Earthquake Spectra, Vol. 20, No. 2, pp. 523–553.
van Wingerde, A.M., van Delft, D.R.V., Packer, J.A., and Janssen, L.G.J. 2006. “Survey of Support Structures for Offshore Wind Turbines.” 11th International Symposium on Tubular Structures, Québec City, Canada, Proceedings pp. 365-373.
Vestas. 2006. Wind Turbine Drawing 961000. V-82-1.65 MW HH80 IEC 2A US. Vestas Wind System A/S, Randers, Denmark.
Voth, A. P. 2010. Branch Plate-to-Circular Hollow Structural Section Connections. Ph.D. Thesis. University of Toronto, Toronto, Canada.
Witcher, D. 2005. “Seismic Analysis of Wind Turbines in the Time Domain.” Wind Energy, Vol. 8, No. 1, pp. 81-91.
Zhao X., and Maisser, P. 2006. “Seismic Response Analysis of Wind Turbine Towers Including Soil-Structure Interaction.” Proceedings of the Institution of Mechanical Engineers, Part K: Journal of Multi-body Dynamics, Vol. 220, No. 1, pp. 53-61.
Zhao, X.L., Wilkinson, T., and Hancock, G. 2005. Cold-Formed Tubular Members and Connections: Structural Behaviour and Design. Elsevier Science Ltd., Oxford, UK.
SEISMIC ANALYSIS OF WIND TURBINE TOWERS IN THE CANADIAN ENVIRONMENT - 107 -
APPENDIX A: RESULTS OF INCREMENTAL TIME-HISTORY
ANALYSIS FOR LA EARTHQUAKE SUITE
This appendix includes the result items for the LA earthquake suite except those for LA01 &
LA02, which were presented in Section 5.2:
• summary of displacement results in tabular format
• comparison of the peak displaced shape of all the magnification factors
• time-history displacement response at hub height for the higher magnification factors
• orbit plots for all magnification factors
In addition, this appendix presents several additional IDA curves for the three damage measures
(peak displacement, residual displacement, and peak rotation) and four intensity measures (peak
ground displacement, peak ground velocity, peak ground acceleration, and magnification factor).
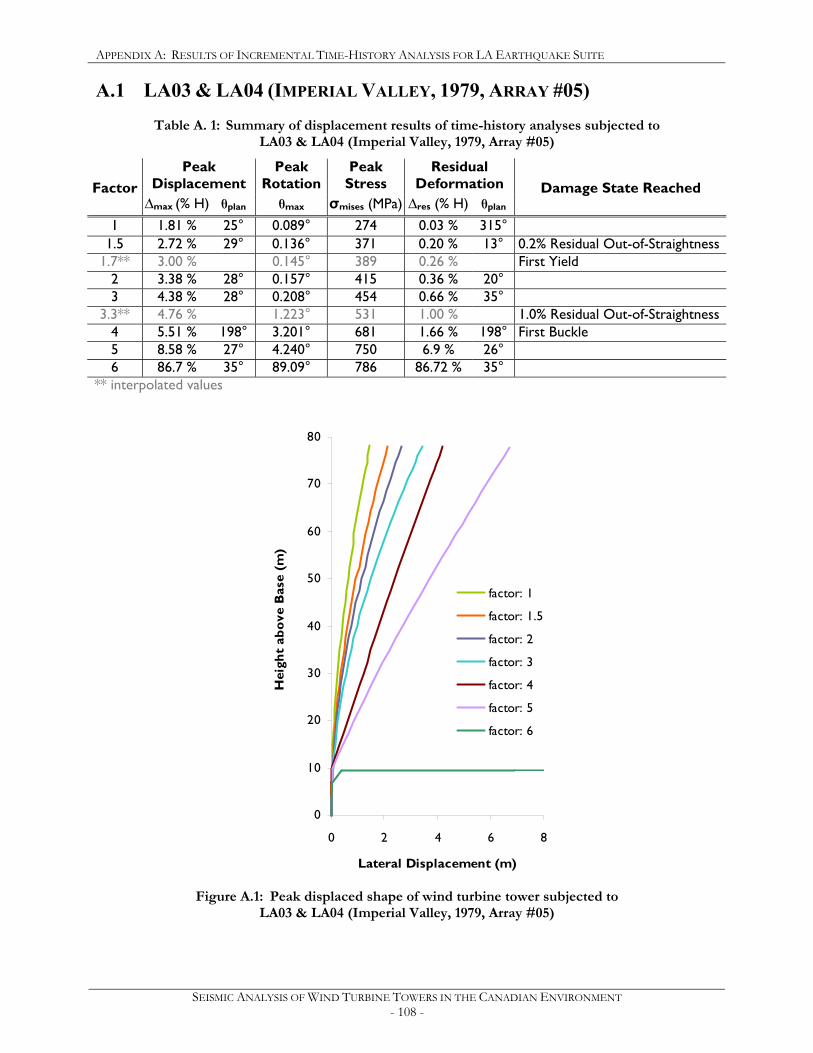
APPENDIX A: RESULTS OF INCREMENTAL TIME-HISTORY ANALYSIS FOR LA EARTHQUAKE SUITE
SEISMIC ANALYSIS OF WIND TURBINE TOWERS IN THE CANADIAN ENVIRONMENT - 108 -
A.1 LA03 & LA04 (IMPERIAL VALLEY, 1979, ARRAY #05)
Table A. 1: Summary of displacement results of time-history analyses subjected to LA03 & LA04 (Imperial Valley, 1979, Array #05)
Peak Displacement
Peak Rotation
Peak Stress
Residual Deformation Factor
∆max (% H) θplan θmax σmises (MPa) ∆res (% H) θplan Damage State Reached
1 1.81 % 25° 0.089° 274 0.03 % 315°
1.5 2.72 % 29° 0.136° 371 0.20 % 13° 0.2% Residual Out-of-Straightness 1.7** 3.00 % 0.145° 389 0.26 % First Yield
2 3.38 % 28° 0.157° 415 0.36 % 20° 3 4.38 % 28° 0.208° 454 0.66 % 35°
3.3** 4.76 % 1.223° 531 1.00 % 1.0% Residual Out-of-Straightness 4 5.51 % 198° 3.201° 681 1.66 % 198° First Buckle 5 8.58 % 27° 4.240° 750 6.9 % 26° 6 86.7 % 35° 89.09° 786 86.72 % 35°
** interpolated values
0
10
20
30
40
50
60
70
80
0 2 4 6 8
Lateral Displacement (m)
Hei
ght
abov
e B
ase
(m)
factor: 1
factor: 1.5
factor: 2
factor: 3
factor: 4
factor: 5
factor: 6
Figure A.1: Peak displaced shape of wind turbine tower subjected to
LA03 & LA04 (Imperial Valley, 1979, Array #05)
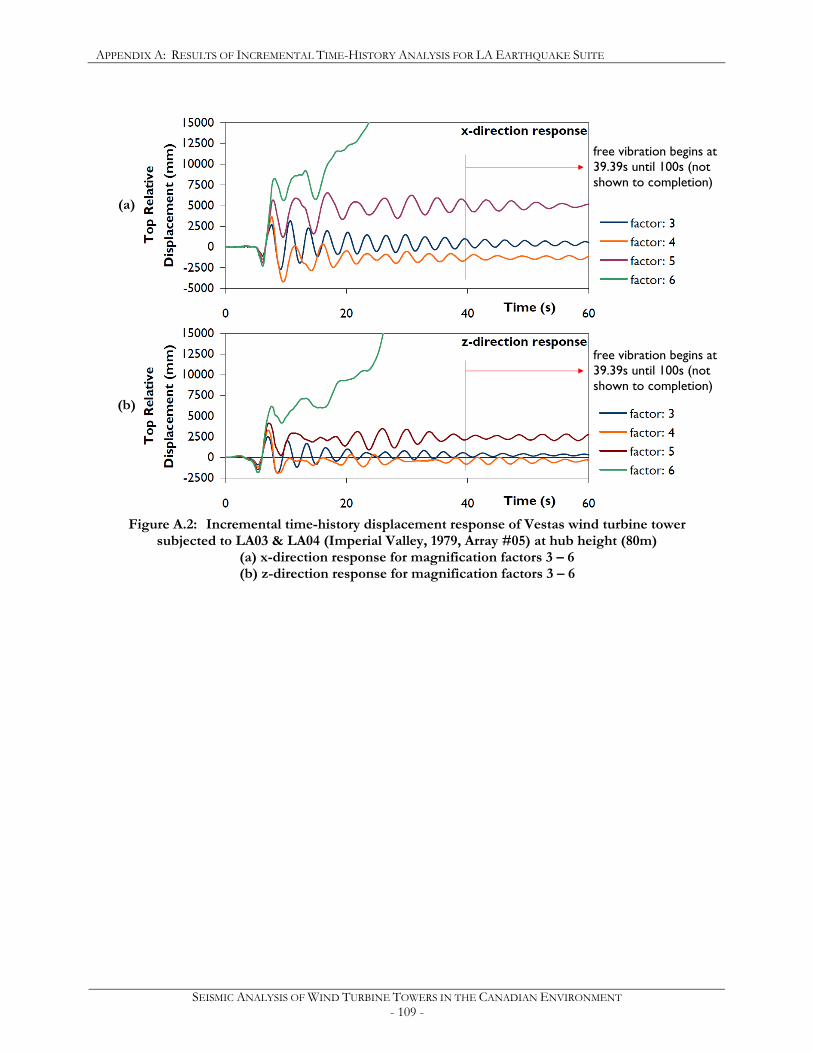
APPENDIX A: RESULTS OF INCREMENTAL TIME-HISTORY ANALYSIS FOR LA EARTHQUAKE SUITE
SEISMIC ANALYSIS OF WIND TURBINE TOWERS IN THE CANADIAN ENVIRONMENT - 109 -
Figure A.2: Incremental time-history displacement response of Vestas wind turbine tower
subjected to LA03 & LA04 (Imperial Valley, 1979, Array #05) at hub height (80m) (a) x-direction response for magnification factors 3 – 6 (b) z-direction response for magnification factors 3 – 6
(a)
(b)
free vibration begins at 39.39s until 100s (not shown to completion)
free vibration begins at 39.39s until 100s (not shown to completion)
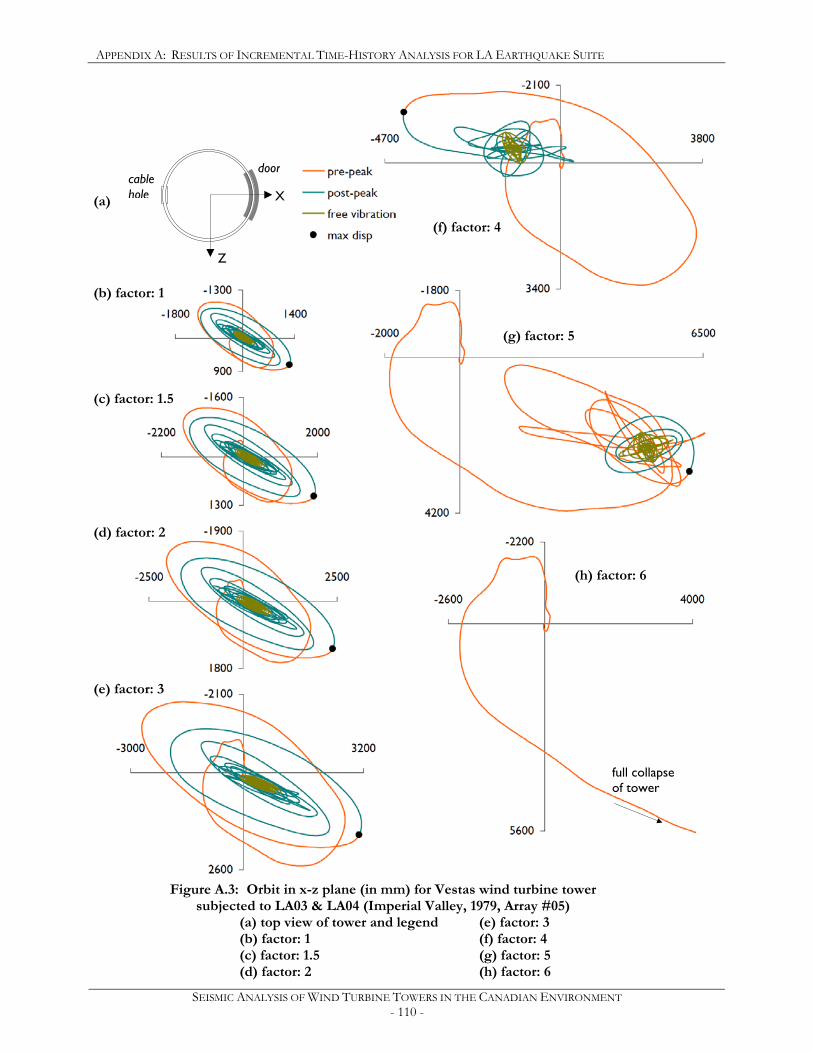
APPENDIX A: RESULTS OF INCREMENTAL TIME-HISTORY ANALYSIS FOR LA EARTHQUAKE SUITE
SEISMIC ANALYSIS OF WIND TURBINE TOWERS IN THE CANADIAN ENVIRONMENT - 110 -
Figure A.3: Orbit in x-z plane (in mm) for Vestas wind turbine tower subjected to LA03 & LA04 (Imperial Valley, 1979, Array #05)
(a) top view of tower and legend (e) factor: 3 (b) factor: 1 (f) factor: 4 (c) factor: 1.5 (g) factor: 5 (d) factor: 2 (h) factor: 6
door cable hole X
Z
(a)
(g) factor: 5
(b) factor: 1
(c) factor: 1.5
(d) factor: 2
(e) factor: 3
(f) factor: 4
(h) factor: 6
full collapse of tower
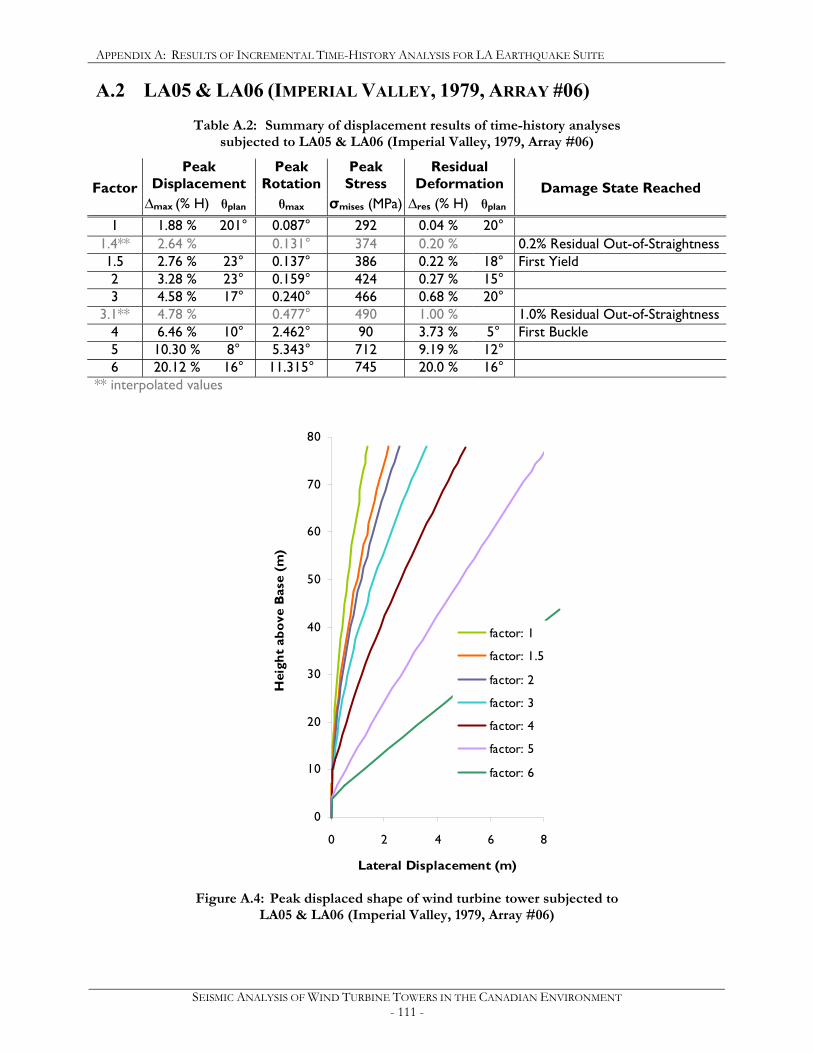
APPENDIX A: RESULTS OF INCREMENTAL TIME-HISTORY ANALYSIS FOR LA EARTHQUAKE SUITE
SEISMIC ANALYSIS OF WIND TURBINE TOWERS IN THE CANADIAN ENVIRONMENT - 111 -
A.2 LA05 & LA06 (IMPERIAL VALLEY, 1979, ARRAY #06)
Table A.2: Summary of displacement results of time-history analyses subjected to LA05 & LA06 (Imperial Valley, 1979, Array #06)
Peak Displacement
Peak Rotation
Peak Stress
Residual Deformation Factor
∆max (% H) θplan θmax σmises (MPa) ∆res (% H) θplan Damage State Reached
1 1.88 % 201° 0.087° 292 0.04 % 20°
1.4** 2.64 % 0.131° 374 0.20 % 0.2% Residual Out-of-Straightness 1.5 2.76 % 23° 0.137° 386 0.22 % 18° First Yield 2 3.28 % 23° 0.159° 424 0.27 % 15° 3 4.58 % 17° 0.240° 466 0.68 % 20°
3.1** 4.78 % 0.477° 490 1.00 % 1.0% Residual Out-of-Straightness 4 6.46 % 10° 2.462° 90 3.73 % 5° First Buckle 5 10.30 % 8° 5.343° 712 9.19 % 12° 6 20.12 % 16° 11.315° 745 20.0 % 16°
** interpolated values
0
10
20
30
40
50
60
70
80
0 2 4 6 8
Lateral Displacement (m)
Hei
ght
abov
e B
ase
(m)
factor: 1
factor: 1.5
factor: 2
factor: 3
factor: 4
factor: 5
factor: 6
Figure A.4: Peak displaced shape of wind turbine tower subjected to
LA05 & LA06 (Imperial Valley, 1979, Array #06)
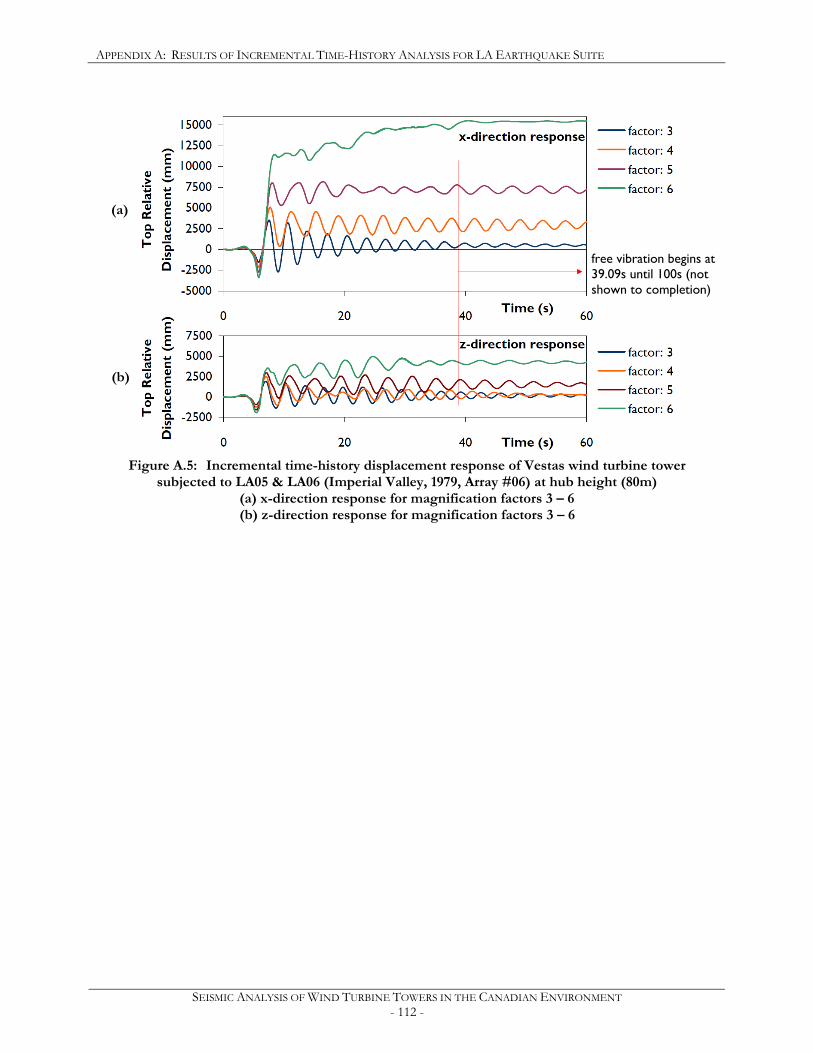
APPENDIX A: RESULTS OF INCREMENTAL TIME-HISTORY ANALYSIS FOR LA EARTHQUAKE SUITE
SEISMIC ANALYSIS OF WIND TURBINE TOWERS IN THE CANADIAN ENVIRONMENT - 112 -
Figure A.5: Incremental time-history displacement response of Vestas wind turbine tower
subjected to LA05 & LA06 (Imperial Valley, 1979, Array #06) at hub height (80m) (a) x-direction response for magnification factors 3 – 6 (b) z-direction response for magnification factors 3 – 6
(a)
(b)
free vibration begins at 39.09s until 100s (not shown to completion)
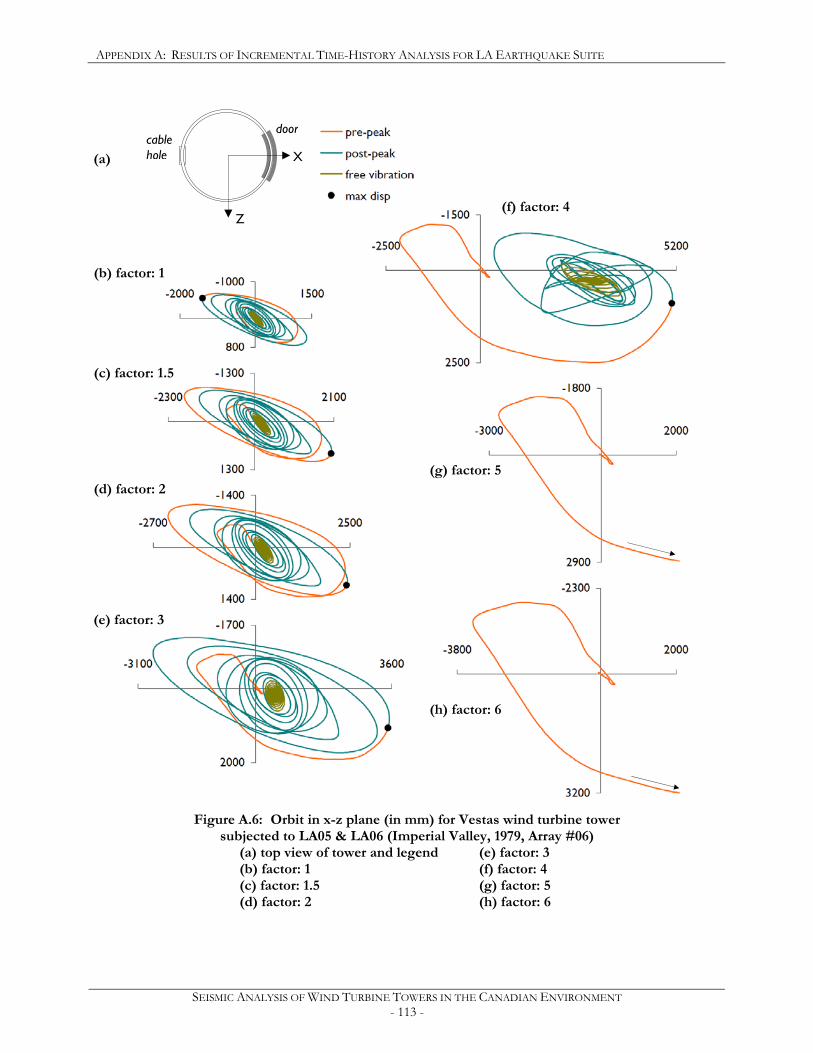
APPENDIX A: RESULTS OF INCREMENTAL TIME-HISTORY ANALYSIS FOR LA EARTHQUAKE SUITE
SEISMIC ANALYSIS OF WIND TURBINE TOWERS IN THE CANADIAN ENVIRONMENT - 113 -
Figure A.6: Orbit in x-z plane (in mm) for Vestas wind turbine tower subjected to LA05 & LA06 (Imperial Valley, 1979, Array #06)
(a) top view of tower and legend (e) factor: 3 (b) factor: 1 (f) factor: 4 (c) factor: 1.5 (g) factor: 5 (d) factor: 2 (h) factor: 6
door cable hole X
Z
(a)
(b) factor: 1
(c) factor: 1.5
(d) factor: 2
(e) factor: 3
(f) factor: 4
(g) factor: 5
(h) factor: 6
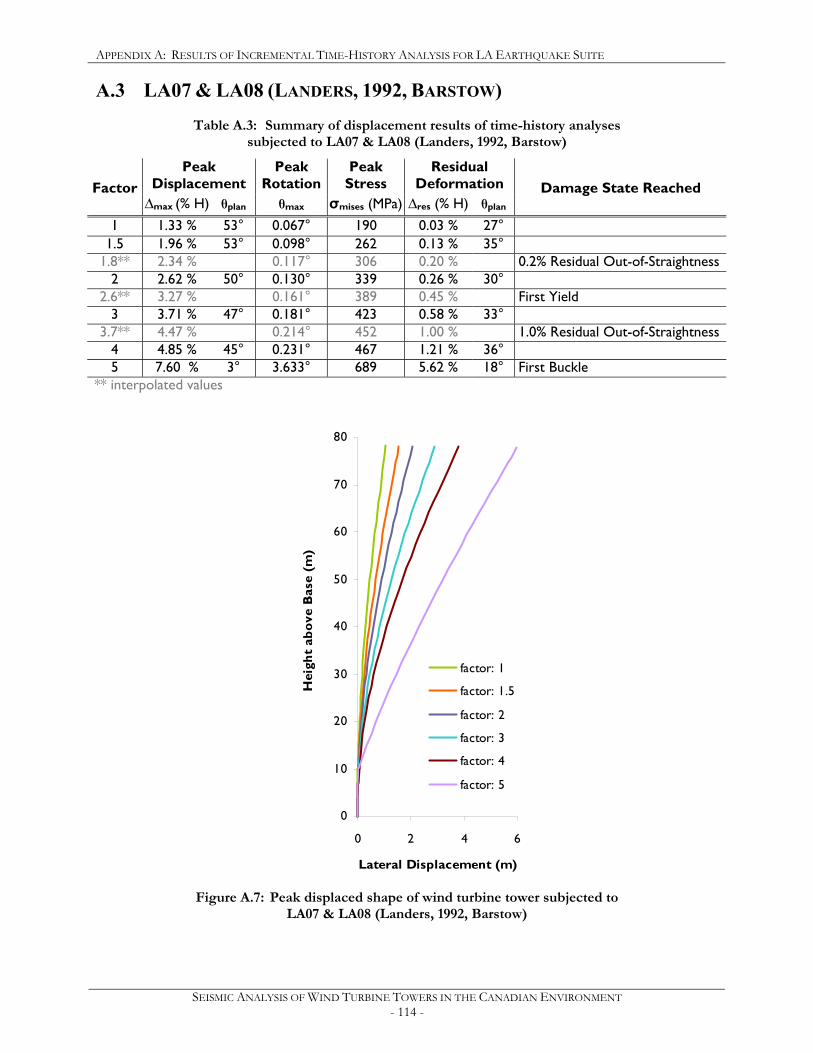
APPENDIX A: RESULTS OF INCREMENTAL TIME-HISTORY ANALYSIS FOR LA EARTHQUAKE SUITE
SEISMIC ANALYSIS OF WIND TURBINE TOWERS IN THE CANADIAN ENVIRONMENT - 114 -
A.3 LA07 & LA08 (LANDERS, 1992, BARSTOW)
Table A.3: Summary of displacement results of time-history analyses subjected to LA07 & LA08 (Landers, 1992, Barstow)
Peak Displacement
Peak Rotation
Peak Stress
Residual Deformation Factor
∆max (% H) θplan θmax σmises (MPa) ∆res (% H) θplan Damage State Reached
1 1.33 % 53° 0.067° 190 0.03 % 27°
1.5 1.96 % 53° 0.098° 262 0.13 % 35° 1.8** 2.34 % 0.117° 306 0.20 % 0.2% Residual Out-of-Straightness
2 2.62 % 50° 0.130° 339 0.26 % 30° 2.6** 3.27 % 0.161° 389 0.45 % First Yield
3 3.71 % 47° 0.181° 423 0.58 % 33° 3.7** 4.47 % 0.214° 452 1.00 % 1.0% Residual Out-of-Straightness
4 4.85 % 45° 0.231° 467 1.21 % 36° 5 7.60 % 3° 3.633° 689 5.62 % 18° First Buckle
** interpolated values
0
10
20
30
40
50
60
70
80
0 2 4 6
Lateral Displacement (m)
Hei
ght
abov
e B
ase
(m)
factor: 1
factor: 1.5
factor: 2
factor: 3
factor: 4
factor: 5
Figure A.7: Peak displaced shape of wind turbine tower subjected to
LA07 & LA08 (Landers, 1992, Barstow)
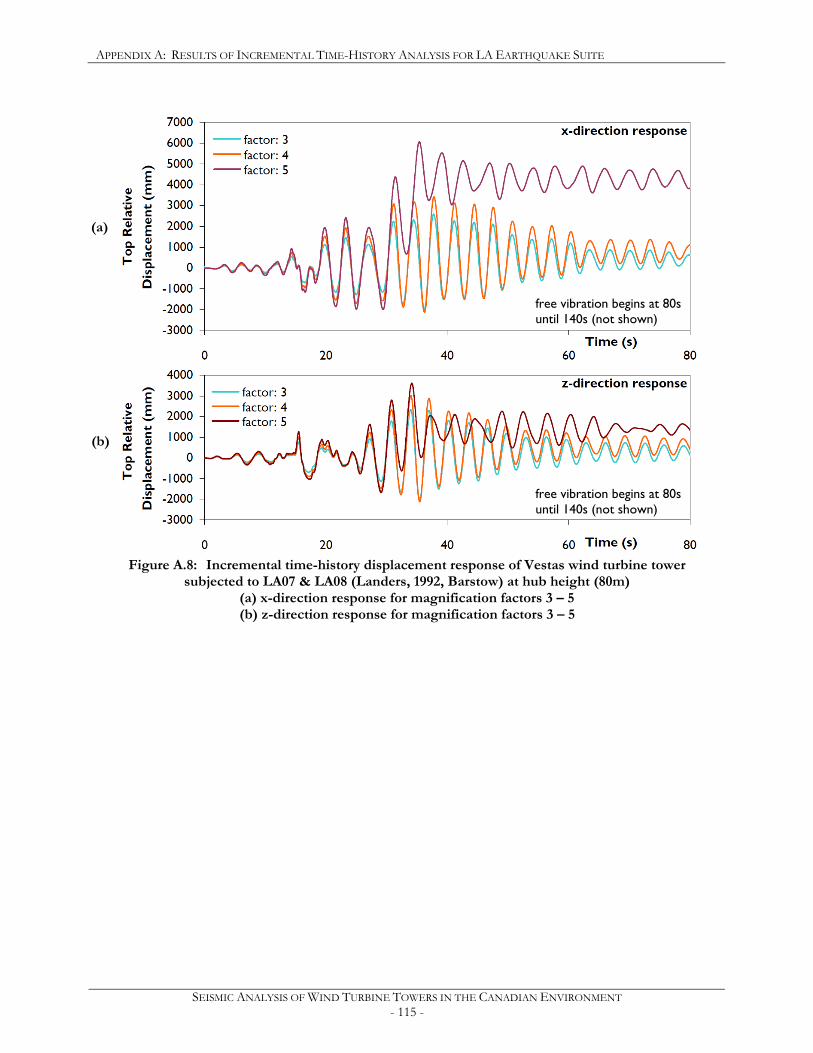
APPENDIX A: RESULTS OF INCREMENTAL TIME-HISTORY ANALYSIS FOR LA EARTHQUAKE SUITE
SEISMIC ANALYSIS OF WIND TURBINE TOWERS IN THE CANADIAN ENVIRONMENT - 115 -
Figure A.8: Incremental time-history displacement response of Vestas wind turbine tower
subjected to LA07 & LA08 (Landers, 1992, Barstow) at hub height (80m) (a) x-direction response for magnification factors 3 – 5 (b) z-direction response for magnification factors 3 – 5
free vibration begins at 80s until 140s (not shown)
(a)
(b)
free vibration begins at 80s until 140s (not shown)
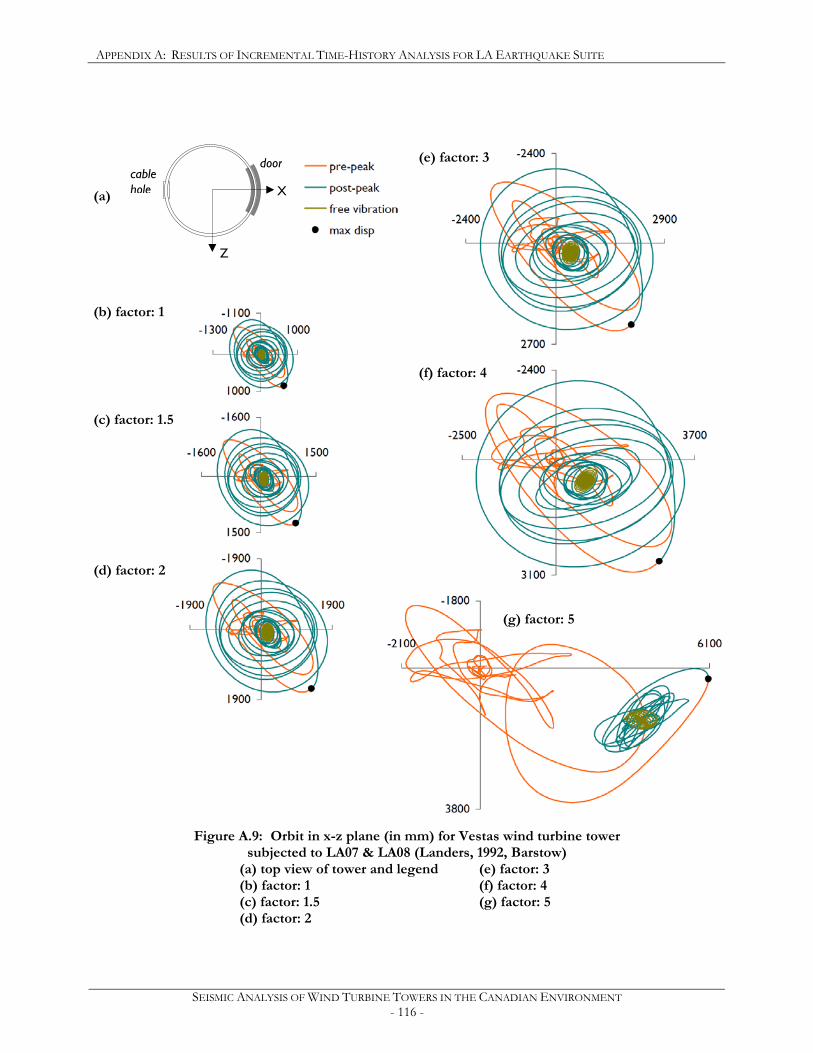
APPENDIX A: RESULTS OF INCREMENTAL TIME-HISTORY ANALYSIS FOR LA EARTHQUAKE SUITE
SEISMIC ANALYSIS OF WIND TURBINE TOWERS IN THE CANADIAN ENVIRONMENT - 116 -
Figure A.9: Orbit in x-z plane (in mm) for Vestas wind turbine tower subjected to LA07 & LA08 (Landers, 1992, Barstow)
(a) top view of tower and legend (e) factor: 3 (b) factor: 1 (f) factor: 4 (c) factor: 1.5 (g) factor: 5 (d) factor: 2
door cable hole X
Z
(a)
(b) factor: 1
(c) factor: 1.5
(d) factor: 2
(e) factor: 3
(f) factor: 4
(g) factor: 5
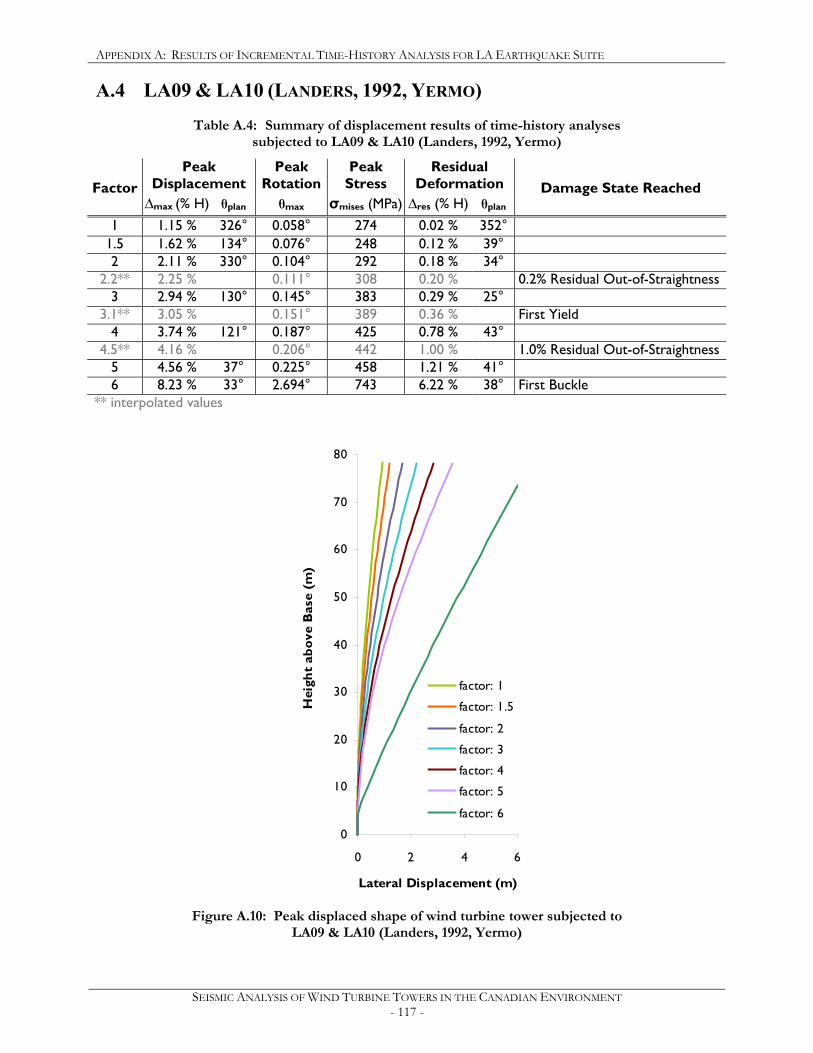
APPENDIX A: RESULTS OF INCREMENTAL TIME-HISTORY ANALYSIS FOR LA EARTHQUAKE SUITE
SEISMIC ANALYSIS OF WIND TURBINE TOWERS IN THE CANADIAN ENVIRONMENT - 117 -
A.4 LA09 & LA10 (LANDERS, 1992, YERMO)
Table A.4: Summary of displacement results of time-history analyses subjected to LA09 & LA10 (Landers, 1992, Yermo)
Peak Displacement
Peak Rotation
Peak Stress
Residual Deformation Factor
∆max (% H) θplan θmax σmises (MPa) ∆res (% H) θplan Damage State Reached
1 1.15 % 326° 0.058° 274 0.02 % 352°
1.5 1.62 % 134° 0.076° 248 0.12 % 39° 2 2.11 % 330° 0.104° 292 0.18 % 34°
2.2** 2.25 % 0.111° 308 0.20 % 0.2% Residual Out-of-Straightness 3 2.94 % 130° 0.145° 383 0.29 % 25°
3.1** 3.05 % 0.151° 389 0.36 % First Yield 4 3.74 % 121° 0.187° 425 0.78 % 43°
4.5** 4.16 % 0.206° 442 1.00 % 1.0% Residual Out-of-Straightness 5 4.56 % 37° 0.225° 458 1.21 % 41° 6 8.23 % 33° 2.694° 743 6.22 % 38° First Buckle
** interpolated values
0
10
20
30
40
50
60
70
80
0 2 4 6
Lateral Displacement (m)
Hei
ght
abov
e B
ase
(m)
factor: 1
factor: 1.5
factor: 2
factor: 3
factor: 4
factor: 5
factor: 6
Figure A.10: Peak displaced shape of wind turbine tower subjected to
LA09 & LA10 (Landers, 1992, Yermo)
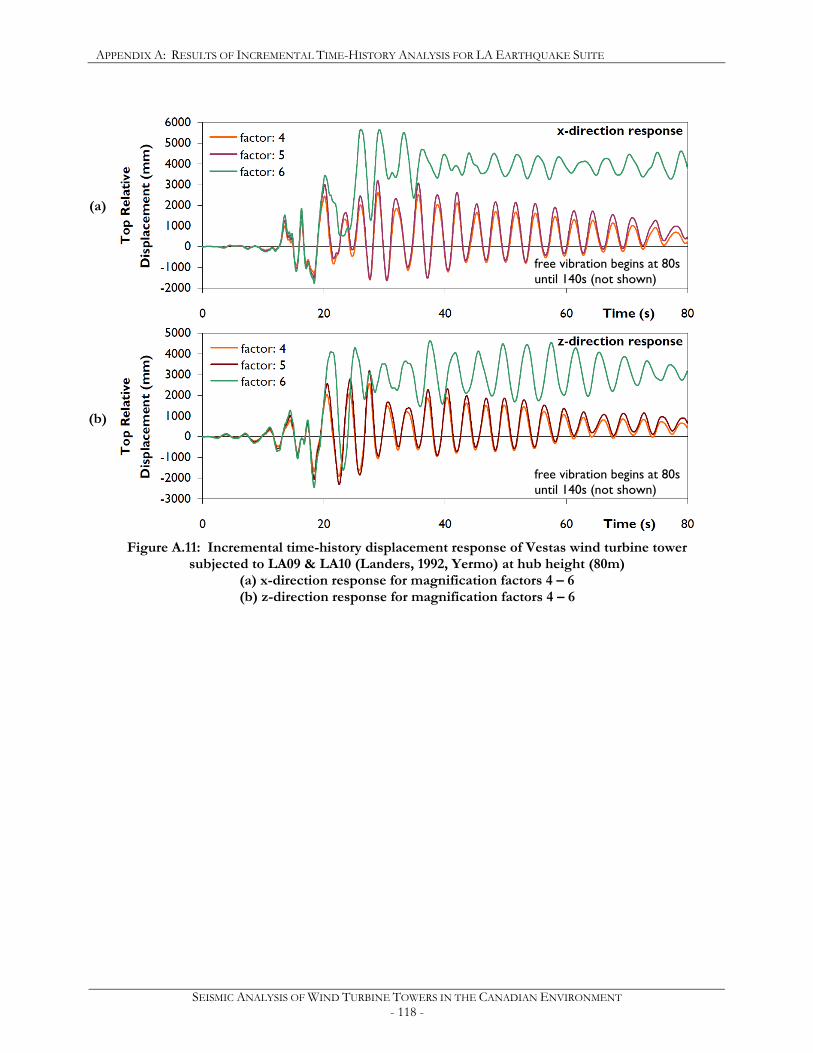
APPENDIX A: RESULTS OF INCREMENTAL TIME-HISTORY ANALYSIS FOR LA EARTHQUAKE SUITE
SEISMIC ANALYSIS OF WIND TURBINE TOWERS IN THE CANADIAN ENVIRONMENT - 118 -
Figure A.11: Incremental time-history displacement response of Vestas wind turbine tower
subjected to LA09 & LA10 (Landers, 1992, Yermo) at hub height (80m) (a) x-direction response for magnification factors 4 – 6 (b) z-direction response for magnification factors 4 – 6
free vibration begins at 80s until 140s (not shown)
(a)
(b)
free vibration begins at 80s until 140s (not shown)

APPENDIX A: RESULTS OF INCREMENTAL TIME-HISTORY ANALYSIS FOR LA EARTHQUAKE SUITE
SEISMIC ANALYSIS OF WIND TURBINE TOWERS IN THE CANADIAN ENVIRONMENT - 119 -
Figure A.12: Orbit in x-z plane (in mm) for Vestas wind turbine tower subjected to LA09 & LA10 (Landers, 1992, Yermo)
(a) top view of tower and legend (e) factor: 3 (b) factor: 1 (f) factor: 4 (c) factor: 1.5 (g) factor: 5 (d) factor: 2 (h) factor: 6
door cable hole X
Z
(a) (f) factor: 4
(g) factor: 5
(h) factor: 6
(b) factor: 1
(d) factor: 2
(e) factor: 3
(c) factor: 1.5
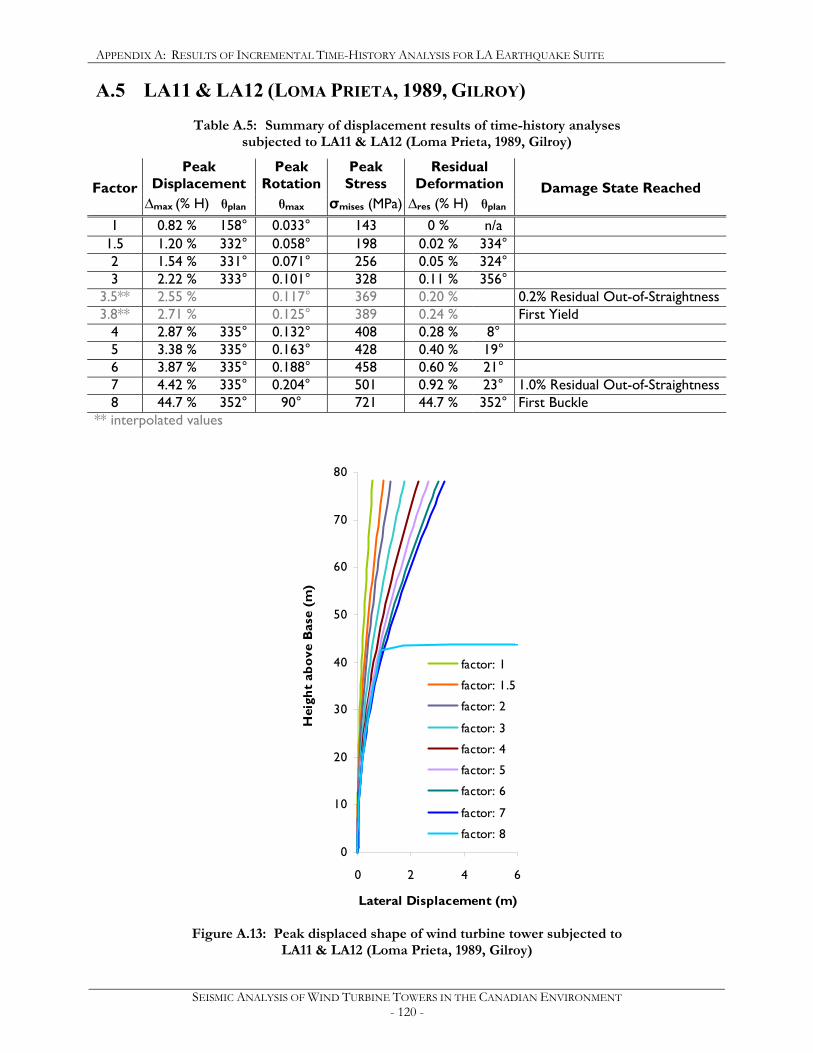
APPENDIX A: RESULTS OF INCREMENTAL TIME-HISTORY ANALYSIS FOR LA EARTHQUAKE SUITE
SEISMIC ANALYSIS OF WIND TURBINE TOWERS IN THE CANADIAN ENVIRONMENT - 120 -
A.5 LA11 & LA12 (LOMA PRIETA, 1989, GILROY)
Table A.5: Summary of displacement results of time-history analyses subjected to LA11 & LA12 (Loma Prieta, 1989, Gilroy)
Peak Displacement
Peak Rotation
Peak Stress
Residual Deformation Factor
∆max (% H) θplan θmax σmises (MPa) ∆res (% H) θplan Damage State Reached
1 0.82 % 158° 0.033° 143 0 % n/a
1.5 1.20 % 332° 0.058° 198 0.02 % 334° 2 1.54 % 331° 0.071° 256 0.05 % 324° 3 2.22 % 333° 0.101° 328 0.11 % 356°
3.5** 2.55 % 0.117° 369 0.20 % 0.2% Residual Out-of-Straightness 3.8** 2.71 % 0.125° 389 0.24 % First Yield
4 2.87 % 335° 0.132° 408 0.28 % 8° 5 3.38 % 335° 0.163° 428 0.40 % 19° 6 3.87 % 335° 0.188° 458 0.60 % 21° 7 4.42 % 335° 0.204° 501 0.92 % 23° 1.0% Residual Out-of-Straightness 8 44.7 % 352° 90° 721 44.7 % 352° First Buckle
** interpolated values
0
10
20
30
40
50
60
70
80
0 2 4 6
Lateral Displacement (m)
Hei
ght
abov
e B
ase
(m)
factor: 1
factor: 1.5
factor: 2
factor: 3
factor: 4
factor: 5
factor: 6
factor: 7
factor: 8
Figure A.13: Peak displaced shape of wind turbine tower subjected to
LA11 & LA12 (Loma Prieta, 1989, Gilroy)
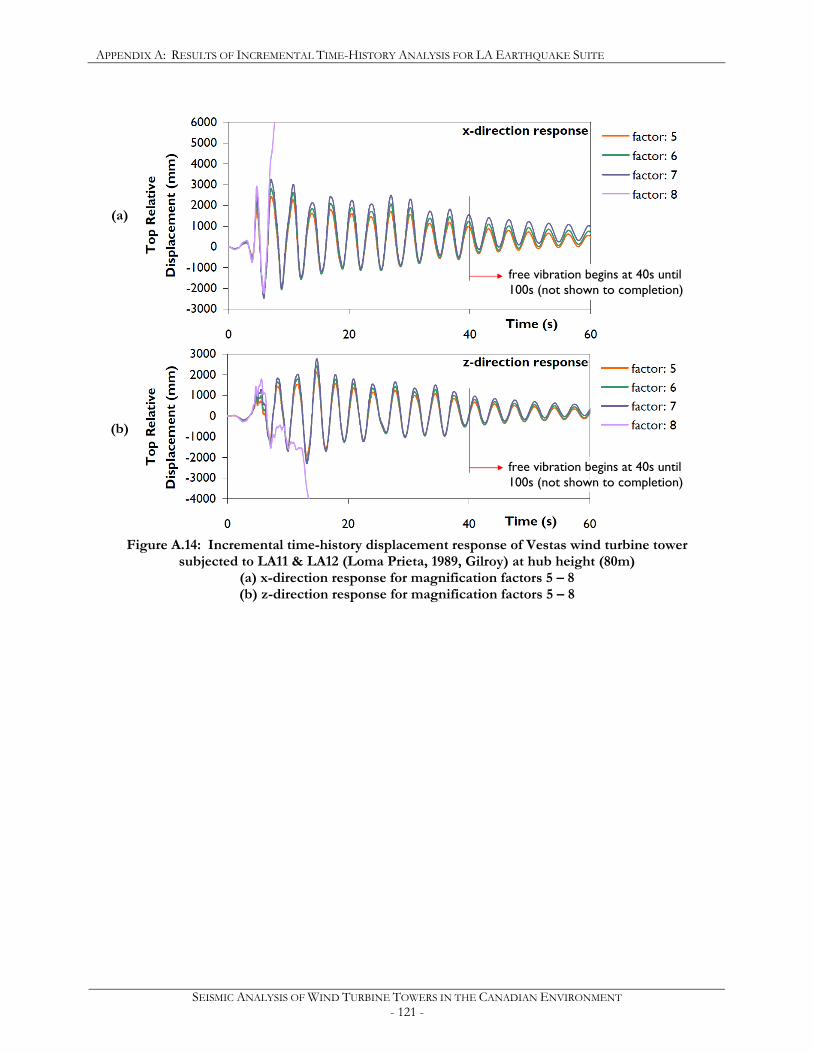
APPENDIX A: RESULTS OF INCREMENTAL TIME-HISTORY ANALYSIS FOR LA EARTHQUAKE SUITE
SEISMIC ANALYSIS OF WIND TURBINE TOWERS IN THE CANADIAN ENVIRONMENT - 121 -
Figure A.14: Incremental time-history displacement response of Vestas wind turbine tower
subjected to LA11 & LA12 (Loma Prieta, 1989, Gilroy) at hub height (80m) (a) x-direction response for magnification factors 5 – 8 (b) z-direction response for magnification factors 5 – 8
(a)
(b)
free vibration begins at 40s until 100s (not shown to completion)
free vibration begins at 40s until 100s (not shown to completion)
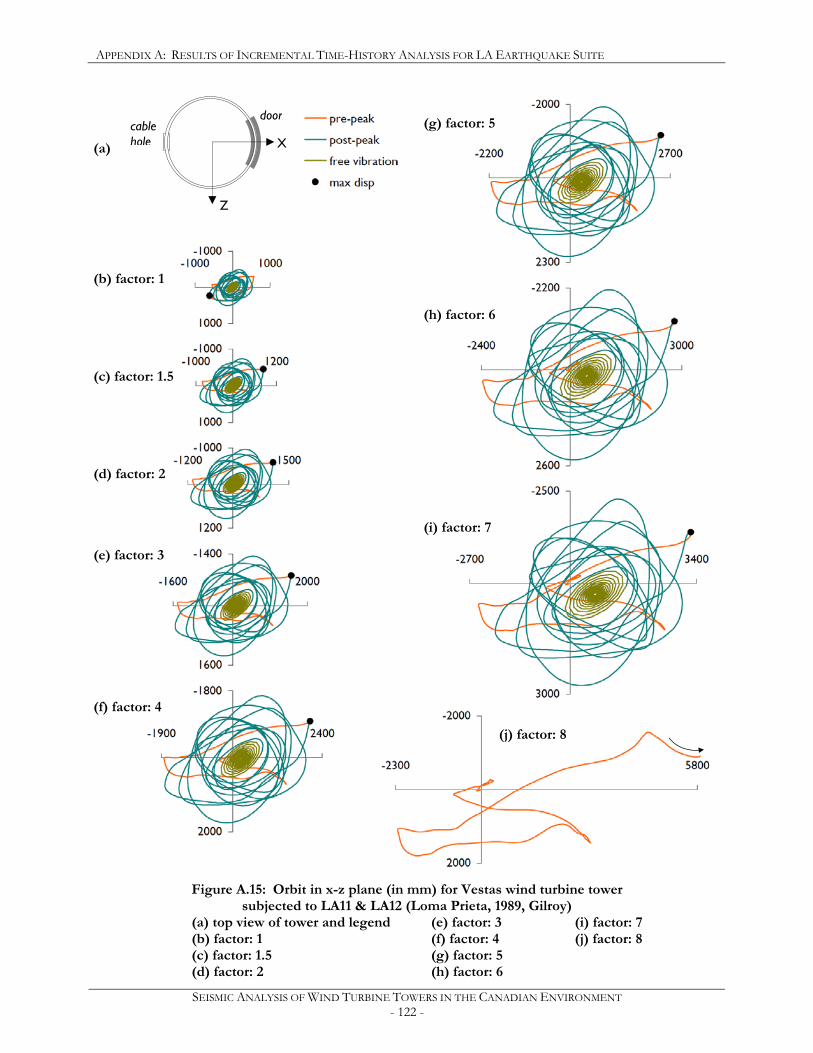
APPENDIX A: RESULTS OF INCREMENTAL TIME-HISTORY ANALYSIS FOR LA EARTHQUAKE SUITE
SEISMIC ANALYSIS OF WIND TURBINE TOWERS IN THE CANADIAN ENVIRONMENT - 122 -
Figure A.15: Orbit in x-z plane (in mm) for Vestas wind turbine tower subjected to LA11 & LA12 (Loma Prieta, 1989, Gilroy)
(a) top view of tower and legend (e) factor: 3 (i) factor: 7 (b) factor: 1 (f) factor: 4 (j) factor: 8 (c) factor: 1.5 (g) factor: 5 (d) factor: 2 (h) factor: 6
door cable hole X
Z
(a)
(f) factor: 4
(g) factor: 5
(h) factor: 6
(b) factor: 1
(d) factor: 2
(e) factor: 3
(c) factor: 1.5
(i) factor: 7
(j) factor: 8
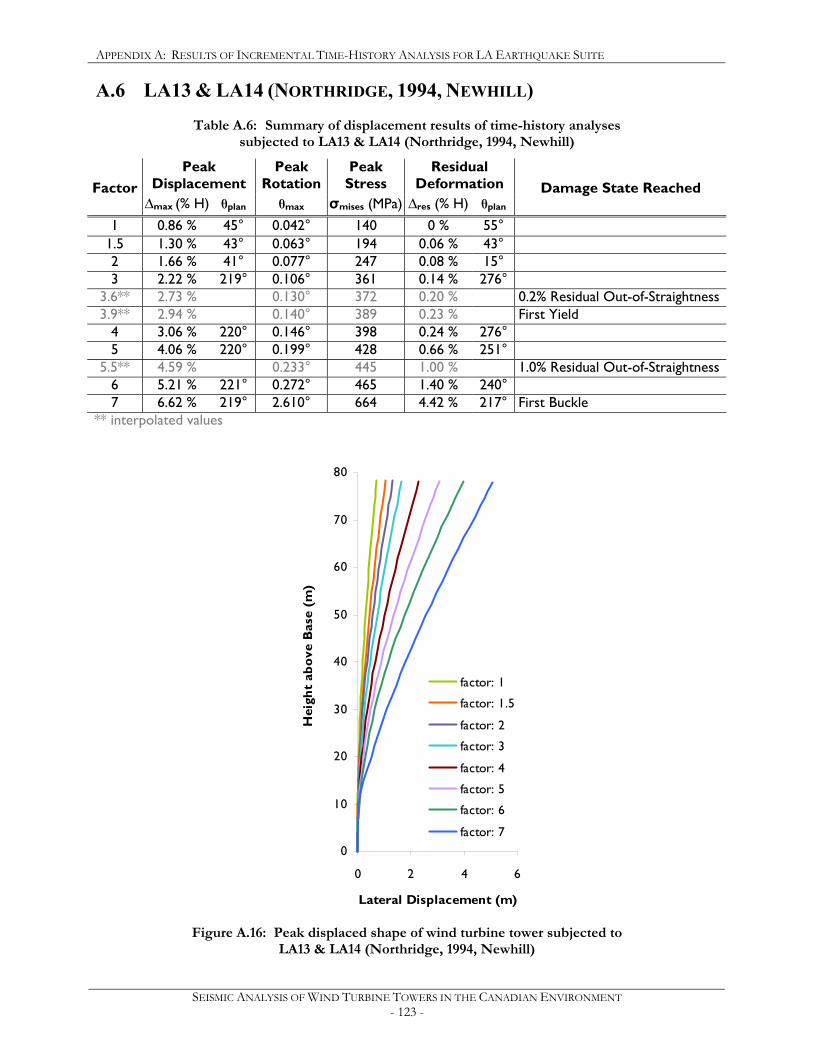
APPENDIX A: RESULTS OF INCREMENTAL TIME-HISTORY ANALYSIS FOR LA EARTHQUAKE SUITE
SEISMIC ANALYSIS OF WIND TURBINE TOWERS IN THE CANADIAN ENVIRONMENT - 123 -
A.6 LA13 & LA14 (NORTHRIDGE, 1994, NEWHILL)
Table A.6: Summary of displacement results of time-history analyses subjected to LA13 & LA14 (Northridge, 1994, Newhill)
Peak Displacement
Peak Rotation
Peak Stress
Residual Deformation Factor
∆max (% H) θplan θmax σmises (MPa) ∆res (% H) θplan Damage State Reached
1 0.86 % 45° 0.042° 140 0 % 55°
1.5 1.30 % 43° 0.063° 194 0.06 % 43° 2 1.66 % 41° 0.077° 247 0.08 % 15° 3 2.22 % 219° 0.106° 361 0.14 % 276°
3.6** 2.73 % 0.130° 372 0.20 % 0.2% Residual Out-of-Straightness 3.9** 2.94 % 0.140° 389 0.23 % First Yield
4 3.06 % 220° 0.146° 398 0.24 % 276° 5 4.06 % 220° 0.199° 428 0.66 % 251°
5.5** 4.59 % 0.233° 445 1.00 % 1.0% Residual Out-of-Straightness 6 5.21 % 221° 0.272° 465 1.40 % 240° 7 6.62 % 219° 2.610° 664 4.42 % 217° First Buckle
** interpolated values
0
10
20
30
40
50
60
70
80
0 2 4 6
Lateral Displacement (m)
Hei
ght
abov
e B
ase
(m)
factor: 1
factor: 1.5
factor: 2
factor: 3
factor: 4
factor: 5
factor: 6
factor: 7
Figure A.16: Peak displaced shape of wind turbine tower subjected to
LA13 & LA14 (Northridge, 1994, Newhill)
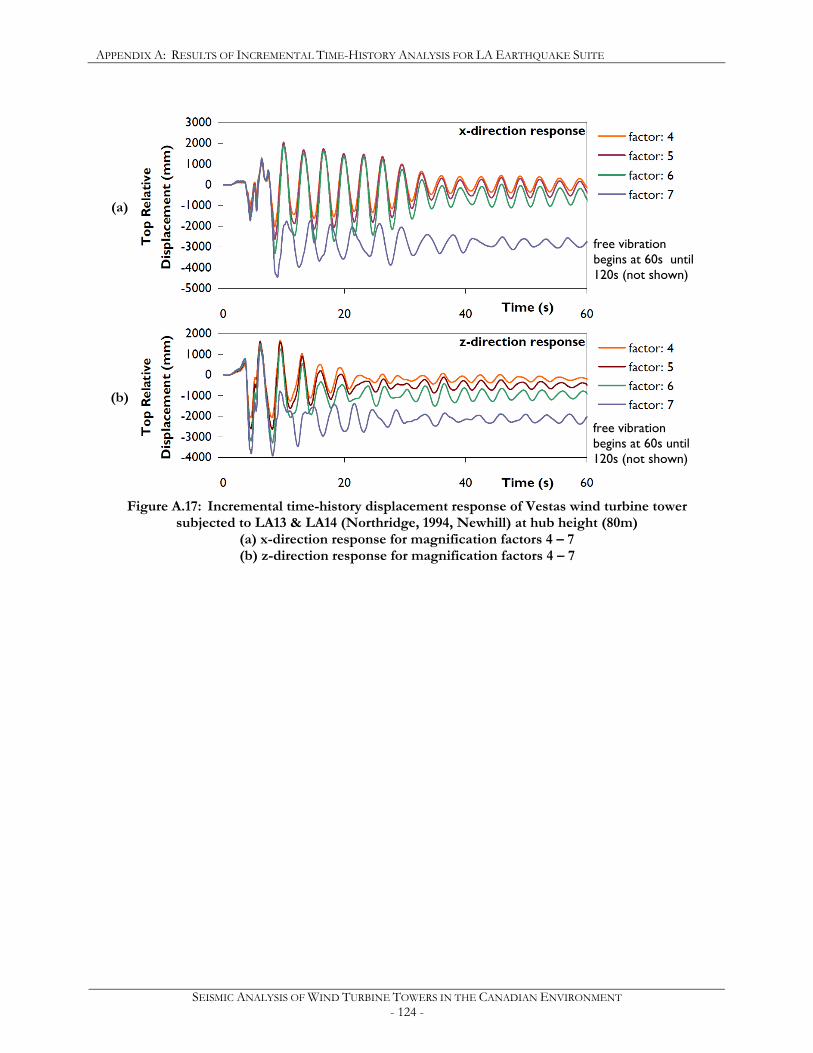
APPENDIX A: RESULTS OF INCREMENTAL TIME-HISTORY ANALYSIS FOR LA EARTHQUAKE SUITE
SEISMIC ANALYSIS OF WIND TURBINE TOWERS IN THE CANADIAN ENVIRONMENT - 124 -
Figure A.17: Incremental time-history displacement response of Vestas wind turbine tower
subjected to LA13 & LA14 (Northridge, 1994, Newhill) at hub height (80m) (a) x-direction response for magnification factors 4 – 7 (b) z-direction response for magnification factors 4 – 7
free vibration begins at 60s until 120s (not shown)
(a)
(b)
free vibration begins at 60s until 120s (not shown)
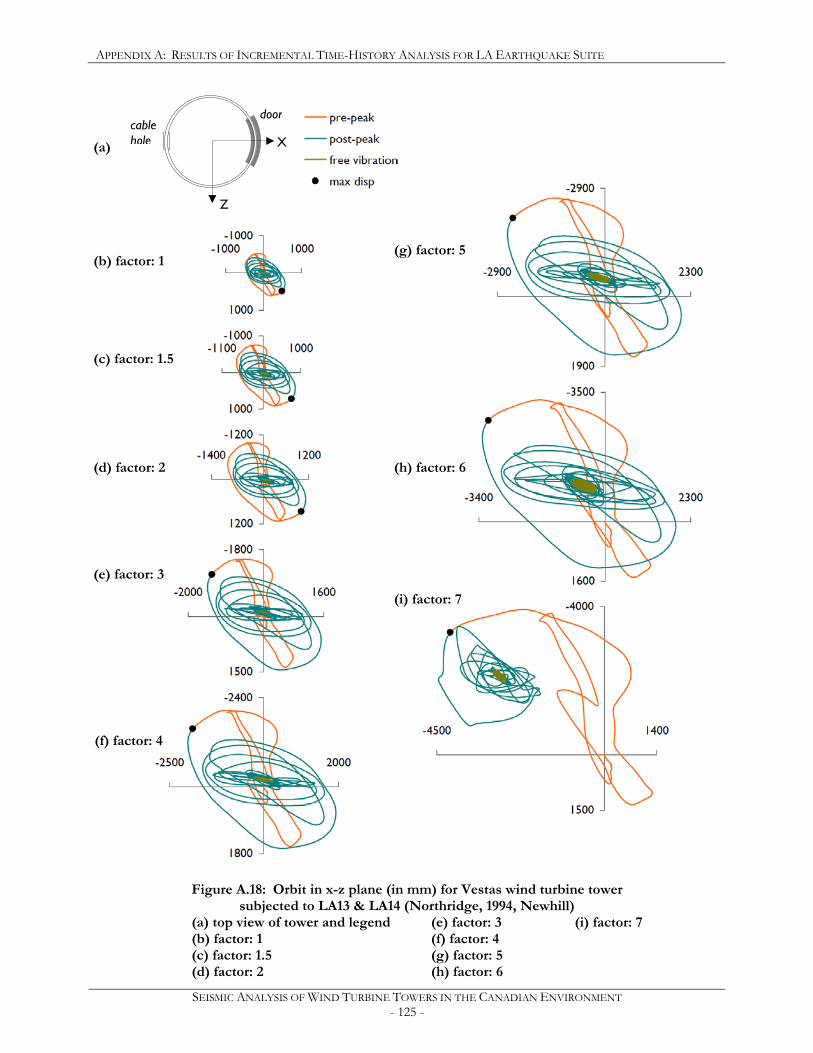
APPENDIX A: RESULTS OF INCREMENTAL TIME-HISTORY ANALYSIS FOR LA EARTHQUAKE SUITE
SEISMIC ANALYSIS OF WIND TURBINE TOWERS IN THE CANADIAN ENVIRONMENT - 125 -
Figure A.18: Orbit in x-z plane (in mm) for Vestas wind turbine tower subjected to LA13 & LA14 (Northridge, 1994, Newhill)
(a) top view of tower and legend (e) factor: 3 (i) factor: 7 (b) factor: 1 (f) factor: 4 (c) factor: 1.5 (g) factor: 5 (d) factor: 2 (h) factor: 6
door cable hole X
Z
(a)
(f) factor: 4
(g) factor: 5
(h) factor: 6
(b) factor: 1
(d) factor: 2
(e) factor: 3
(c) factor: 1.5
(i) factor: 7
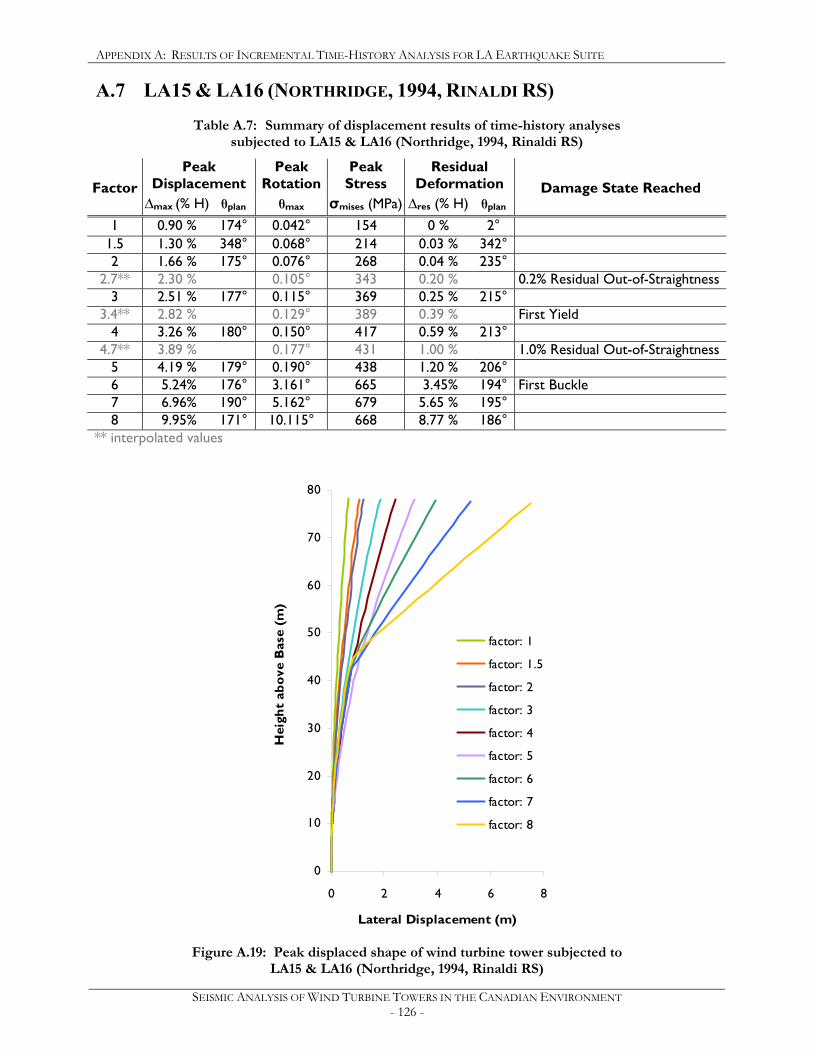
APPENDIX A: RESULTS OF INCREMENTAL TIME-HISTORY ANALYSIS FOR LA EARTHQUAKE SUITE
SEISMIC ANALYSIS OF WIND TURBINE TOWERS IN THE CANADIAN ENVIRONMENT - 126 -
A.7 LA15 & LA16 (NORTHRIDGE, 1994, RINALDI RS)
Table A.7: Summary of displacement results of time-history analyses subjected to LA15 & LA16 (Northridge, 1994, Rinaldi RS)
Peak Displacement
Peak Rotation
Peak Stress
Residual Deformation Factor
∆max (% H) θplan θmax σmises (MPa) ∆res (% H) θplan Damage State Reached
1 0.90 % 174° 0.042° 154 0 % 2°
1.5 1.30 % 348° 0.068° 214 0.03 % 342° 2 1.66 % 175° 0.076° 268 0.04 % 235°
2.7** 2.30 % 0.105° 343 0.20 % 0.2% Residual Out-of-Straightness 3 2.51 % 177° 0.115° 369 0.25 % 215°
3.4** 2.82 % 0.129° 389 0.39 % First Yield 4 3.26 % 180° 0.150° 417 0.59 % 213°
4.7** 3.89 % 0.177° 431 1.00 % 1.0% Residual Out-of-Straightness 5 4.19 % 179° 0.190° 438 1.20 % 206° 6 5.24% 176° 3.161° 665 3.45% 194° First Buckle 7 6.96% 190° 5.162° 679 5.65 % 195° 8 9.95% 171° 10.115° 668 8.77 % 186°
** interpolated values
0
10
20
30
40
50
60
70
80
0 2 4 6 8
Lateral Displacement (m)
Hei
ght
abov
e B
ase
(m)
factor: 1
factor: 1.5
factor: 2
factor: 3
factor: 4
factor: 5
factor: 6
factor: 7
factor: 8
Figure A.19: Peak displaced shape of wind turbine tower subjected to
LA15 & LA16 (Northridge, 1994, Rinaldi RS)
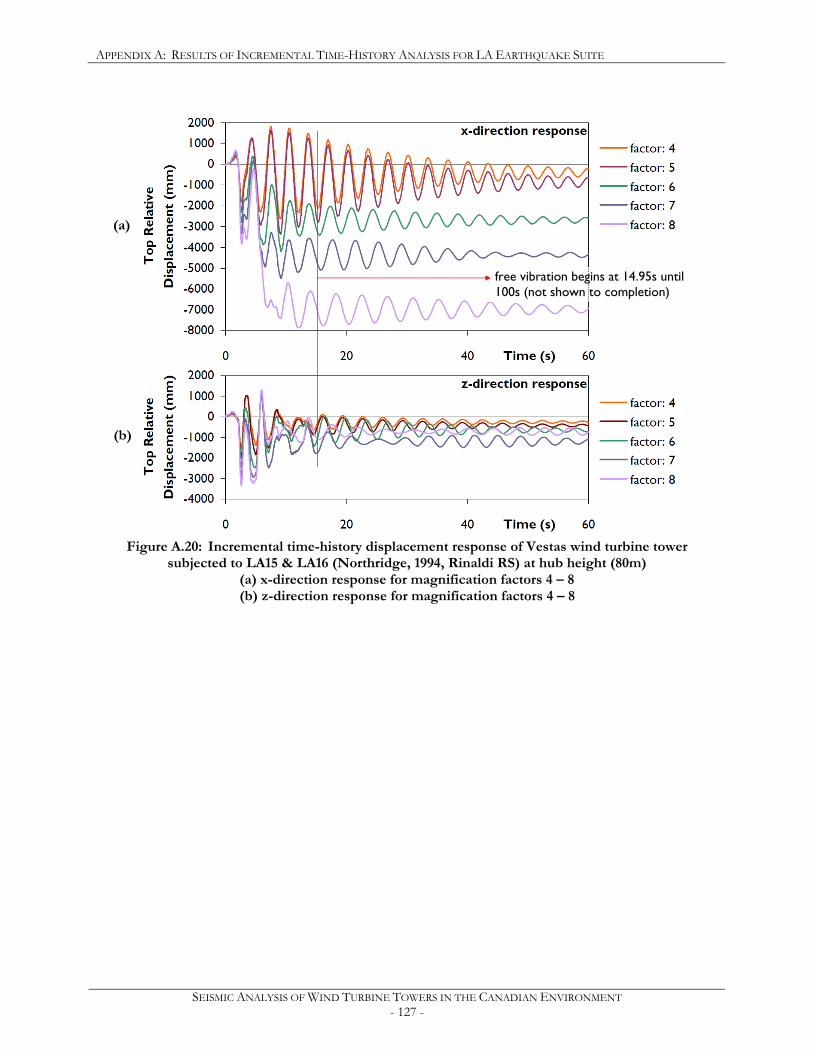
APPENDIX A: RESULTS OF INCREMENTAL TIME-HISTORY ANALYSIS FOR LA EARTHQUAKE SUITE
SEISMIC ANALYSIS OF WIND TURBINE TOWERS IN THE CANADIAN ENVIRONMENT - 127 -
Figure A.20: Incremental time-history displacement response of Vestas wind turbine tower
subjected to LA15 & LA16 (Northridge, 1994, Rinaldi RS) at hub height (80m) (a) x-direction response for magnification factors 4 – 8 (b) z-direction response for magnification factors 4 – 8
(a)
(b)
free vibration begins at 14.95s until 100s (not shown to completion)
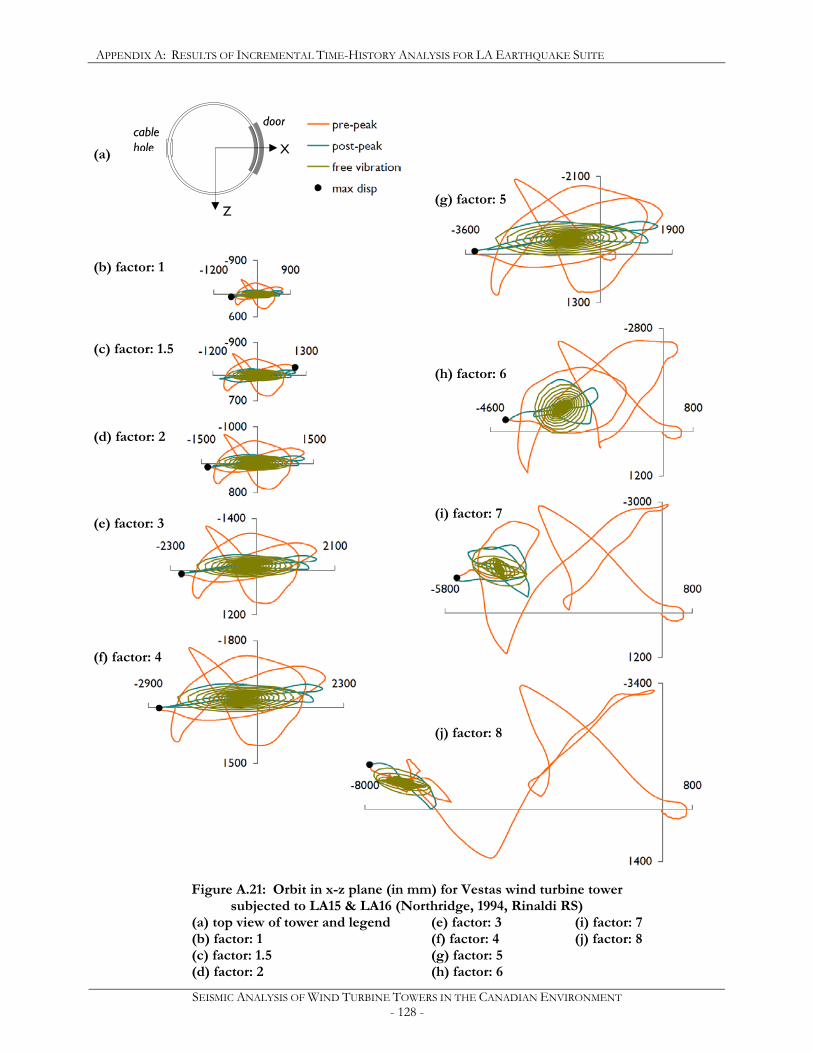
APPENDIX A: RESULTS OF INCREMENTAL TIME-HISTORY ANALYSIS FOR LA EARTHQUAKE SUITE
SEISMIC ANALYSIS OF WIND TURBINE TOWERS IN THE CANADIAN ENVIRONMENT - 128 -
Figure A.21: Orbit in x-z plane (in mm) for Vestas wind turbine tower subjected to LA15 & LA16 (Northridge, 1994, Rinaldi RS)
(a) top view of tower and legend (e) factor: 3 (i) factor: 7 (b) factor: 1 (f) factor: 4 (j) factor: 8 (c) factor: 1.5 (g) factor: 5 (d) factor: 2 (h) factor: 6
door cable hole X
Z
(a)
(f) factor: 4
(g) factor: 5
(h) factor: 6
(b) factor: 1
(d) factor: 2
(e) factor: 3
(c) factor: 1.5
(j) factor: 8
(i) factor: 7

APPENDIX A: RESULTS OF INCREMENTAL TIME-HISTORY ANALYSIS FOR LA EARTHQUAKE SUITE
SEISMIC ANALYSIS OF WIND TURBINE TOWERS IN THE CANADIAN ENVIRONMENT - 129 -
A.8 LA17 & LA18 (NORTHRIDGE, 1994, SYLMAR)
Table A.8: Summary of displacement results of time-history analyses subjected to LA17 & LA18 (Northridge, 1994, Sylmar)
Peak Displacement
Peak Rotation
Peak Stress
Residual Deformation Factor
∆max (% H) θplan θmax σmises (MPa) ∆res (% H) θplan Damage State Reached
1 1.39 % 216° 0.064° 183 0.01 % 179°
1.5 1.94 % 216° 0.092° 259 0.02 % 110° 2 2.57 % 216° 0.122° 336 0.07 % 205°
2.4** 3.02 % 0.142° 363 0.20 % 0.2% Residual Out-of-Straightness 2.8** 3.46 % 0.161° 389 0.33 % First Yield
3 3.74 % 217° 0.173° 405 0.41 % 221° 4 4.69 % 217° 0.225° 477 0.72 % 223°
4.1** 4.88 % 0.546° 505 1.00 % 1.0% Residual Out-of-Straightness 5 6.01 % 219° 2.478° 673 2.69 % 225° First Buckle
** interpolated values
0
10
20
30
40
50
60
70
80
0 2 4 6
Lateral Displacement (m)
Hei
ght
abov
e B
ase
(m)
factor: 1
factor: 1.5
factor: 2
factor: 3
factor: 4
factor: 5
Figure A.22: Peak displaced shape of wind turbine tower subjected to
LA17 & LA18 (Northridge, 1994, Sylmar)
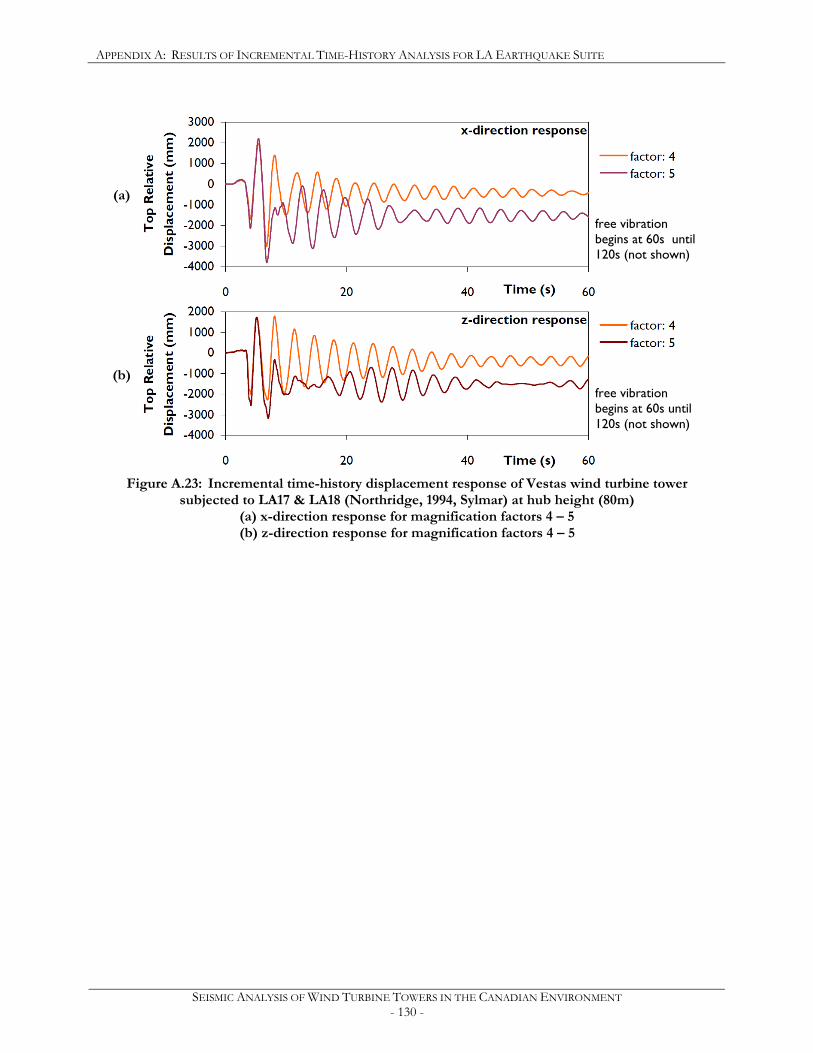
APPENDIX A: RESULTS OF INCREMENTAL TIME-HISTORY ANALYSIS FOR LA EARTHQUAKE SUITE
SEISMIC ANALYSIS OF WIND TURBINE TOWERS IN THE CANADIAN ENVIRONMENT - 130 -
Figure A.23: Incremental time-history displacement response of Vestas wind turbine tower
subjected to LA17 & LA18 (Northridge, 1994, Sylmar) at hub height (80m) (a) x-direction response for magnification factors 4 – 5 (b) z-direction response for magnification factors 4 – 5
free vibration begins at 60s until 120s (not shown)
(a)
(b) free vibration begins at 60s until 120s (not shown)
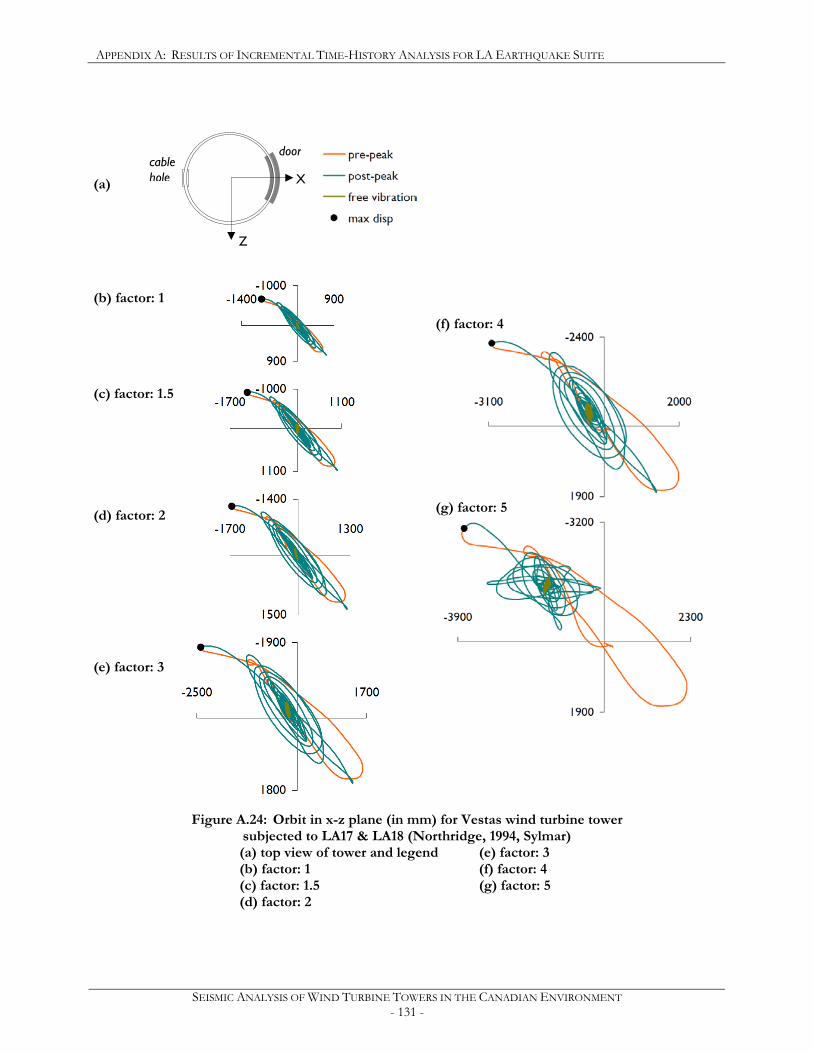
APPENDIX A: RESULTS OF INCREMENTAL TIME-HISTORY ANALYSIS FOR LA EARTHQUAKE SUITE
SEISMIC ANALYSIS OF WIND TURBINE TOWERS IN THE CANADIAN ENVIRONMENT - 131 -
Figure A.24: Orbit in x-z plane (in mm) for Vestas wind turbine tower subjected to LA17 & LA18 (Northridge, 1994, Sylmar) (a) top view of tower and legend (e) factor: 3 (b) factor: 1 (f) factor: 4 (c) factor: 1.5 (g) factor: 5 (d) factor: 2
door cable hole X
Z
(a)
(f) factor: 4
(g) factor: 5
(b) factor: 1
(d) factor: 2
(e) factor: 3
(c) factor: 1.5
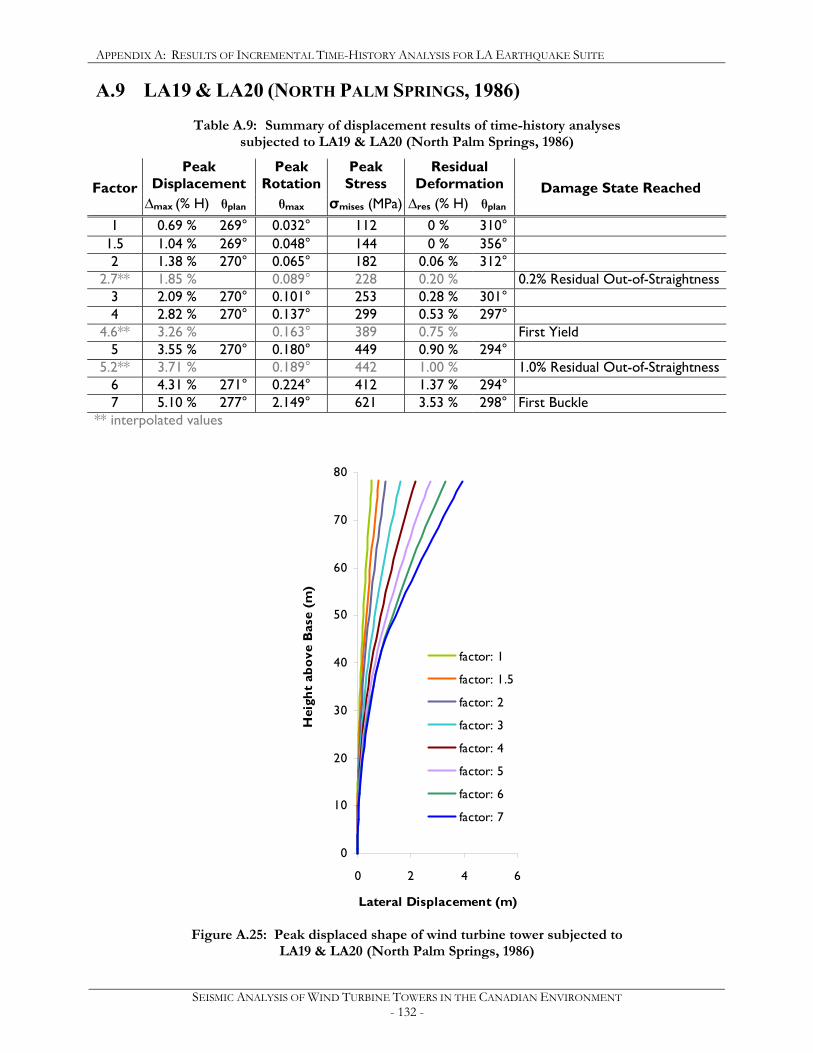
APPENDIX A: RESULTS OF INCREMENTAL TIME-HISTORY ANALYSIS FOR LA EARTHQUAKE SUITE
SEISMIC ANALYSIS OF WIND TURBINE TOWERS IN THE CANADIAN ENVIRONMENT - 132 -
A.9 LA19 & LA20 (NORTH PALM SPRINGS, 1986)
Table A.9: Summary of displacement results of time-history analyses subjected to LA19 & LA20 (North Palm Springs, 1986)
Peak Displacement
Peak Rotation
Peak Stress
Residual Deformation Factor
∆max (% H) θplan θmax σmises (MPa) ∆res (% H) θplan Damage State Reached
1 0.69 % 269° 0.032° 112 0 % 310°
1.5 1.04 % 269° 0.048° 144 0 % 356° 2 1.38 % 270° 0.065° 182 0.06 % 312°
2.7** 1.85 % 0.089° 228 0.20 % 0.2% Residual Out-of-Straightness 3 2.09 % 270° 0.101° 253 0.28 % 301° 4 2.82 % 270° 0.137° 299 0.53 % 297°
4.6** 3.26 % 0.163° 389 0.75 % First Yield 5 3.55 % 270° 0.180° 449 0.90 % 294°
5.2** 3.71 % 0.189° 442 1.00 % 1.0% Residual Out-of-Straightness 6 4.31 % 271° 0.224° 412 1.37 % 294° 7 5.10 % 277° 2.149° 621 3.53 % 298° First Buckle
** interpolated values
0
10
20
30
40
50
60
70
80
0 2 4 6
Lateral Displacement (m)
Hei
ght
abov
e B
ase
(m)
factor: 1
factor: 1.5
factor: 2
factor: 3
factor: 4
factor: 5
factor: 6
factor: 7
Figure A.25: Peak displaced shape of wind turbine tower subjected to
LA19 & LA20 (North Palm Springs, 1986)
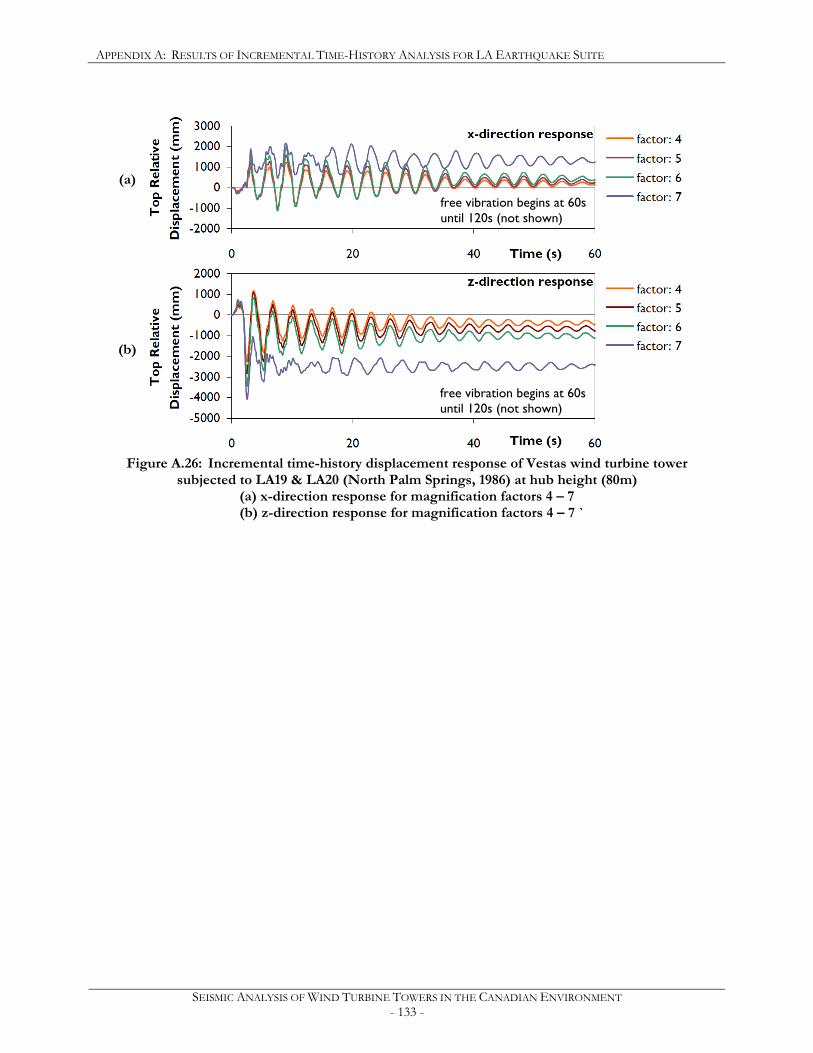
APPENDIX A: RESULTS OF INCREMENTAL TIME-HISTORY ANALYSIS FOR LA EARTHQUAKE SUITE
SEISMIC ANALYSIS OF WIND TURBINE TOWERS IN THE CANADIAN ENVIRONMENT - 133 -
Figure A.26: Incremental time-history displacement response of Vestas wind turbine tower
subjected to LA19 & LA20 (North Palm Springs, 1986) at hub height (80m) (a) x-direction response for magnification factors 4 – 7 (b) z-direction response for magnification factors 4 – 7 `
free vibration begins at 60s until 120s (not shown)
(a)
(b)
free vibration begins at 60s until 120s (not shown)
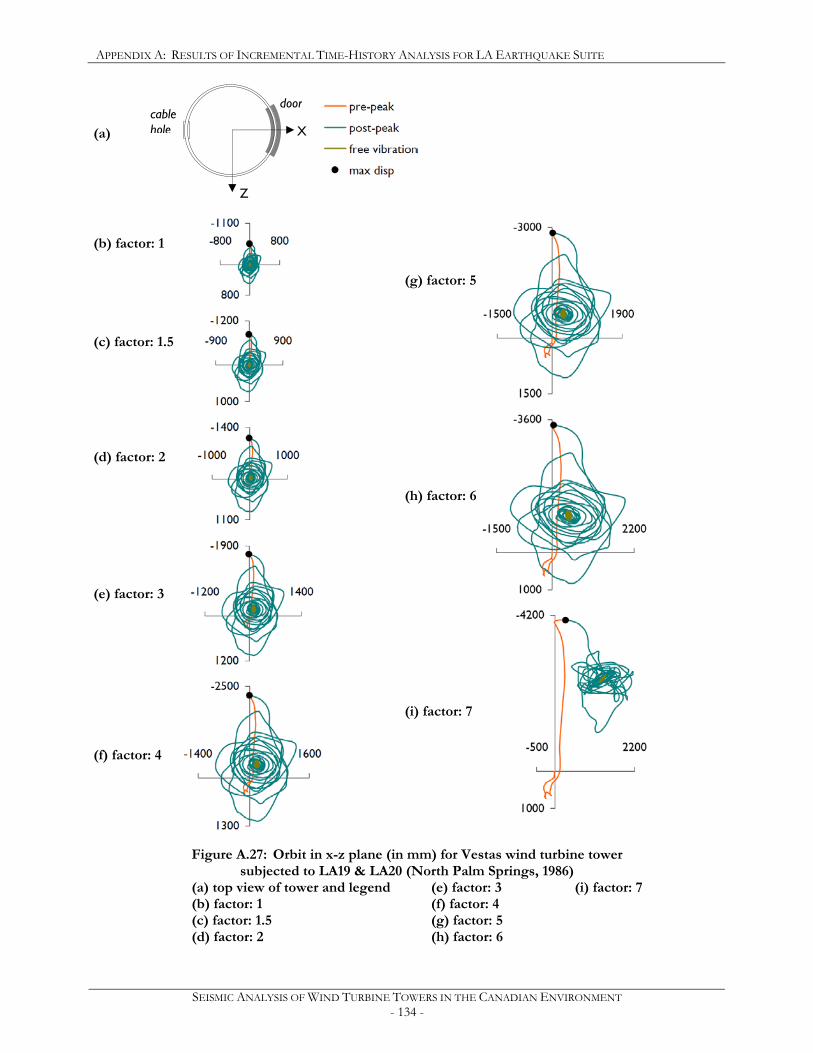
APPENDIX A: RESULTS OF INCREMENTAL TIME-HISTORY ANALYSIS FOR LA EARTHQUAKE SUITE
SEISMIC ANALYSIS OF WIND TURBINE TOWERS IN THE CANADIAN ENVIRONMENT - 134 -
Figure A.27: Orbit in x-z plane (in mm) for Vestas wind turbine tower subjected to LA19 & LA20 (North Palm Springs, 1986)
(a) top view of tower and legend (e) factor: 3 (i) factor: 7 (b) factor: 1 (f) factor: 4 (c) factor: 1.5 (g) factor: 5 (d) factor: 2 (h) factor: 6
door cable hole X
Z
(a)
(f) factor: 4
(g) factor: 5
(h) factor: 6
(b) factor: 1
(d) factor: 2
(e) factor: 3
(c) factor: 1.5
(i) factor: 7
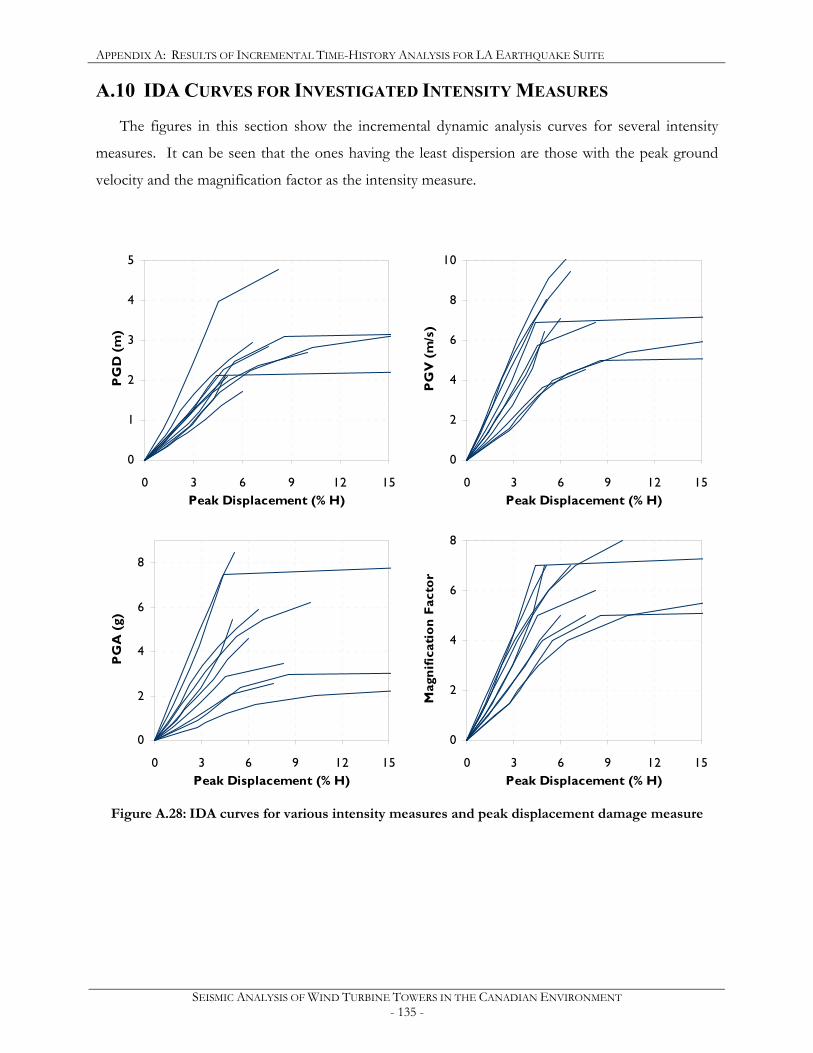
APPENDIX A: RESULTS OF INCREMENTAL TIME-HISTORY ANALYSIS FOR LA EARTHQUAKE SUITE
SEISMIC ANALYSIS OF WIND TURBINE TOWERS IN THE CANADIAN ENVIRONMENT - 135 -
A.10 IDA CURVES FOR INVESTIGATED INTENSITY MEASURES
The figures in this section show the incremental dynamic analysis curves for several intensity
measures. It can be seen that the ones having the least dispersion are those with the peak ground
velocity and the magnification factor as the intensity measure.
0
1
2
3
4
5
0 3 6 9 12 15Peak Displacement (% H)
PG
D (
m)
0
2
4
6
8
10
0 3 6 9 12 15Peak Displacement (% H)
PG
V (
m/s
)
0
2
4
6
8
0 3 6 9 12 15Peak Displacement (% H)
PG
A (
g)
0
2
4
6
8
0 3 6 9 12 15Peak Displacement (% H)
Mag
nific
atio
n Fa
ctor
Figure A.28: IDA curves for various intensity measures and peak displacement damage measure
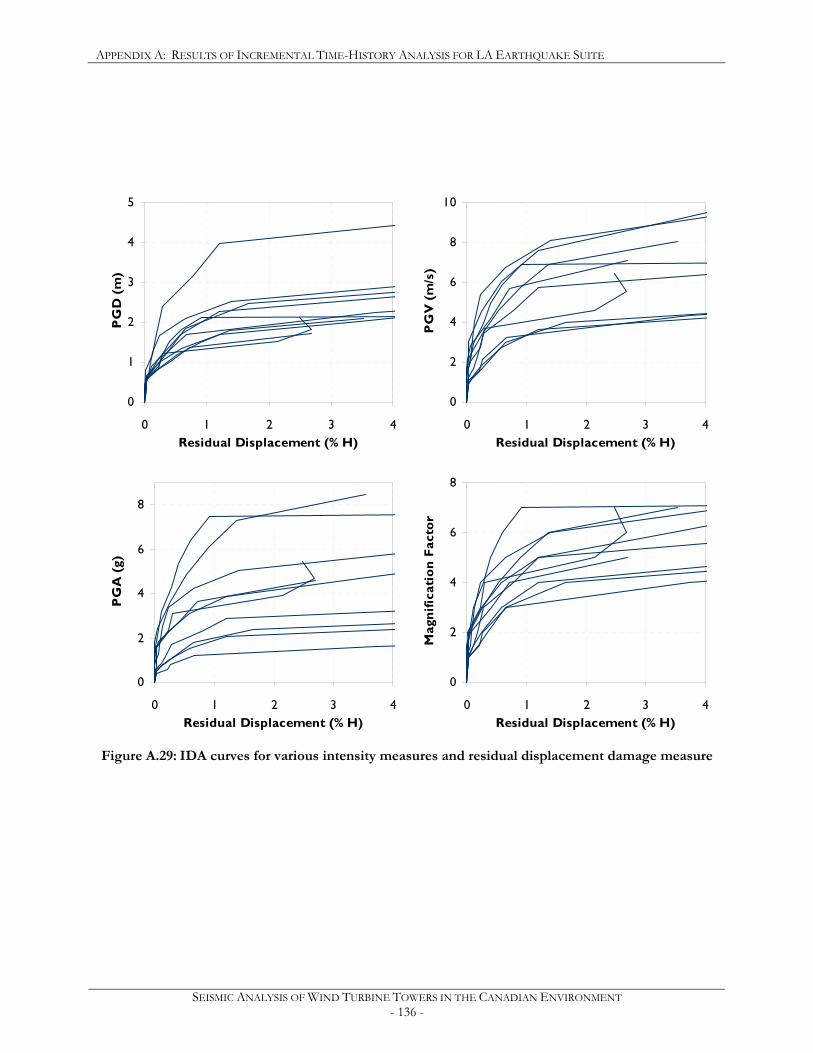
APPENDIX A: RESULTS OF INCREMENTAL TIME-HISTORY ANALYSIS FOR LA EARTHQUAKE SUITE
SEISMIC ANALYSIS OF WIND TURBINE TOWERS IN THE CANADIAN ENVIRONMENT - 136 -
0
1
2
3
4
5
0 1 2 3 4Residual Displacement (% H)
PG
D (
m)
0
2
4
6
8
10
0 1 2 3 4Residual Displacement (% H)
PG
V (
m/s
)
0
2
4
6
8
0 1 2 3 4Residual Displacement (% H)
PG
A (
g)
0
2
4
6
8
0 1 2 3 4Residual Displacement (% H)
Mag
nific
atio
n Fa
ctor
Figure A.29: IDA curves for various intensity measures and residual displacement damage measure
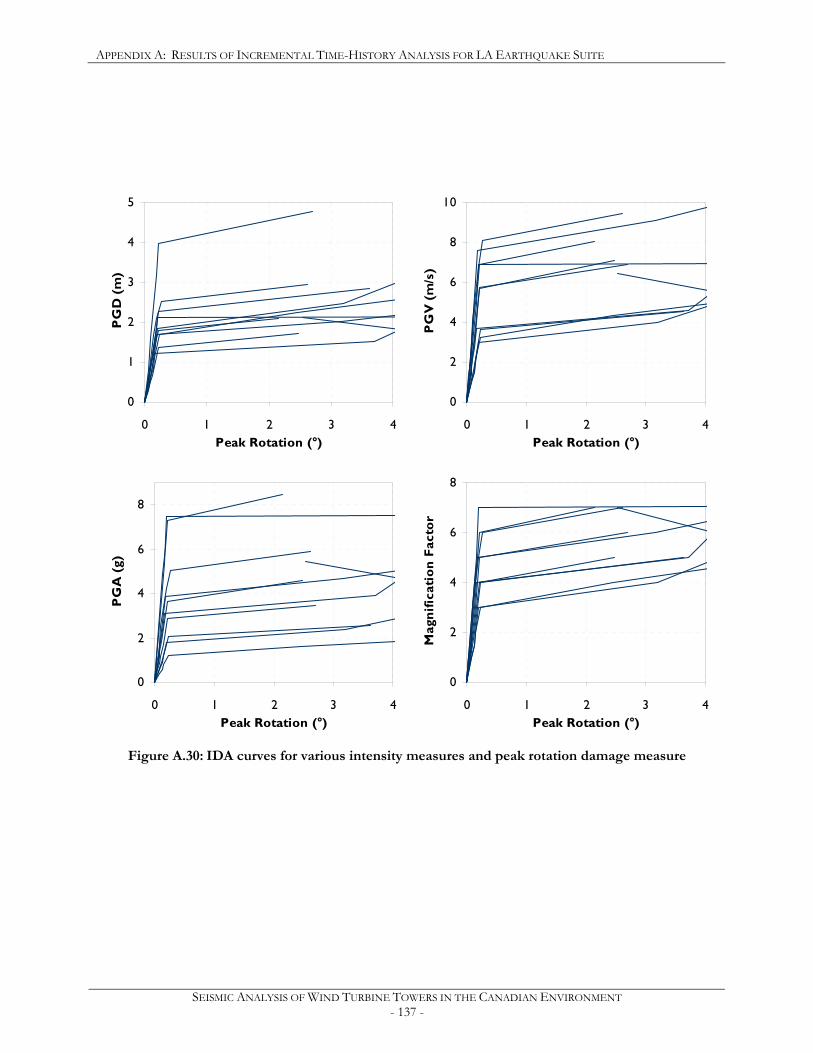
APPENDIX A: RESULTS OF INCREMENTAL TIME-HISTORY ANALYSIS FOR LA EARTHQUAKE SUITE
SEISMIC ANALYSIS OF WIND TURBINE TOWERS IN THE CANADIAN ENVIRONMENT - 137 -
0
1
2
3
4
5
0 1 2 3 4Peak Rotation (°)
PG
D (
m)
0
2
4
6
8
10
0 1 2 3 4Peak Rotation (°)
PG
V (
m/s
)
0
2
4
6
8
0 1 2 3 4Peak Rotation (°)
PG
A (
g)
0
2
4
6
8
0 1 2 3 4Peak Rotation (°)
Mag
nific
atio
n Fa
ctor
Figure A.30: IDA curves for various intensity measures and peak rotation damage measure

SEISMIC ANALYSIS OF WIND TURBINE TOWERS IN THE CANADIAN ENVIRONMENT - 138 -
APPENDIX B: SEISMIC HAZARD FOR TWO CANADIAN SITES
The following pages contain the reports of the online interpolator from Earthquakes Canada
(http://earthquakescanada.nrcan.gc.ca/hazard) for the two locations chosen in Canada: close to
Dunnville, Ontario to represent Eastern Canada, and offshore of Victoria, BC to represent Western
Canada.
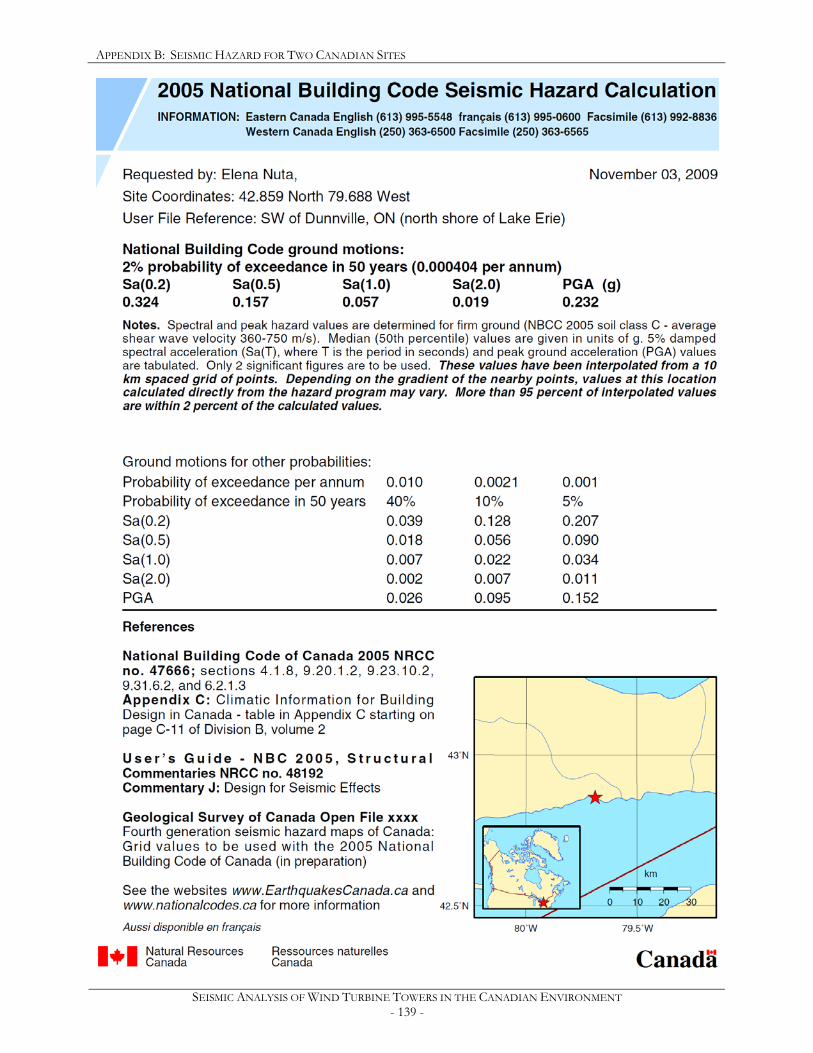
APPENDIX B: SEISMIC HAZARD FOR TWO CANADIAN SITES
SEISMIC ANALYSIS OF WIND TURBINE TOWERS IN THE CANADIAN ENVIRONMENT - 139 -
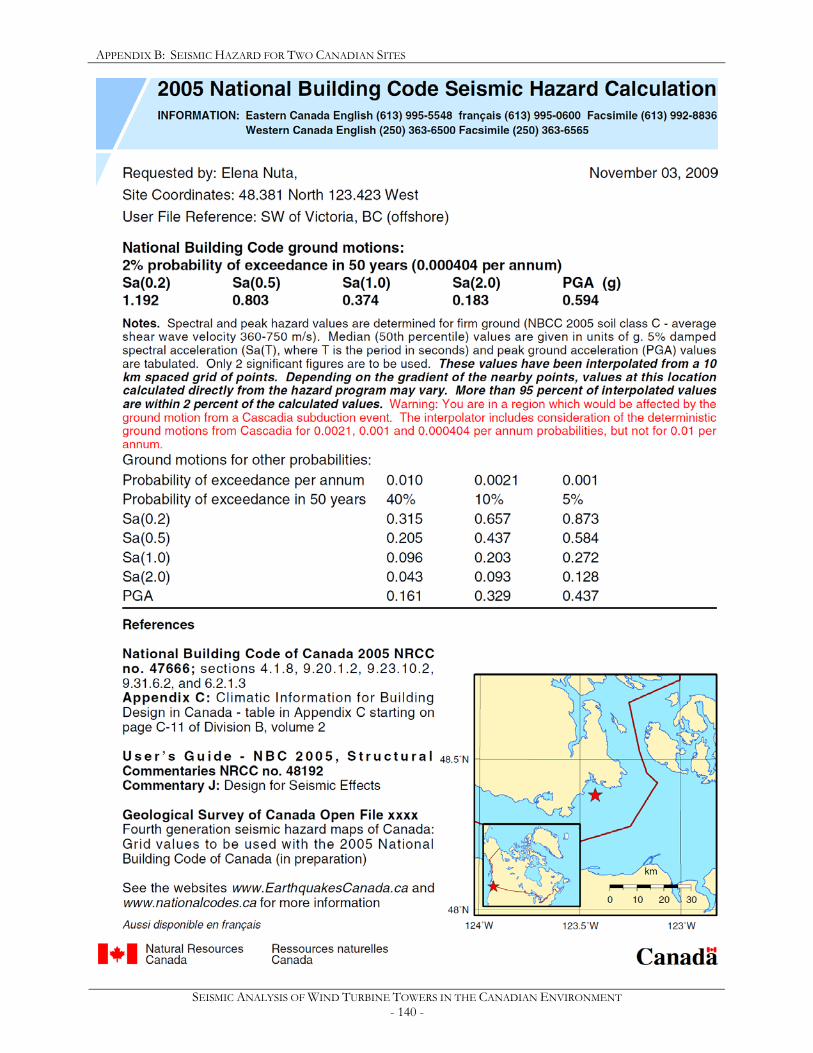
APPENDIX B: SEISMIC HAZARD FOR TWO CANADIAN SITES
SEISMIC ANALYSIS OF WIND TURBINE TOWERS IN THE CANADIAN ENVIRONMENT - 140 -
SEISMIC ANALYSIS OF WIND TURBINE TOWERS IN THE CANADIAN ENVIRONMENT - 141 -
APPENDIX C: RESULTS OF THE WESTERN CANADA
EARTHQUAKE SUITE
This appendix includes the result items for the Western Canada earthquake suite:
• summary of displacement results in tabular format
• comparison of the peak displaced shape of all the magnification factors
• the time-history displacement response at hub height for the higher magnification factors
Orbit plots are omitted, as they were not essential for determining the probability of damage. In
addition, fragility curves for the PGV and the PGA intensity measures are included in this appendix.
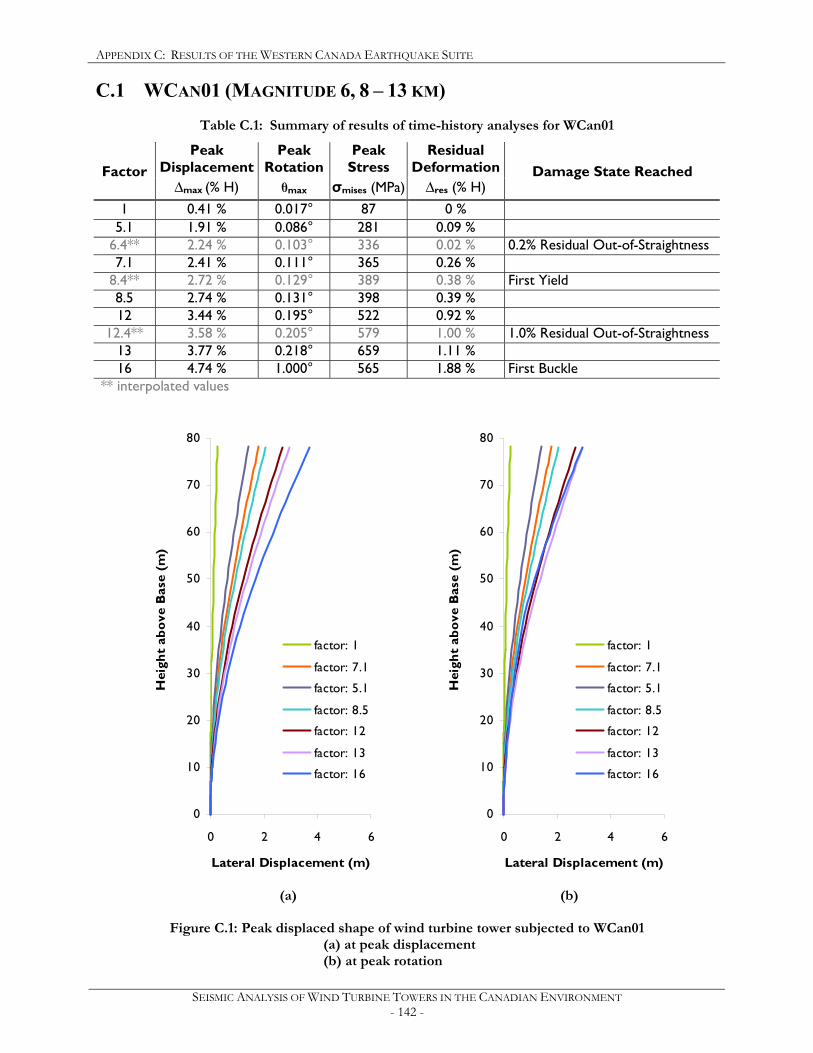
APPENDIX C: RESULTS OF THE WESTERN CANADA EARTHQUAKE SUITE
SEISMIC ANALYSIS OF WIND TURBINE TOWERS IN THE CANADIAN ENVIRONMENT - 142 -
C.1 WCAN01 (MAGNITUDE 6, 8 – 13 KM)
Table C.1: Summary of results of time-history analyses for WCan01
Peak Displacement
Peak Rotation
Peak Stress
Residual Deformation Factor
∆max (% H) θmax σmises (MPa) ∆res (% H) Damage State Reached
1 0.41 % 0.017° 87 0 %
5.1 1.91 % 0.086° 281 0.09 % 6.4** 2.24 % 0.103° 336 0.02 % 0.2% Residual Out-of-Straightness 7.1 2.41 % 0.111° 365 0.26 %
8.4** 2.72 % 0.129° 389 0.38 % First Yield 8.5 2.74 % 0.131° 398 0.39 % 12 3.44 % 0.195° 522 0.92 %
12.4** 3.58 % 0.205° 579 1.00 % 1.0% Residual Out-of-Straightness 13 3.77 % 0.218° 659 1.11 % 16 4.74 % 1.000° 565 1.88 % First Buckle
** interpolated values
0
10
20
30
40
50
60
70
80
0 2 4 6
Lateral Displacement (m)
Hei
ght
abov
e B
ase
(m)
factor: 1
factor: 7.1
factor: 5.1
factor: 8.5
factor: 12
factor: 13
factor: 16
0
10
20
30
40
50
60
70
80
0 2 4 6
Lateral Displacement (m)
Hei
ght
abov
e B
ase
(m)
factor: 1
factor: 7.1
factor: 5.1
factor: 8.5
factor: 12
factor: 13
factor: 16
(a) (b)
Figure C.1: Peak displaced shape of wind turbine tower subjected to WCan01 (a) at peak displacement (b) at peak rotation
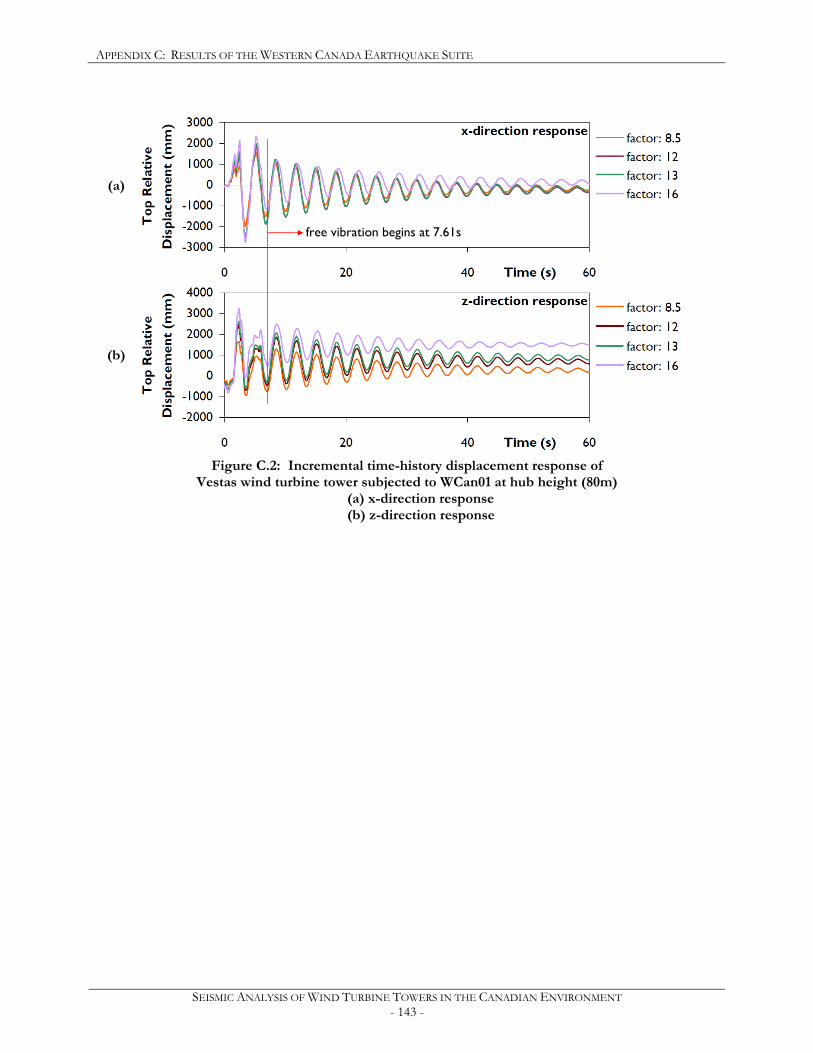
APPENDIX C: RESULTS OF THE WESTERN CANADA EARTHQUAKE SUITE
SEISMIC ANALYSIS OF WIND TURBINE TOWERS IN THE CANADIAN ENVIRONMENT - 143 -
Figure C.2: Incremental time-history displacement response of
Vestas wind turbine tower subjected to WCan01 at hub height (80m) (a) x-direction response (b) z-direction response
free vibration begins at 7.61s
(a)
(b)
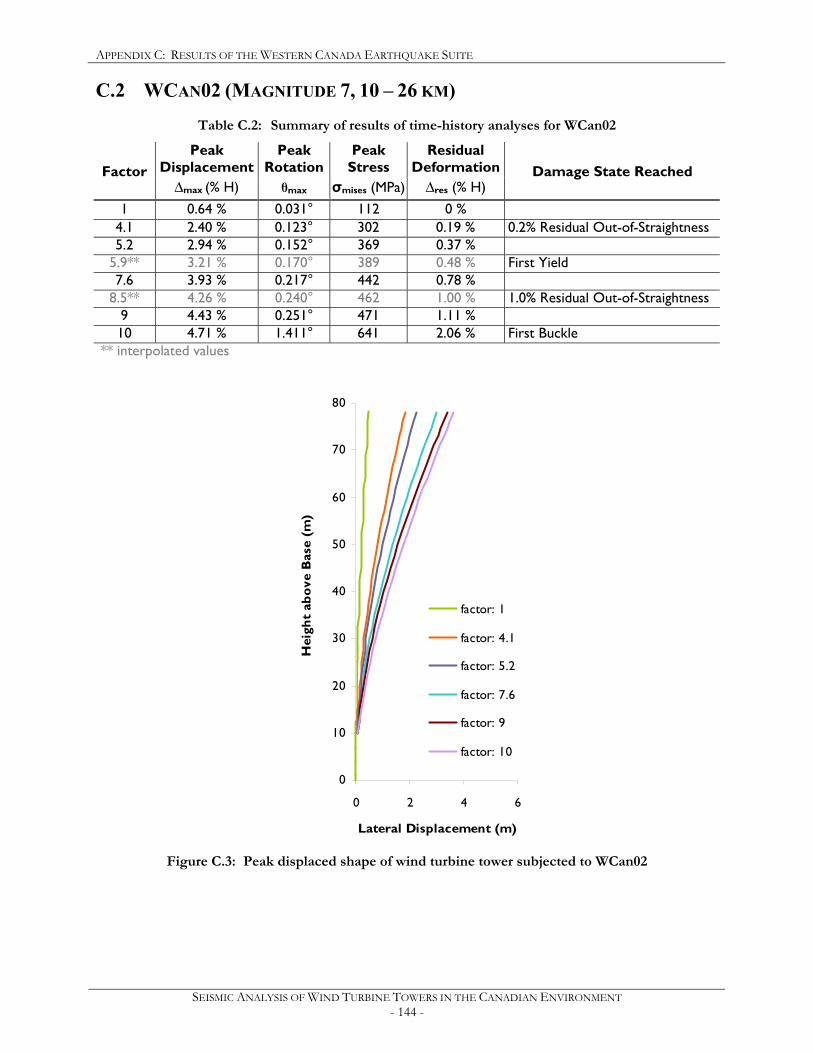
APPENDIX C: RESULTS OF THE WESTERN CANADA EARTHQUAKE SUITE
SEISMIC ANALYSIS OF WIND TURBINE TOWERS IN THE CANADIAN ENVIRONMENT - 144 -
C.2 WCAN02 (MAGNITUDE 7, 10 – 26 KM)
Table C.2: Summary of results of time-history analyses for WCan02
Peak Displacement
Peak Rotation
Peak Stress
Residual Deformation Factor
∆max (% H) θmax σmises (MPa) ∆res (% H) Damage State Reached
1 0.64 % 0.031° 112 0 %
4.1 2.40 % 0.123° 302 0.19 % 0.2% Residual Out-of-Straightness 5.2 2.94 % 0.152° 369 0.37 %
5.9** 3.21 % 0.170° 389 0.48 % First Yield 7.6 3.93 % 0.217° 442 0.78 %
8.5** 4.26 % 0.240° 462 1.00 % 1.0% Residual Out-of-Straightness 9 4.43 % 0.251° 471 1.11 % 10 4.71 % 1.411° 641 2.06 % First Buckle
** interpolated values
0
10
20
30
40
50
60
70
80
0 2 4 6
Lateral Displacement (m)
Hei
ght
abov
e B
ase
(m)
factor: 1
factor: 4.1
factor: 5.2
factor: 7.6
factor: 9
factor: 10
Figure C.3: Peak displaced shape of wind turbine tower subjected to WCan02
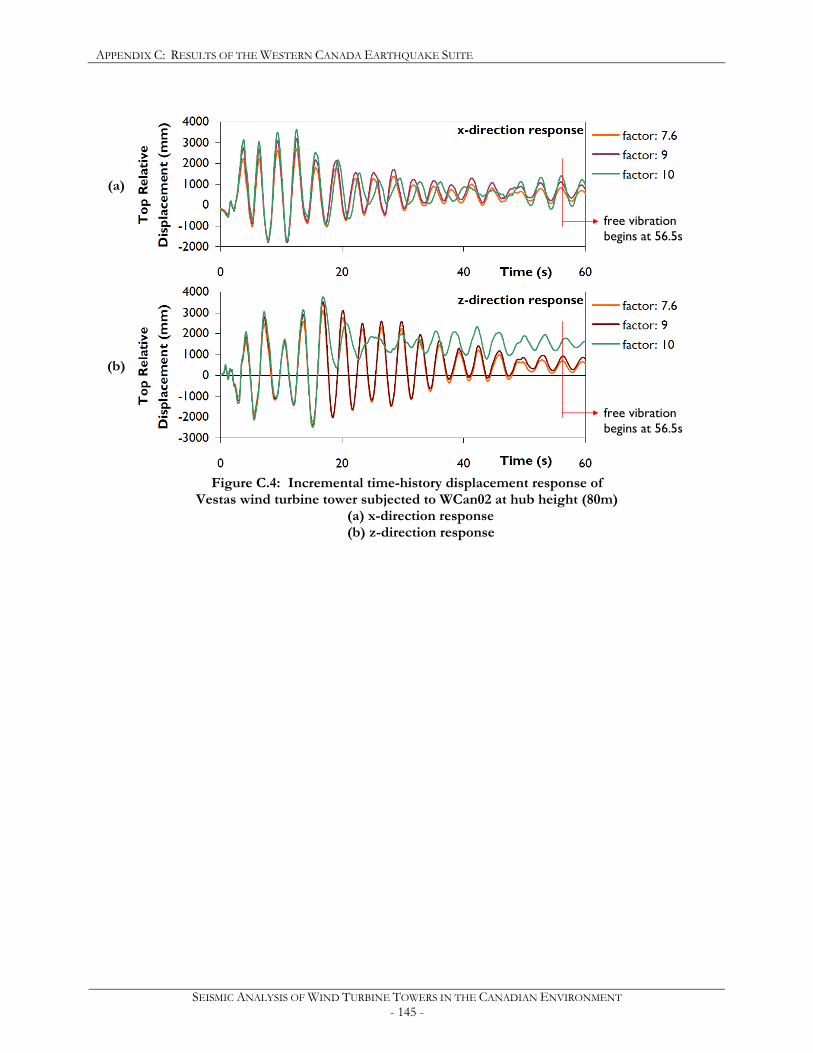
APPENDIX C: RESULTS OF THE WESTERN CANADA EARTHQUAKE SUITE
SEISMIC ANALYSIS OF WIND TURBINE TOWERS IN THE CANADIAN ENVIRONMENT - 145 -
Figure C.4: Incremental time-history displacement response of
Vestas wind turbine tower subjected to WCan02 at hub height (80m) (a) x-direction response (b) z-direction response
free vibration begins at 56.5s
(a)
(b)
free vibration begins at 56.5s

APPENDIX C: RESULTS OF THE WESTERN CANADA EARTHQUAKE SUITE
SEISMIC ANALYSIS OF WIND TURBINE TOWERS IN THE CANADIAN ENVIRONMENT - 146 -
C.3 WCAN03 (MAGNITUDE 7, 10 – 26 KM)
Table C.3: Summary of results of time-history analyses for WCan03
Peak Displacement
Peak Rotation
Peak Stress
Residual Deformation Factor
∆max (% H) θmax σmises (MPa) ∆res (% H) Damage State Reached
1 0.50 % 0.025° 77 0 %
3.8 1.93 % 0.095° 216 0.14 % 4.2** 2.17 % 0.106° 234 0.20 % 0.2% Residual Out-of-Straightness 5.2 2.76 % 0.135° 280 0.35 % 7.7 4.18 % 0.212° 383 0.95 %
7.9** 4.28 % 0.218° 386 1.00 % 1.0% Residual Out-of-Straightness 8** 4.38 % 0.223° 389 1.05 % First Yield 9 5.02 % 0.258° 406 1.37 % 11 7.66 % 3.258° 606 4.93 % First Buckle 12 48.8 % 87.4° 717 48.8 %
** interpolated values
0
10
20
30
40
50
60
70
80
0 2 4 6
Lateral Displacement (m)
Hei
ght
abov
e B
ase
(m)
factor: 1
factor: 3.8
factor: 5.2
factor: 7.7
factor: 9
factor: 11
factor: 12
Figure C.5: Peak displaced shape of wind turbine tower subjected to WCan03

APPENDIX C: RESULTS OF THE WESTERN CANADA EARTHQUAKE SUITE
SEISMIC ANALYSIS OF WIND TURBINE TOWERS IN THE CANADIAN ENVIRONMENT - 147 -
Figure C.6: Incremental time-history displacement response of
Vestas wind turbine tower subjected to WCan03 at hub height (80m) (a) x-direction response (b) z-direction response
free vibration begins at 60.26s (not shown)
(a)
(b)
free vibration begins at 60.26s (not shown)
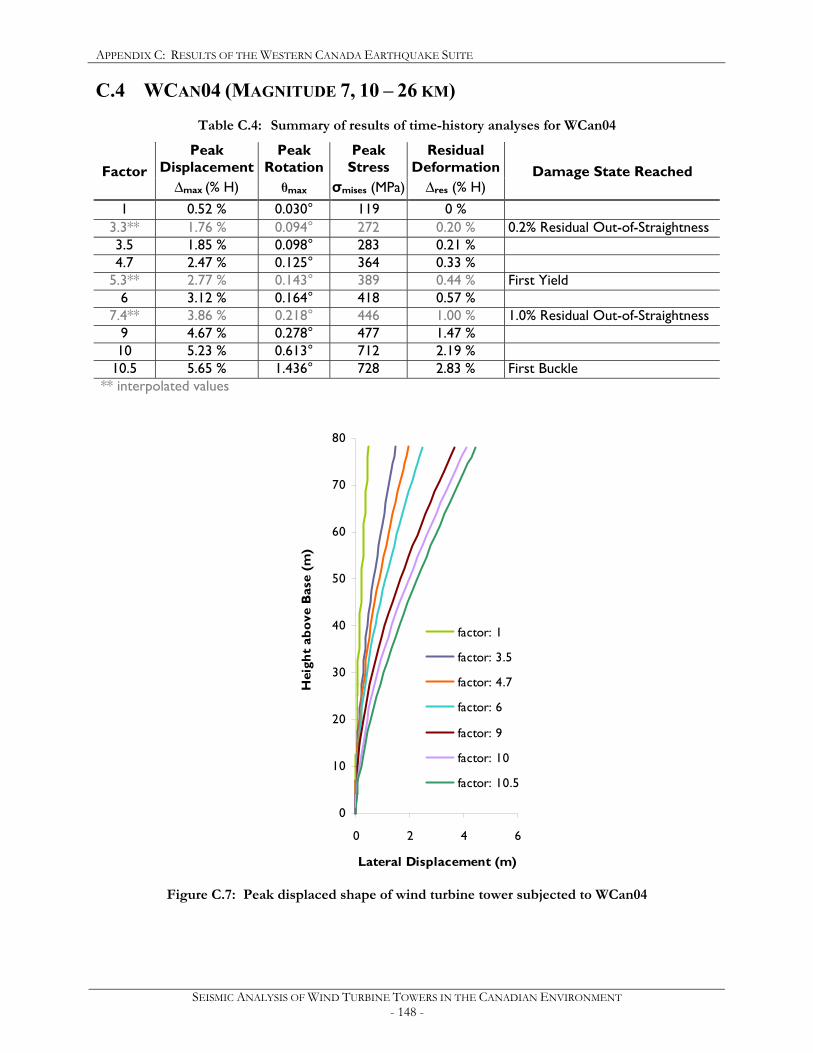
APPENDIX C: RESULTS OF THE WESTERN CANADA EARTHQUAKE SUITE
SEISMIC ANALYSIS OF WIND TURBINE TOWERS IN THE CANADIAN ENVIRONMENT - 148 -
C.4 WCAN04 (MAGNITUDE 7, 10 – 26 KM)
Table C.4: Summary of results of time-history analyses for WCan04
Peak Displacement
Peak Rotation
Peak Stress
Residual Deformation Factor
∆max (% H) θmax σmises (MPa) ∆res (% H) Damage State Reached
1 0.52 % 0.030° 119 0 %
3.3** 1.76 % 0.094° 272 0.20 % 0.2% Residual Out-of-Straightness 3.5 1.85 % 0.098° 283 0.21 % 4.7 2.47 % 0.125° 364 0.33 %
5.3** 2.77 % 0.143° 389 0.44 % First Yield 6 3.12 % 0.164° 418 0.57 %
7.4** 3.86 % 0.218° 446 1.00 % 1.0% Residual Out-of-Straightness 9 4.67 % 0.278° 477 1.47 % 10 5.23 % 0.613° 712 2.19 %
10.5 5.65 % 1.436° 728 2.83 % First Buckle ** interpolated values
0
10
20
30
40
50
60
70
80
0 2 4 6
Lateral Displacement (m)
Hei
ght
abov
e B
ase
(m)
factor: 1
factor: 3.5
factor: 4.7
factor: 6
factor: 9
factor: 10
factor: 10.5
Figure C.7: Peak displaced shape of wind turbine tower subjected to WCan04
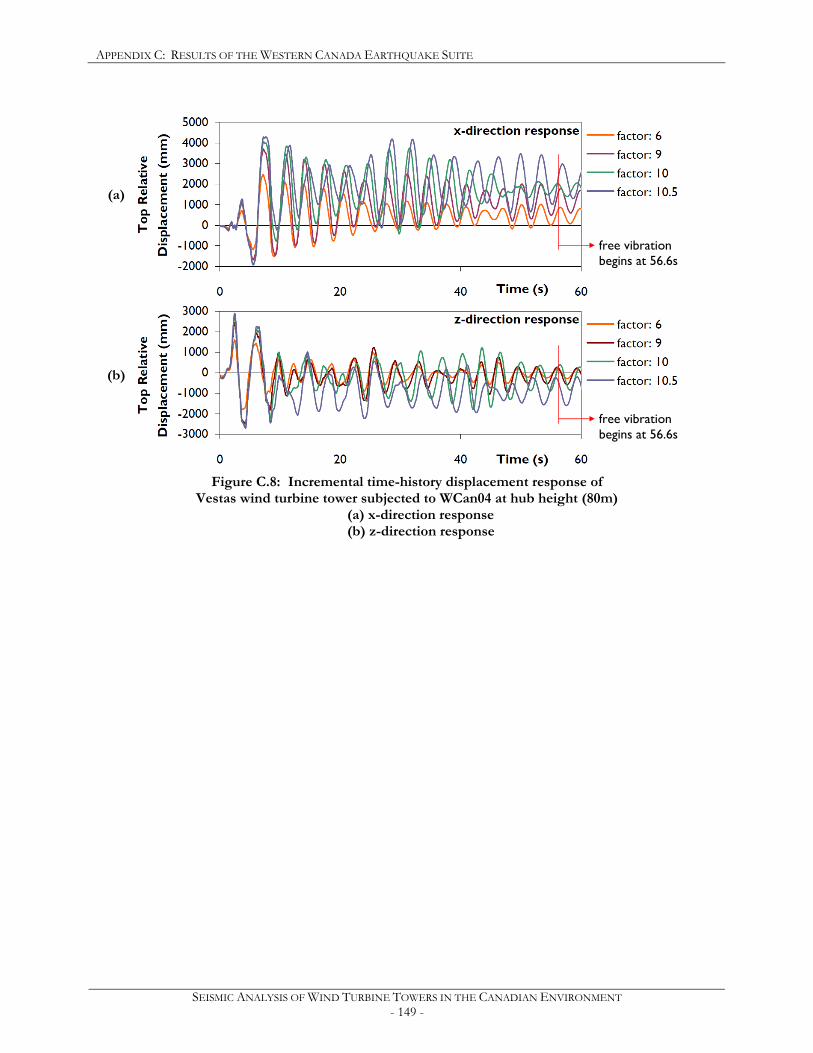
APPENDIX C: RESULTS OF THE WESTERN CANADA EARTHQUAKE SUITE
SEISMIC ANALYSIS OF WIND TURBINE TOWERS IN THE CANADIAN ENVIRONMENT - 149 -
Figure C.8: Incremental time-history displacement response of
Vestas wind turbine tower subjected to WCan04 at hub height (80m) (a) x-direction response (b) z-direction response
free vibration begins at 56.6s
(a)
(b)
free vibration begins at 56.6s
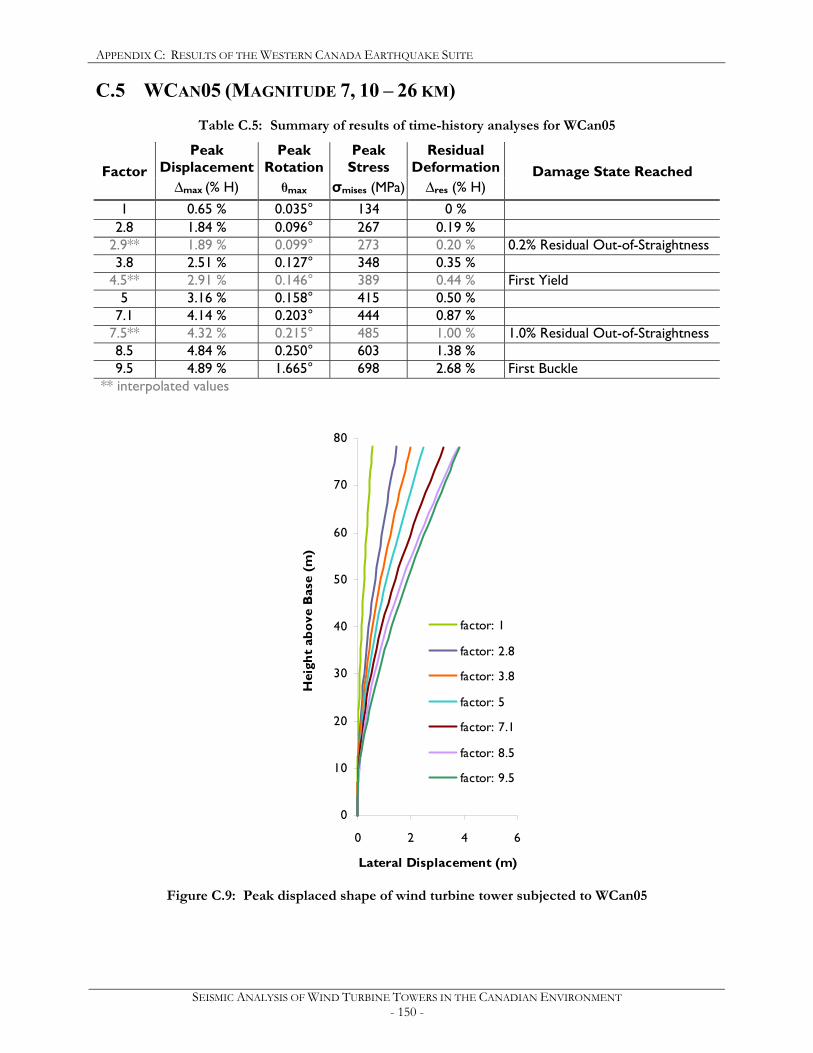
APPENDIX C: RESULTS OF THE WESTERN CANADA EARTHQUAKE SUITE
SEISMIC ANALYSIS OF WIND TURBINE TOWERS IN THE CANADIAN ENVIRONMENT - 150 -
C.5 WCAN05 (MAGNITUDE 7, 10 – 26 KM)
Table C.5: Summary of results of time-history analyses for WCan05
Peak Displacement
Peak Rotation
Peak Stress
Residual Deformation Factor
∆max (% H) θmax σmises (MPa) ∆res (% H) Damage State Reached
1 0.65 % 0.035° 134 0 %
2.8 1.84 % 0.096° 267 0.19 % 2.9** 1.89 % 0.099° 273 0.20 % 0.2% Residual Out-of-Straightness 3.8 2.51 % 0.127° 348 0.35 %
4.5** 2.91 % 0.146° 389 0.44 % First Yield 5 3.16 % 0.158° 415 0.50 %
7.1 4.14 % 0.203° 444 0.87 % 7.5** 4.32 % 0.215° 485 1.00 % 1.0% Residual Out-of-Straightness 8.5 4.84 % 0.250° 603 1.38 % 9.5 4.89 % 1.665° 698 2.68 % First Buckle
** interpolated values
0
10
20
30
40
50
60
70
80
0 2 4 6
Lateral Displacement (m)
Hei
ght
abov
e B
ase
(m)
factor: 1
factor: 2.8
factor: 3.8
factor: 5
factor: 7.1
factor: 8.5
factor: 9.5
Figure C.9: Peak displaced shape of wind turbine tower subjected to WCan05

APPENDIX C: RESULTS OF THE WESTERN CANADA EARTHQUAKE SUITE
SEISMIC ANALYSIS OF WIND TURBINE TOWERS IN THE CANADIAN ENVIRONMENT - 151 -
Figure C.10: Incremental time-history displacement response of
Vestas wind turbine tower subjected to WCan05 at hub height (80m) (a) x-direction response (b) z-direction response
free vibration begins at 55.1s
(a)
(b)
free vibration begins at 55.1s
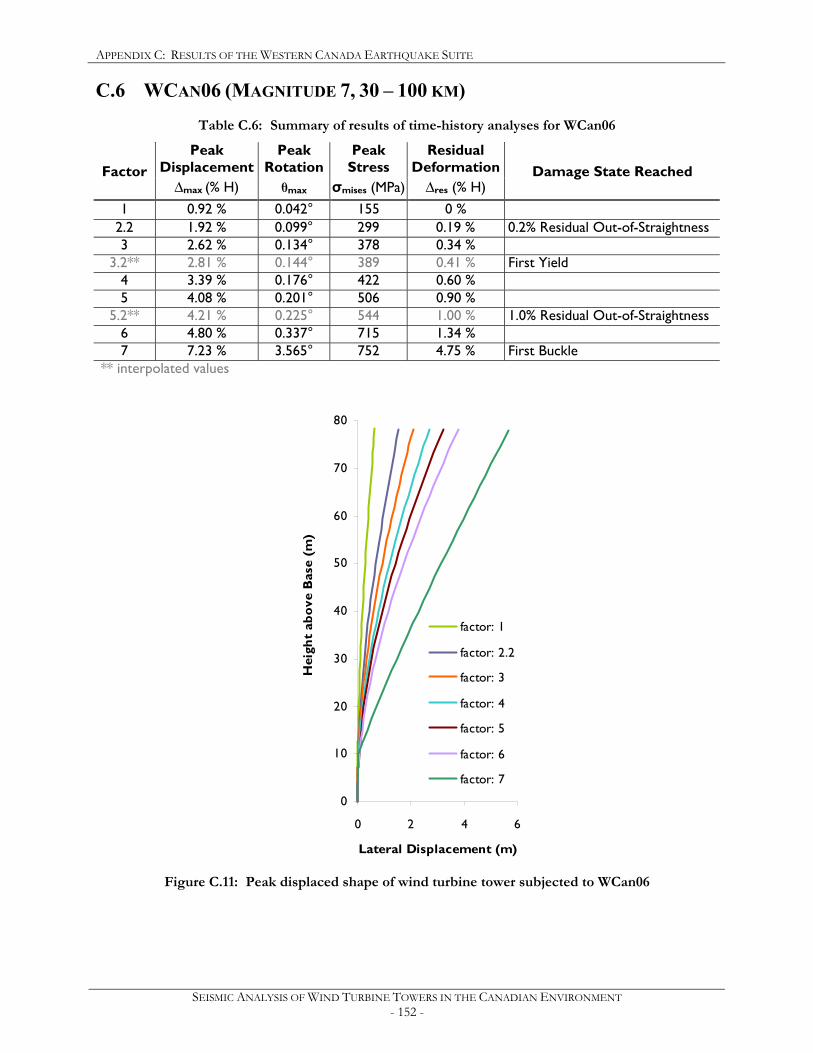
APPENDIX C: RESULTS OF THE WESTERN CANADA EARTHQUAKE SUITE
SEISMIC ANALYSIS OF WIND TURBINE TOWERS IN THE CANADIAN ENVIRONMENT - 152 -
C.6 WCAN06 (MAGNITUDE 7, 30 – 100 KM)
Table C.6: Summary of results of time-history analyses for WCan06
Peak Displacement
Peak Rotation
Peak Stress
Residual Deformation Factor
∆max (% H) θmax σmises (MPa) ∆res (% H) Damage State Reached
1 0.92 % 0.042° 155 0 %
2.2 1.92 % 0.099° 299 0.19 % 0.2% Residual Out-of-Straightness 3 2.62 % 0.134° 378 0.34 %
3.2** 2.81 % 0.144° 389 0.41 % First Yield 4 3.39 % 0.176° 422 0.60 % 5 4.08 % 0.201° 506 0.90 %
5.2** 4.21 % 0.225° 544 1.00 % 1.0% Residual Out-of-Straightness 6 4.80 % 0.337° 715 1.34 % 7 7.23 % 3.565° 752 4.75 % First Buckle
** interpolated values
0
10
20
30
40
50
60
70
80
0 2 4 6
Lateral Displacement (m)
Hei
ght
abov
e B
ase
(m)
factor: 1
factor: 2.2
factor: 3
factor: 4
factor: 5
factor: 6
factor: 7
Figure C.11: Peak displaced shape of wind turbine tower subjected to WCan06

APPENDIX C: RESULTS OF THE WESTERN CANADA EARTHQUAKE SUITE
SEISMIC ANALYSIS OF WIND TURBINE TOWERS IN THE CANADIAN ENVIRONMENT - 153 -
Figure C.12: Incremental time-history displacement response of
Vestas wind turbine tower subjected to WCan06 at hub height (80m) (a) x-direction response (b) z-direction response
free vibration begins at 44.26s
(a)
(b)
free vibration begins at 44.26s
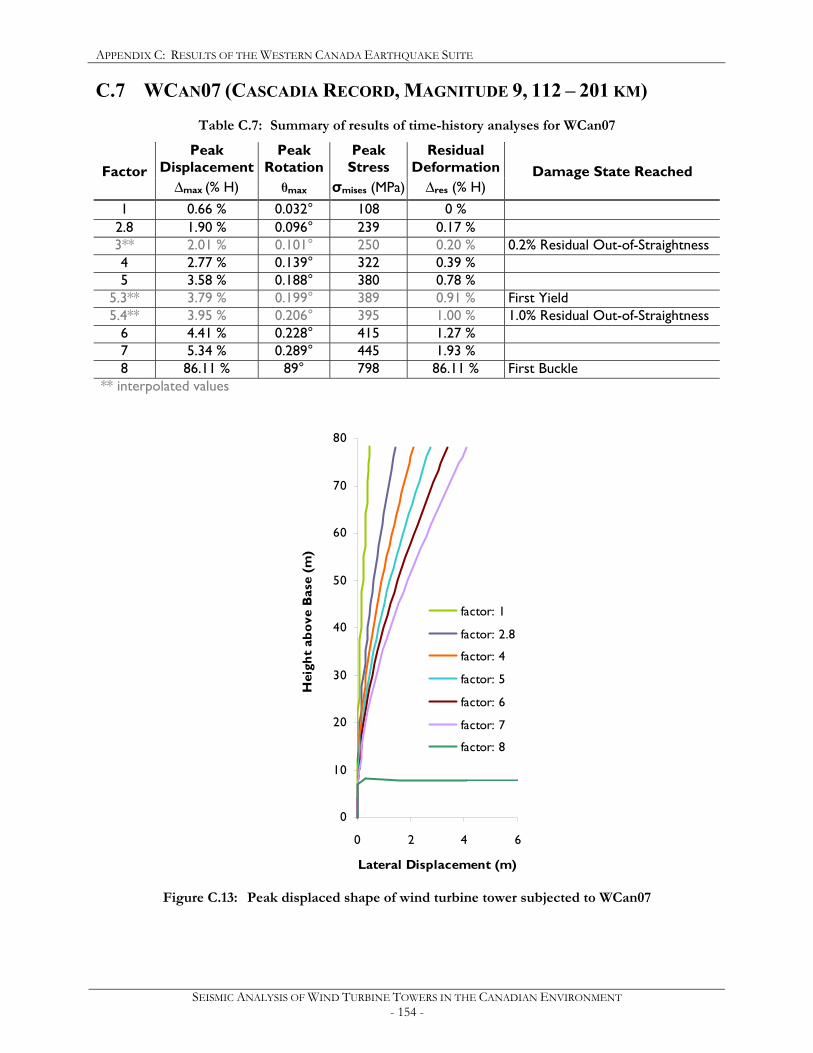
APPENDIX C: RESULTS OF THE WESTERN CANADA EARTHQUAKE SUITE
SEISMIC ANALYSIS OF WIND TURBINE TOWERS IN THE CANADIAN ENVIRONMENT - 154 -
C.7 WCAN07 (CASCADIA RECORD, MAGNITUDE 9, 112 – 201 KM)
Table C.7: Summary of results of time-history analyses for WCan07
Peak Displacement
Peak Rotation
Peak Stress
Residual Deformation Factor
∆max (% H) θmax σmises (MPa) ∆res (% H) Damage State Reached
1 0.66 % 0.032° 108 0 %
2.8 1.90 % 0.096° 239 0.17 % 3** 2.01 % 0.101° 250 0.20 % 0.2% Residual Out-of-Straightness 4 2.77 % 0.139° 322 0.39 % 5 3.58 % 0.188° 380 0.78 %
5.3** 3.79 % 0.199° 389 0.91 % First Yield 5.4** 3.95 % 0.206° 395 1.00 % 1.0% Residual Out-of-Straightness
6 4.41 % 0.228° 415 1.27 % 7 5.34 % 0.289° 445 1.93 % 8 86.11 % 89° 798 86.11 % First Buckle
** interpolated values
0
10
20
30
40
50
60
70
80
0 2 4 6
Lateral Displacement (m)
Hei
ght
abov
e B
ase
(m)
factor: 1
factor: 2.8
factor: 4
factor: 5
factor: 6
factor: 7
factor: 8
Figure C.13: Peak displaced shape of wind turbine tower subjected to WCan07
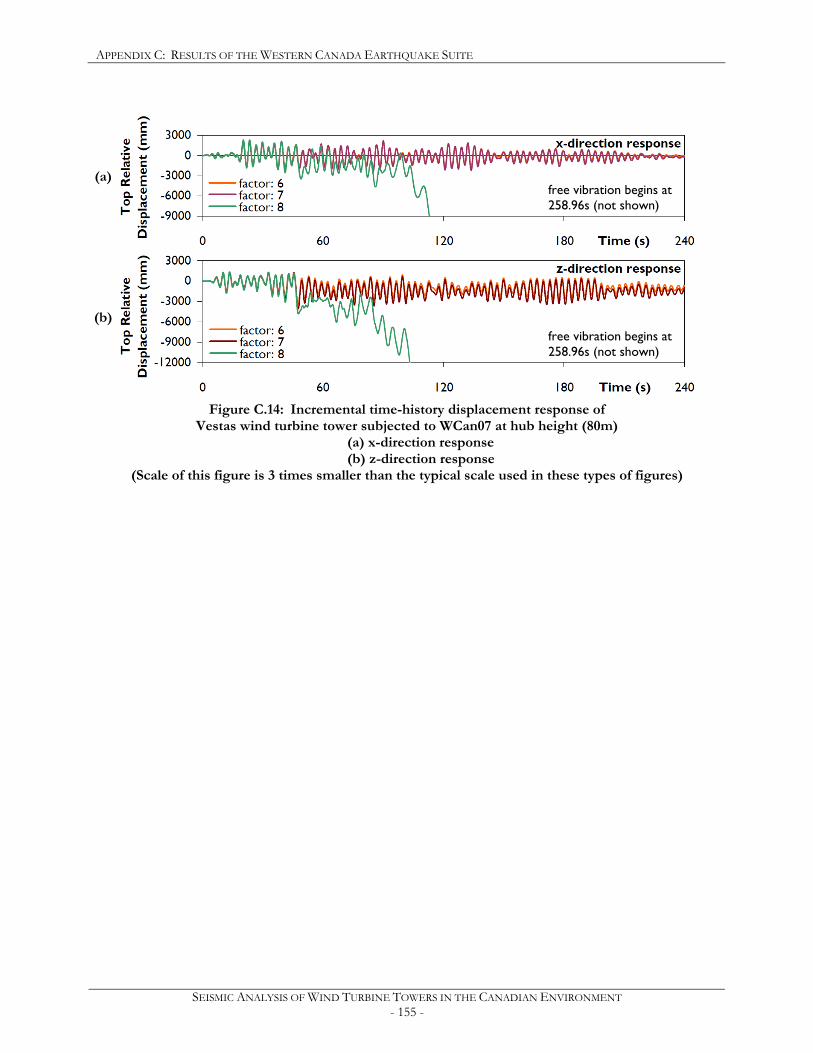
APPENDIX C: RESULTS OF THE WESTERN CANADA EARTHQUAKE SUITE
SEISMIC ANALYSIS OF WIND TURBINE TOWERS IN THE CANADIAN ENVIRONMENT - 155 -
Figure C.14: Incremental time-history displacement response of
Vestas wind turbine tower subjected to WCan07 at hub height (80m) (a) x-direction response (b) z-direction response
(Scale of this figure is 3 times smaller than the typical scale used in these types of figures)
free vibration begins at 258.96s (not shown)
(a)
(b) free vibration begins at 258.96s (not shown)
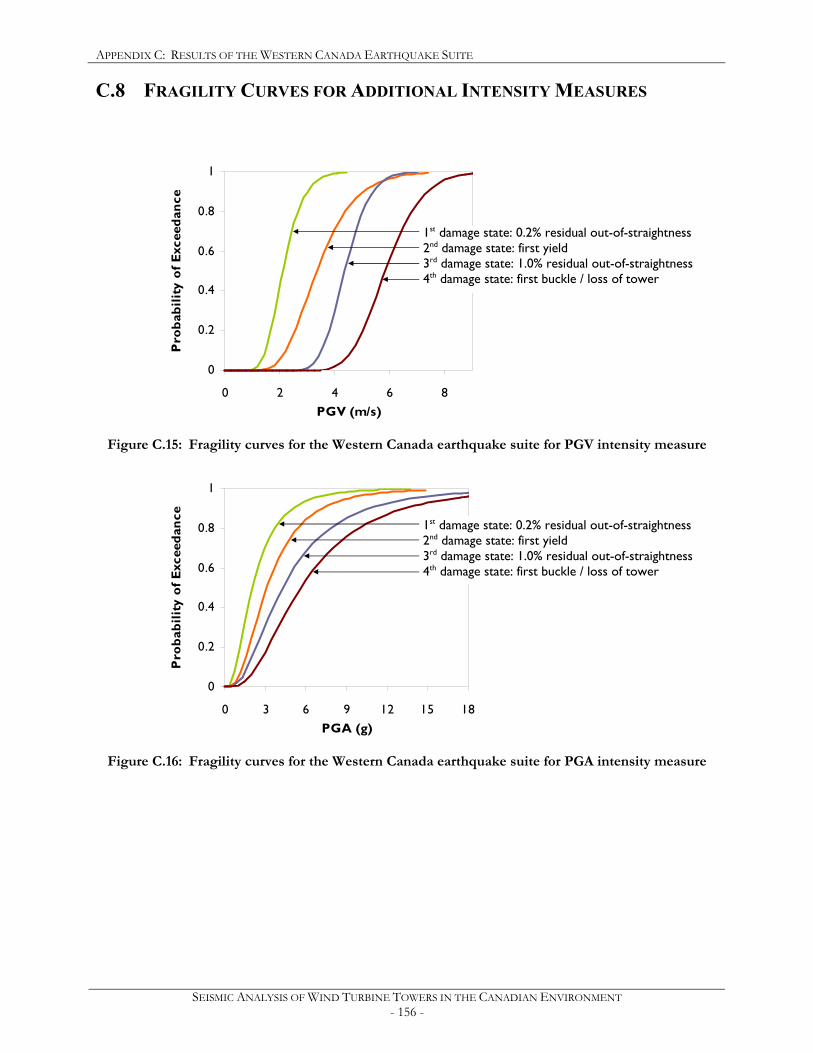
APPENDIX C: RESULTS OF THE WESTERN CANADA EARTHQUAKE SUITE
SEISMIC ANALYSIS OF WIND TURBINE TOWERS IN THE CANADIAN ENVIRONMENT - 156 -
C.8 FRAGILITY CURVES FOR ADDITIONAL INTENSITY MEASURES
0
0.2
0.4
0.6
0.8
1
0 2 4 6 8PGV (m/s)
Pro
babi
lity
of E
xcee
danc
e
Figure C.15: Fragility curves for the Western Canada earthquake suite for PGV intensity measure
0
0.2
0.4
0.6
0.8
1
0 3 6 9 12 15 18PGA (g)
Pro
babi
lity
of E
xcee
danc
e
Figure C.16: Fragility curves for the Western Canada earthquake suite for PGA intensity measure
1st damage state: 0.2% residual out-of-straightness 2nd damage state: first yield 3rd damage state: 1.0% residual out-of-straightness 4th damage state: first buckle / loss of tower
1st damage state: 0.2% residual out-of-straightness 2nd damage state: first yield 3rd damage state: 1.0% residual out-of-straightness 4th damage state: first buckle / loss of tower