Embed Size (px)
Citation preview

N A S A C O N T R A
R E P O R T C T O R
LOAN COPY: RETURN TO
KIRTLAND AFB, N 'MEX AFWL (WLlL-2)
SEISMIC EFFECTS OF SONIC BOOMS
by Tom T. Goforth and John A. McDonald
Prepared by .. .
TELEDYNE COMPANY Garland, Texas for Langley Research Center . . . - .
NATIONAL AERONAUTICS AND SPACE ADMINISTRATION WASHINGTON, D. C. SEPTEMBER 1968
https://ntrs.nasa.gov/search.jsp?R=19680025679 2020-04-22T04:24:55+00:00Z

. . - . - . . ._ - - TECH LIBRARY KAFB, NM
0060343 NASA CR-1137
/./
SEISMIC EFFECTS OF SONIC BOOMS
By Tom T. Goforth and John A. '.McDonald. /"-
&" "
....-
Distribution of this report is provided in the interest of information exchange. Responsibility for the contents resides in the author or organization that prepared it.
P r e p a r e w d e r Contract No. NAS 1-6342 by
Garland, Texas
for Langley Research Center
NATIONAL AERONAUTICS AND SPACE ADMINISTRATION
TELEDYNE C Q V
For sale by the Clearinghouse for Federal Scientific and Technical Information Springfield, Virginia 22151 - CFSTl price $3.00
I

ABSTRACT
E a r t h p a r t i c l e v e l o c i t i e s p r o d u c e d by son ic booms were recorded a t Edwards A i r Force Base, Cal i fornia , the Tonto Forest Seismological Observatory near Payson, Arizona, and the Uinta Basin Seismological Observatory near Verna l , Utah . Analys is o f the f ie ld da ta ind ica tes tha t the se i smic e f fec ts o f son ic booms a r e l a r g e l y c o n f i n e d , l a t e r a l l y , t o t h e boom pressure envelope and v e r t i c a l l y t o t h e u p p e r few meters of t h e e a r t h ' s s u r f a c e . The maximum p a r t i c l e v e l o c i t y a s s o c i a t e d w i t h a son ic boom i s i n r e s p o n s e t o t h e r a p i d pressure changes o f the l ead ing and t ra i l ing edges o f t h e a c o u s t i c N-wave. Comparison of peak p a r t i c l e v e l o c i t i e s r e c o r d e d a t Edwards A i r Force Base show good ag reemen t w i th t heo re t i ca l ly -p red ic t ed va lues . Empi r i ca l r e l a t ions deve loped f rom the recorded da ta ind ica te tha t peak par t ic le ve loc i ty i s l i n e a r l y r e l a t e d t o t h e maximum pos i t i ve ove rp res su re o f t he N-wave. On hard, wel l -consol idated rock, each pound pe r squa re foo t o f overpressure produces about 75 microns per second peak par t ic le ve loc i ty . On more loose ly- consol idated rock, each pound per square foot of overpressure produces about 100 microns per second peak par t ic le ve loc i ty .
ii

CONTENTS
Page - ABSTRACT
1. INTRODUCTION 1.1 Summary of the experiments 1.2 Generation of the sonic boom
1 1 1
2. FIELD EXPERIMENTS 3 2.1 General 3 2.,2 Instrumentation 3 2.3 Data acquisition at Edwards Air Force Base 4 2.4 Data acquisition at the Tonto Forest Seismological Observatory 5 2.5 Data acquisition at the Uinta Basin Seismological Observatory 6 2.6 Data acquisition for comparative experiments 7 2.7 Effect of pressure variations on the seismometer 7
3. GEOLOGIC PARAMETERS OF THE TEST AREAS 3.1 Topography, geology, and seismic velocities
3.1.1 Edwards Air Force Base 3.1.2 Tonto Forest Seismological Observatory 3.1.3 Uinta Basin Seismological Observatory
3.2 Determination of geologic parameters
4. ANALYSIS AND INTERPRETATION OF EXPERIMENTAL DATA 4.1 General 4.2 Experimental data provided by NASA for the seismic effects
4.3 Methods of measurement and classification of seismograms 4.4 Seismogram characteristics 4.5 Effects of flight conditions, geological location, and
program
weather on the seismic signature and on peak particle velocities
4.5.1 Effect of seismometer location on the seismic
4.5.2 Effect of aircraft type on the seismic signature 4.5.3 Effect of seismometer location and aircraft type
4.5.4 Effect of aircraft altitude on peak particle velocity 4.5.5 Effect of aircraft speed on peak particle velocity 4.5.6 Effect of meteorological conditions on peak
signature
on peak particle velocity
particle velocity 4.6 Focusing 4.7 Attenuation of ground particle velocity with depth 4.8 Comparison of seismograms resulting from culturally-
produced noise and seismograms resulting from sonic booms
8 8 8 9 9 10
14 14 14
14 15 16
16
16 16
17 17 18
18 18 19
iii

CONTENTS. Continued
Page
4.9 Frequency spectra of velocity seismograms 19 4.10 Propagation of seismic ene rgy ou t s ide t he boom pres su re 20
4.11 Comparison of maximum p a r t i c l e v e l o c i t i e s w i t h damage 20 enve 1 ope
c r i t e r i a
5. THEORETICAL STUDIES 2 1 5.1 General 2 1 5 .2 Veloc i ty coupl ing 2 1 5 .3 Predict ion of seismograms and maximum p a r t i c l e v e l o c i t i e s 23
5.3.1 Discussion 23 5.3.2 Assumptions 24 5.3.3 Deformation of a ha l f - space 24
6. COMPARISON OF FIELD RECORDINGS AND THEORETICALLY-PREDICTED VALUES 27
7. CONCLUSIONS 29
8. RECOMMENDATIONS 30
9. ACKNOWLEDGEMENTS 31
APPENDIX A - Miss ions moni tored in the se i smic e f fec ts s tudy 33
APPENDIX B - Deformation of an e las t ic half-space 41
REFERENCES 51
ILLUSTRATIONS
i v

I ILLUSTRATIONS
Figure - Page
1 Ver.tica1 section showing the sonic boom shock wave interacting with the ground
53
2 Locations of the test areas used for the study of the 54 seismic effects of sonic booms
3 Block diagram of one seismograph of the mobile .equipment 55
4 Map of the Edwards Air Force Base test area showing the 56 planned aircraft flight tracks, seismometer locations, and the associated microphone locations
5 Relative positions of the seismometers used in the sonic 57 boom study at Edwards Air Force Base
6 Locations of the seismometers used in the sonic boom seismic 58 measurements program at the Tonto Forest Seismological Ob s ervat ory
7
8
9
10
11
12
13
14
Locations of the seismometers used in the sonic boom seismic 59 measurements program at the Uinta Basin Seismological Observatory
Hypothetical cross-section of the Uinta Uplift and Unita 60 Basin
Typical explosion refraction-survey record 61
Ray paths of least time and the time-distance curve f o r two 62 layers separated by a horizontal interface
Time-distance curve f o r the seismic refraction survey at 6 3 Edwards Air Force Base
Hypothetical seismogram showing characteristic phases measured in the sonic boom study
Schematic diagrams of the ten typical types of bow and stern velocity seismograms
Seismogram recorded by a seismometer located on well- consolidated rock bosition 5) at Edwards Air Force Base for a B-58 overflight
64
65
66

ILLUSTRATIONS, Continued
Figure
15
16
17
18
19
20
2 1
22
23
24
Seismogram recorded by a seismometer buried i n t h e c l a y lake bed {posit ion 1) at . .Edwards A i r Force Base f o r a n XB-70 o v e r f l i g h t
Seismogram recorded by a se i smomete r bu r i ed i n Zhe c l ay l ake bed (pos i t i on 4) a t Edwards A i r Force Base f o r an F-104 o v e r f l i g h t
Seismograms recorded from similar B-58 o v e r f l i g h t s showing s e i s m i c s i g n a t u r e s a t the Tonto Forest and Uinta Basin obse rva to r i e s
High s e n s i t i v i t y seismograms from a three-component seismograph a t Edwards A i r Force Base (pos i t i on 1 ) showing a p r e c u r s o r t o t h e a r r i v a l o f t h e N-wave
Typical three-component seismogram generated by the over- f l i g h t o f a B-58 a i rc raf t a t Edwards A i r Force Base
Seismograms and similar p res su re s igna tu res r eco rded a t f i v e l o c a t i o n s f o r B-58 o v e r f l i g h t s showing t h e var ia t ions o f the se i smograms wi th geologica l environment’
Seismograms produced by the overflights of fou r d i f f e r e n t types o f a i r c r a f t r e c o r d e d by a seismometer on wel l - consol idated rock (posi t ion 5) a t Edwards Air Force Base
Seismograms produced by the overfl ights of four different types o f a i r c r a f t r e c o r d e d by a seismometer on a c l ay lake bed (pos i t ion 1 ) a t Edwards A i r Force Base
Rela t ion of maximum overpressure f o r B-58 o v e r f l i g h t s t o peak p a r t i c l e v e l o c i t y o b s e r v e d on a ver t ica l se i smograph loca ted on a c l ay lake bed (pos i t ion 1 ) a t Edwards A i r Force Base
Rela t ion of maximum o v e r p r e s s u r e f o r F-104 o v e r f l i g h t s t o peak p a r t i c l e v e l o c i t y o b s e r v e d on a ve r t i ca l seismograph loca ted on a c l ay lake bed (pos i t ion 1 ) a t Edwards A i r Force Base
Page
67
68
69
70
71
72
73
74
75
76
v i

ILLUSTRATIONS, Continued
Figure
25
26
27
28
29
30
31
32
33
Relation of maximum overpressure for SR-71 overflights to peak particle velocity observed on a vertical seismograph located on a clay lake bed (position 1) at Edwards Air Force Base
Relation of maximum overpressure for XB-70 overflights to peak particle velocity observed on a vertical seismograph located on a clay lake bed (position 1) at Edwards Air Force Base
Relation of maximum overpressure for B-58 overflights to peak particle velocity observed on a vertical seismograph located on a clay lake bed (position 4) at Edwards Air Force Base
Relation of maximum overpressure for F-104 overflights to peak particle velocity observed on a vertical seismograph located on a clay lake bed (position 4) at Edwards Air Force Base
Relation of maximum overpressure for SR-71 overflights to peak particle velocity observed on a vertical seismograph located on a clay lake bed (position 4) at Edwards Air Force Base
Page
77
-
78
79
80
81
Relation of maximum overpressure for B-58 overflights to 82 peak particle velocity observed on a verticle seismograph located on a well-consolidated rock outcrop (position 5) at Edwards Air Force Base
Relation of maximum overpressure for F-104 overflights to 83 peak particle velocity observed on a vertical seismograph located on a well-consolidated rock outcrop (position 5) at Edwards Air Force Base
Relation of maximum overpressure for SR-71 overflights to 84 peak particle velocity observed on a vertical seismograph located on a well-consolidated rock outcrop (position 5 ) at Edwards Air Force Base
Relation of maximum overpressure for XB-70 overflights to 85 peak particle velocity observed on a vertical seismograph located on a well-consolidated rock outcrop (position 5) at Edwards Air Force Base
vii

ILLUSTRATIONS.. Continued
Figure
34
35
36
37
38
39
40
41
Rela t ion of maximum o v e r p r e s s u r e f o r B-58 o v e r f l i g h t s t o p e a k p a r t i c l e v e l o c i t y o b s e r v e d on a seismograph o r i e n t e d r a d i a l t o t h e f l i g h t t r a c k and located on a c l ay l ake bed (pos i t i on 1 ) a t Edwards A i r Force Base
Rela t ion of maximum o v e r p r e s s u r e f o r B-58 o v e r f l i g h t s t o peak p a r t i c l e v e l o c i t y o b s e r v e d on a seismograph o r i e n t e d t r a n s v e r s e t o t h e f l i g h t track and loca ted on a c lay l ake bed (pos i t ion 1 ) a t Edwards A i r Force Base
Rela t ion of maximum o v e r p r e s s u r e f o r F-104 o v e r f l i g h t s t o peak p a r t i c l e v e l o c i t y o b s e r v e d on a seismograph o r i e n t e d r a d i a l t o t h e f l i g h t t r a c k and loca ted on a c l ay l ake bed (pos i t i on 1) a t Edwards A i r Force Base
Re la t ion o f maximum o v e r p r e s s u r e f o r F-104 o v e r f l i g h t s t o peak pa r t i c l e ve loc i ty obse rved on a seismograph o r i e n t e d t r a n s v e r s e t o t h e f l i g h t t r a c k and located on a c l ay lake bed (pos i t ion 1 ) a t Edwards A i r Force Base
Rela t ion of maximum o v e r p r e s s u r e f o r XB-70 o v e r f l i g h t s t o peak p a r t i c l e v e l o c i t y o b s e r v e d on a seismograph o r c e n t e d r a d i a l t o t h e f l i g h t t r a c k and loca ted on a c l ay lake bed (pos i t ion 1 ) a t Edwards A i r Force Base
Rela t ion of maximum o v e r p r e s s u r e f o r XB-70 o v e r f l i g h t s t o peak pa r t i c l e ve loc i ty obse rved on a seismograph o r i e n t e d t r a n s v e r s e t o t h e f l i g h t t r a c k and loca ted on a c lay l ake bed (pos i t ion 1) a t Edwards A i r Force Base
Rela t ion of maximum overpressure f o r B-58 o v e r f l i g h t s t o peak p a r t i c l e v e l o c i t y on ver t ica l se i smographs a t t h e Tonto Forest Seismological Observatory
Rela t ion of maximum o v e r p r e s s u r e f o r B-58 o v e r f l i g h t s t o p a r t i c l e v e l o c i t y on ver t ica l se i smographs a t the Tonto Forest Seismological Observatory and the Uinta Basin Seismological Observatory
42 Rela t ion of a l t i t u d e t o peak p a r t i c l e v e l o c i t y f o r t h e B-58 and F-104 f o r s u p e r s o n i c o v e r f l i g h t s
43 Seismograms showing the a t tenuat ion with depth of the ground p a r t i c l e v e l o c i t y
Page
86
87
88
89
90
91
92
93
94
95
v i i i

ILLUSTRATIONS. Continued
Figure
44 Maximum p a r t i c l e v e l o c i t i e s and assoc ia ted f requencies o f var ious types of c u l t u r a l n o i s e and s e l e c t e d s o n i c booms
45 Three-component seismograms recorded f o r a man walking near seismometers located on t h e c l a y lake bed (pos i t ion 1 ) a t Edwards A i r Force Base
46 Three-component seismograms recorded f o r t h e t a k e - o f f o f an F-104 a i rcraf t two miles from seismometers on the c l ay lake bed (pos i t ion 1 ) a t Edwards A i r Force Base
47 Power spectrum of a seismogram recorded a t p o s i t i o n 4 on t h e lake bed a t Edwards A i r Force Base. The source o f t he d is turbance was an F-104 f l y i n g a t 20,000 feet and Mach 1 .4
48 Power spectrum of a seismogram recorded a t p o s i t i o n 4 on the l ake bed a t Edwards A i r Force Base. The source of d i s turbance was a B-58 f l y i n g a t 40,000 f e e t a t Mach 1.65
49
50
51
52
5 3
Power spectrum of a seismogram recorded a t p o s i t i o n 4 on t h e lake bed a t Edwards A i r Force Base. The source o f t he d is turbance was an XB-70 f l y i n g a t 60,000 feet a t Mach 1 .8
Power spectrum of a seismogram recorded a t p o s i t i o n 1 on the l ake bed a t Edwards A i r Force Base. The source of t he d i s tu rbance was an XB-70 f l y i n g a t 60,000 f e e t a t Mach 1.8
Power spectrum of a seismogram recorded a t p o s i t i o n 4 on t h e lake bed a t Edwards A i r Force Base. The source o f t h e d is turbance was an XB-70 f l y i n g a t 60,000 f e e t and Mach 1 . 8
Power spectrum of a seismogram recorded a t p o s i t i o n 5 a t Edwards A i r Force Base. The source o f the d i s turbance was an XB- 70 f l y i n g a t 60,000 feet and Mach 1 . 8
Sonic boom se ismic s igna tures for miss ion 13-2 (XB-70) recorded a t t h r e e d i f f e r e n t p o s i t i o n s a t Edwards A i r Force Base
Page
96
97
98
99
100
1 0 1
102
103
104
105
ix

ILLUSTFUTSONS, Continued
Figure
54 Theore t ica l Rayle igh wave d i spe r s ion cu rves fo r t he d ry l ake area a t Edwards A i r Force Base and t h e e m p i r i c a l r e l a t i o n - ship between a i rcraf t v e l o c i t y and the dominant periods observed on the seismograms
55
56
57
58
59
60
Comparison o f maximum . p a r t i c l e v e l o c i t i e s o b s e r v e d and t h e o r e t i c a l l y p r e d i c t e d f o r t h e lake bed a t Edwards A i r Force Base, as a func t ion of maximum overpressure
Comparison o f t h e t h e o r e t i c a l and the recorded seismograms on the lake bed a t Edwards Air Force Base f o r m i s s i o n 1-1
Comparison o f t h e t h e o r e t i c a l and the recorded seismograms on the l ake bed a t Edwards A i r Force Base f o r mission 75- 1
Comparison o f t h e t h e o r e t i c a l and the recorded seismograms on the l ake bed a t Edwards A i r Force Base f o r m i s s i o n 86- 1
Comparison o f the theoretical and the recorded seismogram on the l ake bed a t Edwards A i r Force Base for mission 85-1
Comparison o f t he t heo re t i ca l and t he r eco rded seismogram on t h e l a k e b e d a t Edwards A i r Force Base fo r mi s s ion 117-1
61 Comparison o f the theoretical and the recorded seismogram on the l ake bed a t Edwards A i r Force Base f o r m i s s i o n 79- 1
62 Comparison o f t h e t h e o r e t i c a l and the recorded seismogram on t h e lake bed a t Edwards A i r Force Base f o r mission 1 2 2 - 1
63 Comparison o f t h e t h e o r e t i c a l and the r eco rded seismogram on t h e lake bed a t Edwards Air Force Base f o r mission 117-2
Page
106
107
108
109
110
111
112
113
114
115
X

ILLUSTRATIONS. Continued
Page
116
- Figure
64 Comparison o f t h e t h e o r e t i c a l and the r eco rded seismogram on the l ake bed a t Edwards A i r Force Base fo r mi s s ion 61-1
65 Comparison o f t he t heo re t i ca l and t he r eco rded seismogram a t pos i t i on 67 a t the Tonto Forest Seismological Observatory for mission Tonto 2
117
xi
TABLES
Table
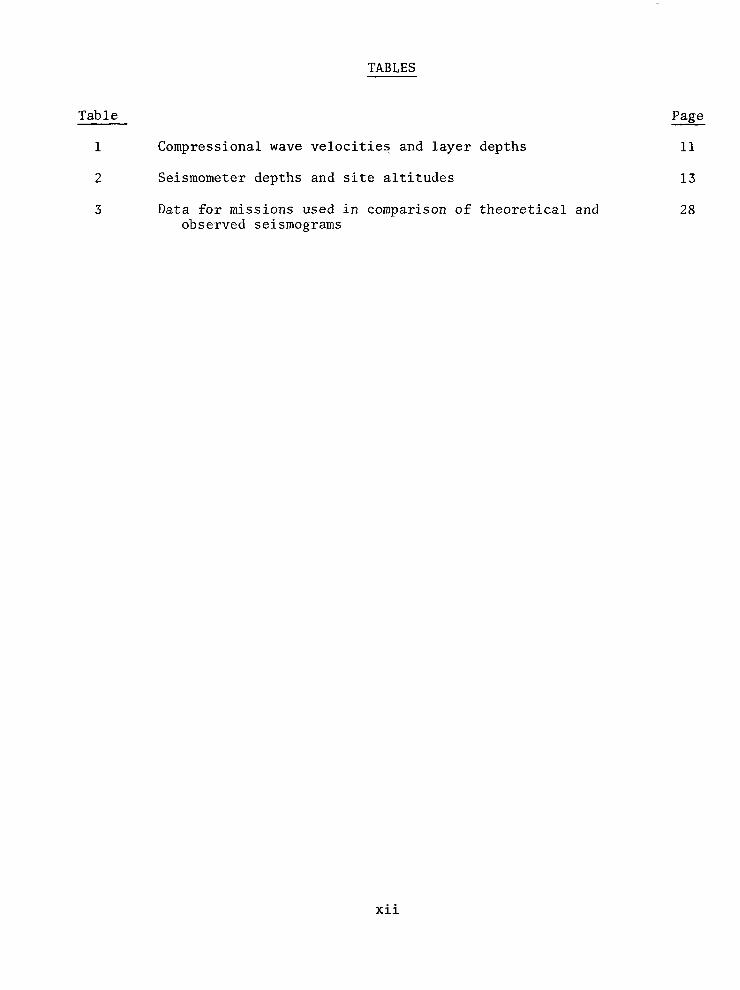
1 Compressional wave velocities and layer depths
2 Seismometer depths and site altitudes
3 Data for missions used in comparison of theoretical and observed seismograms
Page
11
13
28
-
xii

"
SEISMIC EFFECTS OF SONIC BOOMS
By Tom T. Goforth and John A. McDonald Teledyne Industries, Geotech Division
1. INTRODUCTION
This i s a r epor t o f t he expe r imen ta l and t h e o r e t i c a l work accomplished under Contract NAS 1-6342, entered into on 2 8 June 1966, and Modification 2 t o t h e c o n t r a c t , d a t e d 2 3 May 1967. The o v e r a l l p e r i o d o f t h e c o n t r a c t , i nc lud ing t he mod i f i ca t ion , was from 1 J u l y 1966 t o 30 September 1967.
The c o n t r a c t was f o r a r e sea rch s tudy o f t he s e i smic e f f ec t s o f son ic booms. The ob jec t ive o f t he s tudy was t o measure and i n t e r p r e t t h e v i b r a t i o n s of the ground produced by son ic booms.
1.1 SUMMARY OF THE EXPERIMENTS
Fie ld measurements o f ear th par t ic le ve loc i t ies p roduced by son ic booms were made a t Edwards A i r Force Base (EAFB), C a l i f o r n i a , t h e Tonto Forest Seismological Observatory (TFSO) located near Payson, Arizona, and the Uinta Basin Seismological Observatory (UBSO) located near Vernal , Utah. Portable seismograph systems were used f o r t h e measurements a t EAFB. A t TFSO and UBSO, modi f ied observa tory se i smograph sys tems were u t i l i zed in addi t ion to the por tab le sys tems. Geologic s tud ies , inc luding se i smic re f rac t ion surveys , were conducted a t e a c h o f t h e t h r e e t e s t s i t e s . The p a r t i c l e v e l o c i t y d a t a were ana lyzed v i sua l ly and au tomat ica l ly , and the resu l t s were co r re l a t ed w i th t h e g e o l o g i c d a t a and with NASA-furnished ove rp res su re , f l i gh t pa rame te r , and meteorological data . Theoret ical es t imat ion techniques were developed to p r e d i c t maximum p a r t i c l e v e l o c i t i e s t o b e e x p e c t e d f o r t h e p a s s a g e of a known N-wave a t a p a r t i c u l a r g e o l o g i c a l l o c a t i o n .
1 . 2 GENERATION OF THE SONIC BOOM
Sonic booms are caused by a conical shock wave doublet (N-wave) o r i e n t e d as shown i n f i g u r e 1. For s impl ic i ty , on ly the in i t ia l compress iona l shock f r o n t i s shown. The boom is generated by a sudden compression of a i r by t h e bow o f t h e moving aircraft . A rarefact ion immediately fol lows and cont inues u n t i l a f ina l recompress ion , assoc ia ted wi th the t a i l o f t he a i rc raf t , con- c ludes t he N-wave. Each ha l f o f the shock wave doublet produces a r e l a t i v e p r e s s u r e v a r i a t i o n (AP/P) a t l a rge r ay d i s t ances R given (Ferr i , 1961) approx ima te ly fo r s t eady , l eve l f l i gh t by
I

AP M5/2 F ( S ) "" -
P M 2 - 1 2 R
where M = speed of a i rcraf t speed of sound in a i r
and F ( < ) depends upon t h e s i ze a n d c o n f i g u r a t i o n o f t h e a i r c r a f t .
The cone de f in ing t he f ron t of t he p re s su re wave d o u b l e t i n t e r s e c t s a f l a t e a r t h ' s s u r f a c e i n a hyperbol ic trace. The in t e r sec t ion o f each p re s su re wave wi th a point on the ground exer ts a f o r c e on t h e p o i n t d i r e c t e d i n t o t h e ground a t a n a n g l e t o t h e v e r t i c a l e q u a l t o t h e Mach angle ( p ) . The f o r c e may be r e so lved i n to ve r t i ca l and ho r i zon ta l components shown i n f i g u r e 1. The ho r i zon ta l components w i l l couple seismic energy into the ground where t h e sur face i s rough o r h a s t o p o g r a p h i c i r r e g u l a r i t i e s . The v e r t i c a l component o f t he fo rce c r ea t e s a hyperbol ic arc o f e l a s t i c d e p r e s s i o n i n t h e g r o u n d , which moves forward wi th the speed of the a i r c ra f t .
Th i s s tudy i nves t iga t e s t he r e su l t i ng seismic e f f e c t s o f t h i s impingement of t h e boom on the ground.
2

2 . FIELD EXPERIMENTS
2 . 1 GENERAL
Seismic'measurements of sonic booms were made a t EAFB, TFSO, and UBSO; t h e l o c a t i o n s o f t h e t h r e e t e s t si tes are shown i n f i g u r e 2 . The g r e a t majority of the measurements were made a t EAFB-where 183 separate missions were monitored. Measurements were made o f 8 missions a t TFSO and of 3 missions at UBSO i n o r d e r t o o b t a i n d a t a from di f fe ren t geologic envi ronments and to u t i l i z e t h e s e i s m o m e t e r a r r a y s a t the obse rva to r i e s fo r focus ing , l a te ra l propagat ion , and depth a t tenuat ion s tud ies .
2 . 2 INSTRUMENTATION
The mobile equipment consisted of f ive identical seismograph systems, each of which could be used to measure e i ther hor izonta l o r ver t ica l g round p a r t i c l e v e l o c i t i e s . A block diagram of one of the seismograph systems is shown i n f i g u r e 3. Each seismograph consisted of a Seismometer, Model 18300; an Amplifier and Signal Conditioner, Model 25031; a Visicorder Osci l lograph, Honeywell Model 1406; a Magnetic-Tape Recorder, Model 17373; and the associated power s u p p l i e s and cabling. This equipment provided for the simultaneous record ing of se i smic da ta on both paper records and on frequency-modulated magnet ic tape. The t ape r eco rde r had a g r e a t e r dynamic range than the visual recorder and was used as the primary recording system, although the paper records provided a usefu l v i sua l moni tor . Also , dur ing ana lys i s o f the sonic boom seismograms the paper records p rovided a useful check on the accuracy of t he da t a p l ayed back from the magnetic-tape seismograms.
The magnetic-tape seismograms were recorded on half- inch, 7-channel tape which cons i s t ed o f 5 channels o f se i smic da ta , 1 channel of t iming data, and 1 wow-and-flutter compensation channel. The tape speed was 15/16 inches per second. Commonly, 5 channels of seismic data and 1 channel o f t iming da ta were recorded on the Visicorder , and intermediate t iming l ines for the visual records were provided by a b u i l t - i n t i m e r . The National Bureau of Standards Radio S t a t i o n , WWV, Fort Col l ins , Colorado, was recorded on the magnetic t ape as a t ime base.
Cal ibrat ion of the seismograph systems was accomplished by a Ca l ib ra t ion Control , Model 20136. This uni t produced a s i n e wave o f known bu t va r i ab le amplitude a t a frequency of 5 Hz. The s i n e wave was u s e d t o d r i v e t h e seis- mometer c o i l s a t known equivalent ground veloci t ies . In general , the seismo- graph systems were calibrated twice d a i l y on those da t e s upon which seismic d a t a were recorded.
The velocity response of each seismograph system was f l a t i n t h e frequency range of 1 t o 100 Hz wi th in '1 dB. Because both the data and c a l i b r a t i o n s i g n a l s were transmitted between the recording van and the seis- mometer over a s ing le fou r -conduc to r cab le , ca l ib ra t ion cu r ren t s a t f requencies above about 30 Hz showed cross ta lk be tween the da ta and ca l ibra t ion l ines .
3

Therefore , f requency response cal ibrat ions were made by i n j e c t i n g t h e h i g h - f r equency ca l ib ra t ion cu r ren t s d i r ec t ly i n to t he sys t em a t the seismometer. The frequency response of each seismograph was measured soon a f t e r t h e i n s t a l - la t ion of each seismometer . Also, a t least one addi t iona l f requency response c a l i b r a t i o n was made a t each loca t ion .
S i x v e r t i c a l , s h o r t - p e r i o d s e i s m o m e t e r s i n t h e TFSO ar ray and th ree ve r t i ca l , sho r t -pe r iod s e i smomete r s i n t he UBSO a r r a y were u s e d f o r t h e observatory experiments. These systems were modified to produce an output p r o p o r t i o n a l t o g r o u n d p a r t i c l e v e l o c i t i e s . The systems consisted of Johnson- Matheson Seismometers, Model 6480, feeding Solid-state Amplifiers, Geotech Model 25220. The d a t a were recorded on a l-inch, 14-channel magnetic tape a t a speed of 0 . 6 inches per second by a Tape Recorder, Minneapolis Honeywell, Model LAR 7460. The frequency responses of the modified seismograph systems were a l s o f l a t from 1 t o 100 Hz .
2 .3 DATA ACQUISITION AT EDWARDS A I R FORCE BASE
The major par t o f the da ta was c o l l e c t e d a t EAFB i n t h e p e r i o d from October 1966 t o J a n u a r y 1967. Geotech was one of severa l cont rac tors o f the USAF and of NASA involved in the experiments a t EAFB, and the missions were flown, i n g e n e r a l , t o meet o the r con t r ac tu ra l r equ i r emen t s .
Missions were f lown in f ive general pat terns a t EAFB:
a . F l i g h t s on a 245" magnetic heading over, and a t s p e c i f i e d off-set d is tances f rom, an experimental house designated E2 ( s e e f i g u r e 4 ) .
b . F l igh t s ove r an 8000 f t array of microphones on East Dry Lake ( see f i gu re 4 ) . No seismometers were located on t h i s lake bed.
c . F l igh ts over South Base ( s e e f i g u r e 4 ) . A t t imes, both a seismometer and pressure gauges were located on th i s l ake bed , p rov id ing a l a t e ra l s epa ra t ion o f be tween 2 and 3 miles f rom the locat ion of the other seismometers.
d. Data from more than 30 missions flown by SR-71 a i r c r a f t were recorded. These data were used to augment t h e o t h e r s o n i c boom d a t a whenever adequate f l igh t parameter da ta were a v a i l a b l e .
e . Numerous subsonic low l eve l f l i gh t s p roduc ing eng ine no i se r a the r t han son ic booms. These were flown as p a r t o f a psycho-physiological study being made by Stanford Research Inst i tute and were recorded a t t h e request of NASA. Some o f t hese da t a were used i n comparisons of ground motions generated by s o n i c booms and those generated by var ious forms of cul tural noise ( see s ec t ion 4 .8 ) .
A c o m p l e t e l i s t i n g o f t h o s e f l i g h t s from which seismic data were recorded a t EAFB i s g iven in appendix A.
4

The loca t ions o f the four se i smometer pos i t ions occupied a t EAFB are shown i n f i g u r e 5 i n r e l a t i o n t o t h e most f r e q u e n t l y u s e d f l i g h t trace over E2 . These p o s i t i o n s were designated 1, 4, 4R, and 5 . Pos i t ions 1 and 4 co r re spond t o microphone posit ions 1 and 31 i n a c ros sed l i nea r a r r ay o f mic rophones i n s t a l l ed by NASA on t h e small lake bed t o t h e west of Rogers Dry Lake. Seismometer posi- t i o n 5 co r re sponds t o t he most easter ly microphone in a small c r u c i f o r m j u s t t o t h e n o r t h of E2. Pos i t i on 4R was chosen to be remote from the remaining seismometers.
Pos i t i ons 1 and 5 were t h e "permanent" seismometer locations a t EAFB; a ver t ica l seismometer was loca ted a t each pos i t i on , and d a t a were recorded from them for every mission monitored. Two horizontal se ismometers were a l s o l o c a t e d a t p o s i t i o n 1, one measuring ground p a r t i c l e v e l o c i t i e s a l o n g t h e f l i g h t p a t h (245O) and t h e o t h e r o r i e n t e d p e r p e n d i c u l a r t o t h e f l i g h t p a t h . The t h r e e seis- mometers were b u r i e d t o a depth of about 1 m e t e r i n t h e l a k e bed material.
The seismometer a t p o s i t i o n 5 r e s t e d on a quartz monzonite basement which a t t h i s p o i n t was within about 2 meters o f the sur face .
The se i smometer a t pos i t ion 4, p o s i t i o n 31 i n t h e l a k e bed c rossed - l inea r mic rophone a r r ay , measu red on ly ve r t i ca l pa r t i c l e ve loc i t i e s . I t was bur ied t o a depth of about 1 m e t e r i n t h e l a y e r of playa c lay over the quartz monzoni te basement. This seismometer was moved s e v e r a l times during the experiments and was also used a t p o s i t i o n 1 and a t p o s i t i o n 4R.
2 . 4 DATA ACQUISITION AT THE TONTO FOREST SEISMOLOGICAL OBSERVATORY
Eight missions were flown over TFSO. Seven of the f l igh ts were made by B-58 a i rc raf t and one by an SR-71 a i r c r a f t .
The B-58 missions were flown s p e c i f i c a l l y f o r t h e s e i s m i c e f f e c t s program according t o a prede termined pa t te rn . However, ground based radar p l o t t i n g f a c i l i t i e s were n o t a v a i l a b l e f o r v e r i f i c a t i o n o f f l i g h t p a r a m e t e r d a t a ; t h e r e f o r e , t h e p i l o t ' s d a t a were used f o r t h e s e f l i g h t s . S i m i l a r l y , t h e observatory and local meteorological s ta t ion data were used in l ieu of Rawindsonde measurements.
The seismometer array used in the experiments a t TFSO i s shown i n f i g u r e 6. The f ive seismometers located a t p o s i t i o n s 1 through 5 and arranged i n a c i r c l e were t h e f i v e seismometers of the mobile system. The d a t a from these seismometers were r eco rded i n t he same manner as t h e d a t a were recorded a t EAFB. These d a t a were used t o s tudy t he focus ing effects o f t h e s o n i c boom hyperbola. A l l of the portable seismometers were or ien ted to measure v e r t i c a l ground p a r t i c l e v e l o c i t i e s , and each was b u r i e d t o a depth of between 0.5 and 1 meter. The overpressure was not measured a t these f ive seismometer locat ions because only a l i m i t e d amount of overprwsure monitoring equipment was a v a i l a b l e and overpressure measurements a t the o ther se i smometer loca t ions were cons ide red t o be more c r i t i ca l .
5

One-of the over f l igh ts each day .was p lanned so t h a t some of t h e seismometers were l o c a t e d i n s i d e o f t h e boom envelope and some were loca ted outs ide of the envelope. Six observatory seismometers , the locat ions of which were designated 63, 64, 66, 67, 70, and 72, were used in sys tems having the modified response. Four NASA acoust ic recording vans were used to moni tor overpressures a t locations 63, 64, 66, and 67 on the first day o f f l i g h t s and a t l o c a t i o n s 63, 64, 67, and 72 on the second day o f f l i g h t s . A s shown i n figure 6, locations 63, 64, and 72 l ay on t h e f l i g h t p a t h f o r o v e r h e a d f l i g h t s on t h e first day, and locat ions 64 and 67 l a y on t h e o v e r h e a d f l i g h t p a t h on the second day.
2.5 DATA ACQUISITION AT THE UINTA BASIN SEISMOLOGICAL OBSERVATORY
Three B-58 missions were flown over UBSO. The f l i g h t p a t h s o f t h e s e miss ions a re shown i n f i g u r e 7 . A s was the case a t TFSO, no ground-based r ada r f 1 own
shown
Three
d a t a o r Rawindsonde weather da ta were avai lable . These-missions were f o r t h e s p e c i f i c r e q u i r e m e n t s o f t h e seismic e f f e c t s program.
The loca t ions o f the se i smometers used in the exper iments a t UBSO a r e i n f i g u r e 7 .
The mobile equipment used a t EAFB and a t TFSO was a lso used a t UBSO. of the seismometers forming part of the mobile equipment were placed on
a c o n c r e t e p i e r i n a s e a l e d s tee l v a u l t a t a depth of about 15 meters. They were a r r anged i n a three-component system measuring vertical , north-south h o r i z o n t a l , a n d e a s t - w e s t h o r i z o n t a l g r o u n d p a r t i c l e v e l o c i t i e s . A S e i s - mometer, Model 18300, i n a borehole p ressure case was p laced on t h e s u r f a c e of the ground some 6 meters from the three-component system. This seismometer measured p a r t i c l e v e l o c i t i e s a t the sur face o f the g round. The fourth mobile seismometer was p laced on a p i e r a t the bot tom of a sealed vaul t 13.4 meters deep measu r ing ve r t i ca l pa r t i c l e ve loc i t i e s a lmos t d i r ec t ly below t h e s i n g l e ver t ical se ismometer . These locat ions are designated A and B and a r e a l s o shown i n f i g u r e 7 .
The other f ive seismometers were par t of the normal observatory instrumentation. Ordinarily, the observatory seismograph systems measure ground displacements ra ther than ground veloci t ies . The seismometers used were Johnson-Matheson Seismometers, Model 6480 , enc losed i n s ea l ed s t ee l v a u l t s a t t h e s u r f a c e ; , a Model 18300 seismometer i n a shal low borehole a t a depth of 76 meters ; and three Model 11167 deep-hole seismometers a t depths of 1190 meters, 1490 meters, and 1790 meters. These locations were designated Z 1 , SZ1, and DH, r e s p e c t i v e l y ( s e e f i g u r e 7 ) .
The seismometers a t l oca t ions Z 1 and SZ1 were used as veloci ty seismo- g r a p h s , t h e i r o u t p u t s b e i n g p r o p o r t i o n a l t o t h e g r o u n d p a r t i c l e v e l o c i t i e s . These d a t a were ampl i f ied by So l id - s t a t e Ampl i f i e r s , Model 25220, and were recorded on the t ape recorder be longing to the mobi le equipment . In the t ime a v a i l a b l e , it was n o t p o s s i b l e t o modify the th ree deep-hole se i smographs to have responses identical to the mobile recording equipment and t o e l i m i n a t e 60 Hz no i se from these systems (normally, 60 Hz no i se is not a problem on
6

these sys tems because th i s f requency i s o u t s i d e o f t h e band o f i n t e re s t ) . Therefore, it was n o t p o s s i b l e t o produce outputs f rom these seismographs that were p r o p o r t i o n a l t o p a r t i c l e v e l o c i t i e s w i t h s u f f i c i e n t s e n s i t i v i t y i n t h e range of i n t e r e s t f o r t h i s program.
2 . 6 DATA ACQUISITION FOR COMPARATIVE EXPERIMENTS
To compare the magnitudes of the ground motions generated by son ic booms t o more familiar "cu l tu ra l ly" gene ra t ed seismic no i se , some other examples of cu l tu ra l ly -gene ra t ed seismic no i se were reco rded . "Cu l tu ra l no i se" i n t h i s context means ground motion induced by means o the r t han na tu ra l ly occu r r ing phenomena ( e .g . , e a r thquakes ) . Typ ica l sou rces o f cu l tu ra l no i se are human ac t iv i ty , mo to r veh ic l e s , aircraft , heavy construct ion, e tc .
Among t h e examples o f cu l tura l no ise tha t were recorded a t EAFB were ground motions caused by a man walking toward a seismometer, an automobile being dr iven past the seismometer , and the ground motion caused by t h e ope ra t ion o f a i r c ra f t . These seismograms are d i s c u s s e d i n s e c t i o n 4 . 8 .
2 . 7 EFFECT OF PRESSURE VARIATIONS ON THE SEISMOMETER
Ext rapola t ion of unpubl i shed resu l t s o f tests made by Geotech i n 1965 t o determine the response of the Model 18300 seismometer t o p r e s s u r e v a r i a t i o n s i n d i c a t e t h a t a son ic boom of 2 pounds per square foo t overpressure would induce a movement of the seismometer frame o f less than 0 .4 p/second a t 10 Hz and l e s s t h a n 0 . 2 v/second a t 100 Hz. This l eve l o f p ressure- induced ve loc i ty i s i n s i g n i f i c a n t when compared t o t h e ground v e l o c i t i e s o b s e r v e d i n t h i s s t u d y in the f requency range o f 1 t o 100 Hz. However, t o e l i m i n a t e t h i s small p re s su re e f fec t , a l l seismometers were buried to a depth of a t l e a s t 1 meter a t EAFB and 0.5 meter a t TFSO and UBSO. S e v e r a l t e s t s were conducted a t EAFB i n which son ic boom pressure changes (N-waves) were s imultaneously recorded by a surface microphone and a microphone buried a t a depth of 1 meter. The buried microphone showed a t t e n u a t i o n o f t h e N-wave by a f a c t o r of from 7 t o 1 8 r e l a t i v e t o t h e s u r f a c e . We conclude that the seismograms p roduced i n t h i s s tudy r ep resen t pa r t i c l e ve loc i ty o f t he g round and show no s i g n i f i c a n t e f f e c t s o f t h e a c o u s t i c wave a c t i n g d i r e c t l y on the seismometer mass.
7

3. GEOLOGIC PARAMETERS OF THE TEST AREAS
Data regard ing the genera l geologic envi ronment o f each a t t h e t es t areas were obtained f rom reports of p rev ious s tud ie s made by Geotech (Geotech TR 65-28; TR 66-17), from p u b l i c a t i o n s by the United States Geological Survey (Dibblee, 1960; Roller, e t a l , 1964), and the United States Corps of Engineers (Miscel- laneous 'Paper No. 4-365) . In addi t ion, seismic r e f r a c t i o n s u r v e y s were conducted i n e a c h o f t h e t e s t areas to p rov ide i n fo rma t ion on l o c a l n e a r - su r f ace seismic v e l o c i t i e s . The geologic information was ob ta ined fo r t he purpose o f cor re la t ion wi th the f l igh t parameter and boom-measurement da t a .
3 .1 TOPOGRAPHY, GEOLOGY, AND SEISMIC VELOCITIES
3.1.1 Edwards A i r Force Base
Edwards A i r Force Base i s i n t h e w e s t - c e n t r a l p a r t o f t h e Mojave Desert block about midway between the bounding Garlock and San Andreas faults. I t is centered about 110 ki lometers east o f t he i r j unc t ion . Th i s b lock i s cu t by numerous h i g h - a n g l e f a u l t s , most of which t r end no r th -wes tward pa ra l l e l t o t h e San Andreas f a u l t . The r o c k s i n t h e area can be grouped into three main d i v i s i o n s : g r a n i t e and metamorphic rocks of pre-Tertiary age; volcanic, pyroclast ic , and sedimentary rocks of Te r t i a ry age ; and a l luv ia l s ed imen t s of Quaternary age.
The topograph ic f ea tu re s o f t he a r ea r e f l ec t t he geo log ic s t ruc tu re and t h e r e l a t i v e h a r d n e s s and coherence of the many d i f f e r e n t r o c k s t r a t a . Hard, weather - res i s tan t carbonate and cher t l ayers , d ike- forming pegmat i te -ap l i te and qua r t z l a t i t e , and quar tz basa l t c rop ou t as conspicuous ledges, r idges, and h i l l s . The g ran i t e i n t he no r thwes te rn qua r t e r o f t he Rogers Lake quadrangle weathers to low r e l i e f , whereas t h a t e a s t o f northern Rogers Lake c rops ou t p rominent ly to form s teep-s ided , j agged h i l l s .
The sed imen t s , ch i e f ly c l ays , o f t he d ry l ake beds i n t he area were deposited during the Pleistocene age and were derived from the igneous and metamorphic rocks that form the numerous but tes and mounta ins in the reg ion . Apprec iab le quan t i t i e s of windblown sand have accumulated as dunes along the margins of the lake beds. The na tu ra l d ra inage o f t he Edwards environs f lows from a l l directions towards the Rogers, Buckhorn, and Rosamond Dry Lake low- lands. However, most o f t he su r f ace f l ow i s abso rbed i n g ranu la r a l l uv ia l depos i t s which form t h e m a j o r p o r t i o n o f t h e a i r b a s e t e r r a i n , and only l imi t ed d ra inage r eaches t he p l aya l owlands excep t a f t e r heavy storms. There is no sur face f low out o f the lake bed basins . The lake bed mater ia l s a re a l l u v i a l i n o r i g i n , and i n many instances have been t ransported considerable d is tances , the i r depos i t ion occur r ing under d i f fe ren t envi ronmenta l condi t ions . The lake beds a r e p redomina te ly s i l t y c l ays w i th many l a y e r s o f f i n e , medium, and course sand. The c lay conten t of t h e lake bed materials ranges from 30 t o 80 pe rcen t .
8

The seismic measurements at EAFB were made on a small, shallow, dry lake less than a mile from the western edge o f Rogers Dry Lake, and on an adjacent outcrop of quartz monzoni te , the same type of rock which underlies the l ake beds . The wave p ropaga t iona l ve loc i t i e s o f t he l ake bed and t h e underlying quartz monzonite were determined by a r e f r ac t ion su rvey in- which twelve geophones were a l igned i n an approx ima te ly no r theas t e rn d i r ec t ion ac ross t he small lake bed. Dynamite charges were detonated a t each end of t h e geophone l i n e , and a r r i v a l times of the compressional wave were recorded by the geophones. Analysis of the refract ion data indicates that : (1) t h e p l aya c l ay - quar tz monzoni te in te r face is r e l a t i v e l y h o r i z o n t a l and averages a depth of 8 t o 1 2 meters below the surface; (2) the average compressional v e l o c i t y i n t h e c l a y l a y e r i s 600 meters/second; and (3) the average compressional veloci ty a long the top of the quartz monzoni te i s 2000 meters / second.
3.1.2 Tonto Forest Seismological Observatory
The Tonto Forest Seismological Observatory i s loca ted i n t he Bas in and Range Province about 25 ki lometers south of the southern boundary of t h e Colorado Plateau. This boundary i s marked by t h e Mogollon R i m , a 450-meter erosional escarpment o f Paleozoic and Mesozoic sediments . Ei ther grani te or a thin sedimentary sect ion covers the seismometer array area. The g r a n i t e i s h ighly decomposed, and weather ing extends to a depth o f as much as 30 meters . I ts decomposed character supports only subdued topography, but numerous g r a n i t e and d i abas i c d ikes of a more res is tant na tu re suppor t r i dges t r end ing i n . an eas t -wes t d i r ec t ion ac ross t he a r r ay area. The sed imen ta ry s ec t ion cons i s t s of Cambrian and Devonian sandstones and limestones. The maximum th i ckness o f sediments under any seismometer s i t e probably does not exceed 60 meters . Of t h e 46 se i smometer s i tes , 28 are s i t u a t e d on pre-Cambrian grani te , 17 are on a thin veneer of Paleozoic sediments, and 1 i s on b a s a l t . Weathered g r a n i t e p robab ly ex i s t s below the s ed imen ta ry s ec t ion i n t he no r the rn ha l f o f t h e a r r a y .
Figure 6 shows t h e l o c a t i o n and code designation o f the seismometers of t h e TFSO a r r a y which were u t i l i z e d i n t h e s u p e r s o n i c f l i g h t s measurements program, and a l s o t h e o r i e n t a t i o n o f t h e r e f r a c t i o n s u r v e y l i n e . The r e f r a c - t i on su rvey showed a l aye r w i th a compressional wave v e l o c i t y o f 1215 meters/ second overlying a l aye r w i th a compressional wave v e l o c i t y o f 2860 meters/ second. The a v e r a g e d e p t h t o t h e i n t e r f a c e i s 29 meters .
3.1.3 Uinta Basin Seismological Observatory
The Uinta Basin Seismological Observatory i s loca ted on the no r th f l ank of the Uinta Basin, a broad asymmetrical syncline trending east-west and ly ing t o t h e s o u t h o f t h e U i n t a u p l i f t i n northeastern Utah. The ou tc rop w i th in t he a r r ay area c o n s i s t s 05 t h e Duchesne River formation, which i s o v e r l a i n l o c a l l y by thin Quaternary terrace depos i t s . The Duchesne River format ion cons is t s of f luv ia t i l e , f r i ab le , c ros s -bedded s ands tones .
Sonic and formation density logs made i n s e v e r a l . 6 0 - m e t e r h o l e s i n t h e a r r a y area show the average compressional veloci ty a long the 60 me te r s t o be 3060 me te r s / second and t he ave rage dens i ty t o be 2530 kilograms/meter3 (2.53 grams/cm3).
9

Figure 7 shows t h e l o c a t i o n o f the seismometers used in the measurements program and t h e o r i e n t a t i o n o f t h e r e f r a c t i o n s u r v e y l i n e . The r e s u l t s o f t h e su rvey i nd ica t e a 6-meter layer of weathered material wi th a v e l o c i t y of 660 meters /second overlying sandstone with a v e l o c i t y of 2500 meters/second.
Figure 8 i s a hypo the t i ca l c ros s - sec t ion o f t he U in ta Up l i f t and Uinta Basin showing the subsur face format ions benea th UBSO.
3 . 2 DETERMINATION OF GEOLOGIC PARAMETERS
The bas ic t echnique used in the se i smic re f rac t ion surveys conducted a t each loca t ion was t o a r r a n g e a l i n e o f geophones separated by known d i s t ances on the su r f ace o f t he area t o b e s t u d i e d . The o r i e n t a t i o n o f t h e r e f r a c t i o n l i nes w i th r e spec t t o t he s e i smomete r pos i t i ons a t EAFB, TFSO, and UBSO a r e shown i n f i g u r e s 5, 6 , and 7, r e s p e c t i v e l y . Data from t h e s e geophones were ampl i f i ed and f i l t e r ed and were recorded photographical ly on an osc i l l og raph . A t ime base was supp l i ed by an interval t iming system. An explosive charge was f i r e d a t a known d i s t a n c e from one end of t h e l i n e o f geophones, and the i n s t a n t of de tona t ion and t he a r r iva l time of energy a t each geophone was recorded. A t y p i c a l r e f r a c t i o n r e c o r d i s shown i n f i g u r e 9. From t h e a r r i v a l t ime of the se i smic energy a t each geophone, the velocity of the compressional wave i n t h e medium can be ca lcu la ted . In the case o f l ayered media (see f igu re l o ) , t he h ighe r ve loc i ty i n t he l ower l aye r enab le s ene rgy t r ave l ing i n t h i s l a y e r t o a r r i v e a t t h e more d i s t a n t geophones e a r l i e r t h a n e n e r g y p ropaga ted t h rough t he su r f ace l aye r . P lo t t i ng a r r iva l t imes aga ins t d i s t ance , as i n f i g u r e 11, r e s u l t e d i n two s t r a i g h t l i n e s , t h e r e c i p r o c a l o f t h e s l o p e of each l ine g iv ing the compress iona l wave ve loc i ty i n each l aye r . A l so , from the graph it was p o s s i b l e t o make an estimate o f t he dep th o f t he su r f ace l aye r ,
In addi t ion to the explos ive re f rac t ion surveys , measurements a t each r eco rd ing pos i t i on a t TFSO were made using a Seismic Timer, Dyna Metr ic Model 117. The se i smic timer i s e s s e n t i a l l y a s ledge hammer which s t a r t s a t imer when it s t r ikes the ground. The t imer i s s h u t o f f when t h e first b u r s t of seismic energy reaches a geophone located a t a known d i s t ance from t h e point of impact. This technique gave a more detai led measure of the near- sur face ve loc i ty d i s t r ibu t ion in the immedia te v ic in i ty o f each se i smometer t han d id t he more genera l explos ive surveys . I t was d e s i r e d t o o b t a i n t h e shear as wel l as t h e c o m p r e s s i o n a l v e l o c i t i e s i n t h e r e f r a c t i o n s u r v e y s , b u t no accu ra t e method of t iming the a r r iva l o f the s lower-moving shear wave could be devised with the equipment available. Shear wave v e l o c i t i e s were es t imated on t h e b a s i s of pub l i shed va lues o f compress iona l / shea r ve loc i ty r a t io s fo r var ious types o f rocks . A summary o f t h e r e f r a c t i o n r e s u l t s is g i v e n i n t a b l e 1, and the depths a t which the seismometers were buried are shown i n t a b l e 2 .
10

Table 1. Commessional wave velocities and laver denths
A. Edwards Air Force Base - two explosive surveys
West-east profile
Velocity in surface layer 600 meters/second (1970 ft/second) Velocity in second layer 2000 meters/second (6567 ft/second) Thickness of surface layer
Thickness of surface layer (drilling) 10.6 meters (34.8 ft)
(refraction) 7.8 meters (25.6 ft)
East-west profile
Velocity in surface layer 532 meters/second (1740 ft/second) Velocity in second layer 1986 meters/second (6515 ft/second) Thickness of surface layer 6.4 meters (21 ft)
B. Tonto Forest Seismological Observatory - one explosive survey
Velocity in upper layer 1215 meters/second (3980 ft/second) Velocity in second layer 2860 rneters/second (9380 ft/second) Thickness of surface layer 29 meters (95 ft)
Hammer surveys
Locat ion 63
Velocity in surface layer 268 meters/second (910 ft/second) Velocity in second layer 1001 meters/second (3300 ft/second) Thickness of surface layer 1.07 meters (3.5 ft)
Location 64
Velocity in surface layer 235 meters/second (770 ft/second) Velocity in second layer 763 meters/second (2500 ft/second) Thickness of surface layer 0.82 meters (2.7 ft)
Location 66
Velocity in surface layer 235 meters/second (770 ft/second) Velocity in second layer 830 meters/second (2710 ft/second) Thickness of surface layer 1.46 meters (4.8 ft)
11
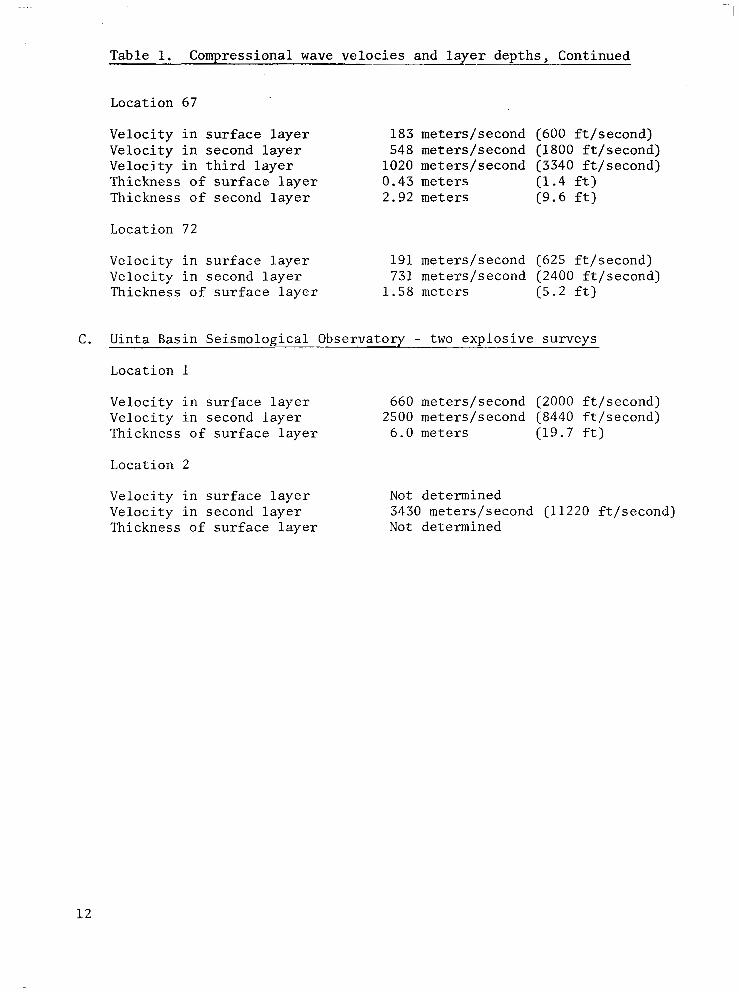
Table 1. Compressional wave velocies and layer depths , Cont inued
Location 67
V e l o c i t y i n s u r f a c e l a y e r 183 meters/second (600 f t / second) Ve loc i ty i n s econd l aye r 548 meters/second (1800 f t / second) V e l o c i t y i n t h i r d l a y e r 1020 meters/second (3340 f t / second) Thickness o f sur face l ayer 0.43 meters (1.4 f t ) Thickness of second layer 2.92 meters ( 9 . 6 f t )
Location 72
Ve loc i ty i n su r f ace l aye r 191 meters/second (625 f t / second) Ve loc i ty i n s econd l aye r 731 meters/second (2400 f t / second) Thickness o f s u r f a c e l a y e r 1.58 meters (5.2 f t )
C. Uinta Basin Seismological Observatory - two explos ive surveys
Location 1
V e l o c i t y i n s u r f a c e l a y e r 660 meters/second (2000 f t / second) Veloc i ty in second layer 2500 meters/second (8440 f t / second) Thickness o f sur face l ayer 6.0 meters ( 1 9 . 7 f t )
Location 2
Ve loc i ty i n su r f ace l aye r Veloc i ty in second layer Thickness o f sur face l ayer
Not determined 3430 meters/second (11220 f t /second) Not determined
1 2

Table 2. Seismometer deDths and s i t e a l t i t u d e s
A. Seismometer deDths fto seismometer bottom1
1. Edwards A i r Force Base
Location 1 - t h r e e component 1.1 m e t e r s ( 3 . 6 f t ) Location 1 - pres su r i zed case 0 .89 meters (2 .92 f t )*
Location 4 - ver t ica l i . 2 meters (4 f t ) Location 4R - ver t ica l 1.1 meters ( 3 . 6 f t ) Location 5 - vert ical 2 . 1 meters ( 6 . 9 f t )
s e i s 1 . 3 7 meters ( 4 . 5 f t )
2 . Tonto Forest Seismological Observatory
Location 1 - v e r t i c a l Location 2 - ver t ica l Location 3 - v e r t i c a l Location 4 - v e r t i c a l Location 5 - v e r t i c a l
Location 63 - ver t ica l Location 64 - v e r t i c a l Location 66 - v e r t i c a l Location 67 - v e r t i c a l Location 72 - v e r t i c a l
3. Uinta Basin Seismological Observatory
0.76 meters ( 2 . 5 f t ) 1.07 meters ( 3 . 5 f t ) 1.07 meters ( 3 . 5 f t ) 0.76 meters ( 2 . 5 f t ) 0.91 meters ( 5 . 0 f t )
1.37 meters ( 4 . 5 f t ) 1 .13 meters ( 3 . 7 f t ) 1.52 meters ( 5 . 0 f t ) 2.14 meters ( 7 . 0 f t ) 1.68 meters ( 5 . 5 f t )
Location 1 - three-component 1 . 2 meters (4 f t ) Location 2 - v e r t i c a l 13.4 meters (44 f t ) Location Z 1 2 meters ( 6 . 5 f t ) LocationSZl 76.2 meters (250 f t ) Locat ion DH6 1109 meters (3900 f t ) Location DH5 1495 meters (4900 f t ) Location DH4 1790 meters (5900 f t )
B. S i t e a l t i t u d e s above mean s e a level fmsll
EAFB TFSO UBSO
722 meters (2375 f t ) 1492 meters (4894 f t ) 1600 meters (5248 f t )
*To top"of -case
1 3

4. ANALYSIS AND INTERPRETATION OF EXPERIMENTAL DATA
4.1 GENERAL
I n t e r p r e t a t i o n o f t h e s o n i c boom f i e l d d a t a was focused upon t h e c h a r a c t e r i s t i c s o f t h e seismic s igna tu re , va lues o f t he ver t ica l peak ground p a r t i c l e v e l o c i t i e s , and upon t h e manner i n which ' these parameters vary with f l i gh t cond i t ions , geo log ic l oca t ion , and wea the r . In add i t ion , s eve ra l more special ized problems were c o n s i d e r e d , i n c l u d i n g t h e a t t e n u a t i o n o f p a r t i c l e veloci ty with depth, the f requency content of the seismogram, focusing of s e i smic ene rgy due t o t he hype rbo l i c i n t e r sec t ion o f t he shock cone and t h e ground, and the propagation of seismic energy outside of the sonic boom pressure envelope.
4 . 2 EXPERIMENTAL DATA PROVIDED BY NASA FOR THE SEISMIC EFFECTS PROGRAM
Geotech was respons ib le on ly €or the s e i smic measurements a t EAFB, TFSO, and UBSO. Other experimental data which were required for the seismic e f f e c t s program were c o l l e c t e d by va r ious o the r government agencies and/or con t r ac to r s o f t he USAF and NASA. The NASA Langley Research Center (LRC) provided the se i smic e f fec ts p rogram wi th the fo l lowing da ta for as many missions as p o s s i b l e :
a. P res su re s igna tu re , t he peak pos i t i ve and peak negative over- p r e s s u r e , t h e r i s e t i m e t o t h e p e a k p o s i t i v e o v e r p r e s s u r e , and the pe r iod of t h e N-wave;
b . Aircraft speed , heading , a l t i tude ;
c . Meteoro logica l da ta .
In addi t ion , USAF personnel from EAFB surveyed the seismometer locat ions a t EAFB.
4 . 3 METHODS OF MEASUREMENT AND CLASSIFICATION OF SEISMOGRAMS
A hypo the t i ca l seismogram i s shown i n f i g u r e 1 2 . I t i s a r ep resen ta t ion of t he g round pa r t i c l e ve loc i ty a t a p o i n t which is s u b j e c t e d t o t h e " t y p i c a l I 1 N-wave, and i s typ ica l o f t he s e i smic waveforms observed. The var ious charac- t e r i s t i c s o f t h e seismogram which were measured i n t h i s s t u d y a r e i d e n t i f i e d i n t h i s f i g u r e . These measurements and a l l a v a i l a b l e r e l a t e d p r e s s u r e and r a d a r d a t a p e r t a i n i n g t o e a c h f l i g h t were coded on punched cards, and the empir ical re la t ionships between the var ious parameters were obtained by machine processing.
I t was p o s s i b l e t o c a t e g o r i z e t h e bow and s tern halves of each seismo- gram i n t o 1 of 10 groups i n a manner similar t o t h a t u s e d by NASA LRC f o r t h e p re s su re N-wave d a t a . Examples o f t h e wave shapes i n each s e i smic c l a s s i f i - c a t i o n a r e shown i n f i g u r e 1 3 . C o r r e l a t i o n o f t h e s e i s m i c and pressure
1 4

classifications produced no consistent relationships. That is, a particular class of N-wave does not produce a particular class of seismic waveform. However, the seismic classification can be correlated with seismometer location.
Positions 1 and 4 on the lake bed at EAFB produce class 1 waveforms, and position 5 on the quartz monzonite outcrop usually produces class 2 waveforms.
4 . 4 SEISMOGRAM CHARACTERISTICS
Over 1000 individual seismograms were recorded at 20 different sites. Although the seismic signatures varied considerably from site to site; and to a lesser extent from mission to mission, all of the records possess'ed some characteristics in common.
Each seismogram recorded under the sonic boom pressure envelope is characterized by two relatively large downward particle velocities, which are caused by the rapid pressure changes associated with the leading and trailing edges of the N-wave. In almost every case, these downward peaks on the vertical component constitute the maximum particle velocities observed at a location for a given overflight. The time interval between these maximum trace excursions is equal to the period of the N-wave, which in turn varies primarily with aircraft type, altitude, and speed.
Figure 14 is a seismogram recorded on a well-consolidated rock outcrop (position 5,. figure 5) at EAFB. It is representative of a large number of seismograms which are almost devoid of features other than the two large downward peaks. Other seismograms, especially those recorded on the dry lake bed at EAFB, have oscillations of several different frequencies following each maximum.
Figure 15 is a vertical seismogram recorded on the lake bed showing 80 Hz sinusoidal oscillations following each of the large downward peaks. Figure 16 was recorded at a different position on the lake bed and shows 9 Hz oscillations and 80 Hz oscillations following the peaks. Seismograms recorded at TFSO and UBSO also vary with location, as shown in figure 17, but they tend to resemble the seismograms recorded on the well-consolidated rock (position 5) at EAFB in that they are characterized by the bow and stern peaks and show little addition of sinusoidal oscillations.
Figure 18 is a high-sensitivity velocity seismogram in which it is possible to see a precursor to the maximum velocities. The particle velocity associated with the precursor is commonly 5-10 p/second, which is only a fraction of the maximum velocity, and which cannot be seen on seismograms recorded at an operational sensitivity at which the maximum particle velocity did not exceed the dynamic range of the recording system. Nevertheless, the precursor,which is a wave propagated from a previous location of the pressure disturbance,is apparently always present where the compressional velocity of the ground is greater than the aircraft speed.
15

The hor i zon ta l components of p a r t i c l e m o t i o n u s u a l l y e x h i b i t a maximum v e l o c i t y a few cyc le s after t h e i n i t i a l movement. Figure 19 is a t y p i c a l three-component seismogram recorded on the lake bed. The r a d i a l component commonly shows g r e a t e r p a r t i c l e v e l o c i t y t h a n t h e t r a n s v e r s e b u t less than t h e v e r t i c a l .
4 .5 EFFECTS OF FLIGHT CONDITIONS, GEOLOGICAL LOCATION, AND WEATHER ON THE SEISMIC SIGNATURE AND ON PEAK PARTICLE VELOCITIES
4.5.1 Effect of Seismometer Location on the Se ismic S ipna ture
The pa r t i cu la r l oca t ion o f t he s e i smomete r has an impor t an t e f f ec t on t h e seismic s i g n a t u r e , as can be seen in f igure 20, in which very similar N-waves p r o d u c e d i s t i n c t i v e l y d i f f e r e n t s e i s m i c waveforms a t each of f i v e loca t ions . Th i s e f f ec t i s p r imar i ly due t o t h e v a r i a t i o n o f t h e e l a s t i c parameters of the ear th , mainly the shear wave ve loc i ty and t he nea r - su r face l aye r ing of t h e r o c k o r s o i l i n t h e immediate v i c in i ty o f t he s e i smomete r . The loca l na tu re o f t he s e i smomete r l oca t ion e f f ec t can be s een by not ing the difference between the seismograms shown i n f i g u r e s 1 5 and 16, both of which were recorded on the d ry l ake bed a t EAFB bu t a t loca t ions about 250 me te r s apa r t . An e x p l a n a t i o n f o r t h e p a r t i c u l a r v a r i a t i o n s o f seismic waveforms observed a t EAFB is g iven i n s ec t ions 5 .2 and 5.3.
4 .5 .2 Ef fec t o f Ai rcraf t Type on the Se ismic S igna ture
The e f f e c t o f a i rc raf t s ize and conf igu ra t ion on the s e i smic s igna tu re is i n d i r e c t i n t h a t t h e a i rc raf t geometry a f f e c t s t h e N-wave c h a r a c t e r i s t i c s , which i n t u r n i n f l u e n c e t h e p a r t i c l e v e l o c i t y s i g n a t u r e . F i g u r e 2 1 shows v e r t i c a l v e l o c i t y seismograms produced by N-waves generated by f o u r d i f f e r e n t types of a i r c r a f t - F-104, B-58, XB-70, and SR-71. These seismograms were recorded on a wel l -consol ida ted rock ou tcrop (pos i t ion 5 ) a t EAFB. Figure 22 shows seismograms f o r t h e same f o u r t y p e s o f a i r c r a f t , r e c o r d e d on t h e l a k e bed (pos i t i on 1) a t EAFB. The primary difference between the seismograms at a g iven l oca t ion i s t h e time in te rva l be tween the maxima, which corresponds d i r e c t l y t o t h e d i f f e r e n t p e r i o d s of t h e N-waves.
4.5.3 Effect of Seismometer Location and A i r c r a f t Type on Peak P a r t i c l e Veloci tv
Figures 23 through 41 show the empir ical re la t ionship between peak pos i t i ve ove rp res su re and peak ground p a r t i c l e v e l o c i t y as a func t ion of a i r c r a f t t y p e and seismometer locations. The l i n e s drawn through the da ta p o i n t s are cons t r a ined t o pas s t h rough t he o r ig in , and they minimize the sum of the squares of the perpendicular dis tances f rom the points to the l ine. If the var iance of the acoust ical measurements i s about the same as t h e var iance o f the seismic measurements , the l ines are the maximum l ike l ihood e s t ima to r s .
16

Several conclusions may be drawn from t h e s e r e l a t i o n s :
a. Reference to . the geologies o f the EAFB seismometer locat ions g i v e n i n t a b l e 1 i n d i c a t e s t h a t a given maximum pos i t i ve ove rp res su re p roduces g r e a t e r maximum p a r t i c l e v e l o c i t i e s f o r l o c a t i o n s on loose ly-consol ida ted , low-veloci ty material than on hard , h igher -ve loc i ty material.
b. The p e a k p a r t i c l e v e l o c i t y a p p e a r s t o b e l i n e a r l y r e l a t e d t o maximum overpressure . Each pound per square foo t o f overpressure p roduces about 100 p/second peak p a r t i c l e v e l o c i t y on loosely-consol idated rock and about 75 p/second on well-consolidated rock.
c. For a given maximum ove rp res su re , t he a i rc raf t type i s n o t s i g n i f i c a n t i n d e t e r m i n i n g t h e maximum p a r t i c l e v e l o c i t y .
d. For a given overpressure, maximum p a r t i c l e v e l o c i t i e s i n a d i r e c t i o n r a d i a l t o t h e f l i g h t t rack o f t h e a i r c ra f t a r e l e s s t h a n t h o s e i n a v e r t i c a l d i r e c t i o n and g r e a t e r t h a n t h o s e i n a d i r e c t i o n t r a n s v e r s e t o t h e f l i g h t t r a c k .
Too few f l i g h t s were made a t TFSO and UBSO t o e s t i m a t e t h e t r u e o v e r - p re s su re - p a r t i c l e v e l o c i t y r e l a t i o n s h i p . However, f i g u r e s 40 and 41 g ive t h e e m p i r i c a l r e l a t i o n s h i p f o r t h e f l i g h t s a v a i l a b l e . The l i n e s drawn through t h e s e p o i n t s h a v e l i t t l e s t a t i s t i c a l s ign i f icance because of t h e small number o f da t a po in t s upon which they are based.
4 .5 .4 Ef fec t o f Aircraft A l t i t u d e on Peak P a r t i c l e V e l o c i t y
Maximum p a r t i c l e v e l o c i t y is a func t ion of a i rc raf t a l t i t ude on ly t h rough t h e r e l a t i o n s h i p o f a l t i t u d e t o maximum overpressure. That i s , f o r a given ove rp res su re , t he maximum p a r t i c l e v e l o c i t y i s independent of the a i rc raf t a l t i t u d e . However, t h e i n d i r e c t r e l a t i o n s h i p o f maximum p a r t i c l e v e l o c i t y t o a i rc raf t a l t i t u d e is o f some i n t e r e s t and i s g iven i n f i gu re 4 2 f o r t h e F-104 and B-58. The d a t a p o i n t s show c o n s i d e r a b l e s c a t t e r , and no e x t r a p o l a t i o n beyond the a l t i t ude r ange o f t he obse rved da t a shou ld be a t t empted . The r e l a t i o n s h i p o f a l t i t u d e t o peak p a r t i c l e v e l o c i t y f o r t h e XB-70 i s not given because the XB-70 flew a t only two a l t i t udes du r ing t he t e s t s ( -37 ,000 f ee t and -60,000 f e e t ) . I t might be noted, however, that the XB-70 a t 60,000 feet produced about the same peak p a r t i c l e v e l o c i t y as a B-58 a t 40,000 feet and an F-104 a t 20,000 f e e t .
4 .5 .5 Ef fec t of Aircraft Speed on Peak P a r t i c l e V e l o c i t y
No relationship could be observed between a i rc raf t v e l o c i t y i n t h e s u p e r - son ic r ange and peak pa r t i c l e ve loc i t i e s . Theore t i ca l ly , t he ove rp res su re s h o u l d b e a f f e c t e d v e r y l i t t l e by changes i n t h e a i rc raf t speed above Mach 1 .3 , and s i n c e p e a k p a r t i c l e v e l o c i t i e s a r e s e e n t o v a r y w i t h o v e r p r e s s u r e , no relat ionship should be expected. Aircraft v e l o c i t y was important, however, i n c e r t a i n c a s e s where t h e r e was a matching wi th the se i smic ve loc i ty o f Rayleigh waves. This phenomenon w i l l b e d i scussed i n s ec t ion 5 , a l t hough it might be no ted here tha t in no case did veloci ty-coupled Rayleigh waves c o n s t i t u t e t h e maximum p a r t i c l e v e l o c i t y o f a seismogram.
17

4.5.6 Effect of Meteorological ~~ Conditions on "" Peak Part ic le "" Veloci ty
Var i a t ions i n t empera tu re , r e l a t ive humid i ty , and wind v e l o c i t y were no t obse rved t o affect t h e maximum p a r t i c l e v e l o c i t y d i r e c t l y , a l t h o u g h t h e effect o f such va r i a t ions on the ove rp res su re was r e f l e c t e d i n ground veloci ty .
4 .6 FOCUSING
Because t h e s o n i c boom shock cone in te rsec ts the g round in a hyperbol ic arc, and because seismic waves would be expec ted t o t r ave l backward from t h e source a rc , as well as f o r w a r d , t h e r e e x i s t s t h e p o s s i b i l i t y o f seismic waves a r r i v i n g i n p h a s e from t h e two arms of the hyperbol ic source wi th a r e s u l t a n t re inforcement of seismic energy. One o f t h e o b j e c t i v e s o f t h e s e i s m i c e x p e r i - ments a t TFSO was to eva lua te poss ib le focus ing e f fec ts . F ive se i smometers numbered 1-5 and arranged in a c i r c l e o f 1 km r a d i u s , as shown i n f i g u r e 6 , were u t i l i z e d f o r t h i s p u r p o s e . The a i r c r a f t flew as n e a r l y o v e r t h e c e n t e r o f t h e c i r c l e as p o s s i b l e w i t h t h e i d e a t h a t t h e t r a v e l i n g f o c u s , i f it e x i s t s , would p a s s t h r o u g h t h e c i r c l e and be recorded by one o r more of the seismometers . No evidence of focusing was obta ined f rom th i s exper iment . I t seems l i k e l y tha t inhomogenei t ies in the g round make it imposs ib l e fo r s e i smic waves t o t ravel severa l k i lometers over d i f fe ren t pa ths and a r r ive exac t ly in phase . Also, as n o t e d i n s e c t i o n 4 . 4 , t h e p a r t i c l e v e l o c i t i e s a s s o c i a t e d w i t h p r o p a - ga t ing waves such as the p recu r so r a r e on ly a few microns per second and even a d o u b l i n g o f t h i s p a r t i c l e v e l o c i t y , which focusing could theoret ical ly produce, would b e i n s i g n i f i c a n t when compared t o t h e p a r t i c l e v e l o c i t i e s assoc ia ted wi th d i rec t passage o f the N-wave.
4 .7 ATTENUATION OF GROUND PARTICLE VELOCITY WITH DEPTH
The pr imary purpose o f the over f l igh ts a t UBSO was t o s t u d y t h e a t t e n u a - t i o n of t h e s o n i c boom induced ground motion with depth. As was exp la ined i n s ec t ion 2 .5 , it proved to be impossible to record ground veloci ty data f rom the three seismometers in the deep wel l , largely because of the high ampli tude 60 Hz n o i s e p r e s e n t i n t h e a r e a .
I t was p o s s i b l e t o r e c o r d some low q u a l i t y d a t a from a Seismometer, Model 18300, which was p laced on a c o n c r e t e p i e r i n a s e a l e d s t e e l v a u l t a t a depth of 13.4 meters (44 feet) . This seismometer was a lmost d i rec t ly benea th a similar se i smometer in a p res su r i zed ca se which was p laced a t t h e ground su r face . The comparative seismograms produced by each seismometer for mission Uinta 3 are shown in f igure 43 . There was a n a t t e n u a t i o n o f t h e p e a k p a r t i c l e v e l o c i t y by a f a c t o r o f a b o u t 75 a t a d e p t h o f 1 3 . 4 m e t e r s , r e l a t i v e t o t h e su r face . The s e i s m i c e f f e c t s o f t h e s o n i c boom a re appa ren t ly nea r - su r face phenomena.
18

4.8 COMPARISON OF SEISMOGRAMS RESULTING FROM CULTURALLY-PRODUCED NOISE AND SEISMOGRAMS RESULTING FROM SONIC BOOMS
I t i s , o f some i n t e r e s t t o compare t h e v e l o c i t i e s and frequencies of boom-induced ground motion t o t h e v e l o c i t i e s a n d f r e q u e n c i e s a s s o c i a t e d w i t h ground motion. due t o v a r i o u s t y p e s o f c u l t u r a l n o i s e .
Seismograms of noise produced by f i v e d i f f e r e n t c u l t u r a l s o u r c e s w e r e recorded a t EAFB. These were the passage of an automobile , a man walking, an XB-70 t a k i n g o f f , a n F-104 i n "touch-and-go" operations, and a low-flying, subsonic F-111 a i rcraf t .
Figure 44 shows t h e maximum p a r t i c l e v e l o c i t y and the assoc ia ted f requency observed for each source type. Analogous information for several sonic booms is included for comparison. Figures 45 and 46 show seismograms recorded for two non-boom sources .
The maximum p a r t i c l e v e l o c i t i e s a s s o c i a t e d w i t h s o n i c booms are s e v e r a l times l a r g e r t h a n t h o s e o f any o f t h e non-boom sources monitored. However, had t h e non-boom d i s t u r b a n c e s b e e n r e c o r d e d c l o s e r t o t h e i r s o u r c e , t h e y would have p robab ly p roduced g rea t e r pa r t i c l e ve loc i t i e s t han d id t he son ic booms.
In genera l , the sonic booms produced seismograms with more energy concentrated a t the lower f requencies than d id the non-boom sources , a l though i n no case d id t he maximum p a r t i c l e v e l o c i t y o f t h e s o n i c boom seismogram occur a t t h e s e low f requencies .
4 .9 FREQUENCY SPECTRA OF VELOCITY SEISMOGRAMS
The power s p e c t r a o f v e l o c i t y seismograms recorded a t s e v e r a l d i f f e r e n t l o c a t i o n s f o r v a r i o u s t y p e s o f a i r c r a f t and f l i g h t c o n d i t i o n s were d i g i t a l l y computed .
The samples were digi t ized a t a r a t e o f 1000 samples per second, which gave adequate resolut ion of the high f requencies . A l l d c o f f s e t s were removed from the d ig i t i zed da t a , and t he seismograms were normalized t o t h e maximum. Each seismogram was d i g i t a l l y r e p r e s e n t e d by 3050 samples , o r j u s t ove r 3 seconds.
The smoothed spec t ra l es t imates o f the se i smograms were produced using a CDC 3100 computer. The technique was based on t h e method of Blackman and Tukey (1958).
Figures 47, 48, and 49 show the ampli tude power spectra of seismograms recorded a t t h e same loca t ion (pos i t ion 4 ) a t EAFB f o r d i f f e r e n t s h a p e d N-waves. Each of t h e t h r e e s p e c t r a show predominant peaks a t about 80 Hz, a frequency which is charac te r i s t ic o f se i smograms recorded a t pos i t ion 4 , even though there i s r e l a t i v e l y l i t t l e power i n any o f t h e N-wave s p e c t r a a t t h a t frequency.
19

Figures 50, 51, and 52 show t h e g r e a t v a r i a t i o n o f t h e power s p e c t r a wi th geo logy fo r t he same p r e s s u r e i n p u t .
The se i smic spec t ra depend bo th on the shape of t h e N-wave and t h e r e sponse cha rac t e r i s t i c s o f t he g round w i th t he l a t te r apparent ly having the g r e a t e r i n f l u e n c e .
4.10 PROPAGATION OF SEISMIC ENERGY OUTSIDE THE BOOM PRESSURE ENVELOPE
Two f l i g h t s (Tonto 3 and Tonto 7) a t TFSO were made a t l a t e ra l d i s t a n c e s of 20 miles from t h e seismic d e t e c t o r s . T h e s e f l i g h t s were made by B-58's f l y i n g a t Mach 1.65 a t about 48,000 feet . The maximum p a r t i c l e v e l o c i t y r e c o r d e d f o r t h e f l i g h t s was 9 microns per second. This i s about 1 /6 the maximum p a r t i c l e v e l o c i t i e s o b s e r v e d a t t h e same l o c a t i o n s f o r a B-58 f l y i n g approximately overhead a t t h e same a l t i t u d e and speed (Tonto 1 ) . On t h i s b a s i s , it appea r s t ha t s ign i f i can t s e i smic ene rgy will not p ropagate ou ts ide t h e boom pressure envelope.
4.11 COMPARISON OF MAXIMUM PARTICLE VELOCITIES WITH DAMAGE CRITERIA
The e a r t h p a r t i c l e v e l o c i t i e s measured i n t h i s s t u d y were found t o b e approx ima te ly l i nea r ly r e l a t ed t o ove rp res su re . The maximum p a r t i c l e v e l o c i t i e s measured, which did not exceed 600 p/second, were i n r e s p o n s e t o o v e r p r e s s u r e s of between 5 and 6 l b / f t 2 . Although it i s not the purpose of t h i s s t u d y t o de t e rmine whe the r measu red pa r t i c l e ve loc i t i e s a r e po ten t i a l ly damaging, it is i n t e r e s t i n g t o compare the va lue o f 600 p /second wi th cur ren t ly acceptab le damage c r i t e r i a .
I t i s t h e recommendation of the United States Bureau of Mines (W. I . Duvall and D . E . Fogelson, 1962; and personal communication with W . I . Duvall , 1967) t h a t v i b r a t i o n l e v e l s i n t h e v i c i n i t y of r e s i d e n t i a l s t r u c t u r e s s h o u l d be maintained below a peak p a r t i c l e v e l o c i t y o f 2 inches per second (50,800 p/second). On t h i s b a s i s , t h e maximum p a r t i c l e v e l o c i t i e s o b s e r v e d i n t h i s study, which were i n r e s p o n s e t o l a r g e o v e r p r e s s u r e s a c t i n g on r e l a t i v e l y loose mater ia l ( lake bed) , reached about 1 . 2 pe rcen t o f t he damage th re sho ld .
Several s ta tes and agencies have adopted s l ight ly different damage c r i t e r i a , some of which are based on the "energy ra t io ," a concept conceived by F . J . Crandel l (Crandel l , 1949) . Crandel l def ined the energy ra t io as t h e acce le ra t ion squa red , d iv ided by the f requency squared, where t h e a c c e l e r a t i o n is e x p r e s s e d i n u n i t s o f fee t per second squared and the f requency in uni ts o f h e r t z . Energy r a t i o s below 3 , which is e q u i v a l e n t t o a p a r t i c l e v e l o c i t y of 76,200 p/second, were considered safe by Crandel l . The s ta tes of New J e r sey and Massachuset ts have specif ied an energy ra t io of 1 (48,514 p/second) as the a l lowable limit. A damage c r i t e r i o n b a s e d on an ene rgy r a t io of 1 was a l s o s p e c i f i e d by t h e U. S. Corps of Engineers and the New York S t a t e Power Authori ty . The p e a k p a r t i c l e v e l o c i t i e s o b s e r v e d i n t h i s s t u d y were well below a l l t h e s e l e v e l s .
20

5 . THEORETICAL STUDIES
5 .1 GENERAL
In add i t ion t o p rov id ing i n fo rma t ion fo r t he empi r i ca l r e l a t ionsh ips between f l i g h t p a r a m e t e r s a n d p a r t i c l e v e l o c i t i e s , a primary purpose of the seismic monitoring program a t EAFB was t o p r o v i d e a phys ica l - exp lana t ion fo r the observed seismic s i g n a t u r e s and to deve lop a method t o d e t e r m i n e t h e maximum p a r t i c l e v e l o c i t i e s t o b e e x p e c t e d from a given N-wave a t a p a r t i c u l a r geologica l loca t ion .
As d i scussed p rev ious ly , t he g rea t ma jo r i ty o f t he seismograms recorded a t EAFB were made a t two s e p a r a t e p o s i t i o n s on the c lay lake-bed and a t a pos i t i on on a quartz monzonite outcrop. The son ic boom se i smic s igna tu re was found t o depend s t rong ly on t h e l o c a t i o n a t which it was recorded. Figure 53 shows t h a t e a c h o f t h e t h r e e l o c a t i o n s f u r n i s h d i s t i n c t i v e waveforms f o r t h e same f l i g h t . The two predominant downward p a r t i c l e v e l o c i t i e s which almost e n t i r e l y c o n s t i t u t e t h e r a t h e r s i m p l e seismogram recorded on the wel l - consol ida ted quar tz monzoni te ou tcrop ( f igure 53a) a re due to the ver t ica l forces exer ted by t h e two compressions of the N-wave. These downward peaks may be cons idered to be an e l a s t i c de fo rma t ion o f t he su r f ace o f t he g round due t o t h e l o c a l l y - a p p l i e d p r e s s u r e l o a d r a t h e r t h a n t o a se i smica l ly- propagated wave, s ince the motion was detected a lmost a t t he po in t o f app l i - . c a t i o n o f t h e f o r c e and a lmost s imultaneous with the appl icat ion of the force. The two peak-downward p a r t i c l e v e l o c i t i e s a l s o d o m i n a t e t h e seismograms recorded a t p o s i t i o n s 1 and 4 ( f igu res 53b and 53c) on the dry lake-bed, but recordings made a t t h e s e p o s i t i o n s p r e s e n t a more compl ica ted s igna ture . Data recorded a t p o s i t i o n 1 c o n s i s t e n t l y e x h i b i t t h e s u p e r p o s i t i o n o f a high-frequency (-80 Hz) o s c i l l a t i o n , and data recorded a t p o s i t i o n 4 show t h e add i t ion o f t h i s h igh f r equency p lus a lower f requency (5 to 1 0 Hz).
Sec t ion 5 . 2 o f f e r s an explanation o f the p resence o f these s inusoida l o s c i l l a t i o n s , a n d a theo re t i ca l t echn ique f o r the es t imat ion of the peak p a r t i c l e v e l o c i t i e s i s p resen ted i n s ec t ion 5 .3 .
5 . 2 VELOCITY COUPLING
I t has been shown (Press and Oliver, 1956; Press and Ewing, 1951a and 1951b) that veloci ty-coupled Rayleigh waves can and often do e x i s t i n a l aye red ea r th a f t e r an exp los ion i n t he a i r . This type of wave r e s u l t s from the coupl ing of energy into the ear th f rom the a i r wave propagating outward from the po in t o f exp los ion . I t has been observed only when the phase ve loc i ty o f t he d i spe r s ive Ray le igh wave is equal a t some f r equency , t o t he ve loc i ty o f sound in a i r . Since Rayleigh waves i n a layered medium can e x i s t over a r ange o f ve loc i ty va lues , t he cond i t ion fo r r e sonan t coup l ing i s not t o o d i f f i c u l t t o s a t i s f y . When t h i s c o n d i t i o n i s me t , t he r e su l t i ng s e i smic wave w i l l have a phase ve loc i ty equal to the ve loc i ty o f the t rave l ing dis turbance, regardless of whether the dis turbance is an a i r wave moving a t the speed of sound o r i s an N-wave moving a t supersonic speed. The coupled wave w i l l have a cons tan t f requency equal to tha t f requency a t which t h e
2 1

dispersive wave.travels with the velocity of the traveling disturbance. Some of the seismograms, especially those recorded at position 4 on the dry lake bed ,(e.g., figure 16), show damped sinusoidal oscillations of two distinct frequencies (-78 Hz and -9 Hz in this particular instance) following each of the two large downward pulses. These frequencies, although constant for a particular seismogram, were observed to vary for missions involving different aircraft speed. Particle motion analysis from a three-component seismograph system indicates that the motion for the lower frequency sinusoid is retrograde elliptical - a Rayleigh wave. Particle motion analyses f o r the higher fre- quency sinusoid are inconclusive. The observed frequencies were plotted against the aircraft ground speed, which is equal to the speed of the traveling pressure disturbance, in an effort to substantiate the hypothesis that energy in this frequency range is velocity-coupled Rayleigh energy. This was done for seismograms recorded at position 4 on the lake bed. By utilizing the compressional wave velocity determined from the refraction survey conducted at EAFB, and estimating the value of Poisson's ratio as 0.4, which is a reasonable but critical assumption, the theoretical Rayleigh wave dispersion curve for the lake bed was computed. This relation gives phase velocity as a function of frequency (or period) for Rayleigh waves traveling through the idealized dry lake model. Figure 54 shows good agreement between the superposed plots of the aircraft velocity - observed period curves for position 4 and the theoretical fundamental mode Rayleigh dispersion curve. Figure 54 also shows that the observed higher-frequency sinusoids lie along the theoretically-predicted curve for a higher-mode Rayleigh wave, and indicates that the high-frequency oscillations could be a velocity-coupled, higher-mode Rayleigh wave. However, this interpretation is considered to be questionable because of the absence of oscillations corresponding to inter- mediate modes, such as the first higher mode. An alternative sugges.tion is that these oscillations result from constructively interfering reflections of compressional waves between the free surface and the clay-quartz monzonite interface. It has been shown (Gupta, 1966) that compressional waves normally incident on a one-layer model will result in maximum amplitudes for frequencies of:
f = (2m-l)V 4H
where V = compressional velocity in the layer H = thickness of the layer
m = 1, 2, 3 . . . .
On this basis,
H = (2m-1) 600 m/sec 4 x 78 Hz
22

l
and m = 1 H = 2 meters m = 2 H = 6 meters m = 3 H = 10 meters m = 4 H = 14 meters
That is, the oscillations at a'frequency of about 80 Hz could be explained by the presence of a pronounced velocity discontinuity (layer boundary) at a depth of any of the values of H. The refraction survey indi- cates that a velocity discontinuity is present at a depth of 10 meters, corresponding to m = 3. Thus, the clay-quartz monzonite boundary could account for the 80 Hz oscillations.
Although the gross geological features of positions 1 and 4 are almost identical, the seismograms recorded at position 1 show a much poorer develop- ment of the coupled Rayleigh wave than is seen at position 4. The difference in the seismograms recorded at the two lake-bed positions indicates that the velocity coupling is a local phenomenon, and apparently the variability of the thin layers in the clay around position 1 is sufficient to inhibit the formation of well-defined coupled waves. Figure 14 shows the poor development of velocity-coupled waves at position 5 on a quartz monzonite outcrop. The seismometer was positioned on unweathered rock, although it was covered by weathered material. The compressional velocity of the unweathered quartz monzonite where it underlies the lake bed is approximately 2000 meters/second (-Mach 5.5), which is too high for efficient velocity coupling. None of the recording positions occupied at TFSO and UBSO show evidence of velocity coupling. The refraction surveys and well velocity logs show the average velocities of the near-surface rock to be too high for coupling to exist from the flights made over these locations.
5.3 PREDICTION OF SEISMOGRAMS AND MAXIMUM PARTICLE VELOCITIES
5.3.1 Discussion
It can be seen from the examples of seismograms shown that the maximum velocities of the sonic boom seismic signature are not associated with the energy contained in the velocity-coupled waves or with the energy attributed to the reflected compressional waves. The maximum velocities were the two pronounced downward velocities which result from the direct passage of the leading and trailing edges of the N-wave.
This section will show that an elastostatic approximation of the action of an N-wave pressure distribution on an idealized model of the lake bed can account for these two pronounced downward motions and the general overall shape of the seismic signature.
2 3

5.3.2 Assumptions
I t will be assumed t h a t a t EAFB, t h e l a k e bed a r e a i n t h e v i c i n i t y of t h e seismometer i s a homogeneous, e l a s t i c ha l f - space . Th i s i dea l i zes t he phys i ca l s i t u a t i o n t o a n e x t e n t t h a t i s , in gene ra l , i nva l id fo r geo log ic env i ronmen t s ; however , the unusual nature of the dry lake bed a t least a p p r o x i m a t e l y f u l f i l l s the assumpt ions for the fo l lowing reasons :
a . The s u r f a c e o f t h e lake bed, covering over 300,000 square me te r s , has e s sen t i a l ly no r e l i e f ;
b . The l ake bed ma te r i a l , a l t hough composed of both sand and c l a y p a r t i c l e s , a p p e a r s t o b e r e l a t i v e homogeneous t o t h e d e p t h o f b u r i a l o f t he s e i smomete r s i n t he s ense of uniformity of compaction and absence of l aye r ing .
5.3.3 Deformation of a Half-%ace
Boussinesq (1885) has given a s o l u t i o n f o r t h e s t a t e o f d e f o r m a t i o n p r e s e n t i n a n e l a s t i c h a l f - s p a c e whose plane boundary, described by t h e xl-x2 p lane , i s under the ac t ion of a concen t r a t ed no rma l fo rce , t he d i r ec t ion of t h e f o r c e b e i n g i n t h e p o s i t i v e (downward) X3 d i r e c t i o n . Love (1927) expanded t h e s o l u t i o n t o i n c l u d e t h e a c t i o n of a d i s t r i b u t e d normal load.
The procedure for determining the deformation of a ha l f - space by a concent ra ted force and u l t imate ly a d i s t r ibu ted p re s su re l oad may be sum- marized as fol lows : 1
a . The equat ions of equi l ibr ium and t h e s t r e s s - s t r a i n r e l a t i o n s f o r a homogeneous, i s o t r o p i c , e l a s t i c s o l i d a r e e x p r e s s e d i n t e r m s o f d i s p l a c e - ments. The r e s u l t is a sys tem of d i f fe ren t ia l equa t ions known as Navier ' s equat ions .
b. Kelvin (1848) gives a p a r t i c u l a r s o l u t i o n t o N a v i e r ' s e q u a t i o n s fo r t he cond i t ions o f a concen t r a t ed fo rce ac t ing downward a t t he o r ig in a long t h e x 3 - a x i s w i t h i n a n e l a s t i c s o l i d . The normal s t r e s s e s f o r t h i s s o l u t i o n are seen to vanish everywhere on the p l ane x3=0 except a t t h e o r i g i n ; t h e s h e a r s t r e s s e s do not vanish upon t h i s p l a n e .
c . Kelvin 's solut ion can be used in conjunct ion with the p r i n c i p l e o f s u p e r p o s i t i o n t o o b t a i n a n o t h e r s o l u t i o n . The stress d i s t r i b u t i o n i n t h e body i s de te rmined for a c e n t e r of compression (equal and opposite forces ac t ing a long t he t h ree coord ina te d i r ec t ions ) a t t h e o r i g i n . I t i s then assumed tha t cen te r s o f compress ion a r e l oca t ed a l l a long t he nega t ive x3 -ax i s , and t h e stress d i s t r i b u t i o n f o r t h i s c o n d i t i o n is determined by i n t e g r a t l n g t h e r e s u l t f o r s i n g l e c e n t e r s a l o n g t h e x 3 - a x i s from 0 t o -03. I t is f o u n d f o r t h i s s o l u t i o n a l s o t h a t t h e normal s t r e s ses van i sh i n t he p l ane x3=0 , excep t fo r a concen t r a t ed fo rce a t t he o r ig in , and t h a t t h e s h e a r s t r e s s e s do not vanish on t h i s p l a n e .
lSee appendix B for the comple te der iva t ion
24

d. By combining t h e two so lu t ions w i th a su i t ab le ad jus tmen t of t h e two c0nstant.s involved, it i s p o s s i b l e t o o b t a i n a stress d i s t r i b u t i o n such t ha t t he p l ane X =O is free from both shear and normal stresses and a concent ra ted force a c k on t h e o r i g i n . These are the cond i t ions fo r a con- cent ra ted force ac t ing on a ha l f - space .
e . The so lu t ion fo r t he concen t r a t ed fo rce can be gene ra l i zed t o yield displacements produced by a s u i t a b l y r e s t r i c t e d c o n t i n u o u s d i s t r i b u t i o n of normal loads, giving
2 W +W
-m
where U13U2 ~ u 3 a re t he d i sp l acemen t s i n t he x1,x2,x3 d i r e c t i o n s , r e spec t ive ly
(S , r l ) o f t h e x3=0 plane P(S,rl) is t h e d i s t r i b u t e d normal load acting a t t h e p o i n t
X1 yx2, x3 is t h e p o i n t a t which the d i sp lacements a re computed X,U a r e t h e Lame' e l a s t i c c o n s t a n t s
r = (x,-<> + (X2 - rl)2 + x 2 3 and
25

These i n t e g r a l s are d i f f i c u l t t o e v a l u a t e u n l e s s t h e n a t u r e o f t h e l o a d p ( 6 , ~ ) a n d t h e area over which it acts are s impl i f i ed . A discrete approximation of t h e s p a t i a l d i s t r i b u t i o n of t h e N-wave a t a g i v e n i n s t a n t of time was sub- s t i t u t e d f o r t h e c o n t i n u o u s l o a d , p ( c , ~ ) . Each N-wave was cons idered to have a s t r a i g h t l e a d i n g e d g e ( r a t h e r t h a n a hyperbol ic edge) because on ly the por t ion of t he l oad w i th in a few hundred feet of a g iven po in t con t r ibu te s s ign i f i can t ly to the d i sp lacement a t t h a t p o i n t . Over t h i s small a d i s t ance , t he cu rva tu re of the wave f r o n t i s i n s i g n i f i c a n t . U t i l i z i n g i n f o r m a t i o n s u p p l i e d from p res - sure measurements of N-wave r i s e t i m e s , wave l eng ths , and maximum overpressures , N-waves f o r s e l e c t e d f l i g h t s were modeled as aggregates o f d i s c r e t e f o r c e s p e r each square meter, and equations ( 2 ) were considered as summations over a l l square 'meters of the loaded a rea . Equations ( 2 ) a re t hen wr i t t en :
where p (5,q) i s t h e d i s c r e t e l o a d on a square meter , the cen ter of which i s a t ( 5 , ~ ) . The displacements were determined as a d i s c r e t e f u n c t i o n of time by a l lowing the modeled N-wave t o assume v a r y i n g p o s i t i o n s r e l a t i v e t o t h e obse rva t ion po in t , t he pos i t i ons be ing based on t h e a i r c r a f t s p e e d and d i r ec t ion supp l i ed from rada r t r ack ing da t a . These functions were numeri- ca l ly d i f f e ren t i a t ed t o g ive t heo re t i ca l ve loc i ty s e i smograms .
26

6 . COMPARISON OF FIELD RECORDINGS AND THEORETICALLY-PREDICTED VALUES
Ten missions were selected for comparison of the seismograms recorded a t EAFB and TFSO with theoret ical se ismograms computed from the geo log ic models and t h e c h a r a c t e r i s t i c s o f r e c o r d e d N-waves. The ten miss ions used were se l ec t ed because t hey r ep resen t several d i f f e r e n t t y p e s o f a i rcraf t and a wide range of maximum overpressures .
Table 3 g i v e s t h e p e r t i n e n t i n f o p a t i o n f o r t h e m i s s i o n s c o n s i d e r e d . Figure 55 shows tha t t he obse rved and t h e o r e t i c a l l y p r e d i c t e d ( u s u a l l y maxi- mum) v e l o c i t i e s f o r e a c h o f t h e m i s s i o n s s e l e c t e d a g r e e well with each other . Figures 56 through 64 show the observed seismograms superposed on theoreti- c a l l y p r e d i c t e d seismograms f o r a ver t ica l se i smograph loca ted on t h e l a k e b e d f o r 9 o f t h e 10 missions. The b a s i c seismic s igna tu re i s well descr ibed by the theory , a l though many secondary features including the a i r -coupled waves and r e f l e c t i o n s a r e n o t . The t h e o r e t i c a l r e s u l t s a r e v a l i d f o r t h e lake bed posi t ions (1 and 4 ) . To t e s t t h e v a l u e o f t h e t h e o r e t i c a l p r e d i c t i o n s f o r a geological environment which does not satisfy the conditions of a h a l f - space as wel l as t h e lake bed, a t h e o r e t i c a l seismogram was c a l c u l a t e d f o r mission TONTO 2 a t seismometer posi t ion 2-67 a t t h e Tonto Forest Observatory. Table 1 shows t h e 2-67 env i rons t o be l aye red . A t h i n l a y e r ( 0 . 4 3 meters) w i th ve loc i ty 183 meters / second over l ies a second layer (2 .92 meters th ick) w i th ve loc i ty 548 meters/second. The seismometer was b u r i e d t o a depth of 2 . 1 meters , near the middle of the second layer . The ve loc i ty i n t he s econd l a y e r was used in model ing the p roper t ies o f the ha l f - space . F igure 65 shows the comparison of the theoretical and observed seismograms obtained for mission TONTO 2 a t p o s i t i o n 2-67 a t the Tonto Forest Observatory. Surpris ingly close agreement is seen between the theoretical and observed maximum v e l o c i t i e s , although correspondence between the wave forms o f t he two v e l o c i t y seismograms i s not as good as the correspondence between theoretical and observed seis- mograms from the lake bed a t EAFB.
27

I Table 3. Da t a for missions used in comparison -~ o f t h e o r e t i c a l .-___ and observed seismograms
AIRCRAFT GEOLOGY
Mission
1-1
75-1
86-1
85-1
117-1
79- 1
1 2 2 - 1
117-2
61-1
Tonto 2
Type
XB-70
F-104
B-58
B-58
F- 104
F-104
B-58
B-58
F-104
B-58
A 1 t i tude Mach ( K f t )
1 .5 37.2
1 .5 49.6
1.64 36.1
1.63 36.0
1.65 26.4
1 .5 50.4
1.65 48.6
1.65 48.0
1.65 29.6
1.65 48.0
Max. over -
pres su re ( l b / f t 2 >
2.61
.92
1.86
2 . 2 2
1.48
.49
1.20
1.48
1.25
1.08
Period of
N-wave (=c>
.224
. l o 3
.159
,161
.075
. 1 1 2
.182
.194
.077
.176
Rise time
of N-wave (set>
.002
.008
.007
.007
.002
.008
.009
.007
.002
.020
Seismo- meter depth
(m)
1.1
1.1
1.1
1.1
1.1
1.1
1.1
1.1
1.1
2 . 1
Compres- s i o n a l
v e l o c i t y (m/sec>
600
600
600
600
600
600
600
600
600
548
Esti- mated shea r
v e l o c i t y (m/sec>
245
245
245
245
245
245
245
245
245
293
Density (Gm/ cm3)
2.00
2.00
2.00
2.00
2.00
2.00
2.00
2.00
2.00
2.00

7. CONCLUSIONS
We conclude the fol lowing from t h e r e s u l t s of t h i s s t u d y :
a. The maximum ground par t ic le ve loc i ty p roduced by a s o n i c boom i s l i n e a r l y r e l a t e d t o t h e maximum overpressure o f the boom, i n t h e r a n g e of overpressures between 0.5 and 5.0 pounds per square foot . Experimental r e s u l t s i n d i c a t e t h a t e a c h pound per square foo t o f overpressure p roduces about 100 p/sec peak p a r t i c l e v e l o c i t y on low-density rock and about 75 u/'sec on high-densi ty rock.
b. A t heo re t i ca l e s t ima t ion t echn ique based on t h e e l a s t o s t a t i c deformation of a ha l f space g ives good agreement with experimental results f o r t h e p e a k p a r t i c l e v e l o c i t i e s r e s u l t i n g from a given N-wave a c t i n g on a pa r t i cu la r geo logy .
c. The damage p o t e n t i a l o f t h e p e a k p a r t i c l e v e l o c i t i e s p r o d u c e d by s o n i c booms i s wel l below t h e damage thresholds accepted by the United S t a t e s Bureau of Mines and o ther agencies .
d. Peak p a r t i c l e v e l o c i t i e s r e c o r d e d on t h e l a t e r a l edge of the son ic boom pressure envelope a re a t tenuated by a fac tor o f about 6 r e l a t i v e t o peak p a r t i c l e v e l o c i t i e s o b s e r v e d u n d e r t h e a i r c r a f t .
e . Focusing of seismic energy due to backward propagation from the hyperbol ic in te rsec t ion of the shock cone and the ground was not observed.
f . Peak p a r t i c l e v e l o c i t i e s r e c o r d e d a t a depth of 44 f e e t were a t t enua ted by a f a c t o r o f 75 r e l a t i v e t o t h o s e r e c o r d e d a t the su r f ace .
g. Good ev idence for the ex is tence o f ve loc i ty-coupled Rayle igh waves was found f o r one r e c o r d i n g s t a t i o n , These waves did not produce the maximum pa r t i c l e ve loc i ty a s soc ia t ed w i th t he boom. The l a t e r a l u n i f o r m i t y of near -sur face l ayer ing and ve loc i ty d i s t r ibu t ion necessa ry fo r such waves t o b u i l d up s u f f i c i e n t l y t o c o n s t i t u t e a menace t o s t r u c t u r e s seems un l ike ly .
29

8. RECOMMENDATIONS
8 . 1 T h e o r e t i c a l r e s u l t s i n d i c a t e t h a t t h e p e a k p a r t i c l e v e l o c i t y is n o t o n l y l i n e a r l y r e l a t e d t o maximum overpressure , bu t is a l s o r e l a t e d , i n a more complicated manner, t o t h e N-wave r ise time and wave length . No quan t i - t a t i v e i n v e s t i g a t i o n o f t h e e f f e c t o f these parameters was made i n t h i s s t u d y , bu t some p r e l i m i n a r y r e s u l t s i n d i c a t e t h a t a d e c r e a s e i n r i s e time, f o r a given maximum ove rp res su re , migh t s ign i f i can t ly r educe t he peak pa r t i c l e ve loc i ty , a l though no t necessar i ly reducing the maximum displacement. Because t h e damage p o t e n t i a l o f v i b r a t i o n s i s more c l o s e l y r e l a t e d t o p a r t i c l e v e l o c i t y than t o d i sp l acemen t fu r the r i nves t iga t ion o f t he ro l e s o f N-wave r i s e time and N-wave pe r iod i n peak pa r t i c l e ve loc i ty migh t be wor thwhi l e .
8 . 2 T h e o r e t i c a l r e s u l t s i n d i c a t e t h a t knowledge o f t he s e i smic shea r wave v e l o c i t y , as well as the seismic compressional wave v e l o c i t y , i s needed f o r a c c u r a t e t h e o r e t i c a l p r e d i c t i o n s o f maximum p a r t i c l e v e l o c i t i e s . Although reasonable es t imates o f the se i smic shear ve loc i ty can be made through knowledge of the compressional veloci t ies used in conjunct ion with publ ished values of compress iona l / shea r ve loc i ty r a t io s ob ta ined by labora tory s tud ies o f var ious m a t e r i a l s , a s was done i n t h i s s t u d y , t h e t h e o r e t i c a l e s t i m a t i o n t e c h n i q u e developed should ideal ly be ver i f ied by using experimentally-determined values o f i n s i t u s h e a r v e l o c i t i e s . The measurement o f s h e a r v e l o c i t i e s p r e s e n t s a ser ious problem because previously-arr iving compressional waves d i s t u r b t h e record; however , recent invest igat ions (Whitcomb, 1966) ind ica te p romise for a method u t i l i z ing angu la r acce l e romete r s as t r ansduce r s . The app l i ca t ion o f such a technique and the use o f measured shear ve loc i t ies should be u t i l i z e d to r igorous ly de te rmine the accuracy of the es t imat ion technique over a wide r a n g e o f s h e a r v e l o c i t i e s .
8 .3 Peak p a r t i c l e v e l o c i t i e s p r o d u c e d by son ic booms depend g r e a t l y on geologic condi t ions in the immedia te v ic in i ty o f the po in t o f observa t ion . I t would t h e r e f o r e b e v a l u a b l e t o b u i l d a ca t a log o f seismic measurements of son ic booms f o r a wide var ie ty o f loca l envi ronments . If a shea r ve loc i ty measurement technique could be developed, and the accuracy of the theoretical e s t ima t ion t echn ique ve r i f i ed , as recommended i n s e c t i o n 8 . 2 , t he ca t a log of son ic boom measurements could be replaced by a ca ta log of equa l ly-va luable bu t much more easi ly-obtained shear veloci ty measurements . Catalogs of these types should be va luable in es t imat ing ground mot ions resu l t ing from N-waves "a f t e r - the - fac t " ( fo r example , subs t an t i a t ing o r r epud ia t ing s t ruc tu ra l damage claims r e l a t e d t o s o n i c boom induced seismic energy) .
30

9 . ACKNOWLEDGEMENTS
We are i n d e b t e d t o t h e A i r Force Technical Applications Center, VELA Seismological Center , for the use of the f a c i l i t i e s a t t h e Tonto Forest Seismological Observatory and the Uinta Basin Seismological Observatory. United States A i r Force personnel prepared the seismometer si tes and loca t ions a t Edwards A i r Force Base, A. C . Morgan and H . K. King made t h e f i e l d r e c o r d i n g s . The NASA LRC provided pressure, radar , and meteorological data . George Gerlach provided valuable advice and assis tance throughout the s tudy and edi ted the f inal manuscr ipt . John Cook was i n s t r u m e n t a l i n t h e o r i g i n a l c o n c e p t , i n de f in ing t he s cope o f t he p ro j ec t , and i n p rov id ing adv ice t h roughou t t he program. Martin Robinson provided valuable assistance in solving various instrumentat ion problems.
31


APPENDIX A
MISSIONS _ . MONITORED IN THE SEISMIC EFFECTS STUDY
DATE MISSION. A I RCRAFT MACH NO. ALT I TUDE
31 . O C T , 66 17-.l F104 1'06 31
17-2 R 5 8 1.61 4806
18-1 R 5 8 '1.057 47.3
.18-2 f 1 0 4 1.61 3100
19-1 F104 1 0'64 3005
19-2
20-1
20-2
03 NOV 66 13-1
13-2
13-3
SR 1
SR2
04 NOV 66 8 K 1
8K2
8 K 3
8K4
8 K 5
Oe NOV 66 21-1
22- 1
24- 1
25- 1
26- 1
27-2
28-2
29-2
R 5 8
0 58
F104
R 5 8
X R 7 0
F104
S97 1
SR7 1
F104
F104
F104
F104
F304
R 5 8
H58
058
t3 58
R58
858
€3 58
~ 5 a
0
1.51
1065
1.69
1.61
1.51
1.64
I 6.7
1.62
e
3 0
30 02
20.7
32.6
32.8
47
47.5
47.7
46.6
47.9
4704
480 0
47.4
33
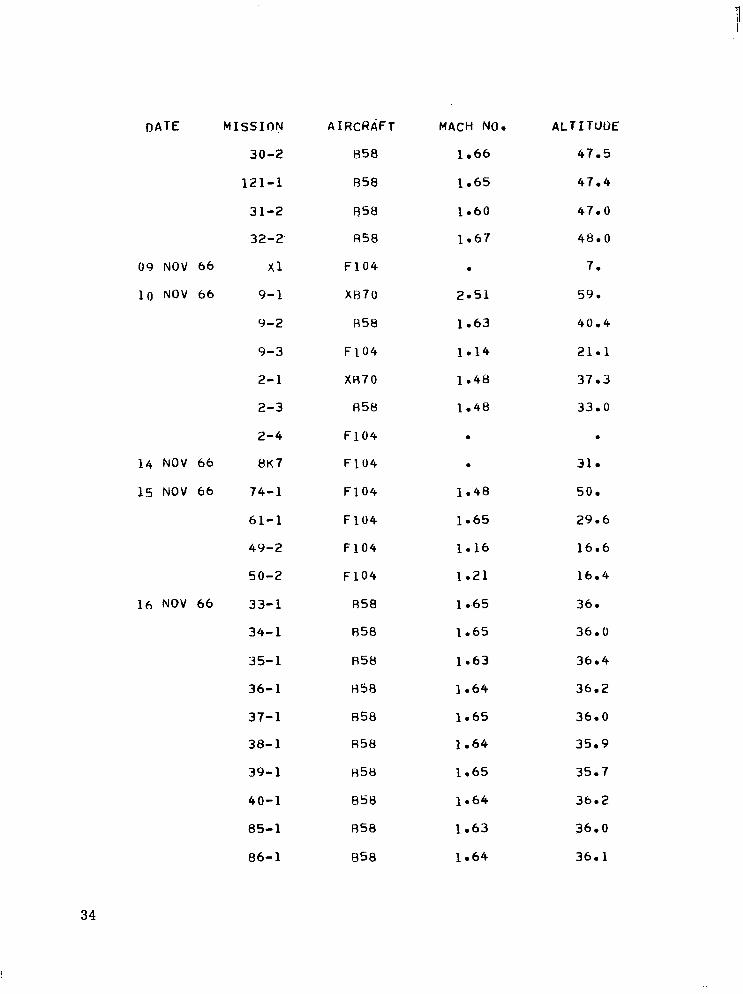
i
DATE MISSION
0 9 NOV 66
10 NOV 66
1 4 NOV 66
15 NOV 66
16 NOV 66
30-2
121-1
3 i - 2
32-2.
x 1
9- 1
9-2
9-3
2- 1
2-3
2-4
8K7
74-1
61-1
49-2
50-2
33- 1
34- 1
35- 1
36- 1
37-1
38- 1
39- 1
40-1
85-1
86- 1
AIRCRAFT
I358
858
R58
R58
.F104
XB70
H58
F104
X R 7 0
A58
F104
F104
F104
F104
F104
F104
A58
R58
R 5 8
A58
I358
R58
H58
B58
R58
B58
.
ALT I TUOE
47.5
47.4
470 0
48.0
7 0
59 . 40 04
21.1
37.3
33.0
0
31
50
2906
16.6
1604
36 0
36.0
3604
36.2
360 0
35.9
35.7
360 2
360 0
36.1
34

DATE MISSION
17 NOV 66 8.7- 1
88- 1
41-1
SR3
21 NOV 66 42-1
43-2
44-2
45- 1
46- 1
47-2
48-2
23 NOV 66 10-1
10-2
1-1
1-3
1-4
29 NOV 66 51-2
64-2
76-2
77-2
SR7
30 NOV 66 62- 1
73-1
63- 1
75- 1
SR8
A IHCRAFT
R58
R58
R58
SR7 1
BSR
R58
R58
R58
R 5 8
H58
I358
XR70
I358
XH70
R58
F104
F104
F104
F104
F104
SR7 1
F104
F104
FlO4
F104
S R ~ 1
.MACH NO.
. .
.
.
.
ALTITUDE
36
36; 3
36.3
.
. 25.9
36.4
3 6.. 0
35.9
35.8
36.0
s9 . 32.4
37.2
32.4
18.6
16.
29.4
50.4
48.8
. 30
50.1
29.6
49.6
.
35

D A T E MISSION
0 1 DEC 66
02 DEC 66
O h DEC 66
0 7 UEC 66
OR Df i c 66
36
8K18
8K19
SR9
S R 1 0
SRI 1
8K2O
8K2 1
117-1
1 17-2
118-1
118-2
65-2
52- 1
53-1
66-2
78-2
79-1
67-1
54- 1
119-1
221-1
122-1
123- 1
124-1
125-1
126-1
A I RCRAFT
F104
F104
SR7 1
SR7 1
SR7 1
F104
F104
F104
R58
H58
F104
F104
F104
F 1 04
F104
F104
F 104
F104
F104
F104
H5B
h5e
R50
H 58
R58
858
.
ALT I TUDE
30
30.0
.
.
. 30.8
30.2
26
48.0
48.7
26.1
29
17.0
17.1
30.1
50
50.4
29.6
16.5
26.4
47 . 48.6
47.6
48.2
48.2
50.2
-. -. "" .- "_. .-. ._, . ..- . ... , . -._ ..__... .. , ,

r
DATE MISSION
127-2
SR12
128-2
1'29-2
130-2
131-2
132-2
S'R 1 3
09 DEC 66 62-2
69-1
56- 1
57- 1
SR14
12 DEC 66 5- 1
5-2
3- 1
3-3
3-2
3-4
SR15
13 DEC 66 SH16
SH17
SR18
RKCJ A
16 OEC 66 11-1
11-2
AIRCRAFT
058
SR7 1
R58
El58
058
R58
858
SH7 1
F104
F104
F104
F104
SR7 1
R 5 8
XR70
658
F 1 0 4
XH70
F104
SR7 1
SR7 1
SR7 1
SR7 1
H58
F104
R 5 8
.
.
ALTITUDE
49.0
. 4 1 0 6
48.8
48.4
48.5
48.3
. 50
29.6
16.5
16.0
. 36
59. 1
32.4
. 37.6
1'1.8
.
.
.
. 45.5
20 . 40 0 2
37

ATE MISSION
11-3
4- 1
4-2
SR 1-9
SH20
17 DEC 66 SR21
19 DEC 66 SR22
20 DEC 66 83-2
7 1,-2
72-2
58-2
59-2
6- 1
6-2
14-1
14-2
14-3
SR73
.04 JAN 67 12-1
12-2
12-3
1 i 3 - 1
113-2
1 13-3
06 JAN 67 SH27
09 JAN 67 R K S l O
A IRCHAFT
XB70
858
X870
SQ7 1
SR 7'1
SR7 1
SR7 1
F104
F104
F104
F104
F104
R58
XH70
XR70
R58
F104
SR7 1
R 5 8
XH70
F 104
I358
XR70
F104
SR7 1
F104
.
.
. 1.65
2.50
1.42
1.65
1.81
1 m40
s
1 m30
ACT I TUDE
59.4
32.0
36.6
.
.
.
. 5 0
30 -6
34.3
16.8
16.6
35.5
60.0
59.7
38.8
21 04
. 39 . 60.3
22.0
39. 1
60.3
20 06
. 3 0
38

DATE MISSION
8Ks11
'RK,SI 3
8KS14
RKS16
8KS17
8KS19
8KS2O
TFXl
AKS21
1 0 JAN 67 S R 2 8
13 JAN 67 7- 1
7-3
15-3
15-1
15-2
S R 2 9
16 J A N 67 TFX2
FF 1
FF2
FF3
17 J A N 67 tl- 1
8- 3
16-1
16-2
16-3
SH30
AIRCRAFT
F104
F104
F104
F104
F104
F104
F104
F l l l
F104
SH7 1
H58
XR-70
F104
XP70
I358
SH71
F l l l
T38
138
T38
H58
X R 7 0
R58
xs70
F104
SR 7.1
.
ALT ITUOE
30.0
30-0 6
30.1
31 04
30.7
30.0
30.5
40.9
21.4
. 35 . 60.3
20.2
60.6
39.6
. 35 . 60.0
39.7
59.7
20.6
. 39

D A T E M I S S I O N
S R 3 1
18 JAN 67 FF4
FF5
FF6
16 FEt! 6 7 T O N T l
Tol'JT2
SRP 1
TONT3
21 FEB 67 TONT5
TONT6
TONTi'
TONT8
02 MAR 6 7 U INT~
U I N T 2
IJIfuT3
A,IRCHAFT
SR7 1
F 1 0 4
F 1 0 4
F 1 0 4
f358
I358
S R 7 1
1358
I358
R58
Hs8
R58
858
I358
H58
MACH N O .
0
AL7 I TUOE
0
0
0
0
4 8
4 8 0 O
40

APPENDIX B
DEFORMATION OF Ah' ELASTIC HALF-SPACE
The complete system of equat ions of equi l ibr ium of a homogeneous i s o t r o p i c e las t ic s o l i d is composed of the fo l lowing two equat ions :
(a) Equations o f equi l ibr ium
T i j , j + F i = o ( i , j = 1 , 2 , 3 )
( b ) S t r e s s - s t r a i n r e l a t i o n s
where
A 6 . - 8 + 2~ e i j 1J
a r e body fo rces
a r e t h e s t r e s s e s
a r e Lame's e l a s t i c c o n s t a n t s
i s the Kronecker del ta
i s t h e d i l a t a t i o n
a r e t h e s t r a i n s
i n a term implies summation as the index tha t i s repea ted t akes on values of 1, 2 , and 3. A comma i n t h e s u b s c r i p t i n d i c a t e s d i f f e r e n t i a t i o n w i t h r e s p e c t t o t h e i n d i c e s f o l l o w i n g t h e comma.
The d i l a t a t i o n , 0 , i s given by
where
e i j = 1 / 2 ( u i ,j + u j ,i>
and u i are the components o f displacement.
41

and
o r
of
In o r d e r t o express (1) i n terms of d i s p l a c e m e n t s , s u b s t i t u t e f o r e e i j i n ( l b ) , g iv ing ,
= i j = Adijuk,k + U U i , j j + F i = 0 (2)
These are known as Navier ' s equat ions.
I t is n e c e s s a r y t o o b t a i n t h e g e n e r a l s o l u t i o n o f (3) by adding so lu t ions
t o p a r t i c u l a r s o l u t i o n s o f ( 3 )
Kelvin (1848) was r e spons ib l e fo r a so lu t ion o f Nav ie r ' s non-homogeneous equat ions g iven in (3 j , namely
where r2 = (x1 - + (x2 - Sz) + (X3 - 5 ) g ives t he d i s t ance from t h e f i e ld po in t (x1 ,x2 ,x3 ) t o a var iab le po in t f s1 ,SZ,S3) ins ide v . The Fi(G) are the components of t h e body fo rce Fi i n terms of the var iable o f i n t e g r a r l o n 5,.
2
Suppose t h a t t h e f o r c e s a r e d i s t r i b u t e d o v e r a reg ion v (which inc ludes S ) , which i s a par t o f v . Also , suppose tha t the forces vanlsh in the remainder of v. The r e s u l t a n t o f t h e body forces on v1 i s
1
F~~ =J Fidv
V 1
Let Fi i nc rease s o t h a t t h e i n t e g r a l has a f i n i t e limit Fio as v i is made t o approach zero. This gives the impression of a concent ra ted force F i o a t S i .
Equation ( 4 ) can be rewrit ten as
42

S u b s t i t u t i n g from (5) and d i f f e ren t i a t ing unde r t he s econd i n t eg ra l :
where u is the displacement produced a t x i by a f o r c e F i ' a t S i , p rov ided t ha t x i # Si. Because of the problem of xi=Si, t h e p o i n t is assumed t o b e s u r - rounded by a small sphere o f r ad ius a . The s o l u t i o n s i n t h e r e m a i n i n g r e g i o n then correspond to the deformation present i n a body v with a cav i ty o f r ad ius a , s u b j e c t e d t o f o r c e s w i t h r e s u l t a n t F i o .
If the coordinate axes are chosen so t h a t F acts a t t h e o r i g i n , t h e n 5 i = ( O , O , O ) - 1
Also, i f F l o = 0 , F20 = 0 , and F30 = P , then from (7)
u1 = C - x1x3 r 3
where
x2x3 u2 = c , 3
X+3P 1 x3 2
u3 = c [ - r * + 1.-] 2 ( X + l J ) P r = x.: x: and C =
Equations (8) represent the d i sp lacement a t xi i n a medium due t o a force P appi ied wi th in a sphere of rad ius a .
I t will now be necessa ry t o compute t h e s t r e s s e s and t r a c t i o n s o v e r t h e sphe re . Reca l l i ng t he s t r e s s - s t r a in r e l a t ions ,
we f i n d ,
43

T12 = 5 r
I t should be no ted tha t on the p lane X = 0 , t h e normal stresses vanish.
The t r a c t i o n s T. produced by t h e s e stresses over the sphere o f rad ius
3
r = a are determined trom
T i = T. v l j j
wi th = ‘j/ a
We g e t T1 - - -6pCx1~3
a4
-6pCx2~3
4 T2 = a
and on i n t e g r a t i n g o v e r t h e s u r f a c e of t he sphe re r = a , we f i n d ,
S s S s -8~rpC(X+2p)
A + l J do = 0 , T2do = 0 , T3do =
S
These are t h e components o f t h e r e s u l t a n t f o r c e e x e r t e d on S by m a t t e r e x t e r i o r t o S.
44

Whatever t h e r a d i u s o f t h e c a v i t y may be , t h i s sys t em o f t r ac t ions i s s t a t i c a l l y e q u i v a l e n t t o a s ing le fo rce , app l i ed a t t he o r ig in , d i r ec t ed a long t h e a x i s o f Z i n t h e p o s i t i v e d i r e c t i o n , and of magnitude 8~rpC(A+2p)/(A+p).
Boussinesq (1885) determined another solution of Navier 's equation for the condi t ions of : (1) a f o r c e a c t i n g a t t he o r ig in a long x and (2) no change of volume f o r p o i n t s l o c a t e d a l o n g t h e n e g a t i v e Z a x i s . The s o l u t i o n s are:
3
D r
- u3 - - where r2 = X . X and D = cons t . l i
This is c a l l e d t h e d i l a t a t i o n l e s s s o l u t i o n o f N a v i e r ' s e q u a t i o n s . I t may e a s i l y b e v e r i f i e d t h a t t h i s i s a s o l u t i o n by s u b s t i t u t i o n i n t o N a v i e r ' s equa t ion fo r t he cond i t ion o f 0 = 0. Equations (12) represent a s o l u t i o n f o r the displacement a t any p o i n t i n t h e body except the o r ig in and p o i n t s on t h e nega t ive Z a x i s . The s t r e s s e s i n t h e body from t h i s s o i u t i o n can be computed from t h e s t r e s s - s t r a i n r e l a t i o n s h i p which g ives :
2
2 1 x3
= -2pD - r 3 T33
X 1
r 3 T
13 = -2pD -
x2 = -2pD - T 23 r 3
I t should be noted from equation (13) that the normal stress on the p l ane x3 = 0 is zero.
45

The t r a c t i o n s o v e r t h e s u r f a c e o f t h e s p h e r e o f r a d i u s a are:
X 1 x2
r 2 (r+x3) r2 (r+x3) T1 = -2pD , T2 = -2pD
1 T3 = -2pD -
r 2 , r = a
The components of t h e r e s u l t a n t f o r c e Ri exe r t ed on the sphere by t h e m a t t e r e x t e r i o r t o t h e s p h e r e a r e :
R1 = fil d o = 0
S
R2 = f i 2 do = 0
S
R = /. do = -8rpD 3 3
s
We will now cons ider a semi - in f in i t e r eg ion x3 2 0 t o be occupied by an e l a s t i c medium and assume t h a t a concent ra ted force P , appl ied a t t h e o r i g i n , a c t s i n t h e p o s i t i v e d i r e c t i o n o f x3. S ince t he po in t o f app l i ca t ion of t he load i s a s i n g u l a r p o i n t i n t h e s o l u t i o n of Nav ie r ' s equa t ions , we d e l e t e i t from the r eg ion x3 1. 0 by desc r ib ing a hemisphere o f small r ad ius a and c o n f i n e o u r a t t e n t i o n t o t h e s e m i - i n f i n i t e r e g i o n bounded by t h e x3 = 0 p lane .
We s h a l l c o n s t r u c t a s o l u t i o n s u c h t h a t t h e r e s u l t a n t o f a l l e x t e r n a l s t r e s s e s a c t i n g on the hemisphere i s P and ~ 1 3 = ~ 2 3 = T~~ = 0 o v e r t h e r e s t of the boundary.
Forming t h e sum of the displacements of (8) and (12) , we o b t a i n
46

The p r i n c i p l e o f s u p e r p o s i t i o n i n s u r e s t h a t t h e d i s t r i b u t i o n o f t r a c t i o n s over the sur face o f the hemisphere cor responding to the sum o f t he d i sp l ace - ments can be obtained by summing t h e t r a c t i o n s i n (10) and (14). Equations (11) and (15) show t h a t t h e r e s u l t a n t f o r c e on the hemisphere acts i n t h e x3 d i r e c t i o n and has magnitude
-4rl~C(X+2l~) R = - 4rl~D
A+p
This is one-ha l f the sum of the va lues g iven by equations (11) and (15) where in the in tegra t ion was per formed over the en t i re sphere .
S i n c e t h i s r e p r e s e n t s t h e a c t i o n of t h e medium on the hemisphere, we equate R t o - P and ge t t he equa t ion
involv ing two unknown cons tan ts C and D.
Using the boundary condition ~ 1 3 = T~~ = T~~ = 0 on x3 = 0 , we can obtain another equat ion involving these constants . Therefore , a t x3 = 0 ,
Then,
-2lJCX1 P 2UDx1 - - '13 3 * --" - 0
r x +lJ r 3
-2vcx2 lJ 2~Dx2 r 3 A+lJ r 3
- '23 - - "= 0
' 33 = o
47

giv ing
o r
and
P c = - 4nu
S u b s t i t u t i n g C and D i n to equa t ion (16 ) ,
P 'lX3 P X u = - - 1 1 . -
4 TJ r 3 4.rr(X+!~) r ( r + x g )
P x2x3 P x2 u = - . - -
2 4 w r 3 4.rr (X+p) r ( r+x3)
Equations (24) are t h e s o l u t i o n t o t h e d i s p l a c e m e n t a t any po in t o ther t h a n t h e o r i g i n i n a n i s o t r o p i c , e l a s t i c h a l f - s p a c e d u e t o a concent ra ted force a t t h e o r i g i n . Some ins ight in to the reasoning behind the combina t ion of two p a r t i c u l a r s o l u t i o n s f o r a n e x t e n d e d s o l i d t o g i v e a s o l u t i o n f o r a ha l f - space may be obtained f rom the fol lowing points :
(a) A t l e a s t two s o l u t i o n s were needed i n o r d e r t o make t h e s h e a r stresses van i sh i n t he p l ane x = 0 . For example, i f on ly the f irst s o l u t i o n had been used, we would have ai) x = 0 , 3
48

-2pcx2 lJ T -
23 - . - = o
r A +?J 3
But th i s can be t rue on ly i f C = 0 o r x = 0 and x = 0. However, i f C = 0, a l l displacements vanish, g iving a t r i v i a l s o l u t i z n , and i f x1 = 0 and x2 = 0, r = 0, which i s a s i n g u l a r p o i n t o f t h e s o l u t i o n . We therefore need t o add i n t h e s h e a r stresses due t o a n o t h e r s o l u t i o n , which has another con- s t a n t , and make t h e sum of t he shea r stresses vanish.
1
(b) No more than two s o l u t i o n s are needed because only two addi t iona l condi t ions are n e c e s s a r y t o s p e c i f y a concen t r a t ed fo rce ac t ing on a s t ress-free boundary, namely, the vanishing of the shear s t resses and t h e s p e c i f i c a t i o n o f t h e v a l u e o f t h e sum of the concentrated forces a t the o r i g i n .
(c) The p a r t i c u l a r two so lu t ions used were u t i l i zed because they a r e two most r e a d i l y - o b t a i n a b l e s o l u t i o n s i n which a concen t r a t ed fo rce ac t s downward a t t h e o r i g i n and the normal s t r e s ses van i sh on the p lane x3 = 0. If ne i the r t he shea r no r t he normal s t r e s s e s had vanished on the p lane , super - pos i t i on o f t he two s o l u t i o n s would have been i n s u f f i c i e n t t o o b t a i n t h e d e s i r e d f i n a l s o l u t i o n .
The s o l u t i o n s (24 ) can be general ized to yield the displacements in a ha l f - space due to a cont inuous load d i s t r ibu t ion . If we l e t p(5,r-t) be the d i s t r i b u t e d normal load acting a t t h e p o i n t ( c , n ) o f the p lane x = 0 , t h e r e s u l t a n t f o r c e P on an element of area da i s P = p ( 5 , ~ ) da. 3
I n s e r t i n g t h i s i n (24) , we o b t a i n
-m -m 3
49


REFERENCES
Blackman, R. B . , and Tukey, J. W . , 1958, The measurement of power s p e c t r a : New York, Dover, pp. 159.
Boussinesqu, J . , 1885, "Applicat ions des potent ie ls . . . 1 1 . . Paris.
Cook, J. C . , 1965, Seismic effects o f son ic booms, Proposal 1-380, Teledyne Industr ies , pp. 1.
Crandel l , F. J . , 1949, Ground v i b r a t i o n due t o b l a s t i n g and i t s effect upon s t r u c t u r e s , J o u r . Boston SOC. Civ. Eng., pp. 222-245.
Dibblee, T. W . , 1960, Geology o f t h e Rogers Lake and Kramer Quadrangles, Cal i fornia: Geologic Survey Bul le t in 1089-B, pp. 137.
Dobrin, M . B . , 1952, Introduct ion to geophysical prospect ing: New York, McGraw-Hill, pp. .220.
Duvall, W. I . , and Fogelson, D . E . , 1962, Review of c r i t e r i a fo r e s t ima t ing damage t o r e s i d e n c e s from blas t ing v ibra t ions , Repor t o f Inves t iga t ions 5968, U. S. Dept. o f t h e I n t e r i o r , Bureau o f Mines.
F e r r i , A . , e t a l , 1961, The theory o f sonic bangs : Progress in aeronaut ica l s c i ences , London, Pergamon Press .
Geotechnica l Corpora t ion , 1965, Ins ta l la t ion of a 10-element shallow-buried a r r a y a t the Uin ta Basin Seismological Observatory, Vernal, Utah: Technical Report No. 65-28, p. 1-15.
Gupta, I . N . , 1966, Standing waves i n a layered ha l f space , BSSA, vol. 56, NO. 5, pp. 1153-1161.
Love, A. E. H . , 1927, Theory o f e l a s t i c i t y : Cambridge.
Press, F . , and Ewing, M . , 1951a, Ground ro l l coup l ing t o a tmosphe r i c compressional waves: Geophysics, vol. 16, p. 416-430.
Press, F . , and Ewing, M . , 1951b, Theory of air-coupled flexural waves: Jour . App. Phys ics , vo l . 2 2 , p . 892-899.
Press, F . , and Ol iver , J . , 1956, Model s tudy of air-coupled surface waves: Jour . Acous. SOC. h e r . , vol. 27, p. 43-46.
Rol le r , J . C . , Jackson, W. H . , Warren, D. H . j and Healy, J . H . , 1964, A prel iminary s tudy of a se i smic - re f r ac t ion su rvey i n t he v i c in i ty o f t h e Tonto Forest Observatory, Arizona: Technical Letter Number 23 of U. S. Geol. Surv. , 57 p.
51

REFERENCES f continued)
Sonic Boom Experiments a t Edwards A i r Force Base. Prepared for the Nat iona l Sonic Boom Evalua t ion Off ice by S t a n f o r d R e s e a r c h . I n s t i t u t e , Contract AF 49(638)-1758, July 28, 1967.
Uni ted S ta tes Army Corps of Engineers, 1959, Traffic Evaluat ion Tests of Rogers Dry Lake, Cal i fornia: Miscel laneous Paper No. 4-265.
Westhusing, J . K . , 1966, The e f f e c t o f c r u s t a l s t r u c t u r e on t e l e s e i s m i c P-wave t r a v e l time anomalies a t t h e TFSO extended array, Arizona, Geotech Technical Report No. 66-17, pp. 11-20.
52

Figure 1. Ver t ica l sec t ion showing the son ic boom shock wave in t e rac t ing w i th t he ground
G 3438

Figure 2 . Loca t ions o f the t es t areas used for the s tudy of t he s e i smic e f f ec t s o f sonic booms
G 3439

I
I I I 1-1
~
I
DATA I
AND TAPE I
SIGNAL . - f ::
I
- 1 17373 I I
CHRONO - CONDITIONEF - - - - .. Ilk METER I
I MODEL
I 25031
RELAY‘ VlSlCORDER
OSCILLOGRAPH SEISMOMETER F I E L D ‘ 7 G - z I f ::
MODEL
18300
CABLE I T I I
- CONTROL M-H MODEL
MODEL 1406 - 20136 DATA CONTR-OL . I I PANEL Iwwv RECEIVER[
SEISMOMETER
BURIED
IN F I E L D
WVTR I S-P‘MODEL
SUPPLYING PULSE I TO RECORDERS. I
I I I I I
RECORDING
EQUIPMENT
I * AMPLIFIER AND SIGNAL CONDITIONER LOCATED AT SEISMOMETER END OF FIELD CABLE FOR LONG LENGXHS’OF CABLE.
A POINT OF INSERTION OF VARIABLE FREQUENCY VARIABLE AMPLITUDE SINE WAVE FROM WIDE RANGE OSCILLATOR, H-P MODEL 200 CD.
Figure 3. Block diagram of one seismograph of the mobile equipment G 3440

I \
\ \ EDWARDS AIR FORCE
BASE [EAFB] ROGERS DRY LAKE
MAGNETIC
NORTH
NORTH
0 SEISMOMETER LOCATIONS
x MICROPHONE LOCATIONS
A 8000-FOOT MICROPHONE ARRAY LOCATION
DRY LAKES - PLAYA CLAY
\ \
0 - QUARTZ MONLONlTE
OUTCROP
Figure 4 . Map o f t he Edwards Air Force Base t e s t a r e a showing the planned a i r c r a f t f l i g h t tracks, seismometer locations, and t h e
associated microphone locations G 3441


DIRECTION OF FLIGHTS ON
16 FEBRUARY /
REFRACTION
L I N E
/
T" DIRECTION OF FLIGHTS
7 21 FEERUARY
0 MOBILE UNIT SEISMOMETER 111' 15 'W
LOCATIONS
MODIFIED OESERVATORY
SEISMOMETER LOCATIONS
= MOBILE UNIT RECORDING
TRAILER
0 T FSO RECORDING STATION
SCALE
0 - 5000 FT
0 1 KM
Figure 6 . Locat ions o f t he s e i smomete r s u sed i n t he son ic boom seismic measurements program a t the Tonto Fores t
Se ismologica l Observa tory
G 3443
58

FLIGHT PATH FOR
UINTA 2 AND 3 -
S C A L E
0 500 METERS - 0 1000 FT.
Figure 7. Locations of the seismometers used in the sonic boom seismic measurements program at the Uinta Basin
Seismological Observatory
G 3444
59

SW WE
METERS
ZOO0
1000
SEA LEVEL
1000
too0
3000
TERTIARY
CRETAGEWS
3URASS10
Figure 8. Hypothet ical cross-sect ion of the Uin ta Upl i f t and Uinta Basin G 3445

Separation from
shot hole (meters)
302
272
242
212
182
152
1 2 2
92
74
65
62
60
I0
r l l
I A
Figure 9. Typj
\
r l
1 refract ion-survey record. The larRe excursion on channel 3 is t h e f i r i n g p u l s e
I
G 3446

T
Ti
SECOND ARRIVAL
XC
\ FIRST 4RRIVAL rlME
L<', SLOPE:- I
VO
X
B C "I
T - = TRAVEL T I M E
X = DISTANCE
V = COMPRESSIONAL WAVE VELOCITY
Figure 10. Ray pa ths o f least time and the t ime-d is tance curve f o r two layers separa ted by a horizontal i n t e r f a c e
G 3447
62

0.18
0.1 6
0.14
0.1 1
t 0.1(
I;
s z 0
vl
0.0
z
I_ YI
0.0
0.a
0.1
0.
W E S T
0 100 200 300 400 500 600 700 800 900 1000 1100
D I S T A N C E IN F E E T “c
Figure 11. Time-distance curve f o r the seismic refract ion survey a t Edwards Air Force Base G 3448

0.1 SECOND
Figure 1 2 . Hypothetical seismogram showing cha rac t e r i s t i c phases measured i n t h e s o n i c boom study 0 3449

CLASS CLASS
7 B O W
4 BOW -+" ""_ " 9 STERN
5 STERN
IO RUMBLE
Figure 13. Schematic diagrams of the ten typical types of bow and stern velocity seismograms
G 3450
65

M I S S I O N 45-1
I 0.1 SEC.
J
Figure 14. Seismogram recorded by a seismometer located on well-consolidated rock (position 5) at Edwards Air Force Base for a B-58 overflight
G 3451

,
MISSION 2-1
0.1 SEC. 1 I
Figure 15. Seismogram recorded by a seismometer buried in the clay lake bed (pos i t ion 1) at Edwards Air Force Base f o r an XB-70 overflight
G 3452

M I 5 5 I O N 75-1
0.1 SEC
Figure 16. Seismogram recorded by a se i smometer bur ied in the c lay lake bed (posi t ion 4) a t Edwards Air Force Base f o r an F-104 o v e r f l i g h t
G 3453

MISSION PEAK VELOCITY = 120 p/SECOND
TONTO 5 LOCATION 2
T F S O
MISSION
TONTO 5 LOCATION 3
T F S O
MISSION ?EAK VELOCITY = 134 )r/SECOND
TONTO 5
LOCATION 4 T F S O
MISSION PEAK VELOCITY = 154 p/SECOND
TONTO 5 LOCATION 5
T FSO
MISSION PEAK VELOCITY = 76 )r/SECOND
UINTA 2
LOCATION 1
U B S O
I 0.1 SECOND
I
Figure 17. Seismograms recorded from similar B-58 overflights showing seismic signatures at the Tonto Forest and Uinta Basin observatories
G 3454

MISS I O N 8K21
VERTICAL
HORIZONTAL ALONG 350’ !- “:J N-WAVE t t
0.1 SEC.
Figure 18. High sensitivity seismograms from a three-component seismograph at Edwards Air Force Base (position 1) showing a precursor to the arrival of the N-wave
G 3455

MISSION 21-1, LOCATION I EAFB
VERTICAL
HORIZONTAL
HORIZONTAL (TRANSVERSE) PEAK VELOCITY = 5 3 )I/SLG
0.1 SEC
Figure 19. Typical three-component seismogram generated by the ove r f l i gh t of a B-58 a i r c r a f t a t Edwards Air Force Base
G 3456

N
MISSION 16-1 LOCATION 1 ,
AP = 1.68 L B I F T ~ PEAK VEL = 218.SpISEC
AT =.I70 SEC
EAFO I
7 I
0.1 SIC
MISSION 16-1 A p = 1.94 LB/FTZ LOCATION 4
PEAK VEL = 230.4pISEC
E A F B AT = 0.175 SEC
t"--------------r AP 2.12 L8/FT2 PEAK VEL = 192.7 p/SEC
0.1 SIC M I S S I O N 16-1 LOCATION 5
EAFB
AT 0.169 SIC
MISSION TONTO 1
LOCATION TFSO
A P =1.62 LO/FT2 ?EAK VEL = 150.4 p/SEC
Figure 20. Seismograms and s imi l a r p re s su re s igna tu res r eco rded a t f i ve l oca t ions f o r B-58 ove r f l i gh t s showing the va r i a t ions of t he seismograms with geological environment
G 3457

XB70 MISSION 13-2
AP = 2.00 LB/FT2 PEAK VEL 200 p/SEC
AT 0.286 SEC
AP = 1.11 L B / F T ~ V
SR 71 MISSION SR 16
PEAK VEL = 119.6 p/SEC
h P = 1.97 LB/FT2 MISSION 117-2 PEAK VEL = 131
" AT = 0.194 SEC .6 p/SEC
F 104 MISSION 16-3
0.1 StC
PEAK VEL = 145.7 p/SEC
A P = MAXIMUM OVERPRESSURE OF N-WAVE
A T : PCRlOD OF N-WAVE
i
I
Figure 2 1 . Seismograms produced by the ove r f l i gh t s o f fou r d i f f e ren t t ypes o f a i r c r a f t r e c o r d e d by a seismometer on wel l -consol idated
rock (posi t ion. 5) a t Edwards Air Force Base

AP = 1.90 L B / F T 2 PEAK VEL = 250.0 p/SEC X B70 AT = 0.303 SEC
A P = 0.925 LB/FT2 SR 71 PEAK VEL = 98.0 p/SEC
PEAK VEL 218.5 p/SEC
F104
MISSION 15-3
L\ p = 1.97 LB/FT2
A T = 0.73 SEC PEAK VEL = 256.8 p/SEC
AP = MAXIMUM OVERPRESSURE OC +WAVE
AT = PERIOD OF N-WAVE
I 0.1 SEC I
Figure 2 2 . Seismograms produced by t h e o v e r f l i g h t s o f f o u r d i f f e r e n t t y p e s o f a i r c r a f t r e c o r d e d by a seismometer on a clay lake bed
( p o s i t i o n 1) a t Edwards Air Force Base

3.5
3 .O
N h
F 0
3; 2.5 CI z 3 0
e
4 ril a 2.0 2 In w a a Lrl >
1.5
E 3
< X 3:
= 1.0
0.5
0 1 0 0 200 300
MAXIMUM PARTICLE VELOCITY (MICRONS/SECOND)
Figure 23. Relat ion o f maximum overpressure for B-58 o v e r f l i g h t s . t o peak pa r t i c l e ve loc i ty obse rved on a v e r t i c a l seismograph located
on a c lay l ake bed ( p o s i t i o n 1 ) a t Edwards Air Force Base G 3460

. " . . ..
5 .O
4.5
4:O
3.5
6 2 0 0 W In \ fn 2 3.0 0 a E
>
8 2 . 5
w -I
> w -1
c
0
t: v
0 5 2.0 P z 3 E X Q E
- 1.5
1 .o
0.5
0 100 300 200
M A X I M U M OVERPRESSURE (POUSDS:FOOT~)
Figure 24. Relation of maximum o v e r p r e s s u r e f o r F-104 o v e r f l i g h t s t o peak pa r t i c l e ve loc i ty obse rved on a ver t ica l se i smograph
loca ted on a c lay l ake bed (pos i t ion 1) a t Edwards A i r Force Base
G 3461'
76

3.5
3.0
N h
I- O
3; 2.5
z 3 0 a w er: 3 2.0 m m Lrl er: a m Lrl
0
z n
v
1.5
r 3
X < E
2
1 .o
0.5
0
Figure 25. Relat ion o f maximum overpressure f o r SR-71 o v e r f l i g h t s t o peak p a r t i c l e v e l o c i t y o b s e r v e d on a ver t ical se ismograph located
on a c lay lake bed (posi t ion 1) a t Edwards Air Force Base
400
G 3462

3 . 5
3 .O
N - e 0 e 2.5 \ v) P z 0 a
a, ;* 2 . 0
2 v, W e a e W $ 1.5
E. 3 E z 2 1.0
0.5
0
0
0 0
I
100 200 300 400
MAXIMUM PARTICLE VELOCITY (MICRONS/SECOND)
Figure 26. Rela t ion of maximum o v e r p r e s s u r e f o r XB-70 o v e r f l i g h t s t o peak p a r t i c l e v e l o c i t y o b s e r v e d on a ver t ica l se i smograph loca ted
on a c lay l ake bed (pos i t ion 1) a t Edwards Air Force Base G 3463

3.5
3 .O
N h
b 0
". e 2.5 v) 0 z 3 0 a "
v
2.0
2 v) W ez a ez W
1.5
E 3
x 4 E 1.0
3
0.5
0
I I I I
100 200 300 400
MAXIMUM PARTICLE VELOCITY (MICRONS/SECOND)
Figure 2 7 . Relat ion o f maximum overpressure for B-58 o v e r f l i g h t s t o peak p a r t i c l e veloci ty observed on a ver t ical se ismograph located on a c l ay lake bed
(Dosit ion 4 ) a t Edwards Air Force Base G 3464 I
I
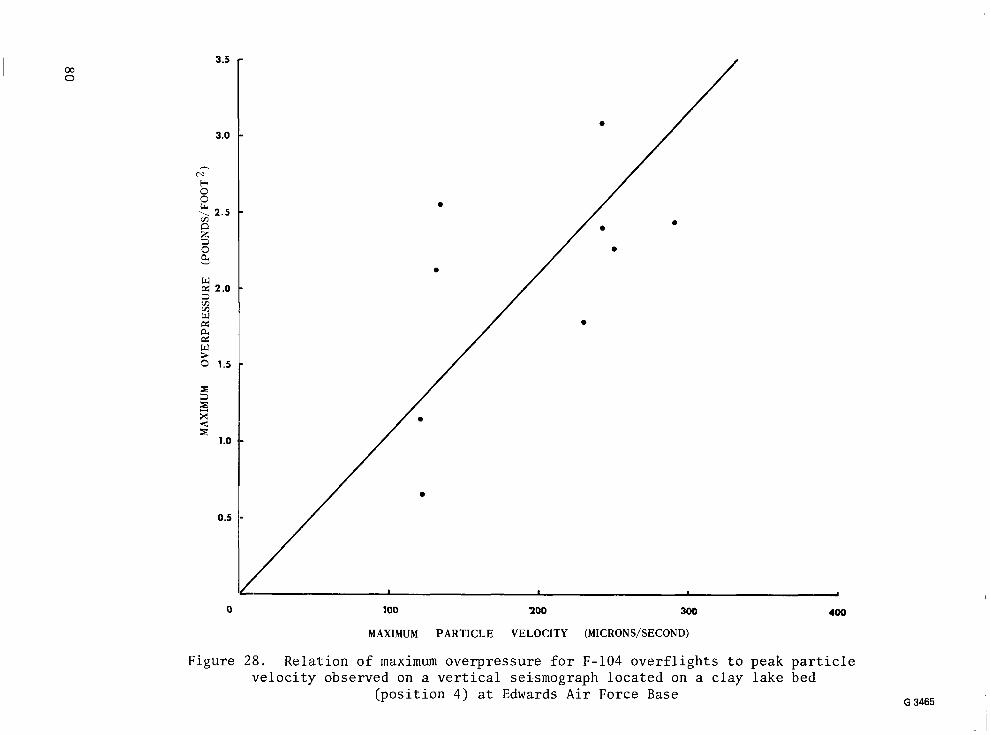
I 00 0
3.5
3.0
N h
b 0
\ 2.5 v1
z 3 0 a
2 n
v
w a 2.0 2 v) w a a
w a > 0 1.5
E 3
4 X
E
5
1 .o
0.5
0 400 100 200 300
MAXIMUM PARTICLE VELOCITY (MICRONS/SECOND)
Figure 28. Rela t ion of maximum o v e r p r e s s u r e f o r F-104 o v e r f l i g h t s t o p e a k p a r t i c l e
(pos i t i on 4 ) a t Edwards Air Force Base ve loc i ty obse rved on a v e r t i c a l sei.smograph located on a c l ay lake bed
G 3465
i

I
3.5
3.0
N h
F 0 i? z \ 2.5
z 3 v 2 w ci 3 2.0 m m w d a d > 0
1.5
z 3
X < z
5
1 .o
0.5
0 1 0 0 200 300 400
MAXlMUM PARTICLE VELOCITY (MICRONS/SECOND)
Figure 29 . Relat ion o f maximum ove rp res su re fo r SR-71 o v e r f l i g h t s t o peak p a r t i c l e veloci ty observed on a ver t ical se ismograph located on a c lay lake bed
(pos i t i on 4) a t Edwards Air Force Base G 3466

3.5
3 .O
w: a. 2.0
0 . 5
0 100 200 300
MAXIMUM PARTICLE VELOCITY (MICRONS/SECOND)
400
Figure 30. Relation of maximum overpressure for B-58 overflights to peak particle velocity observed on a vertical seismograph located
on a well-consolidated rock outcrop (position 5) at Edwards Air Force Base
G 3467

5.5
5.0
4.5
- - 0 N c 0 0 Lk , E! 5 5
a m
0
w- 3 v)
M .o !x
w m
0 >
n
2 z 2.5
X * z z
2.0
1.5
1 .o
0.5
0
L
- " - -. L 1w 200 300 400
MAXIMUM PARTICLE VELOCITY (MICRONS/SECOND)
Figure 31. Relation of maximum overpressure f o r F-104 overflights to peak particle velocity observed on
solidated rock outcrop (position 5) at a vertical seismograph located on a well-con-
Edwards Air Force Base
G 3468
83
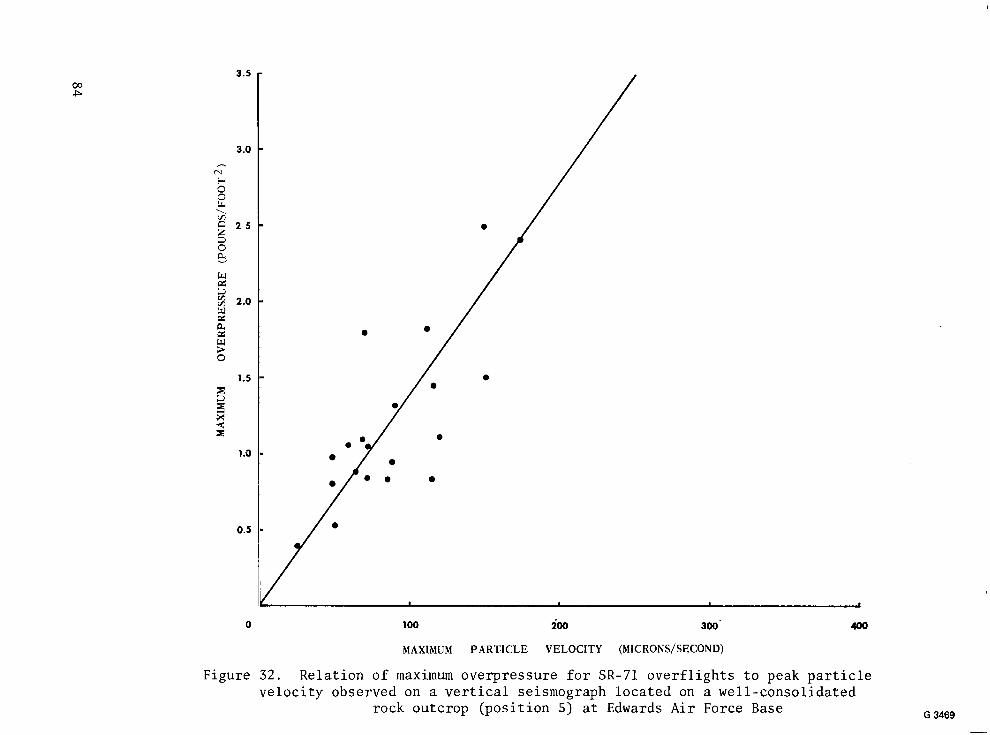
3.5
3 .O
N h
I-I 0 0 Lr, \ v,
2 5 2 0 8 w a 3
w a a a w 0 >
2 2.0
1.5 E a X < E
5
1 .iJ
0.5
0
e
e
e
e
I I 1 I
1 0 0 200 300' 400
MAXIMUM PARTICLE VELOCITY (MICRONS/SECOND)
Figure 32. Relation of maximum overpressure for SR-71 overflights t o peak particle velocity observed on a vertical seismograph located on a well-consolidated
rock outcrop (position 5) at Edwards Air Force Base G 3469 -

3.5 -
3.0 -
N
- + 0
2.5 - \ m n z 3 0 a v
2.0 - a m 3 VI w a a a 9 1.5 0
-
r. 2 3 2 1.0 - 1
0.5 -
L 1 1 J
0 1 0 0 200 300 400
MAXIMUM PARTICLE VELOCITY (MICRONS/SECOND)
Figure 33. Relation of maximum overpressure for XB-70 overflights to peak particle velocity observed on a vertical seismograph located on a well-consolidated
rock outcrop (position 5) at Edwards Air Force Base G 3470

3.5
3.0
+ 0 2 3; 2.5 n z 3 0 a w ai m 3 2.0 m W a a a w > 0
1.5
E 3
X
E
z
1 .o
0.5
0 100 200 500
MAXIMUM PARTICLE VELOCITY (MICRONS/SECOND)
400
Figure 34. Relation of maximum o v e r p r e s s u r e f o r B-58 o v e r f l i g h t s t o p e a k p a r t i c l e v e l o c i t y observed on a s e i s m o g r a p h o r i e n t e d r a d i a l t o t h e f l i g h t track and loca ted
on a c l ay lake bed (pos i t ion 1 ) a t Edwards Air Force Base G 3471

3.5
3.0
N h
+ 0 0 ". !+ 2.5 v) 0 z 3 0 a W v
v) m W a CI:
mi W >
5 2.0
1.5
E 3
X 4 r 3
1 .o
0.5
0
e l e
1 I I I
1 0 0 200 300 400
MAXIMUM PARTICLE VELOCITY (MICROhJ'SECOND)
Figure 35. Relat ion of maximum overpressure for B-58 o v e r f l i g h t s t o p e a k p a r t i c l e veloci-ty observed on a se i smograph o r i en ted t r ansve r se t o t he f l i gh t
t r ack and loca ted on a c lay lake bed (pos i t ion 1 ) a t Edwards Air Force Base G 3472
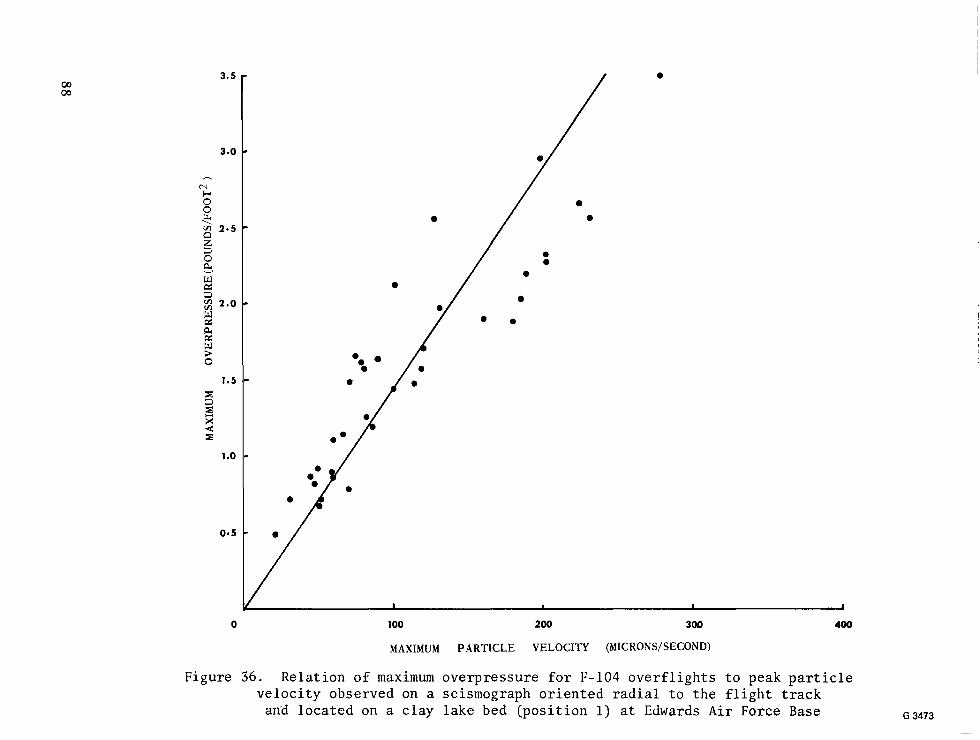
0 400
Figure 3 6 . Rela t ion of maximum o v e r p r e s s u r e f o r F-104 o v e r f l i g h t s t o p e a k p a r t i c l e ve loc i ty obse rved on a se i smograph or ien ted rad ia l t o t h e f l i g h t track
an’d loca ted on a c l a y lake bed (pos i t i on 1 ) a t Edwards Air Force Base

3.5
3.0
N h
B 0 0 Lr, ".
2.5 z 0
W ez
a 5
a 2.0
W a oi a W > 0
1.5 r a I X < E
1 9 0
0.5
0 100 200 300 400
MAXIMUM PARTICLE VELOCITY (MICRONS/SECOND) Figure 37. Relat ion of maximum overpressure for F-104 o v e r f l i g h t s t o peak p a r t i c l e
veloci ty observed on a se i smograph o r i en ted t r ansve r se t o t he f l i gh t
Edwards Air Force Base t r a c k and loca ted on a c l ay lake bed (posi t ion 1) a t
G 3474

W 0
3 05
3.0
N h
b 0 0 Lr, 3; 2.5 n z 3
v
w a 2 2.0 v) w a a a w > 0
1.5
z 3 E x 4 E
- 1 .o
0.5
0
I I I I
100 200 300 400
MAXIMUM PARTICLE VELOCITY (MICRONS/SECOND)
Figure 38. Rela t ion of maximum o v e r p r e s s u r e f o r XB-70. o v e r f l i g h t s t o peak p a r t i c l e ve loc i ty obse rved on a s e i s m o g r a p h o r i e n t e d r a d i a l t o t h e f l i g h t track and
loca ted on a c l ay lake bed (pos i t i on 1 ) a t Edwards Air Force Base G 3475

3 5
3.0
N - b 0 e 2.5 \ m tl z 2 0 a v
2.0
2 ln W
a d d W
1.5
z 3 z X < -
1.0
0.5
0
I I I i
100 200 300 400
MAXIMUM PARTICLE VELOClTY fMICRONS/SECOND)
Figure 39. Relat ion of maximum overpressure for XB-70 o v e r f l i g h t s t o peak p a r t i c l e veloci ty observed on a seismograph or iented t ransverse t o t h e f l i g h t
t r a c k and loca ted on a clay lake bed (pos i t i on 1 ) a t Edwards Air Force Base G 3476

I
A
2.5 h
N
b 0 0 L4 \ v)
g 2.0
2 3
v
cr: w v, 3
2 15
a cr: w > 0
E LO 3
X 4 z 3
0.5
0
B
B
0' I
50 100 150 0 50 100 150
C
LOCATION 66 T FSO
MAXlMUM PARTICLE VELOCITY (MICRONS/SECOND)
0 50 1 0 0 150
Figure 40. Rela t ion o f maximum o v e r p r e s s u r e f o r B-58 o v e r f l i g h t s t o peak p a r t i c l e v e l o c i t y on ver t ica l se i smographs a t the Tonto Forest Seismological Observatory G 3477

A
0 50 100 150
E
0
0
LOCATION 67 T F S O
I I
/ LOCATION T F S O 67 I I
0 50 100 150
MAXIMUM PARTICLE VELOCITY (hlICRONS/SECOND)
C
0 I
50 100
Figure 41. Relation of maximum overpressure for B-58 overflights to peak particle velocity on vertical seismographs at the Tonto Forest Seismological Observatory and
the Uinta Basin Seismological Observatory G 3478

0 0
0
0
a a m a
a -. !a a
a
a
0
o o
0 0
0 O 0 0 G
- 0
60 -
so -
'I-
B 40 Y
- w 0 3
I- -I
- - L
a 30 -
20 -
10 - a 6-56
0 F-104
I 1
100 200 300
MAXIMUM PARTICLE VELOCITY (MICRONS/SECOND)
0
Figure 42. Relation of altitude to peak particle velocity for the B-58 and F-104 f o r supersonic overflights G 3479

7 0.1 SEC
Figure 43. Seismograms showing the attenuation with depth of the ground particle velocity
G 3480

SOURCE OF
SEISMIC DISTURBANCE I ~~~ ~
CAR PASSING 45 F E E T FROM SEISMOMETER ON CLAY
SEISMOMETER ON CLAY MAN WALKING U P TO
SEISMOMETER ON HARD ROCK CAR PASSING 30 F E E T FROM
FREQUENCY AT WHICH MAXIMUM VELOCITY OCCURRED (HZ)
70
100
80
55
OVER SEISMOMETER ON CLAY SUBSONIC F-111, 500 FEET,
F-104 IN TOUCH-AND-GO 0-YERATIONS RECORDED BY
SEISMOMETERON HARDROCK
SONIC BOOM FROM F-104 A T 31,000 FEET, MACH 1.65. RECORDEDON YARDROCK / / / / / / / / / / / / / / / / / I
100
12s
71
A T 47.300 FEET, MAGH 1.57, SONIC BOOM FROM 8-58
RECORDEDONHARDROCK
SONIC BOOM FROM XB-70 A T 60,000 FEET, MACH 1 .8. RECORDEDONHARDROCK
71
72
A T 50,000 FEET, MACH 1.48, SONIC BOOM FROM F-104
RECORDEDONCLAP- 1 / 1 1 1 / 1 1 1 1 1 1 1 1 / 1 1 4 125
NON-BOOM SOURCE = SONIC BOOM SOURCE T//I
I I I I
0 100 200 300
MAXIMUM PARTICLE VELOCITIES (MICRONS/SECOND)
Figure 4 4 . Maximum p a r t i c l e v e l o c i t i e s and a s soc ia t ed f r equenc ie s o f va r ious types of c u l t u r a l n o i s e and s e l e c t e d s o n i c booms
G 3482 i

Figure 4 5 . Three-component seismograms recorded for a man walking near seismometers located on the clay lake bed (pos i t ion 1 ) a t
Edwards Air Force Base G 3482

W m
SENSITIVITY
Figure 46. Three-component seismograms recorded for the take-off of an F-104 aircraft two miles from seismometers on the clay lake
bed (position 1) at Edwards Air Force Base G 3483

r
a 3 w
a 0
w l- 2 a
a A
1 10
FREQUENCY (HERTZ)
100
Figure 4 7 . Power spectrum o f a seismogram recorded a t p o s i t i o n 4 on the l ake bed a t Edwards Air Force Base. The source o f
t h e d i s t u r b a n c e was an F-104 f l y i n g a t 20,000 f ee t and Mach 1 . 4
G 3484
99

W 5 I- U - J W U
104
103
102,
101
100
10-1
10-2
FREQUENCY (HERTZ)
Figure 48 . Power spectrum o f a seismogram recorded a t p o s i t i o n 4 on the l ake bed at. Edwards A i r Force Base. The source of d i s tu rbance was a B-58 f l y i n g a t 40,000 f e e t a t blach 1 .65
G 3485
100

K w % 0 a
W
I-
-I 4
K w
2
104
103.
102'
101
100
10-1
10-2
Figure 49 . Power spectrum of a seismogram recorded a t p o s i t i o n 4 on t h e lake bed a t Edwards A i r Force Base. The source o f
t h e d i s t u r b a n c e was an XB-70 f l y i n g a t 60,000 f e e t a t Mach 1 . 8
G 3486
101

1 10
F R E Q U E N C Y ( H E R T Z )
100
Figure 50. Power spectrum o f a seismogram recorded a t p o s i t i o n 1 on t h e lake bed a t Edwards A i r Force Base. The source of t h e d i s t u r b a n c e
was an XB-70 f l y i n g a t 60,000 fee t a t Mach 1 . 8
G 3487
102

104
103
102
101
100
10-1
10-2
1
Figure 51. Power spectrum of a seismogram recorded a t p o s i t i o n 4 on the l ake bed a t Edwaras Air Force Base. The source of
t h e d i s t u r b a n c e was an XB-70 f l y i n g a t 60,000 f e e t and Mach 1 . 8
10
FREQUENCV (HERTZ)
100
G 3488
103

w 3 0
a
n
FREQUENCY (HERTZ)
Figure 52. Power spectrum of a seismogram recorded a t p o s i t i o n 5 a t Edwards A i r Force Base. The s o u r c e o f t h e d i s t u r b a n c e
was an XB-70 f l y i n g a t 60,000 fee t and Mach 1.8
G 3489
104

Y
0 UI
A
OUARTZ MONZONITE
PEAK VELOCITY =264p/SECOND
B
POSITION I ON A PLAYA CLAY LAKE BED
C - c POSITION 4 ON A PLAYA CLAY LAKE BED
I 0.1 SEC I
Figure 53. Sonic boom se ismic s igna tures for t h ree d i f f e ren t pos i t i ons a t
mission Edwards
13-2 (XB-70) recorded a t Air Force Base
G 3490

1 .0 r
.9 -
.8 -
.7 -
.6 -
.5 -
4-
.3 - .2 - - 1 -
I
P
PERIOD (SECI
Figure 54. Theoret ical Rayleigh wave.dispers ion curves for the dry lake area a t Edwards Air -Force Base and the empir ica l re la t ionship be tween a i r c ra f t
v e l o c i t y and the dominant periods observed on the seismograms G 3491

0 O B S E R V E D
0 T H E O R E T I C A L
I- O
0 k
0 .. 2.5
5 1.5 VI 1 117-1 ‘ I7-P 0 . VI I
0 I
0 50 100 150 200 250 300 350 400 450 500
M A X I M U M PARTICLE V E L O C I T Y (MICRONSISECOND)
Figure 55. Comparison of maximum par t ic le ve loc i t ies observed and theo re t i ca l ly pred ic ted for the l ake bed a t Edwards A i r Force Base, as a function
of maximum overpressure G 3492

320
240
-320
-400,
I ’ J
”-
I/ L
THEORETICAL
OBSERVED
t I I I I 1 I 1 I 1 I I I
-.02 0.0 .02 .04 .06 .pa . i o . i 2 . i d .16 . l e .20 .22 .24 .26 2 8
TIME1 (SECONDS)
Figure 56. Comparison of t h e t h e o r e t i c a l and the recorded seismograms on the l ake bed a t Edwards Air Force Base for mission 1-1 G 3493

I
100
80
- n 6o
V 0
! 40 In z 0
\
2 20 - P > o t 0 0 -I 5 -20
w J
IL + -40
U 0.
I!
-60
-80
-100
I 1
I I i
,” \ I \
---- THEORETICAL
- OBSERVED
1 1 I I I I I a
-.02 0 . 0 .02 .04 .06 .08 .10 .12 .14 .16 . l 8
TIME (SECONDS)
Figure 57. Comparison o f t h e t h e o r e t i c a l and the recorded seismograms on t h e lake bed a t Edwards Air Force Base f o r mission 75-1 G 3494

160
120 ' - 0 z 0 u 80 w, \ m z 0 U
40
z 7-
u 0
w J -40
> w J
I- p:
0 - 0
t
u -80
a n -1 20
-160
-200 J OBSERVED
$ I I I I I I I I 1
- .02 0 .0 .02 .04 .06 .08 .10 .12 .14 .16 .10 .2O
TIME' (SECONDS)
Figure 58. Comparison of t h e t h e o r e t i c a l and the recorded seismograms on t h e lake bed a t Edwards Air Force Base f o r mission 86-1 G 3495,

320 r
240 - 180 - 80 -
0 "
-80 - -160 - -240 - -320 L
-" THEORETICAL - OBSERVED
t I I I I I I I I 1
-.02 0.0 .02 .04 .06 .08 .10 .12 . I 4 -16 . I 8 *20
TIME (SECONDS)
Figure 59. Comparison of t h e t h e o r e t i c a l and the recorded seismogram on t h e lake bed a t Edwards Air Force Base for miss ion 85-1 G 3496

200
160
120
80
40
0
-40
-80
-1 20
-160
-200
- - - - THEORETICAL
OBSERVED
I I I I I I 1 I I I
- .02 0 .0 .02 .04 .06 .08 .10 .12 .14 .16
TIME (SECONDS)
Figure 60. Comparison o f t h e t h e o r e t i c a l and the recorded seismogram on the lake bed a t Edwards A i r Force Base for mission 117-1
G 3497

P
w P
- - - THEORETICAL
OBSERVED
I I
0.0 .010 ,020 .030 .040 .OS0 .060 .070 .OB0 .OS0 ,100 .110
TIME, (‘SECON6Sl
Figure 61. Comparison of t h e t h e o r e t i c a l and the recorded seismogram on the lake bed a t Edwards Air Force Base fo r mi s s ion 79-1 G 3498

200 -
160 -
0 120
u
- ; ! ;i 80
a
- z 0
40 - - 2.
5. 0 -
0 J W > -40 W J u ; -80 - a <
-120 - -160 -
-200 - - - - THEORETICAL
OBSERVED
TIME (SECONDS)
Figure 62. Comparison of t h e t h e o r e t i c a l and the recorded seismogram on the l ake bed a t Edwards Air Force Base fo r mi s s ion 1 2 2 - 1 G 3499

1
150
75
0 '
-75
-1 50
b - OBSERVED
I I I I I
.02 .06 .10 .I 4 .I 8
TIME (SECONDS)
Figure 63. Comparison of t he t heo re t i ca l and the recorded seismogram on the lake bed a t Edwards Air Force Base f o r mission 117-2 G 3500 I

100
BO
60
40
20
0
-20
-40
-60
-80
-1 00
-120
-1 40
Figure 64.
I I I
' I "- THEORETICAL
OBSERVED
TIME CSECONOSI
Comparison of the theore t ica l and the recorded se i smogram on the l ake bed a t Edwards Air Force Base f o r mission 61-1 G 3501

I I-J P w -I
> V 0 J w > w J
I- K U IL
t
I!
80 -
60 - 40 -
20 -
0 -
-20 -
-40 - -60 - -80 I
\
‘ J
- - - THEORETICAL - OBSERVED
-.02 0.0 .02 .04 .OS .08 .10 .I2 .14 . I 6 -18 .20
TIME (SECONDS1
Figure 65. Comparison o f t h e t h e o r e t i c a l and the recorded seismogram a t p o s i t i o n 67 a t t he Tonto Forest Seismological Observatory for mission Tonto 2 G 3502