Embed Size (px)
Citation preview
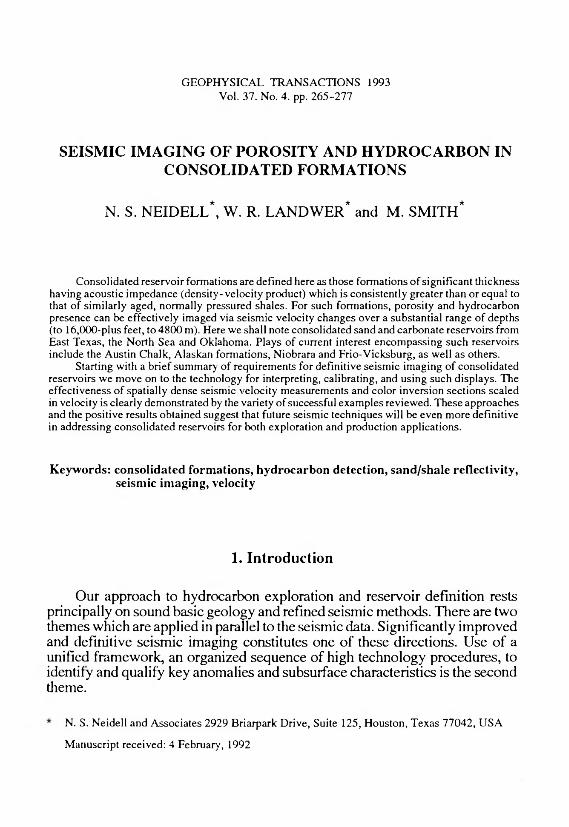
GEOPHYSICAL TRANSACTIONS 1993 Vol. 37. No. 4. pp. 265-277
SEISMIC IMAGING OF POROSITY AND HYDROCARBON IN CONSOLIDATED FORMATIONS
N. S. NEIDELL*, W. R. LANDWER* and M. SMITH*
Consolidated reservoir formations are defined here as those formations of significant thickness having acoustic impedance (density-velocity product) which is consistently greater than or equal to that of similarly aged, normally pressured shales. For such formations, porosity and hydrocarbon presence can be effectively imaged via seismic velocity changes over a substantial range of depths (to 16,ООО-plus feet, to 4800 m). Here we shall note consolidated sand and carbonate reservoirs from East Texas, the North Sea and Oklahoma. Plays of current interest encompassing such reservoirs include the Austin Chalk, Alaskan formations, Niobrara and Frio-Vicksburg, as well as others.
Starting with a brief summary of requirements for definitive seismic imaging of consolidated reservoirs we move on to the technology for interpreting, calibrating, and using such displays. The effectiveness o f spatially dense seismic velocity measurements and color inversion sections scaled in velocity is clearly demonstrated by the variety of successful examples reviewed. These approaches and the positive results obtained suggest that future seismic techniques will be even more definitive in addressing consolidated reservoirs for both exploration and production applications.
Keywords: consolidated formations, hydrocarbon detection, sand/shale reflectivity, seismic imaging, velocity
1. Introduction
Our approach to hydrocarbon exploration and reservoir definition rests principally on sound basic geology and refined seismic methods. There are two themes which are applied in parallel to the seismic data. Significantly improved and definitive seismic imaging constitutes one of these directions. Use of a unified framework, an organized sequence of high technology procedures, to identify and qualify key anomalies and subsurface characteristics is the second theme.
N. S. Neidell and Associates 2929 Briarpark Drive, Suite 125, Houston, Texas 77042, USA
Manuscript received: 4 February, 1992
266 N. S. Neideil - W R. Landwer - M. Smith
2 . Enhanced seismic imaging and display
It was recognized more than 10 years ago that as much as 80% of the stratigraphic information contained in seismic data presented in conventional black and white displays was lost due to inappropriate processing and limitations in visual dynamic range [NEEDELL, BEARD 1984 and NEIDELL, BEARD 1985]. Indeed, properly conditioned data displayed in a suitable color scheme provides a 20-fold increase in detail over black and white displays. Moreover, when the data is rescaled (semi-quantitatively) as velocity, porosity and hydrocarbon presence may be detected and confirmed under a wide range of circumstances. Velocity scaling of the seismic data also allows definitive correlations and parameter predictions when used along with well logs.
To take full advantage of the extended visual range of color displays our processing sequence seeks to produce optimally imaged data. The presentation of relative amplitudes, collapse of the wavelet to a consistent zero phase character and full prestack migration are essential. Central to our method also is our intensive analysis of the velocity field using high resolution velocity spectra which are of proprietary design. These analyses perform well at reflection times where other analyses lose their resolution (typically below about 2.0 s for land data and 3.0 s for marine).
Analyses are computed 16 per mile for land data or 12 per mile for marine surveys on fully prestack migrated CDP gathers. When interpreted with due consideration for the geological setting, these produce a velocity field which not only yields an optimum stacked section, but can be used to derive a velocity model for the final poststack migration and the background velocity trend for the acoustic impedance section.
The color seismic inversion displays are derived exclusively from seismic inputs. Correlative studies with logs are performed later and only where appropriate.
Since seismic data are band limited, trace inversion provides only partial information about changes in acoustic impedance. Interval velocities calculated from the high resolution velocity field between carefully chosen horizons generally show good correspondence to the gross features of a sonic log where it should. This allows us to use the stacking velocity not present in the individual traces. Taken alone the low frequency trend gives us valid information on a large scale of relative changes along the profile. It may also be approximately ‘matched’ to well information for better correspondence in terms of magnitude.
The seismic data is inverted, combined with the trend and scaled to velocity. It is plotted in contrasting colors at 400 ft/s (120 m/s) velocity steps, and at scales of 10 in/s to 20 in/s (0.25 m/s to 0.5 m/s) depending on the objective of the project. We now have a section which displays for the interpreter the full potential of the seismic data.
Seismic imaging o f porosity and hydrocarbon... 267
3. Unified interpretive procedure
Interpretive overlays noting anomalies and key features are prepared as a final product from the inversion color displays. Existing maps, log correlations and all prior knowledge are incorporated into the overlay and final reporting. Anomalies are examined within the framework of geometric considerations described first and quite completely in the EXXON series of papers published in AAPG Memoir [PEYTON 1977].
Of course the velocity dimension inherent in the data is used fully as well. Intensive study of all the moveout velocities unambiguously identify lithologies such as salt, plastic shales, carbonates and sand-shale sequences. Also such studies identify lateral gradients which are critical for establishing true structural geometries and making effective time-to-depth conversion. The added visibility of the stratigraphic changes which result from the improved data processing and enhanced visual dynamic range display, in conjunction with the use of both geometry and velocity information, assure that no anomalies of significance will be overlooked.
As a further component of this second theme we suggest that the existing hydrocarbon reservoirs we recognize be subdivided into two categories: sands- sandstones, and carbonates and others (i.e. fractured lavas, shales, coal seam methane etc.). Our basic studies of reservoirs on a global scale following this philosophy have provided some extraordinary results and insights.
For example, in the first category of sand-sandstone reservoirs [NEIDELL, BERRY 1989] we have studied and documented the relationships of acoustic parameters for sands and shales and found it necessary to consider depth and geologic age as independent variables. The ‘crossover’ region of more or less equal sand-shale velocity and its special properties and problems have been considered in detail — this is of course the Zone П, which separates the Bright Spot world from the more consolidated Zone HI lithologies below.
The Zone terminology was introduced in the 1986 SEG Distinguished Lecture (unpublished) to characterize Sand/Shale reflectivity relations essentially in all basins. Young unconsolidated sands should they be present, when water filled and under normal pressure conditions are lower in velocity and density than contemporary shales. This is termed Zone I regime. With age and burial the sands compact through the shale levels for velocity and density, becoming consolidated and now being the higher acoustic impedance (velocity-density product) component under analogous conditions. This is the Zone Ш environment for reflectivity. Where the transitioning in velocity and density occurs, the Zone П terminology is applied.
We see that the reduction in seismic measured velocities for hydrocarbons in the bright-spot world of Zone I is quite pronounced (1000-4000 ft/s, 300-1200 m/s). In this young, unconsolidated environment, where sand acoustic impedance is less than that of shale, the contrasts in reflection coefficient which result from gas presence can be two-fold, three-fold, even five-fold.
268 N. S. Neideil — W. R. Landwer — M. Smith
Hence we can see the signatures directly on conventional seismic displays of reflectivity where relative amplitudes have been preserved.
It is revealing that in Zone HI below the crossover Zone П, the sands and sandstones have compacted and consolidated to acoustic impedance values greater than those of the shales. Hydrocarbons again drop velocities as seen by die seismic method almost as much as in Zone I (1000-2500 ft/s, 300-760 m/s), but now the changes in reflection coefficient owing to the generally higher acoustic impedance values only approach 10-15%. This level of change can not be seen on conventional seismic displays. Fortunately, when detailed data processing preserves the information, such velocity changes are clearly observed on the color displays scaled in velocity. These displays have the capability to present such changes most clearly and put their geometry and continuity in a structural context. Hence, hydrocarbons in deeper, older formations can be detected more readily than previously believed.
It is principally in Zone П for sand reservoirs that our technology is generally least effective. Here, we can not even use synthetic seismograms for correlative purposes with any reliability. While it is true that our success in finding and defining reservoirs in Zone П is diminished, the approach described here remains the single most effective technique for working in this regime. Substantial thicknesses of Zone П (1000-10 000 ft, 300-3000 m) are frequently encountered and the economic potential matches what we find for Zone I or Ш.
Carbonate reservoirs in terms of measured seismic parameters for porosity and hydrocarbons behave much like the Zone in consolidated sands. Clearly the geometries and geologic origins are quite different for these lithologies as compared to sands and sandstones.
Once the interpretation has been formulated with all appropriate information and assistance, we address the verification phase of anomalies as a separate matter. Indicated velocity drops in structurally favorable settings and within potential reservoir units can of course relate to reservoir presence, but may also be caused by bed thinning with subsequent tuning and detuning or by lithologic change. Instantaneous frequency analysis is sometimes an effective means for recognizing tuning effects. Model studies can separate tuning effect from effects caused by parameter changes relating to lithology or hydrocarbon presence. In Zone I sand, hydrocarbon presence causes increased negative reflection amplitude-with-offset as distinguished from lithology change. For Zone Ш, amplitudes with offset decrease with hydrocarbon presence as opposed to lithology change which cause no comparable effect. RUTHERFORD and WILLIAMS [1989] have documented that amplitude-with-offset studies are largely ineffective in Zone П.
Catalogues are developed which relate porosity and pore fluid to the magnitude of the velocity anomalies which are observed. Such techniques enable calibration studies to be used for predictive purpose, and often with remarkable accuracy. Research and practical study are blended effectively in such day-to-day operational interaction.
Seismic imaging o f porosity and hydrocarbon... 269
The ability to image our objectives, qualify them and establish their quantitative significance from conventional seismic data sets these procedures apart from the standard ‘piece-meal’ and less enlightened practices. Various levels of informational synergy are given opportunities to contribute to our knowledge in this way.
We see in this procedure a unity of approach which draws together most of the newer techniques into an organized framework for validation and confidence building. The same methods, of course, most fully define reservoirs using seismic data. Taken in concert with our calibration studies and fundamental work on the relation of seismic data to well logs, an approach is continuing to evolve which in the industry is one of the most effective means for using available seismic data.
4. Examples
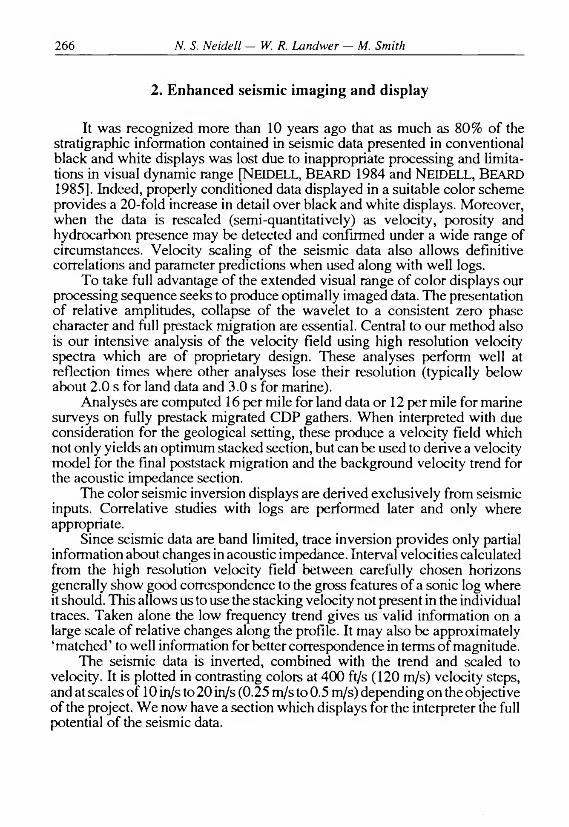
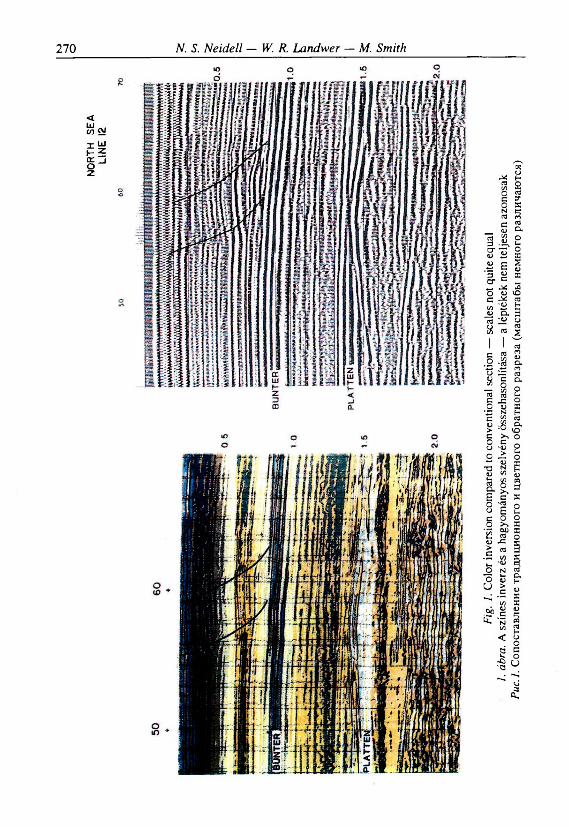
North Sea Line 12 is shown in conventional seismic display in Fig. 1. We shall concentrate on only one formation for purposes of this discussion, the Bunter Sands which are marked. Faulting above the Bunter Sands is believed to relate to evaporate dissolution. Also, a structure is seen quite clearly in the Platten Dolomite which we note for reference as well.
The more or less counterpart color acoustic impedance display is also included in Fig. 1. While the horizontal scales in the two cases are not quite the same, the differences are dramatic. Flere the Bunter Sandstone is clearly seen to be a transgressive sequence. Two of the barrier bars in particular appear to have hydrocarbon potential in terms of indicated velocity reduction. Likely porosity with hydrocarbons is seen in fact at the center of two of what are likely large Barrier Bar sand deposits. Note the white and dark blue areas at the center respectively of two of the barrier bars. Also, consider that this is an older consolidated sand formation.
We see in this case both the geologic time lines and the lithology change. The conventional black and white display has been driven well beyond the capabilities of its visual dynamic range. Well penetrations on both ends of the line beyond the portion shown indicate the member units of the Bunter sand are greater than 100 m in thickness, hence what we see is clearly not a thin bed effect. In fact, a quite similar situation is exhibited by the West Sak sands of the Кцрагок field in Alaska.
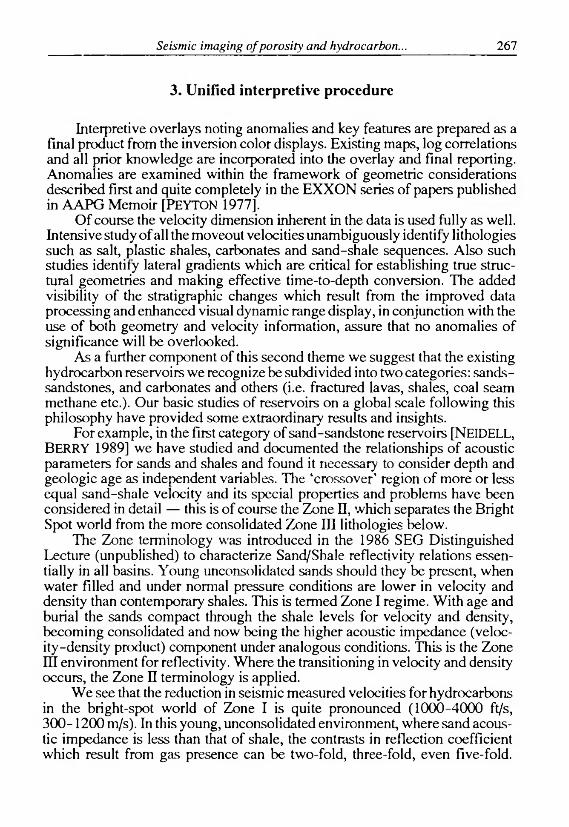
For our next example we consider the Austin Chalk in Dimmit and Zavalla counties, Texas supplied courtesy of Alliance Geophysical Co. (refer to Figs. 2 and 3). In general, Austin Chalk fracture zones are recognized by decreases in the seismic derived interval velocity within an appropriate member or unit of the Chalk as it is traced laterally. A velocity decrease between 400 to 800 ft/s (120 to 240 m/s) is considered diagnostic in terms of fracture development and oil saturation. Commercial gas accumulation would yield greater contrasts usually approaching and even exceeding 1000 ft/s (300 m/s).
NORT
H
SEA
U
NE
12
270 N. S. Neidell — W R. Landwer — M. Smith
Fig.
1. C
olor
inve
rsio
n co
mpa
red
to c
onve
ntio
nal s
ectio
n —
sca
les
not q
uite
equ
al
1. áb
ra. A
szí
nes
inve
rz é
s a
hagy
omán
yos
szel
vény
öss
zeha
sonl
ítása
— a
lépt
ékek
nem
telje
sen
azon
osak
Ри
с. I.
Соп
оста
влен
ие т
ради
цион
ного
и ц
ветн
ого
обра
тног
о ра
зрез
а (м
асш
табы
нем
ного
раз
лича
ютс
я)
Seismic imaging o f porosity and hydrocarbon... 271
1
I T o p o f u s t i n C h a l k
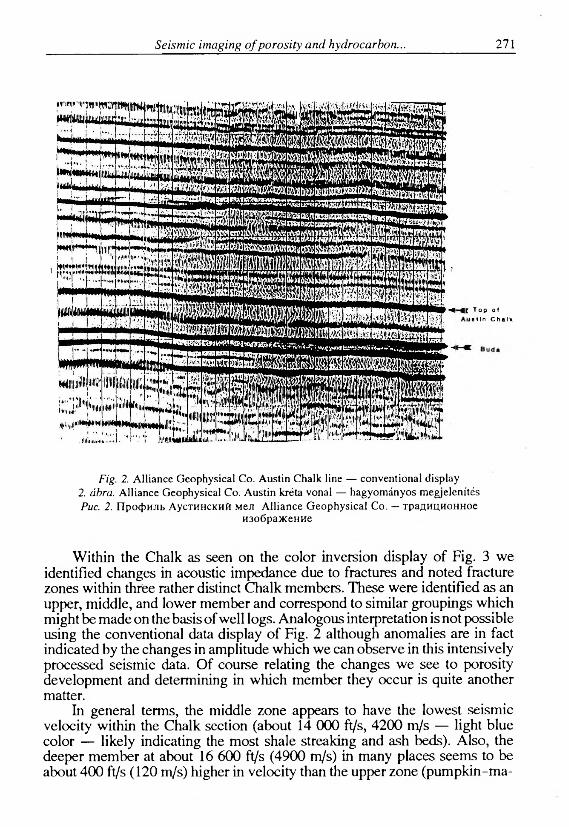
Fig. 2. Alliance Geophysical Co. Austin Chalk line — conventional display 2. ábra. Alliance Geophysical Co. Austin kréta vonal — hagyományos megjelenítés Рис. 2. Профиль Аустинский мел Alliance Geophysical Со. — традиционное
изображение
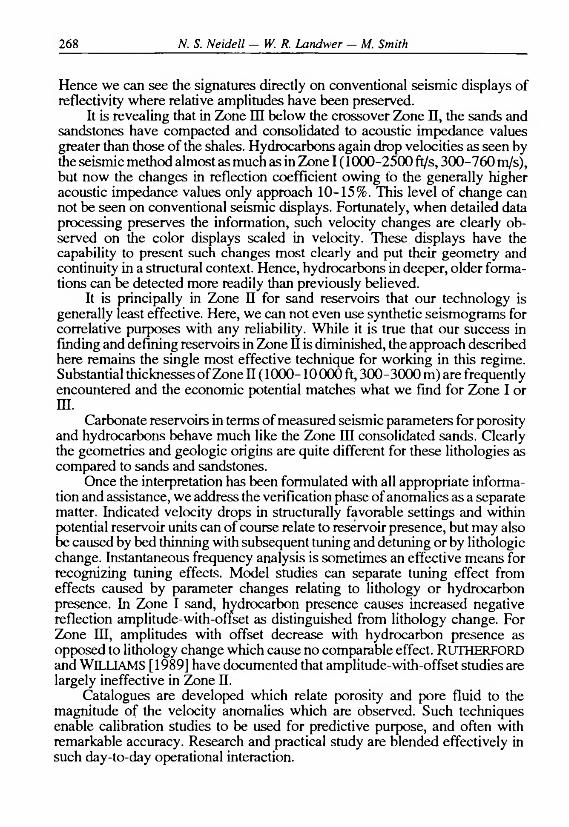
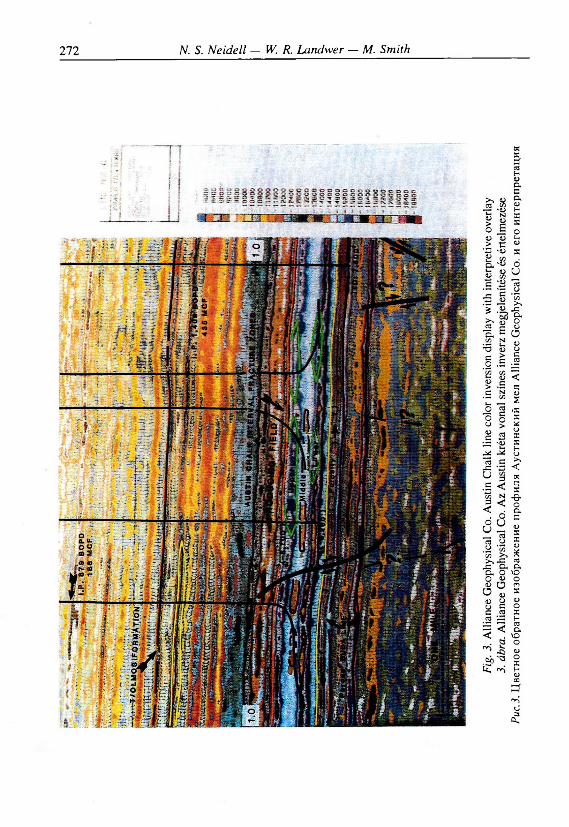
Within the Chalk as seen on the color inversion display of Fig. 3 we identified changes in acoustic impedance due to fractures and noted fracture zones within three rather distinct Chalk members. These were identified as an upper, middle, and lower member and correspond to similar groupings which might be made on the basis of well logs. Analogous interpretation is not possible using the conventional data display of Fig. 2 although anomalies are in fact indicated by the changes in amplitude which we can observe in this intensively processed seismic data. Of course relating the changes we see to porosity development and determining in which member they occur is quite another matter.
In general terms, the middle zone appears to have the lowest seismic velocity within the Chalk section (about 14 000 ft/s, 4200 m/s — light blue color — likely indicating the most shale streaking and ash beds). Also, the deeper member at about 16 600 ft/s (4900 m/s) in many places seems to be about 400 ft/s (120 m/s) higher in velocity than the upper zone (pumpkin-ma-
272 N. S. Neidell — W. R. Landwer — M. Smith
Рис.
З. Ц
ветн
ое о
брат
ное
изоб
раж
ение
про
фил
я А
усти
нски
й м
ел A
llian
ce G
eoph
ysic
al С
о. и
его
инт
е]
Seismic imaging o f porosity and hydrocarbon... 273
roon color as opposed to maroon-purple color). These lithological distinction within the key chalk horizons and their respective properties explain why they can independently exhibit quite different fracture behavior.
The most frequently observed decrease in velocity noted on the color display for an oil filled fracture zone ranges from 400 to 800 ft/s (120 to 240 m/s). The lower value (400 ft/s, 120 m/s) is what we would expect for porosity indications within average carbonates and particularly for oil with no gas saturation. This observation is of course empirical, and in line with our prior experiences. Higher contrasts (above 1000 ft/s, 300 m/s) were most often found to indicate commercial gas accumulations or extremes of porosity (25% or better). We saw the largest velocity reductions (1200 ft/s, 360 m/s) in association with the deepest fracture zone on a portion of the line not shown here at about 1.1 seconds where tight chalk was indicated by seismic interval velocities of about 16 600 ft/s (5060 m/s). Wells in porosity zones in that area showing the large velocity contrast had extraordinary production rates (many thousand of bbl per day).
The fracture zones in the middle Chalk member are seen most readily. Pumpkin color zones isolated within the light blue are quite clear. Contiguous zones of color contrast representing lowered velocity in the upper and lower Chalk members which depart from systematic regional variations similarly denote fracture zones. Again the accompanying velocity drops are about 400-600 ft/s (120-180 m/s).
Well control superimposed on the color section was provided after the fracture interpretation. There is in fact a remarkable correlation between the initial flow rates (IP’s) and the quality and size of the fracture zones. Note that direct imaging of the fracture zones enables their ‘ranking’ and well designs to test them can be very specific in terms of location, horizontal reach and in identifying which Chalk member is to be penetrated. This translates clearly to great cost savings.
Projections of several well-bores into the plane of this seismic profile have been noted. By further comparing production information and in particular Initial Potentials (IP’s) with the color inversion display anomalies, the most highly productive fracture systems in this area could be seen to occur within the middle and lower zones of the chalk (lower 400 feet (120 m) of chalk section). Such semi-quantitative information again has important impact on the economics of this play.
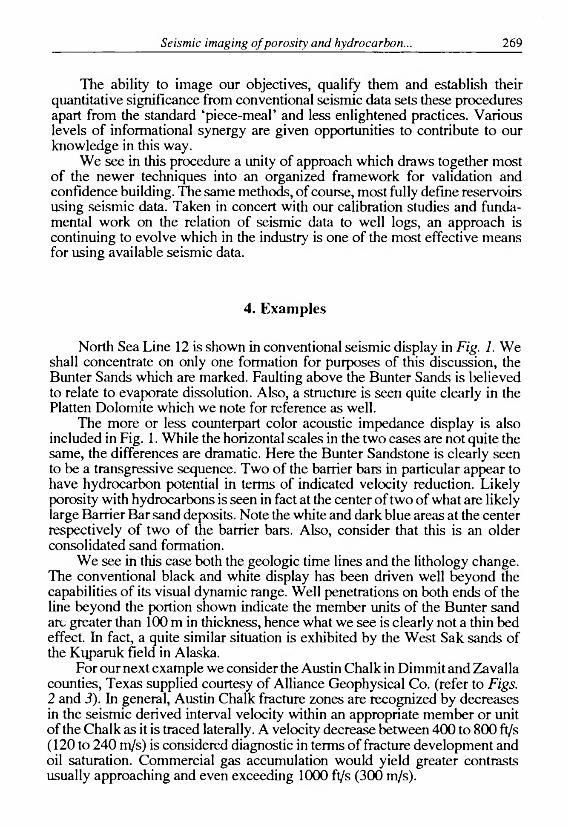
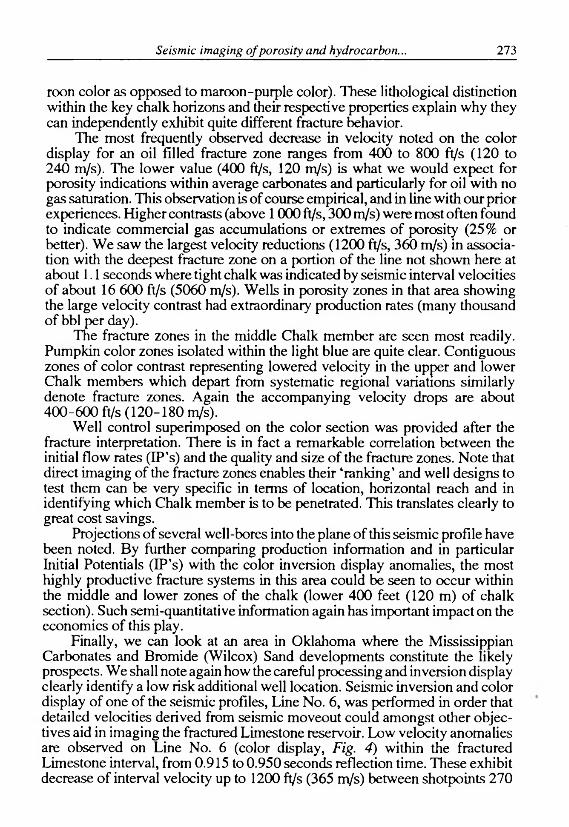
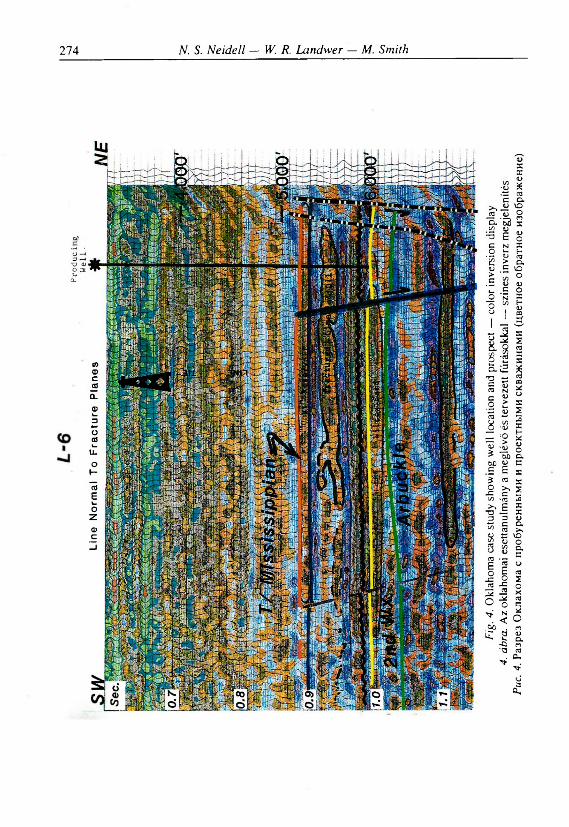
Finally, we can look at an area in Oklahoma where the Mississippian Carbonates and Bromide (Wilcox) Sand developments constitute the likely prospects. We shall note again how the careful processing and inversion display clearly identify a low risk additional well location. Seismic inversion and color display of one of the seismic profiles, Line No. 6, was performed in order that detailed velocities derived from seismic moveout could amongst other objectives aid in imaging the fractured Limestone reservoir. Low velocity anomalies are observed on Line No. 6 (color display, Fig. 4) within the fractured Limestone interval, from 0.915 to 0.950 seconds reflection time. These exhibit decrease of interval velocity up to 1200 ft/s (365 m/s) between shotpoints 270
Lin
e
No
rma
l T
o
Fra
ctu
re
Pla
ne
s
274 N. S. Neidell — W. R. Landwer — M. Smith
CO
■V 0> о 3ÍJeu
Fig.
4. O
klah
oma
case
stu
dy s
how
ing
wel
l lo
catio
n an
d pr
ospe
ct —
col
or in
vers
ion
disp
lay
4. á
bra.
Az
okla
hom
ai e
sett
anul
mán
y a
meg
lévő
és
terv
ezet
t fúr
ások
kal —
szí
nes
inve
rz m
egje
lení
tés
Puc.
4. Р
азре
з О
клах
ома
с пр
обур
енны
ми
и пр
оект
ным
и ск
важ
инам
и (ц
ветн
ое о
брат
ное
изоб
раж
ение
)
Seismic imaging o f porosity and hydrocarbon... 275
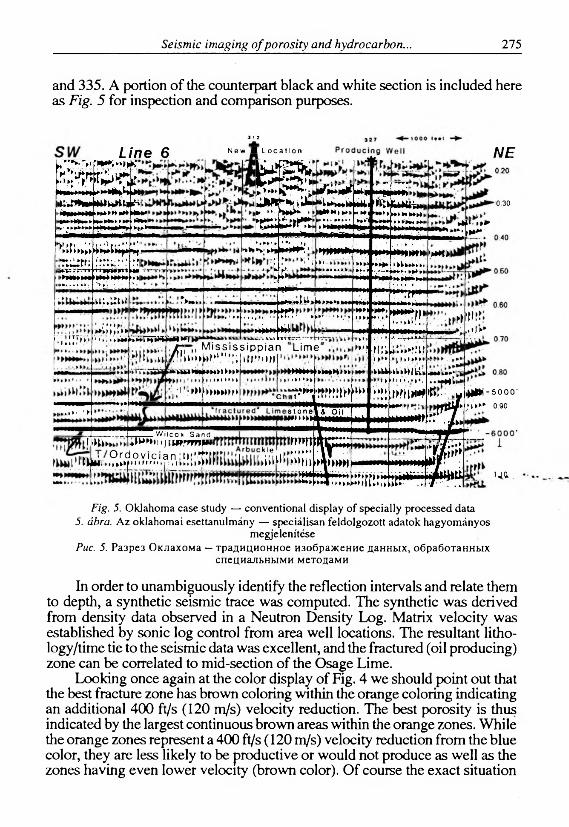
and 335. A portion of the counterpart black and white section is included here as Fig. 5 for inspection and comparison purposes.
L in e 63 12
N e w Ï L o c a t i o n
* **»>;J
jm.Uut г»»*.
■ uirrr»'►»illír»»v >>; ЛУмр й ! » йф и -Щ w i Irnrrrrt
, / 7m ' M iss iss ipp ian Lime Л1/ [ iVp >4>P1m’1\ iU.'iiim
ki1 if»*-»*» UJ>1
- ! u > к *>*>>.***1
(lilhbr»'>«>шйфм»Ьь
UIIIH,;i :!►>,»)>»»►»>>
>МН)И
►►►»►• *>••»»и** Ch
1M » » ï * >*. >»—* 1.’fWÍ!r>fm »* ;М|и*Й>-:
I >№>»' t l W i
----------W i lc o x Sand*1мии»1 turfmir(?̂ ?̂.ул?л5 ?, it ! г.фгн uVüu ï .
^ NE
0 .3 0
►bft >fp-■••*■**■*» t И* ‘' j* K H
rt'm:.»;»*■{»►.►ruJ f . ' *►**, ■ - ;
►►̂►MlkU J * . . » . . ,
ÎS>* '
 r
(HW-5000' !(►►► 0 .9 0
44-
Fig. 5. Oklahoma case study — conventional display of specially processed data5. ábra. Az oldahomai esettanulmány — speciálisan feldolgozott adatok hagyományos
megjelenítésePuc. 5. Разрез Оклахома — традиционное изображение данных, обработанных
специальными методами
In order to unambiguously identify the reflection intervals and relate them to depth, a synthetic seismic trace was computed. The synthetic was derived from density data observed in a Neutron Density Log. Matrix velocity was established by sonic log control from area well locations. The resultant litho- logy/time tie to the seismic data was excellent, and the fractured (oil producing) zone can be correlated to mid-section of the Osage Lime.
Looking once again at the color display of Fig. 4 we should point out that the best fracture zone has brown coloring within the orange coloring indicating an additional 400 ft/s (120 m/s) velocity reduction. The best porosity is thus indicated by the largest continuous brown areas within the orange zones. While the orange zones represent a 400 ft/s (120 m/s) velocity reduction from the blue color, they are less likely to be productive or would not produce as well as the zones having even lower velocity (brown color). Of course the exact situation
276 N. S. Neidell — W. R. Landwer — M. Smith
would have to be established by drilling. Nevertheless, with the color display, one is able to drill the best or at least most likely wells first. This is clearly not possible using the conventional data display of Fig. 5 alone.
5. Conclusions
It is difficult in a short exposition with a few illustrations to demonstrate all of the information-which can be accessed in seismic data using the methods described. Further references [NEIDELL et al. 1985, NEIDELL et al. 1984] can provide some added detail. Nevertheless, using three diverse cases, all of consolidated nature we show successful imaging of hydrocarbon filled porosity. Two of the case studies in fact show oil reservoirs. Gas reservoirs are easier to see owing to the substantially greater velocity drops. Success in this type of endeavor rests with the appropriate detailed processing of the seismic data, display of that data with enhanced visibility color displays, and of course a knowledgeable interpretive approach. Such results are indeed an excellent platform for application of even more advanced techniques to further qualify and even quantify the nature of hydrocarbon reservoirs in advance of the drill both in exploration and production environments.
REFERENCES
N eidell N. S., BEARD J. H. 1984: Progress in Stratigraphic Seismic Exploration and the Definition of Reservoirs. Distinguished Author Series Journal of Petrol. Technology 36, 5, pp. 709-726
NEIDELL N. S., B eard J. H. 1985: Seismic Visibility of Stratigraphic Objectives. SPE, Preprint 60th Annual Mtg, Las Vegas, Sept. 22-25
NEIDELL N. S., B erry N. 1989: Documenting the Sand/Shale Crossover. Geophysics 54,11, pp. 1430-1434
N eidell N. S., B ea r d J. H., Cook E. E. 1985: Use o f Seismic-Derived Velocities for Stratigraphic Exploration on Land. In: Berg O. B. and Woolverton D. G. (eds.) Seismic Stratigraphy II. An integrated Approach to Hydrocarbon Exploration, AAPG Memoir 39, pp. 49-77
N eidell N. S., B ea r d J. H., C ook E. E., Fr a n z W. L. 1984: Improve Prospect picks with Moveout Velocity Analysis. World Oil 198, 1, pp. 129-142
Pey to n C. E. (ed.) 1977: Seismic Stratigraphy — Applications to Hydrocarbon Exploration, AAPG Memoir 26, Tulsa, 516 p.
R uth erfo rd S. R., W illiam s R. H. 1989: Amplitude-Versus-Offset Variations in Gas Sands. Geophysics 54, 6, pp. 680-680
Seismic imaging o f porosity and hydrocarbon... 277
KONSZOLIDÁLT FORMÁCIÓK POROZITÁSÁNAK ÉS SZÉNHIDROGÉN TARTALMÁNAK SZEIZMIKUS LEKÉPEZÉSE
N. S. NEIDELL, W. R. LAND WER és M. SMITH
Konszolidált rezervoár formációk alatt olyan jelentős vastagságú formációkat értünk, amelyeknek akusztikus impedanciája (sűrűség-sebesség szorzata) a hasonló körű, normális nyomás alatt álló agyagpalákénál nagyobb vagy megegyezik azokéval. Ilyen formációkra a porozitás és a szénhidrogén tartalom a szeizmikus sebességváltozások alapján jelentős mélységintervallumra (mintegy 4800 m-ig) hatékonyan képezhető le. Az alábbiakban megemlítjük Kelet Texas, az Északi-tenger és Oklahoma néhány konszolidált homok és karbonát tárolóját. A szóban forgó tárolókat tartalmazó, napjainkban reménybeli képződmények az Austin kréta, a Niobrara és Frio-Vicksburg Alaszkai formációk és mások.
A konszolidált tárolók szeizmikus leképezéséhez szükséges követelmények rövid összefoglalásából kiindulva eljutunk a kapott képek értelmezésének, kalibrációjának és használatának módszertanáig. A térbelileg sűrű szeizmikus sebességmérések és a sebesség léptékű színes inverz szelvények hatékonyságát a sikeres példák egész sora bizonyítja. Ezek a megközelítések és a kapott pozitív eredmények azt sugallják, hogy a konszolidált rezervoárok vizsgálatában alkalmazott szeizmikus módszerek a jövőben még meghatározóbbak lesznek, mind a kutatási, mind a termelési alkalmazásokban.
СЕЙСМИЧЕСКОЕ ОТОБРАЖЕНИЕ ПОРИСТОСТИ И СОДЕРЖАНИЯ УГЛЕВОДОРОДОВ КОНСОЛИДИРОВАННЫХ ФОРМАЦИЙ
Н. С. НАЙДЕЛЛ, У. Р. ЛЕНДУЕР и М. СМИТ
Под консолидированной резервуарной формацией понимаются такие формации значительной мощ ности, которые обладают таким ж е или высшим значением акустического импеданса (произведение плотности и скорости), чем глинистые сланцы такого ж е возраста при нормальном давлении. Для таких формаций пористость и наличие углеводородов можно эффективно отобразить по изменениям сейсмической скорости для значительного интервала глубины (до 4800 м). Приводятся примеры песчанных и карбонатных резервуаров из Восточного Тексаса, Оклахомы и участка Северного моря. Записи этих резервуаров содержат формации Аустинский мел, Ниобрара и Фрио-Виксбург Аляска, и др.
Помимо краткого описания необходимых условий для выполнения сейсмического отобр аж ен и я консолидированны х резервуаров, статья такж е зани м ается и и н т ер п р ет а ц и ей , к ал и брац и ей и п р и м ен ен и ем п олученн ы х о т о б р а ж ен и й . Эффективность применения густой сети измерения скорости сейсмических волн и изображения в масштабе скорости цветных обратных разрезов доказываются целым рядом удачных примеров. Судя по положительным результатам, примененные сейсмические методы в исследовании консолидированных резервуаров в будущем станут еще более определяющими как и в разведочных, так и в добывающих областях.