Embed Size (px)
Citation preview
ORIGINAL ARTICLE
Seismic swarms, fault plane solutions, and stress tensorsfor São Miguel Island central region (Azores)
Rita Silva & Jens Havskov & Chris Bean &
Nicolau Wallenstein
Received: 14 June 2011 /Accepted: 5 January 2012 /Published online: 8 February 2012# Springer Science+Business Media B.V. 2012
Abstract The central region of São Miguel Island isone of the most seismically active areas of the Azoresarchipelago. A revised analysis of the seismicity dis-tribution at this region has, for the first time, shownthat the seismicity is clustered in two distinct areas: thearea around Fogo Volcano (Fogo) and the area aroundCongro maar (Congro), with each area having a highlylocalized swarm activity. From a total of about 15,000events in the period from 2002 to 2010, 78 bestlocated events were selected to make fault plane sol-utions using P-wave polarities and amplitude ratios.This set of fault plane solutions, and another six sub-sets derived from it, were inverted for the best fittingstress tensor. The stress tensor using all the 78 faultplane solutions is characterized by a subhorizontal σ1striking WNW-ESE and a σ3 striking NNE-SSW,consistent with the regional stress field for this region.A similar result, using only the fault plane solutions
located in the Fogo area, was obtained. On the otherhand, for the Congro area, a local stress field seems tobe superimposed on the regional field: subhorizontalσ3, striking NNE-SSW, and a near-vertical σ1. Thesame stress regime persists in the first 5 km depth,probably related to the upwelling of thermal fluids.The rising fluids generate horizontal extension at shal-low depths, which favour the opening of cracks andthe circulation and ascension of hydrothermal fluids.The stress regime deeper than 5 km is more uncertain;however, it is indicative of a compressional regime.Thus, it can be conclude that the smaller Fogo areaappears to be dominated by the normal regional stressfield while the high active Congro area seems to have adifferent, highly heterogeneous stress field dominatedby local conditions.
Keywords Azores . SãoMiguel Island . Fault planesolutions . Seismic swarms . Stress inversion
1 Introduction
The Azores archipelago is located at the Triple Junc-tion, defined by the intersection of the Mid-AtlanticRidge (MAR) with the North American (NA), Eur-asian (EU), and African (AF) plates boundary (Fig. 1).The Azorean Islands are all of volcanic origin andseveral historical eruptions occurred inland and off-shore. São Miguel is the largest island of the archipel-ago, and the last highly explosive eruption
J Seismol (2012) 16:389–407DOI 10.1007/s10950-012-9275-x
R. Silva (*) :N. WallensteinCentro de Vulcanologia e Avaliação de Riscos Geológicos,Universidade dos Açores,Ponta Delgada, Portugale-mail: [email protected]
J. HavskovDepartment of Earth Science, University of Bergen,Bergen, Norway
C. BeanSchool of Geological Sciences, University College Dublin,Dublin, Ireland
(subplinian) inland occurred in 1563 at Fogo caldera(Fig. 2). In the last 100 years, there have been recur-rent swarm activity in the Fogo-Congro area (Nunesand Oliveira 1999) and, in 2005, there was an excep-tionally high seismic swarm activity, with more than6,000 events recorded in 6 months (Figs. 3 and 4).Recent studies indicate that the Fogo-Congro seismic-ity might be related to crustal deformation (Trota2008), and there has been a real concern that renewedvolcanic activity might occur. So far no studies havebeen made of the stress field in the area. In this worksome of the best recorded events were used to analyzeseismic swarm patterns, determine fault plane solu-tions, invert for the stress field, and investigate apossible relationship between the seismicity, stressfield, and deformation. We use data from both thepermanent seismic network operated by the Center
for Seismo-volcanic Information and Surveillance ofthe Azores (CIVISA) and a temporary network ofportable stations deployed between April and July,2003.
1.1 Tectonics
The triangular shaped Azores Plateau is, in the West,defined by the MAR, in the North, defined by theNorth Azores Fracture Zone (NAFZ), and by a com-plex alignment with WNW-ESE direction, runningfrom the MAR to the western limit of Gloria Fault(GF), designated as Terceira Rift (TR),and in theSouth, defined by the East Azores Fracture Zone (EAFZ)(e.g., Luís et al. 1994; Borges 2003) (Fig. 1). TheMAR and TR are detectable in the archipelagoseismicity distribution, as well as the Faial Fracture
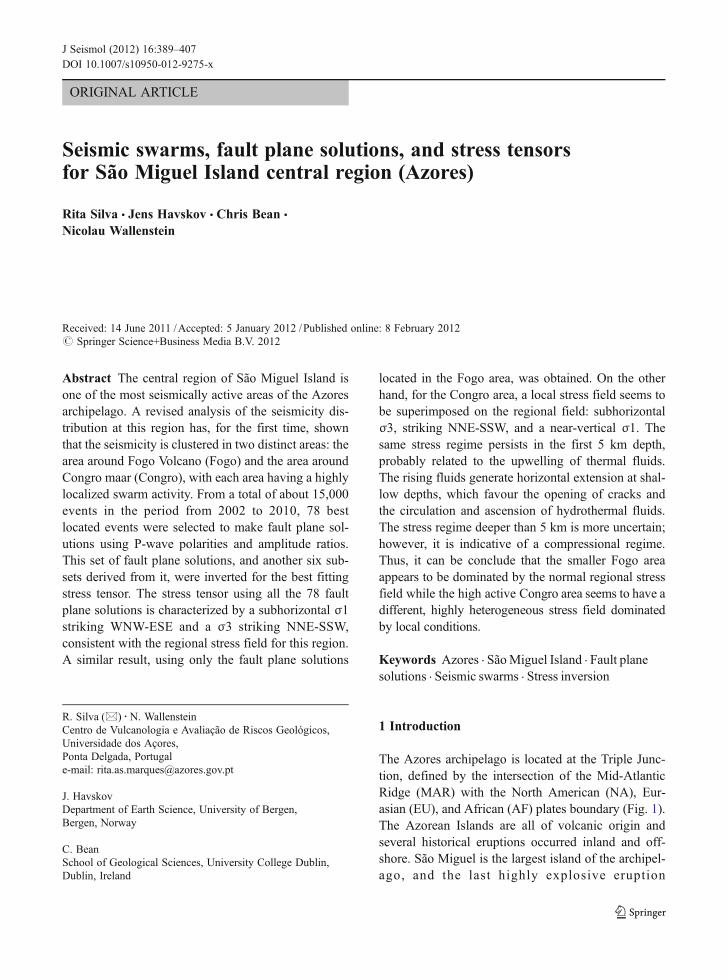
Fig. 1 Map of Azores archipelago showing the main morpho-tectonic features and seismicity distribution. The gray-shadedarea represents the different segments of the Terceira Rift, andthe dashed line represents the sheared western segment of theAfrican-Eurasian plate boundary. Tectonic structures: EAFZEast Azores Fracture Zone, NAFZ North Azores Fracture Zone,GF Gloria Fault, FFZ Faial Fracture Zone, AFZ Açor Fracture
Zone, PAFZ Princesa Alice Fracture Zone, PFZ Pico FractureZone (morphotectonics features adapted from Hipólito 2009).The Azores Plateau is limited by the 2,000 m bathymetric curve(bathymetric data from Lourenço et al. 1997). The seismic dataare from 1997 to 2010 and contains all epicentres available inthe CIVISA database. The red solid line defines São MiguelIsland
390 J Seismol (2012) 16:389–407
Zone (Fig. 1), where a high seismicity concentration isobserved. There is no significant seismicity associatedwith the EAFZ.
São Miguel Island is located in the alignment of theTR, and its most important tectonic structures (faultsand lineaments) follow the general pattern exhibited
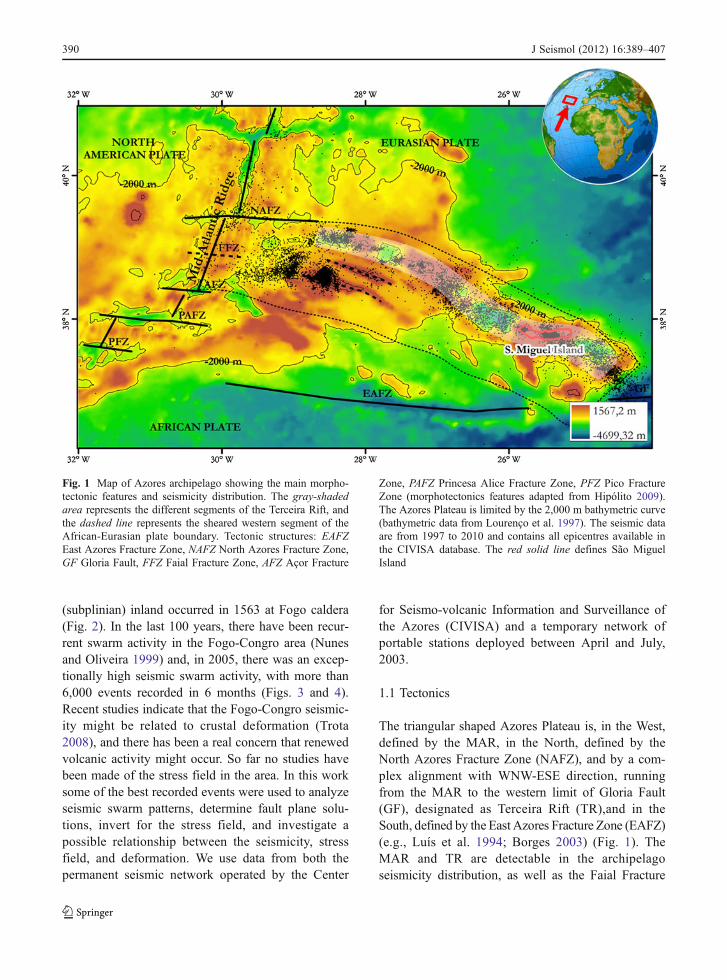
Fig. 2 Tectonic sketch of São Miguel Island (adapted from Gaspar et al. 1995; Wallenstein 1999; Ferreira 2000; Carmo et al. 2009).Observable faults are shown as solid lines and inferred faults as dashed lines. The solid line box outlines the study area
Fig. 3 Left, the 1989 swarm (Nunes and Oliveira 1999); right, the best located events (see text) from the time period 2002–2010. TheFogo and Congro areas are indicated with dotted lines
J Seismol (2012) 16:389–407 391
by the Azores Plateau, with main directions NW-SE andWNW-ESE (Fig. 2), as shown by Gaspar et al. (1995),Wallenstein (1999), Ferreira (2000), and Carmo et al.(2009). The emplacement of the polygenetic volcanicedifices and the distribution of secondary volcanic phe-nomena, like fumaroles (Notcutt and Davies 1999) andthermal springs (Cruz et al. 1999) are related to the mainstructures referred above.
The central region of São Miguel Island, whererecent increase in seismic activity has been observed,consists of the Fogo and Furnas volcanoes and theAchada das Furnas Plateau (Fig. 2). The Fogo Vol-cano, also known in the literature as Água do PauVolcanic Massif, is placed in the central region ofSão Miguel Island. Like other polygenetic volcanoesin the archipelago, its emplacement seems to be due tothe intersection of the dominant NW-SE and E-W
fracture systems, thought to be associated with theexistence of deep transform faults (e.g., Queiroz1997; Wallenstein 1999). At the northern flank of thevolcano, it is possible to infer the existence of theRibeira Grande Graben by the alignment of the scoriacones and domes, reflecting the NW-SE and NNW-SSEdirections. It is also possible to observe NE-SW align-ments and a circular system of faults, which might beresponsible for the emplacement of trachytic domes onthe upper part of the volcanic edifice (Wallenstein1999). The Achada das Furnas region corresponds toa basaltic plateau, which links the Fogo Volcano to theFurnas Volcano. This plateau consists of cinder/spattercones and lava flows, and includes a small young tra-chytic centre known as Congro maar (Cruz et al. 1999).Furnas Volcano is the youngest of the three polygeneticvolcanoes. Themain fracture system crosses all volcanic
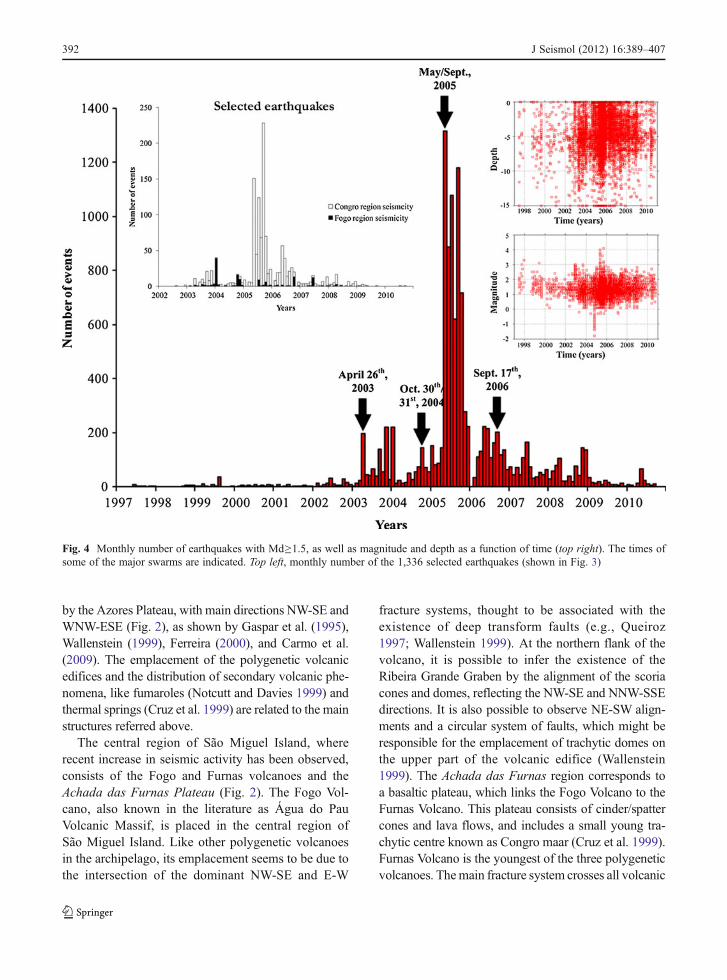
Fig. 4 Monthly number of earthquakes with Md≥1.5, as well as magnitude and depth as a function of time (top right). The times ofsome of the major swarms are indicated. Top left, monthly number of the 1,336 selected earthquakes (shown in Fig. 3)
392 J Seismol (2012) 16:389–407
systems with a dominant WNW-ESE direction, proba-bly associated with a right-lateral strike-slip fault(Gaspar et al. 1995). On the southern and western flanksof the volcano, a distinctive fault system with N-S toN20°–50° E direction is present, as well as NW-SEdirections (only on the S flank) coincident with the TRregional direction. The NNE-SSW system seems tocontrol some structural depressions, calderas outlines,valleys alignments (Gaspar et al. 1995) and plays amajor role in the transfer of magma to the surface (Guestet al. 1999).
1.2 Seismicity
During the last century several seismic swarms wererecorded in the study area. The first swarm accuratelylocated occurred in 1989 (e.g., Tryggvason et al. 1989;Nunes and Oliveira 1999).
Over 17,000 earthquakes have been recorded at thiscentral region since 1997, the majority with durationmagnitude, Md≤2, and located in the depth rangebetween 0 and 10 km. Since the seismic networkconfiguration has changed over this time period, onlythe statistics for events larger than the overall detec-tions threshold (Md01.5) will be shown. More than4,000 events with Md≥1.5 were recorded in this timeperiod (Fig. 4). Duration magnitudes were calculatedusing the empirical relation of Lee et al. (1972).
Since 2002, the central region of São Miguel Islandhas experienced a higher seismic activity than in theprevious decades (Fig. 4). This seismicity occursmainly as seismic swarms. Figure 4 indicates someswarms recorded in this region. It is seen (Fig. 3) thatthe 1989 swarm was located in the same area as thelatest swarms in Congro area. In the previous centuries,at least since 1891, several other swarms have beenreported (Nunes and Oliveira 1999), showing that seis-mic swarm activity in this area is a recurrent phenome-non, being the one occurred in 2005 probably the largestinstrumentally recorded.
Earthquake swarms are characterised as a sequenceof small magnitude events with a strong time andspace clustering, and without a dominant earthquake(Mogi 1963). This type of seismicity occurs normallyin volcanic and/or geothermal regions, and presentshigh b values of magnitude-frequency distributionsince the swarms consist of a larger number of eventswith low magnitude values, compared with the oneswith high magnitude (e.g., Fischer 2005). The
occurrence of earthquake swarms in volcanic activeregions has been attributed to subsurface magma move-ment at shallow depths (e.g., Spicák and Horálek 2001;Fischer and Horálek 2005; Hensch et al. 2008) and/orassociated with hydrothermal fluids circulation throughnew or pre-existent fractures (e.g., Husen et al. 2004;Farrel et al. 2009). Therefore, the swarms are commonlylimited to regions with exceptionally heterogeneousdistributions of material properties and stress concen-trations (Hill 1977).
The seismicity located at the central region of SãoMiguel Island has earlier been seen without a clearseparation into distinct seismicity areas, probably be-cause earlier raw results presented important globallocation errors. In order to look only to the best data, aselection of the events occurred between 2002 and 2010was made. First, the original events were relocated usingonly stations with less than 13 km of epicentral distanceand the standard crustal velocity model for the region(Senos and Nunes 1978 in Senos et al. 1992) (Table 1).The Hypocenter program (Lienert and Havskov 1995)was used for the locations. Then a second selection wasmade requiring a minimum number of eight stations, theroot mean square of travel time residuals (RMS) lessthan 0.1 sec, and estimated errors (within 90 % confi-dence) with less than 1.5 km in all directions, beingselected 1336 events (Fig. 3). Some revision of thephase arrivals was performed, and so the phase pickingdata are not identical to what was available in theCIVISA database.
The data are clearly clustered into two areas accord-ing to their locations: Fogo and Congro areas (Fig. 3).The Fogo area is located around Fogo Volcano, andCongro area is located nearby Congro Maar. Thisseparation was not so clear prior to the selection ofthe high-quality data, and has not been reported earli-er, probably due to the absence of restrict selectioncriteria. In fact, Zandomeneghi et al. (2008)
Table 1 P-wave velocitymodel—TAC model (Senos and Nunes1978 in Senos et al. 1992). Seesection on velocity models later
Depth(km)
P-wavevelocity (km/s)
0 2.4
0.5 4.1
2.2 5.4
5.4 6.8
11.9 7.8
J Seismol (2012) 16:389–407 393
elaborated a tomographic study of the area, and the3D locations obtained did not show the two clusteredareas. In order to better identify swarms in differentlocalities, the data will be analyzed separately for Fogoand Congro areas.
1.3 Seismic swarm periods
From 2002 to 2010, four main swarm episodes (April2003, October 2004,May/September 2005, and Septem-ber 2006) were identified (Fig. 4), where hundreds tothousands of small earthquakes occurred within days orover a few months. The statistic for the data selected forFogo and Congro regions is also shown in Fig. 4, despitethat these two subsets do not correctly reflect the overallseismicity since not all events are included. However, thecomparison gives an indication if the seismicity occurssimultaneously within one month in the two areas. As itcan be seen, most of the seismicity in the two areas doesnot quite coincide in time. In Fig. 5, none of the 15identified swarms, with duration of 1–2 days, occursimultaneously in the two areas, which indicate that thesource of the activity in the two areas is not directlyrelated. The Congro area is the area with the largestnumber of swarms, and with the highest activity. Gener-ally, it is seen that the seismicity has gradually declinedsince the high activity in 2005. Nevertheless, the centralregion is still the most active zone in São Miguel Island,and one of the most active of the Azores archipelago.
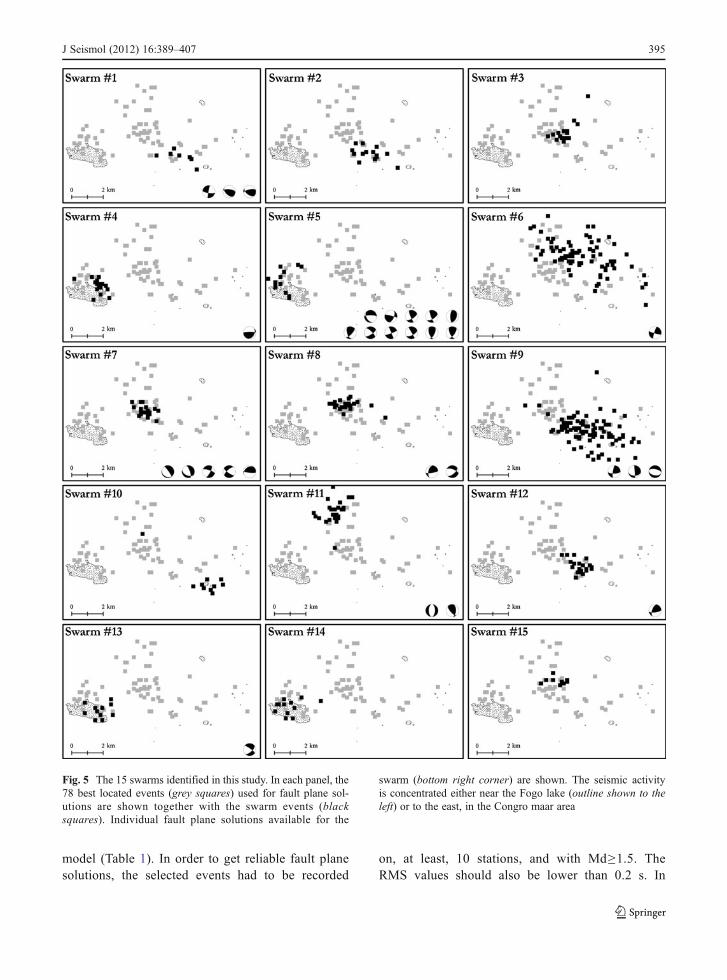
In order to identify the best epicentral locations ofthe swarms, periods with higher activity were identi-fied within the selected dataset of high-quality events(Fig. 3). This limited dataset might reduced the num-ber of events in the swarms when compared with thewhole dataset of the 17,000 events, and might evenhave prevented the detection of some swarms. A totalof 15 swarms, with a total 381 events (Table 2; Fig. 5),were identified within the 1,336 high accurately locat-ed events. The epicentres for the 15 swarms are shownin Fig. 5, as well as some individual fault plane sol-utions occurring during the swarm periods (see textbelow). In addition, the even higher accurately locatedepicentres of the events used for individual fault planesolutions are shown (see later).
The events in the individual swarms are generallylocated within areas less than 2×2 km, and consider-ing the location accuracy estimated to 1.5 km, theenclosed area might be even smaller. The similarityamong some seismograms of different events within
one swarm seems to point to the existence of multiplets,which reflect a restricted area of influence. The swarmsseem to move around and cover different parts of theseismically active area at different times. The two largestCongro swarms are the exception since they cover amuch larger area. No systematic migration with timewas found within these two large swarms. The eventslook to jump around randomly in the whole area duringthe occurrence of the swarm, indicating that the stresschanges that are in the origin of these large swarms coverlarge areas when compared with the small swarms.
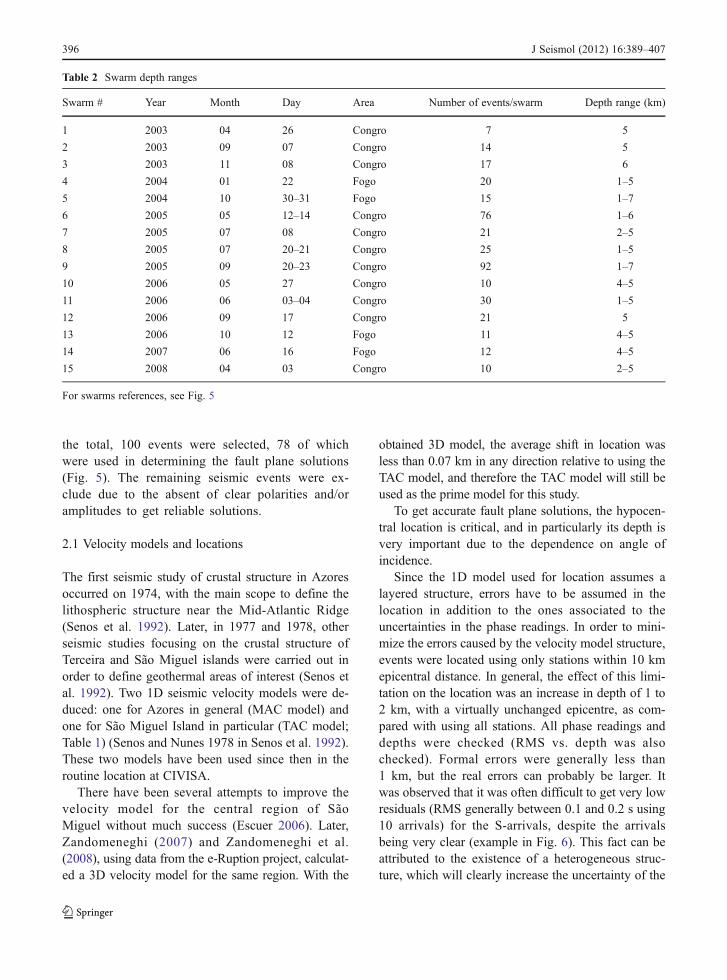
The hypocentral depths of the routine picked eventsare more uncertain than the depths of the events usedfor fault plane solutions, since the calculated errors forthese last are less than 1 km, in contrast with the rangeof 0.5 to 2 km of the former ones. Table 2 shows thedepth range for the different swarms. All events havedepths ranging from 1 to 7 km. Within one swarm, theevents can be at very similar depths (like swarms #1 to3), or spread out in depth (like swarm #5). Consideringswarm #5, the depths of the 11 events used for faultplane solutions are very well determined (less than1 km error), so it is clear that there is a considerablespread in depth for some seismic swarms. There is asignificant difference in depths between Fogo andCongro seismic events. In the Fogo area, the majorityof the events are above 5 km depth while in theCongro area there are several events that are locateddeeper than 5 km. High seismic activity and swarmsgenerally occur either in Fogo or Congro areas. How-ever, they do not seem to occur simultaneously in thetwo areas. The use of only the best located events hasenabled the identification of more restricted swarmsource areas, which have not been seen so clearlypreviously, since earlier it was thought that the swarmevents were occurring randomly over the whole seis-mically active Fogo-Congro area (Silva 2004).
2 Data for fault plane solutions
The data used for fault plane solutions were obtainedfrom the 16 permanent stations operated by CIVISA atSão Miguel Island and from 11 temporarily deployedstations on the behalf of the European project, e-Ruption,from April to July, 2003 (e.g., Bonagura et al. 2004;Saccorotti et al. 2004). The earthquake locations wereobtained using SEISAN software (Havskov andOttemöller 1999) and a five-layer, 1D velocity
394 J Seismol (2012) 16:389–407
model (Table 1). In order to get reliable fault planesolutions, the selected events had to be recorded
on, at least, 10 stations, and with Md≥1.5. TheRMS values should also be lower than 0.2 s. In
Fig. 5 The 15 swarms identified in this study. In each panel, the78 best located events (grey squares) used for fault plane sol-utions are shown together with the swarm events (blacksquares). Individual fault plane solutions available for the
swarm (bottom right corner) are shown. The seismic activityis concentrated either near the Fogo lake (outline shown to theleft) or to the east, in the Congro maar area
J Seismol (2012) 16:389–407 395
the total, 100 events were selected, 78 of whichwere used in determining the fault plane solutions(Fig. 5). The remaining seismic events were ex-clude due to the absent of clear polarities and/oramplitudes to get reliable solutions.
2.1 Velocity models and locations
The first seismic study of crustal structure in Azoresoccurred on 1974, with the main scope to define thelithospheric structure near the Mid-Atlantic Ridge(Senos et al. 1992). Later, in 1977 and 1978, otherseismic studies focusing on the crustal structure ofTerceira and São Miguel islands were carried out inorder to define geothermal areas of interest (Senos etal. 1992). Two 1D seismic velocity models were de-duced: one for Azores in general (MAC model) andone for São Miguel Island in particular (TAC model;Table 1) (Senos and Nunes 1978 in Senos et al. 1992).These two models have been used since then in theroutine location at CIVISA.
There have been several attempts to improve thevelocity model for the central region of SãoMiguel without much success (Escuer 2006). Later,Zandomeneghi (2007) and Zandomeneghi et al.(2008), using data from the e-Ruption project, calculat-ed a 3D velocity model for the same region. With the
obtained 3D model, the average shift in location wasless than 0.07 km in any direction relative to using theTAC model, and therefore the TAC model will still beused as the prime model for this study.
To get accurate fault plane solutions, the hypocen-tral location is critical, and in particularly its depth isvery important due to the dependence on angle ofincidence.
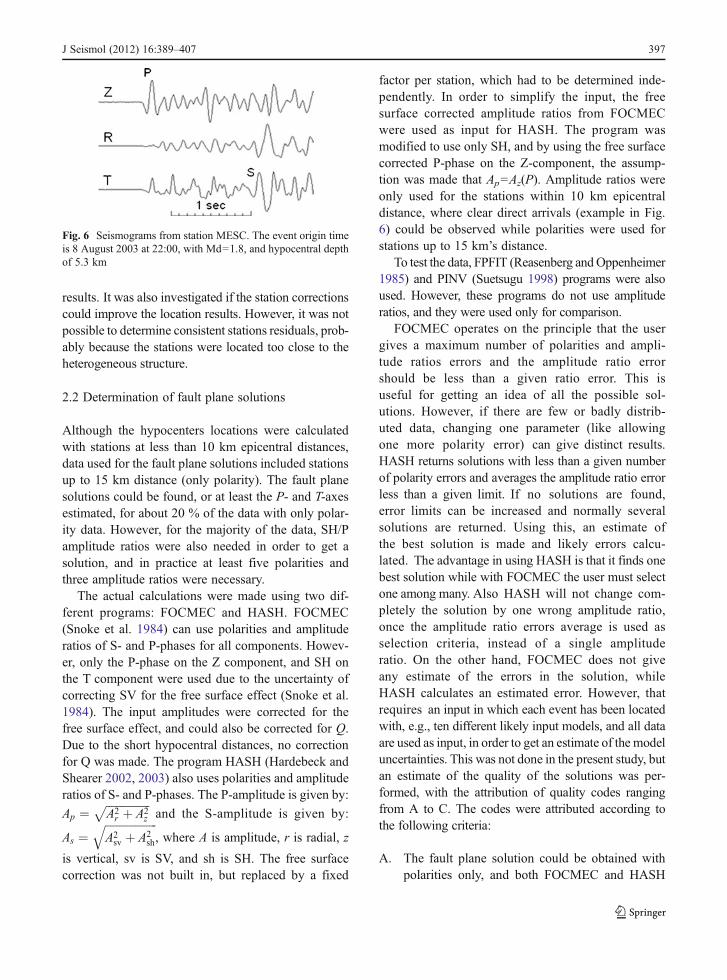
Since the 1D model used for location assumes alayered structure, errors have to be assumed in thelocation in addition to the ones associated to theuncertainties in the phase readings. In order to mini-mize the errors caused by the velocity model structure,events were located using only stations within 10 kmepicentral distance. In general, the effect of this limi-tation on the location was an increase in depth of 1 to2 km, with a virtually unchanged epicentre, as com-pared with using all stations. All phase readings anddepths were checked (RMS vs. depth was alsochecked). Formal errors were generally less than1 km, but the real errors can probably be larger. Itwas observed that it was often difficult to get very lowresiduals (RMS generally between 0.1 and 0.2 s using10 arrivals) for the S-arrivals, despite the arrivalsbeing very clear (example in Fig. 6). This fact can beattributed to the existence of a heterogeneous struc-ture, which will clearly increase the uncertainty of the
Table 2 Swarm depth ranges
Swarm # Year Month Day Area Number of events/swarm Depth range (km)
1 2003 04 26 Congro 7 5
2 2003 09 07 Congro 14 5
3 2003 11 08 Congro 17 6
4 2004 01 22 Fogo 20 1–5
5 2004 10 30–31 Fogo 15 1–7
6 2005 05 12–14 Congro 76 1–6
7 2005 07 08 Congro 21 2–5
8 2005 07 20–21 Congro 25 1–5
9 2005 09 20–23 Congro 92 1–7
10 2006 05 27 Congro 10 4–5
11 2006 06 03–04 Congro 30 1–5
12 2006 09 17 Congro 21 5
13 2006 10 12 Fogo 11 4–5
14 2007 06 16 Fogo 12 4–5
15 2008 04 03 Congro 10 2–5
For swarms references, see Fig. 5
396 J Seismol (2012) 16:389–407
results. It was also investigated if the station correctionscould improve the location results. However, it was notpossible to determine consistent stations residuals, prob-ably because the stations were located too close to theheterogeneous structure.
2.2 Determination of fault plane solutions
Although the hypocenters locations were calculatedwith stations at less than 10 km epicentral distances,data used for the fault plane solutions included stationsup to 15 km distance (only polarity). The fault planesolutions could be found, or at least the P- and T-axesestimated, for about 20 % of the data with only polar-ity data. However, for the majority of the data, SH/Pamplitude ratios were also needed in order to get asolution, and in practice at least five polarities andthree amplitude ratios were necessary.
The actual calculations were made using two dif-ferent programs: FOCMEC and HASH. FOCMEC(Snoke et al. 1984) can use polarities and amplituderatios of S- and P-phases for all components. Howev-er, only the P-phase on the Z component, and SH onthe T component were used due to the uncertainty ofcorrecting SV for the free surface effect (Snoke et al.1984). The input amplitudes were corrected for thefree surface effect, and could also be corrected for Q.Due to the short hypocentral distances, no correctionfor Q was made. The program HASH (Hardebeck andShearer 2002, 2003) also uses polarities and amplituderatios of S- and P-phases. The P-amplitude is given by:
Ap ¼ffiffiffiffiffiffiffiffiffiffiffiffiffiffiffiffi
A2r þ A2
z
p
and the S-amplitude is given by:
As ¼ffiffiffiffiffiffiffiffiffiffiffiffiffiffiffiffiffiffiffi
A2sv þ A2
sh
q
, where A is amplitude, r is radial, z
is vertical, sv is SV, and sh is SH. The free surfacecorrection was not built in, but replaced by a fixed
factor per station, which had to be determined inde-pendently. In order to simplify the input, the freesurface corrected amplitude ratios from FOCMECwere used as input for HASH. The program wasmodified to use only SH, and by using the free surfacecorrected P-phase on the Z-component, the assump-tion was made that Ap0Az(P). Amplitude ratios wereonly used for the stations within 10 km epicentraldistance, where clear direct arrivals (example in Fig.6) could be observed while polarities were used forstations up to 15 km’s distance.
To test the data, FPFIT (Reasenberg andOppenheimer1985) and PINV (Suetsugu 1998) programs were alsoused. However, these programs do not use amplituderatios, and they were used only for comparison.
FOCMEC operates on the principle that the usergives a maximum number of polarities and ampli-tude ratios errors and the amplitude ratio errorshould be less than a given ratio error. This isuseful for getting an idea of all the possible sol-utions. However, if there are few or badly distrib-uted data, changing one parameter (like allowingone more polarity error) can give distinct results.HASH returns solutions with less than a given numberof polarity errors and averages the amplitude ratio errorless than a given limit. If no solutions are found,error limits can be increased and normally severalsolutions are returned. Using this, an estimate ofthe best solution is made and likely errors calcu-lated. The advantage in using HASH is that it finds onebest solution while with FOCMEC the user must selectone among many. Also HASH will not change com-pletely the solution by one wrong amplitude ratio,once the amplitude ratio errors average is used asselection criteria, instead of a single amplituderatio. On the other hand, FOCMEC does not giveany estimate of the errors in the solution, whileHASH calculates an estimated error. However, thatrequires an input in which each event has been locatedwith, e.g., ten different likely input models, and all dataare used as input, in order to get an estimate of the modeluncertainties. This was not done in the present study, butan estimate of the quality of the solutions was per-formed, with the attribution of quality codes rangingfrom A to C. The codes were attributed according tothe following criteria:
A. The fault plane solution could be obtained withpolarities only, and both FOCMEC and HASH
Fig. 6 Seismograms from station MESC. The event origin timeis 8 August 2003 at 22:00, with Md01.8, and hypocentral depthof 5.3 km
J Seismol (2012) 16:389–407 397
gave the same result when adding amplituderatios;
B. There was not a unique fault plane solution usingpolarities only, and only an indication of domi-nant P- and T-axes was possible. Both FOCMECand HASH results coincided when adding ampli-tude ratios;
C. No possible solution was found with polaritiesonly. Fault plane solutions for HASH and FOC-MEC were different (<40°) when adding ampli-tude ratios.
The evolution of the seismicity from 2003 to 2008(Fig. 5) shows two distinct areas acting independentlyare visible: Fogo and Congro areas. With four signif-icant swarms in the 6-year period, the Fogo area wasless active than the Congro area, where 11 swarmsoccurred in the same period.
For 10 of the 15 swarms, it was possible to find someindividual fault plane solutions. In some cases, just oneindividual solution (swarms #4, 6, 12, and 13) was found,but in other cases there were two or more individualsolutions (swarms of #5 and 7) identified for each swarm.In general, there is a mixture of fault plane solution typesboth in the Fogo and Congro areas. The most represen-tative fault style in both areas is strike-slip to obliquestrike-slip, with an important thrust component.
3 Crustal deformation
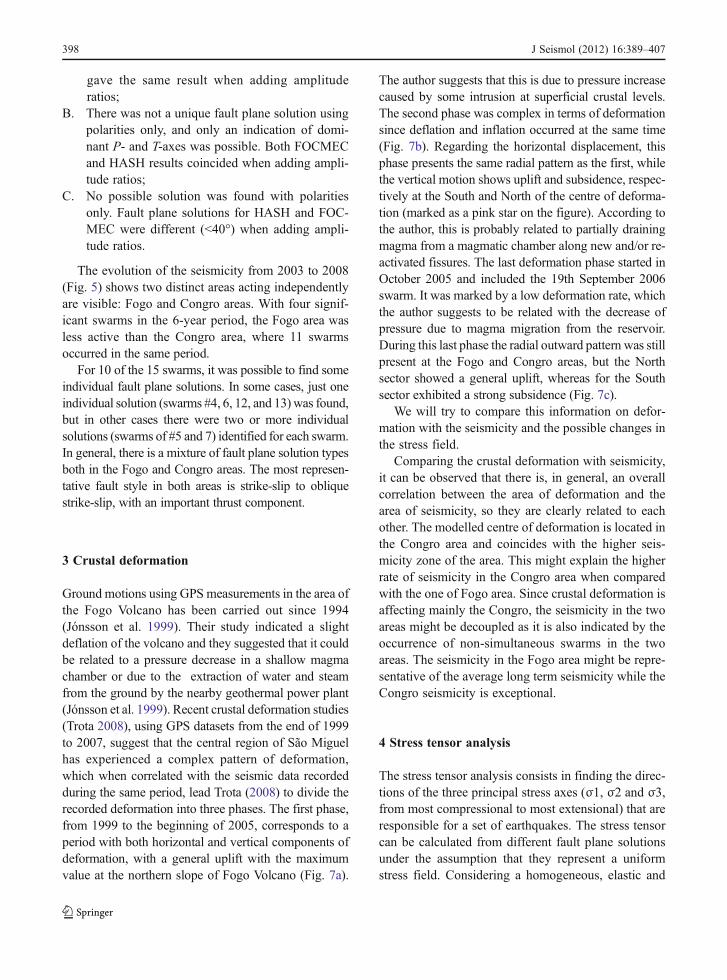
Ground motions using GPS measurements in the area ofthe Fogo Volcano has been carried out since 1994(Jónsson et al. 1999). Their study indicated a slightdeflation of the volcano and they suggested that it couldbe related to a pressure decrease in a shallow magmachamber or due to the extraction of water and steamfrom the ground by the nearby geothermal power plant(Jónsson et al. 1999). Recent crustal deformation studies(Trota 2008), using GPS datasets from the end of 1999to 2007, suggest that the central region of São Miguelhas experienced a complex pattern of deformation,which when correlated with the seismic data recordedduring the same period, lead Trota (2008) to divide therecorded deformation into three phases. The first phase,from 1999 to the beginning of 2005, corresponds to aperiod with both horizontal and vertical components ofdeformation, with a general uplift with the maximumvalue at the northern slope of Fogo Volcano (Fig. 7a).
The author suggests that this is due to pressure increasecaused by some intrusion at superficial crustal levels.The second phase was complex in terms of deformationsince deflation and inflation occurred at the same time(Fig. 7b). Regarding the horizontal displacement, thisphase presents the same radial pattern as the first, whilethe vertical motion shows uplift and subsidence, respec-tively at the South and North of the centre of deforma-tion (marked as a pink star on the figure). According tothe author, this is probably related to partially drainingmagma from a magmatic chamber along new and/or re-activated fissures. The last deformation phase started inOctober 2005 and included the 19th September 2006swarm. It was marked by a low deformation rate, whichthe author suggests to be related with the decrease ofpressure due to magma migration from the reservoir.During this last phase the radial outward pattern was stillpresent at the Fogo and Congro areas, but the Northsector showed a general uplift, whereas for the Southsector exhibited a strong subsidence (Fig. 7c).
We will try to compare this information on defor-mation with the seismicity and the possible changes inthe stress field.
Comparing the crustal deformation with seismicity,it can be observed that there is, in general, an overallcorrelation between the area of deformation and thearea of seismicity, so they are clearly related to eachother. The modelled centre of deformation is located inthe Congro area and coincides with the higher seis-micity zone of the area. This might explain the higherrate of seismicity in the Congro area when comparedwith the one of Fogo area. Since crustal deformation isaffecting mainly the Congro, the seismicity in the twoareas might be decoupled as it is also indicated by theoccurrence of non-simultaneous swarms in the twoareas. The seismicity in the Fogo area might be repre-sentative of the average long term seismicity while theCongro seismicity is exceptional.
4 Stress tensor analysis
The stress tensor analysis consists in finding the direc-tions of the three principal stress axes (σ1, σ2 and σ3,from most compressional to most extensional) that areresponsible for a set of earthquakes. The stress tensorcan be calculated from different fault plane solutionsunder the assumption that they represent a uniformstress field. Considering a homogeneous, elastic and
398 J Seismol (2012) 16:389–407
isotropic medium without friction and without pre-existing faults, the stress tensor should have a shearstress (τ) of (σ1+σ3)/2, where σ1 and σ3 correspondto the largest and smallest eigenvalues of the stresstensor, respectively (Legrand et al. 2002).
According to this ideal scenario, the P- and the T-axes can approximately correspond to the principalstress orientations. However, the medium is often pre-fractured and friction exists on the faults, and thereforethe movement along pre-existing faults might imply thatσ1 and σ3 are not oriented at 45° to the fault surface(Ramsey and Huber 1987) and therefore, they will notmatch the P- and T-axes. In fact, the only restriction thatcan be made is that σ1 lies within the dilatational quad-rant of the focal mechanism. Therefore, a given stressfield can induce movement of pre-existing faults with
different orientations (e.g., Legrand et al. 2002), whichsuggests that a better approach is to find the stress tensorthat best fit the overall fault plane solutions. To obtainthe principal stress axes, the method described byMichael (1984) was used. In this method, to quantifythe difference between the obtained stress tensor and theavailable data, the β parameter, or misfit angle, is com-puted. β is the angle between the “observable” slipdirection on each plane and the maximum shear stress(τ) predicted by the stress tensor (Michael 1984), whichideally should be parallel to the slip direction. If β>40º,it means that the stress field is spatially heterogeneous,since it cannot be accurately represented by only onestress tensor (Michael et al. 1990).
Michael’s stress inversion code uses a bootstrapresampling technique (Michael 1987a, b) in order to
Fig. 7 Top, horizontal velocity field for all datasets (from1999.9 to 2007.7 (decimal years)); bottom, vertical componentsof the velocity field for the three deformation phases and thelocation of the identified swarms (same as in Fig. 5) occurring ineach phase: a) from 1999 to the beginning of 2005, b) from the
beginning of 2005 to September 2005, and c) from September2005 to 2007. The pink stars indicate the centre of deformationafter modelling. Contour lines of 10 mm. Scale bar units, mm/year (Trota 2008)
J Seismol (2012) 16:389–407 399
define the confidence regions. This technique consistsin resampling the original dataset randomly and sev-eral times (which means that the same mechanismscan be repeated two or more times, while others can beabsent) to simulate having new earthquakes in thesame area and at the same period. According to Mi-chael (1987a, b), to get a confidence level of 95%,2000 repetitions are required, which was the numberused in this work. Each bootstrap-resample is invertedfor its best stress tensor, and the tensors distributiongives the confidence limits on the best tensor for theoriginal dataset. This inversion process, as tested byMichael et al. (1990), was shown to be robust fordatasets with 15 or more events, and at least 15 eventsshould ideally be used. When inverting fault-planesolutions, two nodal planes are obtained. However,as discussed by Michael (1987a, b), it is advisable toselect one of the nodal planes as the fault plane for thepurposes of inversions, and for estimating confidencelimits by bootstrap resampling, but since this informa-tion is not known a priori, the Michael (1987a) algo-rithm uses both nodal planes, trying at the same timeto choose the correct fault plane and to find the beststress tensor.
The stress tensor inversion gives the orientation(strike/dip) of the three principal stress axes σ1, σ2,and σ3, and the ϕ parameter (ϕ0(σ2–σ3)/(σ1–σ3)),which defines the relative size of the intermediateprincipal stress with respect to the maximum andminimum principal stress.
5 Stress inversion results
5.1 Regional stress field
The regional stress field near São Miguel Island hasbeen inferred from fault plane solutions of large earth-quakes to be approximately normal (ca N40° E) to theTerceira Rift (Fig. 1) deformation zone (Borges et al.2007). The nearest earthquake to São Miguel Islandused in that study was the event of 21st January 1989,Mw05.7, located North of the island. It was a purenormal fault with a T-axis strike of 39°. For the SãoMiguel area, there are no other published fault planesolutions for large or for small earthquakes. Therefore,the average stress field, using the data from the presentwork, will be estimated.
In this study, 736 polarities for 78 events were used.Of these, 79 % were the same for all events indicatingthat, although the fault plane solutions look ratherrandom (Fig. 5), they are the result of a non-randomstress field. A better way of getting an idea of theaverage stress field is doing a stress inversion, assum-ing that the stress field is uniform. The average stressfield was calculated with the software SLICK (Michael1984), using the 78 fault plane solutions (Table 3;Fig. 8). Since we consider three quality types of faultplane solutions (A, B, and C), the stress analysis wascarried out for each of the three groups. With this basis,the results (Table 3) indicate similar solutions for thethree quality types, being performed an average inver-sion using all the data.
A rose diagram was also made with the P- and T-axes directions from the 78 best located events
Table 3 Different regional stress directions and fault planeorientations inferred from different methods
Source Strike Dip Rake σ3 σ1
1989 earthquakea 131 41 −87 39/5 193/86
Composite solution 104 69 −59 171/18 53/55
ABC solutions 19/34 113/5
A solutions 15/30 −95/31B solutions 21/19 118/22
C solutions 24/46 167/38
T P
Rose diagram 15/− 105/−
For the two fault plane solutions, it is assumed the T- and P-axescorrespond to σ3 and σ1, respectively. For stress inversion, σ3,σ1, consist of strike/dip. The composite solution is obtainedwith all the 78 events. Rose diagram corresponds to the domi-nant direction from rose diagrams of P- and T-axes strikes. Allvalues in degrees
ABC, A, B, and C solutions are stress inversions results using: allquality types, only A solutions, only B solutions, or only Csolutions, respectivelya According to Borges et al. (2007)
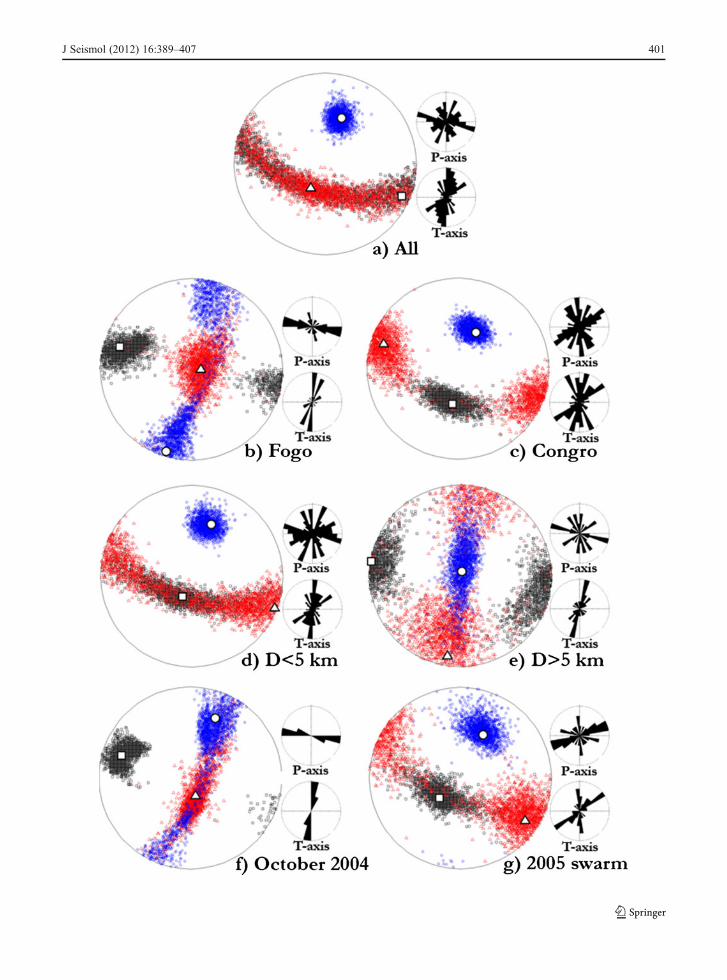
Fig. 8 Stress tensor solutions obtained from all the inversionsperformed. Stress tensor solutions: a) for the 78 best locatedevents, b) for the events located within Fogo area, c) for theevents located within Congro area, d) for the events locatedbelow 5 km, e) for the events located above 5 km, f) for theOctober 2004 swarm, and g) for the 2005 swarm. The squarerepresents the σ1 axis, the triangle the σ2, and the circle the σ3axis. The numerous dots define the 95% confidence region foreach stress axis. The rose diagrams of P- and T-axis azimuths arealso seen in the figure
b
400 J Seismol (2012) 16:389–407
J Seismol (2012) 16:389–407 401
(Fig. 8a). It can be observed that the well-defineddominant T-axis is orientated ~15° N while the P-axisdirection is more random. However, because of thecircular distribution of the P- and T-axes, and the factthat the dip is ignored, when averaging directions, acareful treatment and interpretation of the rose dia-grams is necessary. The minimum compressive stressaxis (σ3) strike is also similar to the one inferred fromthe rose diagram.
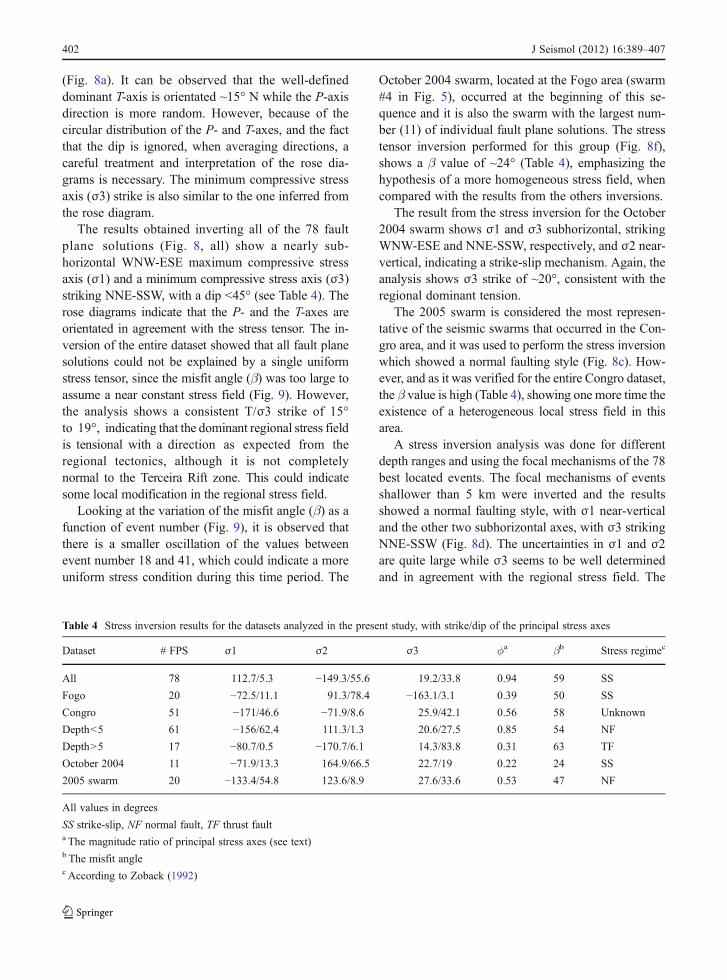
The results obtained inverting all of the 78 faultplane solutions (Fig. 8, all) show a nearly sub-horizontal WNW-ESE maximum compressive stressaxis (σ1) and a minimum compressive stress axis (σ3)striking NNE-SSW, with a dip <45° (see Table 4). Therose diagrams indicate that the P- and the T-axes areorientated in agreement with the stress tensor. The in-version of the entire dataset showed that all fault planesolutions could not be explained by a single uniformstress tensor, since the misfit angle (β) was too large toassume a near constant stress field (Fig. 9). However,the analysis shows a consistent T/σ3 strike of 15°to 19°, indicating that the dominant regional stress fieldis tensional with a direction as expected from theregional tectonics, although it is not completelynormal to the Terceira Rift zone. This could indicatesome local modification in the regional stress field.
Looking at the variation of the misfit angle (β) as afunction of event number (Fig. 9), it is observed thatthere is a smaller oscillation of the values betweenevent number 18 and 41, which could indicate a moreuniform stress condition during this time period. The
October 2004 swarm, located at the Fogo area (swarm#4 in Fig. 5), occurred at the beginning of this se-quence and it is also the swarm with the largest num-ber (11) of individual fault plane solutions. The stresstensor inversion performed for this group (Fig. 8f),shows a β value of ~24° (Table 4), emphasizing thehypothesis of a more homogeneous stress field, whencompared with the results from the others inversions.
The result from the stress inversion for the October2004 swarm shows σ1 and σ3 subhorizontal, strikingWNW-ESE and NNE-SSW, respectively, and σ2 near-vertical, indicating a strike-slip mechanism. Again, theanalysis shows σ3 strike of ~20°, consistent with theregional dominant tension.
The 2005 swarm is considered the most represen-tative of the seismic swarms that occurred in the Con-gro area, and it was used to perform the stress inversionwhich showed a normal faulting style (Fig. 8c). How-ever, and as it was verified for the entire Congro dataset,the β value is high (Table 4), showing one more time theexistence of a heterogeneous local stress field in thisarea.
A stress inversion analysis was done for differentdepth ranges and using the focal mechanisms of the 78best located events. The focal mechanisms of eventsshallower than 5 km were inverted and the resultsshowed a normal faulting style, with σ1 near-verticaland the other two subhorizontal axes, with σ3 strikingNNE-SSW (Fig. 8d). The uncertainties in σ1 and σ2are quite large while σ3 seems to be well determinedand in agreement with the regional stress field. The
Table 4 Stress inversion results for the datasets analyzed in the present study, with strike/dip of the principal stress axes
Dataset # FPS σ1 σ2 σ3 ϕa βb Stress regimec
All 78 112.7/5.3 −149.3/55.6 19.2/33.8 0.94 59 SS
Fogo 20 −72.5/11.1 91.3/78.4 −163.1/3.1 0.39 50 SS
Congro 51 −171/46.6 −71.9/8.6 25.9/42.1 0.56 58 Unknown
Depth<5 61 −156/62.4 111.3/1.3 20.6/27.5 0.85 54 NF
Depth>5 17 −80.7/0.5 −170.7/6.1 14.3/83.8 0.31 63 TF
October 2004 11 −71.9/13.3 164.9/66.5 22.7/19 0.22 24 SS
2005 swarm 20 −133.4/54.8 123.6/8.9 27.6/33.6 0.53 47 NF
All values in degrees
SS strike-slip, NF normal fault, TF thrust faulta The magnitude ratio of principal stress axes (see text)b The misfit anglec According to Zoback (1992)
402 J Seismol (2012) 16:389–407
stress solution obtained with events deeper than 5 kmshows reverse mechanisms (Fig. 8e). However, thissolution is more uncertain than the solution obtainedfor shallower events, and should be used carefully.Despite the uncertainties, there is a clear differencein the stress field for deep and shallow events.
5.2 Comparing Fogo and Congro areas
Since the seismicity splits naturally into two differentareas (Fogo and Congro), stress inversion, and rosediagrams were also made for these two groups (seeFig. 8b, c).
Considering both groups individually, it can beobserved that the stress tensors are better constrainedthan in the other inversions. The dominant T-axisdirection, in the rose diagrams, still follows the com-monly observed for the region in both groups, al-though it is much better defined for Fogo thanCongro. Even the P-axis direction is well defined forFogo while quite random for Congro, reflecting themixture of different focal mechanisms (Fig. 10). Thestress tensor found for the entire Fogo area dataset issimilar to the stress tensor obtained with all the 78events, as well as for the October 2004 swarm, whichseems to represent a more homogeneous stress field,since it is the dataset with the lowest β value. For theCongro area, σ1 is subvertical, σ2 subhorizontal, strik-ing WNW-ESE and σ3 subhorizontal, striking NNE-SSW. The 2005 swarm, which occurred in the Congroarea, presents a similar stress field as the whole area
but with a lower β value (Table 4). The stress tensorsare different for the two groups and could indicate thatthere is a real difference in the average stress fieldsbetween Congro and Fogo. The inconsistencies forCongro could be caused by a larger extension of thearea, indicating that the stress field is not homoge-neous over the whole region.
6 Discussion/conclusions
This study has shown that significant swarm activityhas occurred over a long period at São Miguel Islandcentral region, being particularly representative theone that took place in 2005. It was observed, for thefirst time, that the seismicity is clearly divided into twoareas, Fogo and Congro, and with the exception of the2005 swarm, most of them were constrained in smalllocalized areas. A new set of fault plane solutions wasobtained and it was demonstrated that reliable faultplane solutions can be obtained using signal ampli-tudes, even in a heterogeneous structure. From all theevents used to build fault plane solutions, 35% oc-curred during one of the identified swarms (Fig. 5),being 74% of the solutions obtained for the seismicityof Congro area while the remaining 26% were relatedwith the Fogo area. The stress solution found with allthe 78 fault plane solutions shows a minimum com-pressive stress axis (σ3) striking NNE-SSW, consis-tent with the regional stress field, with a nearlysubhorizontal WNW-ESE maximum compressive
Fig. 9 Misfit angle (β)variation along the entiredataset
J Seismol (2012) 16:389–407 403
stress axis (σ1). Studies based on geological surveys atSão Miguel (NE region) by Carmo (2004) and atGraciosa Island by Hipólito (2009), found a similarregional stress field acting at these distinct zones, withσ1 ranging from NW-SE to N-S, subhorizontal and σ3from E-W to NE-SW, also subhorizontal. Taken to-gether, all studies point to a minimum compressivestress axis (σ3) subhorizontal and oriented approxi-mately NE-SW, parallel to the direction of motion ofthe Eurasian plate relative to the African plate.
There is a significant difference between the Fogoand Congro areas seismicity, where the Fogo areaseems to have a more consistent stress field than the
whole study area, and coincident with the regionaltectonic directions (Fig. 11). The Congro area showsmore seismic activity that covers a larger area. Theformer has deeper events and a different stress field,with a permutation between σ2 and σ1, when com-pared either with the Fogo area or with the regionaldirections, suggesting the existence of a very localheterogeneous stress regime. In some cases, the com-plex geology and the highly fractured medium, alongwith the ascendant hydrothermal fluids, lead to con-ditions that favour normal faulting (e.g., Giampiccoloet al. 1999). Therefore, the extensional regime at Con-gro can be seen as a response to a compressive regime
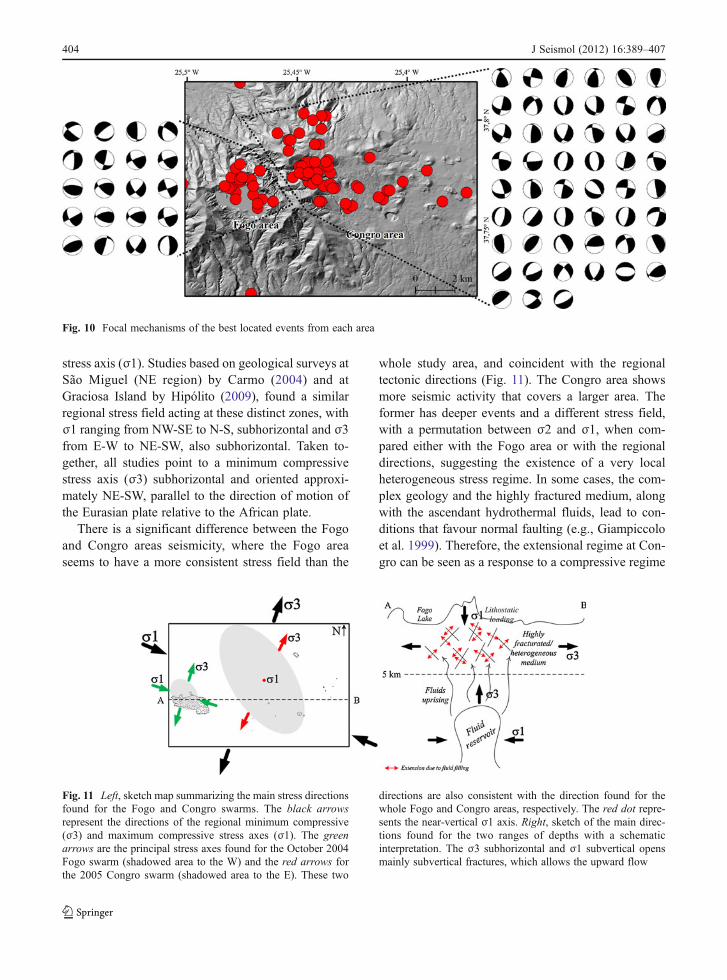
Fig. 11 Left, sketch map summarizing the main stress directionsfound for the Fogo and Congro swarms. The black arrowsrepresent the directions of the regional minimum compressive(σ3) and maximum compressive stress axes (σ1). The greenarrows are the principal stress axes found for the October 2004Fogo swarm (shadowed area to the W) and the red arrows forthe 2005 Congro swarm (shadowed area to the E). These two
directions are also consistent with the direction found for thewhole Fogo and Congro areas, respectively. The red dot repre-sents the near-vertical σ1 axis. Right, sketch of the main direc-tions found for the two ranges of depths with a schematicinterpretation. The σ3 subhorizontal and σ1 subvertical opensmainly subvertical fractures, which allows the upward flow
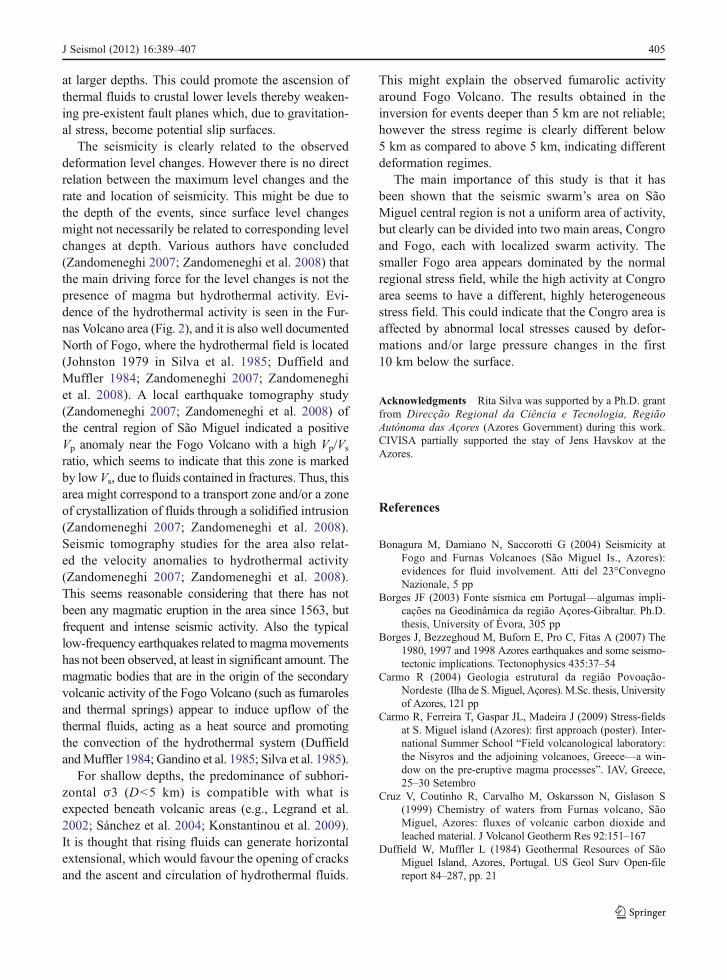
Fig. 10 Focal mechanisms of the best located events from each area
404 J Seismol (2012) 16:389–407
at larger depths. This could promote the ascension ofthermal fluids to crustal lower levels thereby weaken-ing pre-existent fault planes which, due to gravitation-al stress, become potential slip surfaces.
The seismicity is clearly related to the observeddeformation level changes. However there is no directrelation between the maximum level changes and therate and location of seismicity. This might be due tothe depth of the events, since surface level changesmight not necessarily be related to corresponding levelchanges at depth. Various authors have concluded(Zandomeneghi 2007; Zandomeneghi et al. 2008) thatthe main driving force for the level changes is not thepresence of magma but hydrothermal activity. Evi-dence of the hydrothermal activity is seen in the Fur-nas Volcano area (Fig. 2), and it is also well documentedNorth of Fogo, where the hydrothermal field is located(Johnston 1979 in Silva et al. 1985; Duffield andMuffler 1984; Zandomeneghi 2007; Zandomeneghiet al. 2008). A local earthquake tomography study(Zandomeneghi 2007; Zandomeneghi et al. 2008) ofthe central region of São Miguel indicated a positiveVp anomaly near the Fogo Volcano with a high Vp/Vsratio, which seems to indicate that this zone is markedby low Vs, due to fluids contained in fractures. Thus, thisarea might correspond to a transport zone and/or a zoneof crystallization of fluids through a solidified intrusion(Zandomeneghi 2007; Zandomeneghi et al. 2008).Seismic tomography studies for the area also relat-ed the velocity anomalies to hydrothermal activity(Zandomeneghi 2007; Zandomeneghi et al. 2008).This seems reasonable considering that there has notbeen any magmatic eruption in the area since 1563, butfrequent and intense seismic activity. Also the typicallow-frequency earthquakes related tomagmamovementshas not been observed, at least in significant amount. Themagmatic bodies that are in the origin of the secondaryvolcanic activity of the Fogo Volcano (such as fumarolesand thermal springs) appear to induce upflow of thethermal fluids, acting as a heat source and promotingthe convection of the hydrothermal system (DuffieldandMuffler 1984; Gandino et al. 1985; Silva et al. 1985).
For shallow depths, the predominance of subhori-zontal σ3 (D<5 km) is compatible with what isexpected beneath volcanic areas (e.g., Legrand et al.2002; Sánchez et al. 2004; Konstantinou et al. 2009).It is thought that rising fluids can generate horizontalextensional, which would favour the opening of cracksand the ascent and circulation of hydrothermal fluids.
This might explain the observed fumarolic activityaround Fogo Volcano. The results obtained in theinversion for events deeper than 5 km are not reliable;however the stress regime is clearly different below5 km as compared to above 5 km, indicating differentdeformation regimes.
The main importance of this study is that it hasbeen shown that the seismic swarm’s area on SãoMiguel central region is not a uniform area of activity,but clearly can be divided into two main areas, Congroand Fogo, each with localized swarm activity. Thesmaller Fogo area appears dominated by the normalregional stress field, while the high activity at Congroarea seems to have a different, highly heterogeneousstress field. This could indicate that the Congro area isaffected by abnormal local stresses caused by defor-mations and/or large pressure changes in the first10 km below the surface.
Acknowledgments Rita Silva was supported by a Ph.D. grantfrom Direcção Regional da Ciência e Tecnologia, RegiãoAutónoma das Açores (Azores Government) during this work.CIVISA partially supported the stay of Jens Havskov at theAzores.
References
Bonagura M, Damiano N, Saccorotti G (2004) Seismicity atFogo and Furnas Volcanoes (São Miguel Is., Azores):evidences for fluid involvement. Atti del 23°ConvegnoNazionale, 5 pp
Borges JF (2003) Fonte sísmica em Portugal—algumas impli-cações na Geodinâmica da região Açores-Gibraltar. Ph.D.thesis, University of Évora, 305 pp
Borges J, Bezzeghoud M, Buforn E, Pro C, Fitas A (2007) The1980, 1997 and 1998 Azores earthquakes and some seismo-tectonic implications. Tectonophysics 435:37–54
Carmo R (2004) Geologia estrutural da região Povoação-Nordeste (Ilha de S.Miguel, Açores).M.Sc. thesis, Universityof Azores, 121 pp
Carmo R, Ferreira T, Gaspar JL, Madeira J (2009) Stress-fieldsat S. Miguel island (Azores): first approach (poster). Inter-national Summer School “Field volcanological laboratory:the Nisyros and the adjoining volcanoes, Greece—a win-dow on the pre-eruptive magma processes”. IAV, Greece,25–30 Setembro
Cruz V, Coutinho R, Carvalho M, Oskarsson N, Gislason S(1999) Chemistry of waters from Furnas volcano, SãoMiguel, Azores: fluxes of volcanic carbon dioxide andleached material. J Volcanol Geotherm Res 92:151–167
Duffield W, Muffler L (1984) Geothermal Resources of SãoMiguel Island, Azores, Portugal. US Geol Surv Open-filereport 84–287, pp. 21
J Seismol (2012) 16:389–407 405
Escuer M (2006) Improving seismic Vp and Vs models of theAzores Archipelago.M.Sc. thesis, University of Azores, 99 pp
Farrel J, Husen S, Smith R (2009) Earthquake swarm and b-valuecharacterization of the Yellowstone volcano-tectonic system.J Volcanol Geotherm Res 188:260–276
Ferreira T (2000) Caracterização da actividade vulcânica da ilhade S. Miguel (Açores): vulcanismo basáltico recente ezonas de desgaseificação. Avaliação de riscos. Ph.D. thesis,University of Azores, 248 pp
Fischer T (2005) West-Bohemian earthquake swarms and theirdynamics. Ph.D. thesis, Faculty of Mathematics and Physics,Charles University (Prague), 37 pp
Fischer T, Horálek J (2005) Slip-generated patterns of swarmmicroearthquakes from West Bohemia//Vogtland (centralEurope): evidence of their triggering mechanism? J GeophysRes 110, (B05S21)
Gandino A, Guidi M, Merlo C, Mete L, Rossi R, Zan L (1985)Preliminary model of the Ribeira Grande geothermal field(Azores Islands). Geothermics 14(1):91–105
Gaspar J, Ferreira T, Queiroz G, Wallenstein N, Pacheco J,Guest J, Duncan A, Cole P (1995) Evolução morfoestru-tural do vulcão das Furnas (ilha de S. Miguel, Açores).Universidade do Porto, Faculdade de Ciências, Museu eLaboratório Mineralógico e Geológico. IV CongressoNacional de Geologia, Memória no. 4, pp. 999–1003
Giampiccolo E, Musumeci C, Malone S, Gresta S, Privitera E(1999) Seismicity and stress-tensor inversion in the CentralWashington CascadeMountains. Bull Seism Soc Am 89:811–821
Guest J, Gaspar J, Cole P, Queiroz G, Duncan A, Wallenstein N,Ferreira T, Pacheco J (1999) Volcanic Geology of FurnasVolcano, São Miguel, Azores. J Volcanol Geotherm Res92:1–29
Hardebeck J, Shearer P (2002) A new method for determiningfirst-motion focal mechanisms. Bull Seism Soc Am 92(6):2264–2276
Hardebeck J, Shearer P (2003) Using S/P amplitude ratios toconstrain the focal mechanisms of small earthquakes. BullSeism Soc Am 93(6):2434–2444
Havskov J, Ottemöller L (1999) SeisAn earthquake analysissoftware. Seism Res Lett 70:532–534
Hensch M, Riedel C, Reinhardt J, Dahm T, The NICE-People(2008) Hypocenter migration of fluid-induced earthquakeswarms in the Tjörnes Fracture Zone (North Iceland). Tec-tonophysics 447:80–94
Hill D (1977) A model for earthquake swarms. J Geophys Res82(8):1347–1352
Hipólito A (2009) Geologia estrutural da Ilha Graciosa—enqua-dramento no âmbito da Junção Tripla dos Açores. M.Sc.thesis, University of Azores, 155 pp
Husen S, Taylor R, Smith R, Healser H (2004) Changes ingeyser eruption behavior and remotely triggered seismicityin Yellowstone National Park produced by the 2002 M 7.9Denali fault earthquake, Alaska. Geology 32(6):537–540
Jónsson S, Alves M, Sigmundsson F (1999) Low rates ofdeformation of the Furnas and Fogo Volcanoes, SãoMiguel, Azores, observed with the Global Positioning Sys-tem, 1993–1997. J Volcanol Geotherm Res 92:83–94
Konstantinou K, Lin C, Liang W, Chan Y (2009) Seismogenicstress field beneath the Tatun Volcano Group, northernTaiwan. J Volcanol Geotherm Res 187:261–271
LeeWHK, Bennett R, Meagher L (1972) A method for estimatingmagnitude of local earthquakes from signal duration. USGeol Surv Open-file report, 28 pp
Legrand D, Calahorrano A, Guillier B, Rivera L, Ruiz M,Villagómez D, Yepes H (2002) Stress tensor analysis ofthe 1998–1999 tectonic swarm of northern Quito related tothe volcanic swarm of Guagua Pichincha volcano, Ecuador.Tectonophysics 344:15–36
Lienert BR, Havskov J (1995) A computer program for locatingearthquakes both locally and globally. SeismRes Lett 66:26–36
Lourenço N, Luís J, Miranda M (1997) Azores triple junctionbathymetry. Edited map by University of Lisboa (Facultyof Sciences) and by University of Algarve
Luís J, Miranda J, Galdeano A, Patriat P, Rossignol J, MendesVictor L (1994) The Açores Triple Junction evolution since10 Ma from an aeromagnetic survey of the Mid-AtlanticRidge. Earth Planet Sci Lett 125:439–460
Michael A (1984) Determination of stress from slip data: faultsand folds. J Geophys Res 89(B13):11517–11526
Michael AJ (1987a) The use of focal mechanisms to determinestress: a control study. J Geophys Res 92:357–368
Michael AJ (1987b) Stress rotation during the Coalinga after-shock sequence. J Geophys Res 92:7963–7979
Michael A, Ellsworth W, Oppenheimer D (1990) Coseismicsstress changes induced by the 1989 Loma Prieta, Californiaearthquake. Geophys Res Lett 17(9):1441–1444
Mogi K (1963) Some discussions on aftershocks, foreshocksand earthquake swarms—the fracture of a semi-infinitebody caused by an inner stress origin and its relation tothe earthquake phenomena (third paper). Bull Earthq ResInst 41:615–658
Notcutt G, Davies F (1999) Biomonitoring of volcanogenicfluoride, Furnas Caldera, São Miguel, Azores. J VolcanolGeotherm Res 92:209–214
Nunes J, Oliveira C (1999) Actividade sísmica do Vulcão doFogo, Ilha de São Miguel (Açores). Actas do I Simpósio deMeteorologia e Geofísica-Comunicações de Geofísica, pp55–60
Queiroz G (1997) Vulcão das Sete Cidades (S. Miguel, Açores)—História eruptiva e avaliação do hazard. Ph.D. thesis,University of Azores, 226 pp
Ramsey J, Huber M (1987) The tectonics of modern structuralgeology, volume 2: folds and fractures. Academic, London,pp 309–700
Reasenberg P, Oppenheimer D (1985) FPFIT, FPPLOT, andFPPAGE: FORTRAN computer programs for calculatingand displaying earthquake fault-plane solutions. US GeolSurv Open-file report, 85–739, 109 pp
Saccorotti G, Wallenstein N, Ibáñez J, Bonagura M, DamianoN, La Rocca M, Quadrio A, Silva R, Zandomeneghi D(2004) A seismic field survey at Fogo-Furnas volcanoes,Sao Miguel Island, Azores. Geophy Res Abstr 6:04493
Sánchez J, Wyss M, McNutt S (2004) Temporal-spatial variationsof stress at Redoubt Volcano, Alaska, inferred from inversionof fault plane solutions. J Volcanol Geotherm Res 130:1–30
Senos M, Nunes J, Moreira V (1992) Estudos da estrutura dacrosta e manto superior nos Açores. In: Oliveira CS, LucasARA, Correia Guedes JH (eds) Monografia 10 anos após osismo dos Açores de 1 de Janeiro de 1980—aspectostécnico-científicos, vol. I. LNEC, Lisboa, pp 205–214
406 J Seismol (2012) 16:389–407
Silva R (2004) Características da sismicidade na região central daIlha de São Miguel (Açores): identificação e análise de fam-ílias sísmicas. M.Sc. thesis, University of Azores, 136 pp
Silva A, Duffield W, Muffler L (1985) Geothermal studies ofAgua de Pau Volcano, São Miguel, Azores. GeothermResour Counc Trans 9(II):395–399
Snoke JA, Munsay JW, Teague AG, Bollinger GA (1984) Aprogram for focal mechanism determination by combineduse of polarity and SV-P amplitude ratio data. Earth Notes55(3):15
Spicák A, Horálek J (2001) Possible role of fluids in the process ofearthquake swarm generation in the West Bohemia/Vogtlandseismoactive region. Tectonophysics 336:151–161
Suetsugu D (1998) Practice on source mechanism, IISEE Lecturenote, Tsukuba, Japan, 104 pp
Trota A (2008) Crustal deformation studies in S. Miguel andTerceira Islands (Azores). Volcanic unrest evaluation inFogo/Congro area (S. Miguel). Ph.D. thesis, University ofAzores, 281 pp
Tryggvason E, Dibble R, Okada H (1989) Água de Pau volcano/seismic crisis of 1989. Final report on the UNESCO/WOVO Volcanology mission to São Miguel, Azores, 2 to8 August 1989. Relatório final da missão UNESCO/WOVO, CV-INIC, Universidade dos Açores. Not publisheddocuments, 26 pp
Wallenstein N (1999) Estudo da história recente e do comporta-mento eruptivo do Vulcão do Fogo (S. Miguel, Açores).Avaliação preliminar do hazard. Ph.D. thesis, University ofAzores, 266 pp
Zandomeneghi D (2007) Passive and active seismic tomographyof volcanic islands: São Miguel (Portugal) and Deception(Antarctica). Ph.D. thesis, University of Granada, 335 pp
Zandomeneghi D, Almendros J, Ibáñez J, Saccorotti G (2008)Seismic tomography of Central São Miguel, Azores. PhysEarth Planet Inter 167:8–18
Zoback M (1992) First- and second-order patterns of stress inthe lithosphere: the world stress map project. J GeophysRes 97(B8):11703–11728
J Seismol (2012) 16:389–407 407


![M. Billaud-Friess ,A.Nouyand O. Zahm€¦ · canonical tensors, Tucker tensors, Tensor Train tensors [27,40], Hierarchical Tucker tensors [25] or more general tree-based Hierarchical](https://img.pdfslide.net/doc/110x75/606a2ea8ed4bc80bc83876de/m-billaud-friess-anouyand-o-zahm-canonical-tensors-tucker-tensors-tensor-train.jpg)