Embed Size (px)
Citation preview

SELECT:Selenium and Vitamin E Cancer Prevention Trial

Rationale for SELECT
• Study Supplements chosen based on secondary results for prostate cancer from other randomized controlled trials– 63% risk reduction for selenized yeast (NPC)– 32% risk reduction for α-tocopherol (ATBC)– Reduction in cancer mortality for combination of
selenium, vitamin E and beta carotene (Nutrition intervention trials in Linxian, China)
• Results supported by epidemiologic and preclinical data

SELECT Schema
Calendar Year
2001 - 2013
Randomized
Pre-Randomization Period
Follow - upProstate cancer, other cancer, death
Placebo +
Selenium
Placebo +
Placebo
Vitamin E +
Placebo
Vitamin E +
Selenium
Calendar Year2001 – 2004
(Planned 2001 – 2006)

SELECT Study Supplements
Selenium
• 200 μg/d from L-selenomethionine or matched placebo
Vitamin E
• 400 IU/d all rac-α-tocopheryl acetate or matched placebo

Eligibility Criteria
• Age of ≥ 50 if African American, ≥55 otherwise• Prostate health
– No prior prostate cancer or high-grade PIN – PSA ≤ 4.0 ng/ml and DRE not suspicious for
cancer within 1 year prior to randomization
• Concurrent supplements– Must not be taking, or planning to take, any
vitamin E or selenium in addition to the Study Supplements

Eligibility Criteria
• Other health– No prior history of cancer (except basal and
squamous cell skin cancers) unless no evidence of disease for at least 5 years
– No current use of anticoagulant therapy other than <175 mg/day of aspirin or if taking Plavix < 81 mg/day
– No history of hemorrhagic stroke; normal BP (SBP < 160 mm/Hg, DBP < 90 mm/Hg)
– No diagnosis of retinitis pigmentosa

Statistical Elements
• Double-blind placebo-controlled
• Intent-to-treat analysis
• Time-to-event analysis for prostate cancers, other cancers, deaths – Cox model, Hazard rates
• Overall incidence rate for cardiovascular, diabetes, other adverse events – Χ2 test, Relative risk
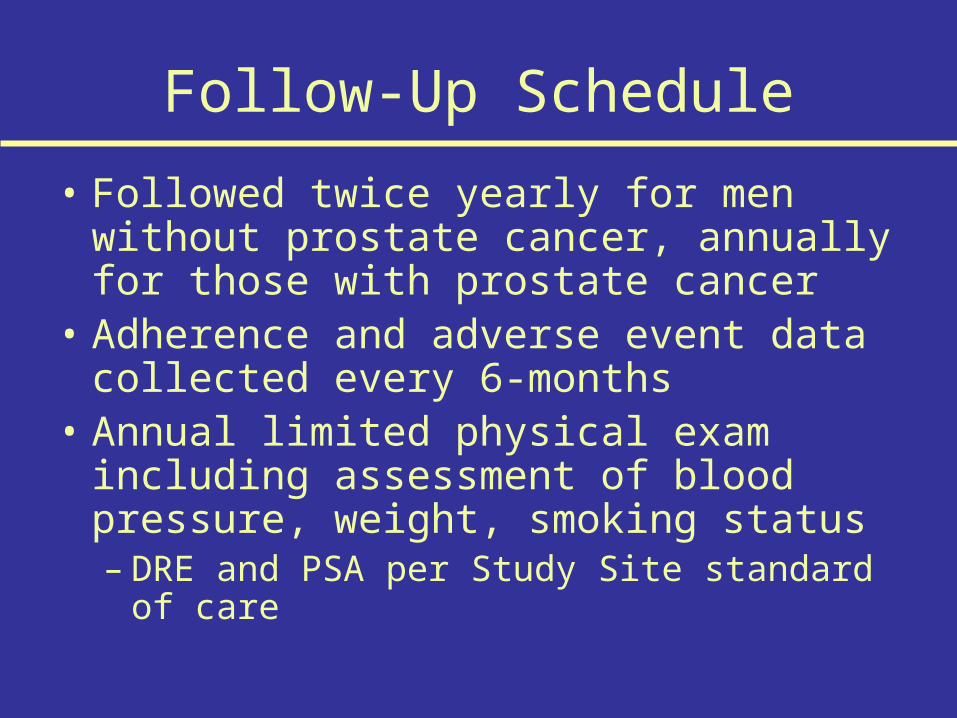
Follow-Up Schedule
• Followed twice yearly for men without prostate cancer, annually for those with prostate cancer
• Adherence and adverse event data collected every 6-months
• Annual limited physical exam including assessment of blood pressure, weight, smoking status– DRE and PSA per Study Site standard of care

Study Duration
• Assumed: 5 year uniform accrual• Actual: 3 year accrual• Follow-up: until unique calendar date• Supplementation stopped in 2008
0
0.2
0.4
0.6
0.8
1
2000 2004 2008 2012
Year
Pro
po
rtio
n o
n S
tud
y

DSMC Recommendation
• On September 15, 2008, the independent SELECT DSMC met and made the recommendation to discontinue study supplementation– No evidence of benefit for prostate cancer
incidence– Planned reduction in prostate cancer
incidence extremely unlikely in all arms and would not be seen within the timeframe of the trial (p<.0001)

Eligibility Status
Placebo (n=8856)
Vitamin E (n=8904)
Selenium (n=8910)
Combination (n=8863)
Excluded from Primary Analysis
Participants from 2 sites removed due to poor site performance
155 156 155 155
Prior prostate cancer
1 5 1 2
Randomized in error
4 6 2 3
Included in Primary Analysis
8696
(98%)
8737
(98%)
8752
(98%)
8703
(98%)

Eligibility Status
Placebo (n=8696)
Vitamin E (n=8737)
Selenium (n=8752)
Combination (n=8703)
Clinically ineligible
134 (1%) 128 (1%) 113 (1%) 113 (1%)
Insufficient baseline data
154 (2%) 151 (2%) 166 (2%) 169 (2%)
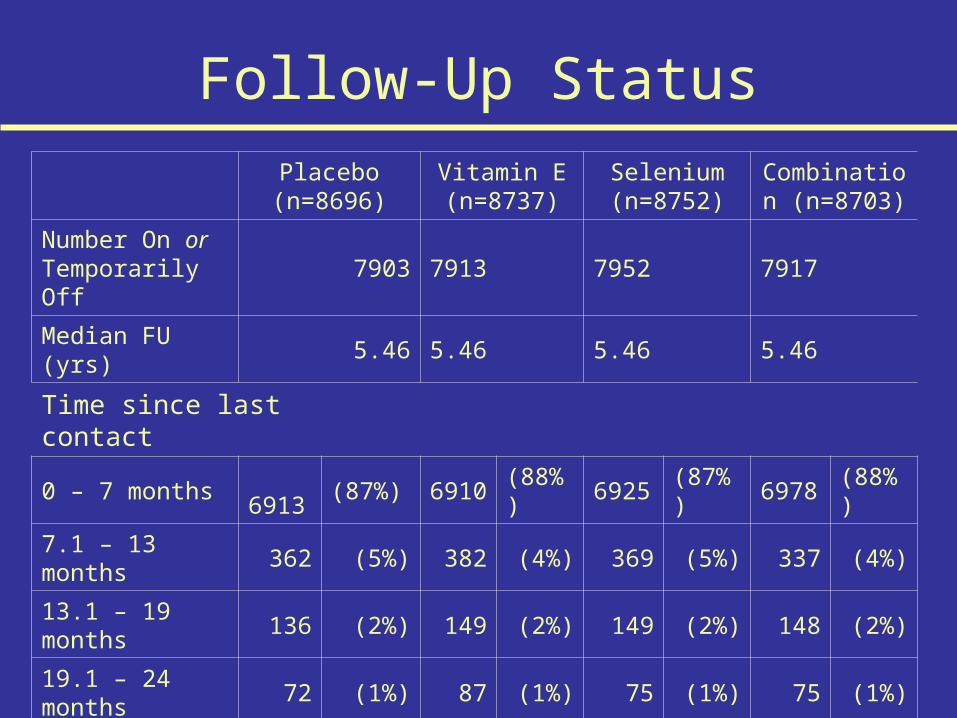
Follow-Up StatusPlacebo (n=8696)
Vitamin E (n=8737)
Selenium (n=8752)
Combination (n=8703)
Number On or Temporarily Off
7903 7913 7952 7917
Median FU (yrs) 5.46 5.46 5.46 5.46
Time since last contact
0 – 7 months 6913 (87%) 6910 (88%) 6925 (87%) 6978 (88%)
7.1 – 13 months 362 (5%) 382 (4%) 369 (5%) 337 (4%)
13.1 – 19 months 136 (2%) 149 (2%) 149 (2%) 148 (2%)
19.1 – 24 months 72 (1%) 87 (1%) 75 (1%) 75 (1%)
> 24 months 420 (5%) 385 (5%) 434 (5%) 379 (5%)

Follow-Up StatusPlacebo (n=8696)
Vitamin E (n=8737)
Selenium (n=8752)
Combination (n=8703)
Endpoint reached 793 824 800 786
Number on or temporarily off supplements
7903 7913 7952 7917
Median FU (yrs) 5.46 5.46 5.46 5.46
Time since last contact
0 – 7 months 6913 (87%) 6910 (88%) 6925 (87%) 6978 (88%)
7.1 – 13 months 362 (5%) 382 (4%) 369 (5%) 337 (4%)
13.1 – 19 months 136 (2%) 149 (2%) 149 (2%) 148 (2%)
19.1 – 24 months 72 (1%) 87 (1%) 75 (1%) 75 (1%)
> 24 months 420 (5%) 385 (5%) 434 (5%) 379 (5%)

Baseline CharacteristicsAge
Placebo (n=8696)
Vitamin E (n=8737)
Selenium (n=8752)
Combination (n=8703)
Age (years)
Median (Inter-quartile range)
62.6 (58.1 – 67.8)
62.3 (58.0 – 67.8)
62.6 (58.2 – 68.0)
62.4 (58.1 – 67.8)
50 – 54 355 4% 402 5% 337 4% 385 4%
55 – 64 5078 58% 5143 59% 5076 58% 5052 58%
65 – 74 2702 31% 2641 30% 2733 31% 2731 31%
≥ 75 561 6% 551 6% 606 7% 535 6%

Baseline CharacteristicsRace/Ethnicity
Placebo (n=8696)
Vitamin E (n=8737)
Selenium (n=8752)
Combination (n=8703)
Race/Ethnicity
White 6863 79% 6890 79% 6942 79% 6874 79%
African American 1078 12% 1107 13% 1053 12% 1076 12%
Hispanic (non-African American)
492 6% 477 5% 481 5% 484 6%
Hispanic (African American)
76 1% 103 1% 86 1% 95 1%
Other 187 2% 160 2% 190 2% 174 2%

Baseline CharacteristicsPSA
Placebo (n=8696)
Vitamin E (n=8737)
Selenium (n=8752)
Combination (n=8703)
PSA, ng/ml
0.1 – 1.0 4122 47% 4208 48% 4218 48% 4213 48%
1.1 – 2.0 2728 31% 2653 30% 2661 30% 2666 31%
2.1 – 3.0 1168 13% 1228 14% 1211 14% 1149 13%
3.1 – 4.0 666 8% 634 7% 652 7% 659 8%
> 4.0 5 <1% 3 <1% 2 <1% 1 <1%
Unknown/missing 7 <1% 11 <1% 8 <1% 15 <1%

Baseline CharacteristicsSmoking Status
Placebo (n=8696)
Vitamin E (n=8737)
Selenium (n=8752)
Combination (n=8703)
Smoking Status
Never 3682 42% 3752 43% 3780 43% 3666 42%
Current 655 8% 659 8% 631 7% 670 8%
Former 4208 48% 4194 48% 4214 48% 4242 49%
Ever (current status unknown)
63 1% 55 1% 61 1% 56 1%
Unknown 88 1% 77 1% 66 1% 69 1%

Baseline CharacteristicsEducation
Placebo (n=8696)
Vitamin E (n=8737)
Selenium (n=8752)
Combination (n=8703)
Education (highest level)
≤ High school grad or GED
1993 23% 1875 22% 1917 22% 1898 22%
Some college or vocational school
2291 26% 2387 27% 2327 27% 2348 27%
≥ College graduate 4317 50% 4394 51% 4430 51% 4372 50%
Unknown/missing 95 1% 81 1% 78 1% 85 1%

Adherence
0%
20%
40%
60%
80%
100%
1 2 3 4 5
Year on Study
Per
cen
t A
dh
eren
t
Per study design
Vitamin E or selenium
Vitamin E and selenium

Serum Selenium (μg/L)
0
40
80
120
160
200
240
280
Placebo Vitamin E Selenium Combination
Se
rum
Se
len
ium
Baseline6 months1 year2 years4 years
Data from the adherence cohort

α-tocopherol (μg/mL)*
02468
101214161820
Placebo Vitamin E Selenium Vitamin E +Selenium
Ser
um
α-t
oco
ph
ero
l
Baseline6 months1 year2 years4 years
* Cholesterol-adjusted; Participants from adherence cohort

γ-tocopherol (μg/mL)*
0.00.20.40.60.81.01.21.41.61.82.0
Placebo Vitamin E Selenium Vitamin E +Selenium
Ser
um
γ-t
oco
ph
ero
l
Baseline6 months1 year2 years4 years
* Cholesterol-adjusted; Participants from adherence cohort

Drop-Ins
0%
2%
4%
6%
8%
10%
12%
1 2 3 4 5Year on Study
Per
cen
t D
rop
-In
Per study designSeleniumVitamin E

Prostate Cancer IncidencePer Study Design* and Actual
0
2
4
6
8
10
12
1 2 3 4 5Study Year
Ca
se
s p
er
1,0
00
Per study design
Actual (PSA ≤ 4)
Actual (PSA ≤ 3)
* PCPT rates for years 1 – 3 and 1995 SEER rates thereafter.
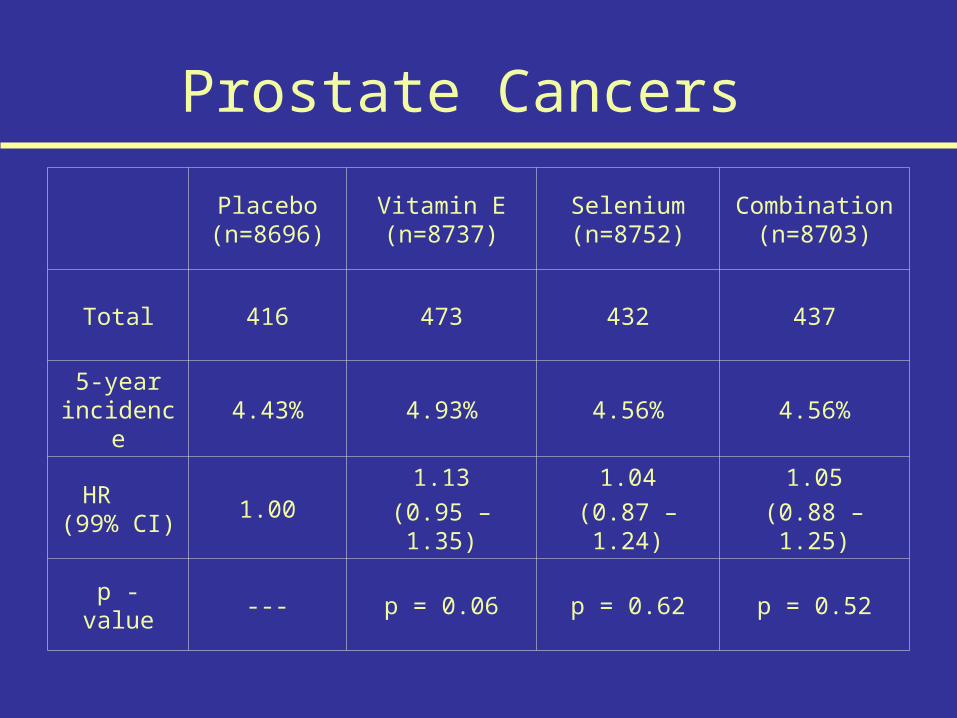
Prostate Cancers
Placebo (n=8696)
Vitamin E (n=8737)
Selenium (n=8752)
Combination (n=8703)
Total 416 473 432 437
5-year incidence
4.43% 4.93% 4.56% 4.56%
HR (99% CI)
1.001.13
(0.95 – 1.35)
1.04
(0.87 – 1.24)
1.05
(0.88 – 1.25)
p - value --- p = 0.06 p = 0.62 p = 0.52

Prostate Cancers
1.131.00
1.04 1.05
0.00
0.20
0.40
0.60
0.80
1.00
1.20
1.40
1.60
1.80
2.00
Placebo Vitamin E Selenium Combination
Haz
ard
Rat
io
99% CI 0.95 – 1.35
p=0.06
99% CI 0.87 – 1.24
p=0.62
99% CI 0.88 – 1.25
p=0.52

Prostate Cancer
Placebo Vitamin E Selenium Vitamin E + selenium

Prostate CancerMethod of Diagnosis
Placebo (n=416)
Vitamin E (n=473)
Selenium (n=432)
Combination (n=437)
Diagnosed by biopsy 404 97% 458 97% 419 97% 420 96%
Number of biopsies 1020 1011 982 997
Reason for Biopsy (positive biopsies)
Elevated PSA 259 64% 324 71% 296 71% 263 63%
PSA Velocity 12 3% 10 2% 13 3% 16 4%
Abnormal DRE 66 16% 58 13% 46 11% 56 13%
PSA + DRE 55 14% 49 11% 56 13% 72 17%

Prostate Cancer - Gleason Score
Placebo (n=416)
Vitamin E (n=473)
Selenium (n=432)
Combination (n=437)
Number graded 365 396 361 365
Gleason Score
2 - 6 240 66% 249 63% 217 60% 220 60%
7 (3+4) 80 22% 97 24% 105 29 91 25%
7 (4+3) 21 6% 27 7% 19 5% 24 7%
8 - 10 24 7% 23 6% 20 6% 30 8%

Prostate Cancer - Clinical Stage
Placebo (n=416)
Vitamin E (n=473)
Selenium (n=432)
Combination (n=437)
T-Stage
T1 a-c 278 70% 343 75% 301 73% 286 69%
T2 a-b 122 30% 114 25% 108 26% 128 31%
T3 a-b 0 0% 2 0% 5 1% 3 1%
N-Stage
N0 109 100% 127 100% 125 99% 117 100%
N1 0 0% 0 0% 1 1% 0 0%
M-Stage
M0 124 100% 134 99% 122 96% 119 98%
M1a-b 0 0% 2 1% 5 4% 2 2%

Annual PSA Tests
0
10
20
30
40
50
60
70
80
90
100
Year 1 Year 2 Year 3 Year 4 Year 5
Per
cen
t D
on
e
Placebo
Vitamin E
Selenium
Combination

Annual DRE Tests
0
10
20
30
40
50
60
70
80
90
100
Year 1 Year 2 Year 3 Year 4 Year 5
Per
cen
t D
on
e
Placebo
Vitamin E
Selenium
Combination

Other Cancers
Placebo (n=8696)
Vitamin E (n=8737)
Selenium (n=8752)
Combination (n=8703)
N
RR
N
RR (99% CI)
N
RR (99% CI)
N
RR (99% CI)
Any cancer (including prostate)
824
1.00
856
1.03 (0.91 – 1.17)
837
1.01 (0.89 – 1.15)
846
1.02 (0.90 – 1.16)
Lung67
1.00
67
1.00 (0.64 – 1.55)
75
1.12 (0.73 – 1.72)
78
1.16 (0.76 – 1.78)
Colorectal60
1.00
66
1.09 (0.69 – 1.73)
63
1.05 (0.66 – 1.67)
77
1.28 (0.82 – 2.00)
Other primary306
1.00
274
0.89 (0.72 – 1.10)
292
0.95 (0.77 – 1.17)
290
0.94 (0.76 – 1.16)
All p-values > 0.15

Total Cancers
1.021.011.00 1.03
0.00
0.20
0.40
0.60
0.80
1.00
1.20
1.40
1.60
1.80
2.00
Placebo Vitamin E Selenium Combination
Haz
ard
Rat
io
99% CI 0.91 – 1.17
99% CI 0.89 – 1.15
99% CI 0.90 – 1.16

Lung Cancer Colorectal Cancer
All Other Primary Cancers Deaths
Placebo Vitamin E Selenium Vitamin E + selenium

Cumulative Death RatePer Study Design* and Actual
0
10
20
30
40
50
60
70
80
1 2 3 4 5 6
Study Year
Dea
ths
per
1,0
00
Per study design
Actual
* Estimated for placebo arm based on PCPT for the first 4 years and then adjusted upwards to 1995 US rates for all races combined.

Deaths
Placebo (n=8696)
Vitamin E (n=8737)
Selenium (n=8752)
Combination (n=8703)
N
HR
N
HR (99% CI)
N
HR (99% CI)
N
HR (99% CI)
All deaths382
1.00
358
0.93 (0.77 – 1.13)
378
0.99 (0.82 – 1.19)
359
0.94 (0.77 – 1.13)
Cancer deaths125
1.00
106
0.84 (0.60 – 1.18)
128
1.02 (0.74 – 1.41)
117
0.93 (0.67 – 1.30)
Cardiovascular deaths
142
1.00
119
0.84 (0.61 – 1.15)
129
0.91 (0.66 – 1.24)
117
0.82 (0.60 – 1.13)
Other deaths115
1.00
133
1.15 (0.83 – 1.60)
121
1.05 (0.75 – 1.47)
125
1.08 (0.78 – 1.51)

Cardiovascular Events
Placebo (n=8696)
Vitamin E (n=8737)
Selenium (n=8752)
Combination (n=8703)
N
RR
N
RR (99% CI)
N
RR (99% CI)
N
RR (99% CI)
All Cardiovascular
events*
1050
1.00
1034
0.98 (0.88 – 1.09)
1080
1.02 (0.92 – 1.13)
1041
0.99 (0.89 – 1.10)
* Grades 3 – 5 (includes deaths)

Cardiovascular EventsNon-fatal Strokes
Placebo (n=8696)
Vitamin E (n=8737)
Selenium (n=8752)
Combination (n=8703)
N
RR
N
RR (99% CI)
N
RR (99% CI)
N
RR (99% CI)
Hemorrhagic11
1.00
7
0.63 (0.18 – 2.20)
11
0.99 (0.33 – 2.98)
12
1.09 (0.37 – 3.19)
Ischemic56
1.00
49
0.87 (0.51 – 1.44)
51
0.90 (0.55 – 1.49)
67
1.20 (0.75 – 1.90)
NOS25
1.00
14
0.56 (0.24 – 1.32)
11
0.44 (0.17 – 1.11)
20
0.80 (0.37 – 1.73)

Cardiovascular EventsOther Non-fatal Events
Placebo (n=8696)
Vitamin E (n=8737)
Selenium (n=8752)
Combination (n=8703)
N
RR
N
RR (99% CI)
N
RR (99% CI)
N
RR (99% CI)
Grade 3626
1.00
642
1.02 (0.89 – 1.17)
685
1.09 (0.95 – 1.25)
624
1.00 (0.87 – 1.15)
Grade 4190
1.00
203
1.06 (0.82 – 1.38)
193
1.01 (0.78 – 1.31)
201
1.06 (0.82 – 1.37)

Diabetes Diagnoses
Placebo (n=7156)
Vitamin E (n=7215)
Selenium (n=7210)
Combination (n=7248)
Number (%) 669 (9.3%) 700 (9.7%) 724 (10.0%) 660 (9.1%)
Relative Risk (99% CI)
1.001.04 (0.91 – 1.18)
1.07 (0.94 – 1.22)
0.97 (0.85 – 1.11)
p-value -- p = 0.47 p = 0.16 p = 0.61
Based on self-report of diabetes or reported use of diabetes medications of the glitazone class.
Excludes prevalent cases at randomization (n=3625) and participants not evaluated for diabetes because they either died or were lost to follow-up prior to the assessment (n=2434).

Events Known to Be Associated with Study Supplements
Placebo (n=8696)
Vitamin E (n=8737)
Selenium (n=8752)
Combination (n=8703)
N
RR
N
RR (99% CI)
N
RR (99% CI)
N
RR (99% CI)
Alopecia206
1.00
220
1.06 (0.83 – 1.36)
265
1.28 (1.01 – 1.62)
238
1.15 (0.91 – 1.47)
Dermatitis
Grades 1 – 2 516
1.00
591
1.14 (0.98 – 1.32)
605
1.17 (1.00 – 1.35)
554
1.07 (0.92– 1.25)
Grades 3 – 48
1.00
12
1.49 (0.46 – 4.83)
14
1.74 (0.56 – 5.44)
16
2.00 (0.66 – 6.09)
= p < 0.01

Events Known to Be Associated with Study Supplements
Placebo (n=8696)
Vitamin E (n=8737)
Selenium (n=8752)
Combination (n=8703)
N
RR
N
RR (99% CI)
N
RR (99% CI)
N
RR (99% CI)
Halitosis427
1.00
493
1.15 (0.97 – 1.36)
503
1.17 (0.99 – 1.38)
531
1.24 (1.06 – 1.46)
Nail changes1035
1.00
1041
1.00 (0.90 – 1.11)
1087
1.04 (0.94 – 1.26)
1075
1.04 (0.93 – 1.15)
= p < 0.01

Events Known to Be Associated with Study Supplements
Placebo (n=8696)
Vitamin E (n=8737)
Selenium (n=8752)
Combination (n=8703)
N
RR
N
RR (99% CI)
N
RR (99% CI)
N
RR (99% CI)
Fatigue
Grades 1 – 2 586
1.00
604
1.03 (0.89 – 1.19)
645
1.09 (0.95 – 1.26)
612
1.04 (0.90– 1.20)
Grades 3 – 424
1.00
29
1.20 (0.59 – 2.45)
21
0.87 (0.40 – 1.88)
20
0.83 (0.38 – 1.81)
Nausea
Grades 1 – 2 203
1.00
191
0.94 (0.72 – 1.21)
244
1.19 (0.94 – 1.52)
202
0.99 (0.77– 1.28)
Grade 39
1.00
3
0.33 (0.06 – 1.85)
9
0.99 (0.30 – 3.34)
8
0.89 (0.25 – 3.10)

Study Strengths
• Robust statistical design– Ample power for 5 comparisons between arms– Very large study population, including African
Americans– Baseline characteristics well balanced– Design assumptions largely met
• Rigorous implementation– SELECT Workbench– Web-based forms with detailed edit checks– Semi-annual staff training; targeted mentoring

Study Limitations
• Not designed to test different supplement formulations and doses
• Unable to assess effects in reducing advanced or fatal prostate cancer– Active annual screening reduced incidence of advanced
disease across all study arms
• Unable to assess effects in a vitamin E and/or selenium deficient population– Study population well-nourished at baseline

Conclusion
SELECT has definitively demonstrated that, in these doses and formulations, selenium, vitamin E, and selenium + vitamin E do not prevent prostate cancer in the generally healthy, heterogeneous population of men in SELECT.

Other Findings
• No difference in rates of lung, colon or other primary cancers
• No differences in deaths

Other Findings
• Vitamin E: Statistically nonsignificant increase in prostate cancer (HR 1.13, 99% CI 0.95 – 1.35, p=.06)
• Selenium: Statistically nonsignificant increase in type 2 diabetes mellitus (RR 1.07, 99% CI 0.94 – 1.22, p=.16)
• Neither difference seen in vitamin E + selenium group

Vitamin E: Why Not a Positive Finding?
• Dose– The higher dose (400 IU/day) may be less effective
than the lower dose (50 IU/day)– Effect on suppression of γ-tocopherol may be
greater with the higher dose• Population
– Vitamin E may be most effective in smokers; SELECT population is only 7.5% smokers compared to ATBC which was 100%
• Inherent problems with secondary/exploratory findings of other trials; it’s why we do carefully controlled trials to answer the question

Selenium: Why Not a Positive Finding?
• Formulation– l-selenomethionine was chosen over high-selenium yeast– Selenomethionine is the major component of the high-
selenium yeast– Pilots showed large batch-to-batch variation in the yeast
• Population– Prior study had men chosen because they were
deficient in selenium; selenium was most protective in those with the lowest levels
– Our population were replete in baseline selenium• Inherent problems with secondary/exploratory
findings of other trials; it’s why we do carefully controlled trials to answer the question