Embed Size (px)
Citation preview
Selected Financial Informationunder Japanese GAAP
For the Fiscal Year Ended March 31, 2003
Mitsubishi Tokyo Financial Group, Inc.
1 Consolidated Financial Highlights under Japanese GAAP for the Fiscal Year Ended March 31, 2003
1.Financial Results [Consolidated] ------------ 12. Valuation Differences on Securities [Consolidated] , [Trust] ------------ 23. Risk-Adjusted Capital Ratio Based on the Standards of the BIS [Consolidated] ------------ 34. Return on Equity [Consolidated] ------------ 3
2 Loan Portfolio and Other
1. Risk-Monitored Loans [Consolidated] , [Trust] ------------ 4 [Consolidated and Trust]
2. Allowance for Loan Losses [Consolidated] , [Trust] ------------ 63. Coverage Ratio against Risk-Monitored Loans [Consolidated] ------------ 64. Disclosed Claims under the Financial Reconstruction Law (the ”FRL”) [Total of the 2 Banks*] ------------ 75. Status of Secured Coverage on Disclosed Claims under the FRL [Total of the 2 Banks*] ------------ 76. Progress in the Disposal of Problem Assets [Total of the 2 Banks*] ------------ 87. Classification of Loans by Type of Industry [Total of the 2 Banks*] ------------ 11
[Trust]
8. Foreign Loans [Total of the 2 Banks*] ------------ 139. Loans and Deposits [Total of the 2 Banks*] ------------ 1410. Domestic Deposits [Total of the 2 Banks*] ------------ 1411. Number of Employees [Total of the 2 Banks*] ------------ 1412. Number of Offices [Total of the 2 Banks*] ------------ 1413. Employees' Retirement Benefits [Consolidated] ------------ 1514. Earning Projections for the Fiscal Year ending March 31, 2004 [Consolidated] ------------ 16
[Non-Consolidated]
Note: * "Total of the 2 Banks" stands for the aggregated non-consolidated figures of The Bank of Tokyo-Mitsubishi, Ltd. And The Mitsubishi Trust and Banking Corporation.
[Contents]
Mitsubishi Tokyo Financial Group, Inc.
1 Consolidated Financial Highlights under Japanese GAAP for the Fiscal Year Ended March 31, 2003
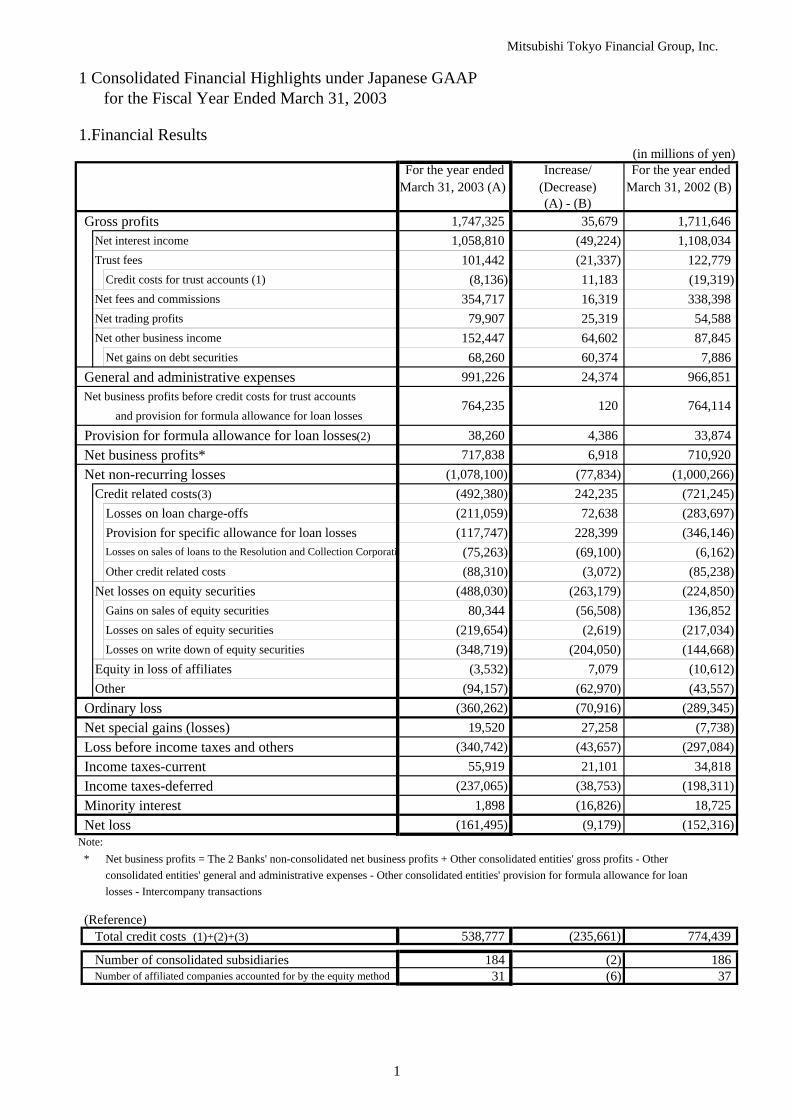
1.Financial Results(in millions of yen)
For the year ended Increase/ For the year endedMarch 31, 2003 (A) (Decrease) March 31, 2002 (B)
(A) - (B) Gross profits 1,747,325 35,679 1,711,646
Net interest income 1,058,810 (49,224) 1,108,034 Trust fees 101,442 (21,337) 122,779
Credit costs for trust accounts (1) (8,136) 11,183 (19,319)Net fees and commissions 354,717 16,319 338,398 Net trading profits 79,907 25,319 54,588 Net other business income 152,447 64,602 87,845
Net gains on debt securities 68,260 60,374 7,886 General and administrative expenses 991,226 24,374 966,851 Net business profits before credit costs for trust accounts
and provision for formula allowance for loan losses
Provision for formula allowance for loan losses(2) 38,260 4,386 33,874 Net business profits* 717,838 6,918 710,920 Net non-recurring losses (1,078,100) (77,834) (1,000,266)
Credit related costs(3) (492,380) 242,235 (721,245)Losses on loan charge-offs (211,059) 72,638 (283,697)Provision for specific allowance for loan losses (117,747) 228,399 (346,146)
(75,263) (69,100) (6,162)Other credit related costs (88,310) (3,072) (85,238)
Net losses on equity securities (488,030) (263,179) (224,850)Gains on sales of equity securities 80,344 (56,508) 136,852 Losses on sales of equity securities (219,654) (2,619) (217,034)Losses on write down of equity securities (348,719) (204,050) (144,668)
Equity in loss of affiliates (3,532) 7,079 (10,612)Other (94,157) (62,970) (43,557)
Ordinary loss (360,262) (70,916) (289,345)Net special gains (losses) 19,520 27,258 (7,738)Loss before income taxes and others (340,742) (43,657) (297,084)Income taxes-current 55,919 21,101 34,818 Income taxes-deferred (237,065) (38,753) (198,311)Minority interest 1,898 (16,826) 18,725 Net loss (161,495) (9,179) (152,316)
* Net business profits = The 2 Banks' non-consolidated net business profits + Other consolidated entities' gross profits - Other consolidated entities' general and administrative expenses - Other consolidated entities' provision for formula allowance for loanlosses - Intercompany transactions
(Reference)Total credit costs (1)+(2)+(3) 538,777 (235,661) 774,439
Number of consolidated subsidiaries 184 (2) 186 Number of affiliated companies accounted for by the equity method 31 (6) 37
764,235 120 764,114
Note:
Losses on sales of loans to the Resolution and Collection Corporati
1
Mitsubishi Tokyo Financial Group, Inc.
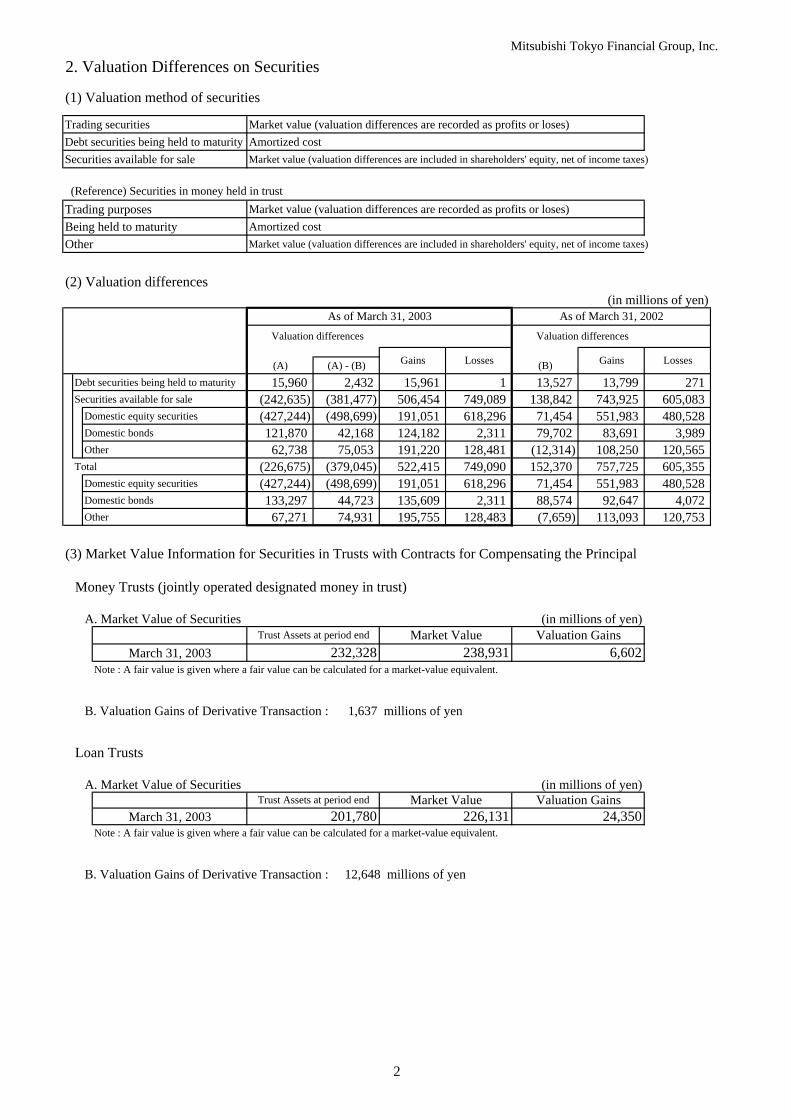
2. Valuation Differences on Securities
(1) Valuation method of securities
Trading securities Market value (valuation differences are recorded as profits or loses)Debt securities being held to maturity Amortized costSecurities available for sale Market value (valuation differences are included in shareholders' equity, net of income taxes)
(Reference) Securities in money held in trustTrading purposes Market value (valuation differences are recorded as profits or loses)Being held to maturity Amortized costOther Market value (valuation differences are included in shareholders' equity, net of income taxes)
(2) Valuation differences(in millions of yen)
(A) (A) - (B) (B)Debt securities being held to maturity 15,960 2,432 15,961 1 13,527 13,799 271 Securities available for sale (242,635) (381,477) 506,454 749,089 138,842 743,925 605,083
Domestic equity securities (427,244) (498,699) 191,051 618,296 71,454 551,983 480,528 Domestic bonds 121,870 42,168 124,182 2,311 79,702 83,691 3,989 Other 62,738 75,053 191,220 128,481 (12,314) 108,250 120,565
Total (226,675) (379,045) 522,415 749,090 152,370 757,725 605,355 Domestic equity securities (427,244) (498,699) 191,051 618,296 71,454 551,983 480,528 Domestic bonds 133,297 44,723 135,609 2,311 88,574 92,647 4,072 Other 67,271 74,931 195,755 128,483 (7,659) 113,093 120,753
(3) Market Value Information for Securities in Trusts with Contracts for Compensating the Principal
Money Trusts (jointly operated designated money in trust)
A. Market Value of Securities (in millions of yen)
March 31, 2003Note : A fair value is given where a fair value can be calculated for a market-value equivalent.
B. Valuation Gains of Derivative Transaction : 1,637 millions of yen
Loan Trusts
A. Market Value of Securities (in millions of yen)
March 31, 2003Note : A fair value is given where a fair value can be calculated for a market-value equivalent.
B. Valuation Gains of Derivative Transaction : 12,648 millions of yen
Valuation Gains226,131 24,350
Market Value Valuation Gains238,931 6,602
201,780
232,328
Trust Assets at period end Market Value
Trust Assets at period end
Valuation differences
Losses
As of March 31, 2002
Gains Gains
Valuation differences
Losses
As of March 31, 2003
2
Mitsubishi Tokyo Financial Group, Inc.
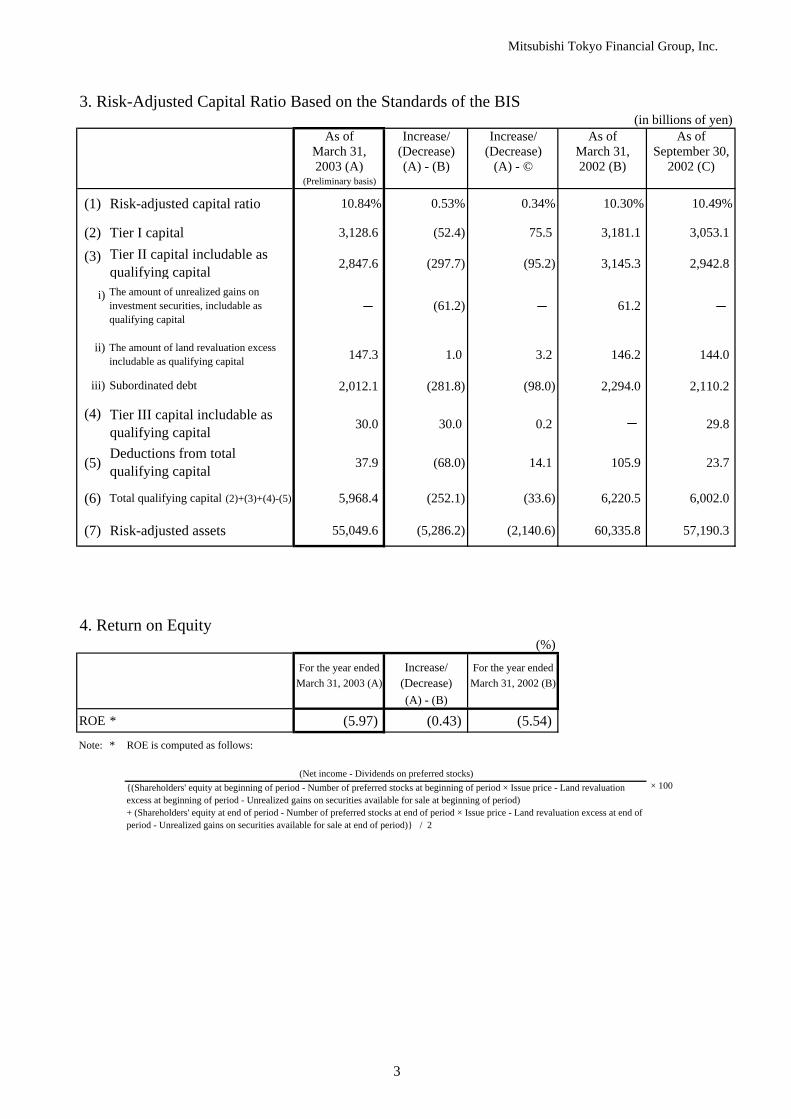
3. Risk-Adjusted Capital Ratio Based on the Standards of the BIS(in billions of yen)
As of Increase/ Increase/ As of As ofMarch 31, (Decrease) (Decrease) March 31, September 30,2003 (A) (A) - (B) (A) - © 2002 (B) 2002 (C)
(Preliminary basis)
(1) Risk-adjusted capital ratio 10.84% 0.53% 0.34% 10.30% 10.49%
(2) Tier I capital 3,128.6 (52.4) 75.5 3,181.1 3,053.1
(3) 2,847.6 (297.7) (95.2) 3,145.3 2,942.8
i)
ii)
iii) Subordinated debt 2,012.1 (281.8) (98.0) 2,294.0 2,110.2
(4)30.0 30.0 0.2 29.8
(5) 37.9 (68.0) 14.1 105.9 23.7
(6) Total qualifying capital (2)+(3)+(4)-(5) 5,968.4 (252.1) (33.6) 6,220.5 6,002.0
(7) Risk-adjusted assets 55,049.6 (5,286.2) (2,140.6) 60,335.8 57,190.3
4. Return on Equity(%)
For the year ended Increase/ For the year endedMarch 31, 2003 (A) (Decrease) March 31, 2002 (B)
(A) - (B)
ROE * (5.97) (0.43) (5.54) Note: * ROE is computed as follows:
× 100(Net income - Dividends on preferred stocks)
{(Shareholders' equity at beginning of period - Number of preferred stocks at beginning of period × Issue price - Land revaluationexcess at beginning of period - Unrealized gains on securities available for sale at beginning of period)+ (Shareholders' equity at end of period - Number of preferred stocks at end of period × Issue price - Land revaluation excess at end ofperiod - Unrealized gains on securities available for sale at end of period)} / 2
(61.2)The amount of unrealized gains oninvestment securities, includable asqualifying capital
The amount of land revaluation excessincludable as qualifying capital
61.2
Tier II capital includable asqualifying capital
Deductions from totalqualifying capital
144.0 147.3 1.0 3.2 146.2
Tier III capital includable asqualifying capital
3
Mitsubishi Tokyo Financial Group, Inc.
2 Loan Portfolio and Other
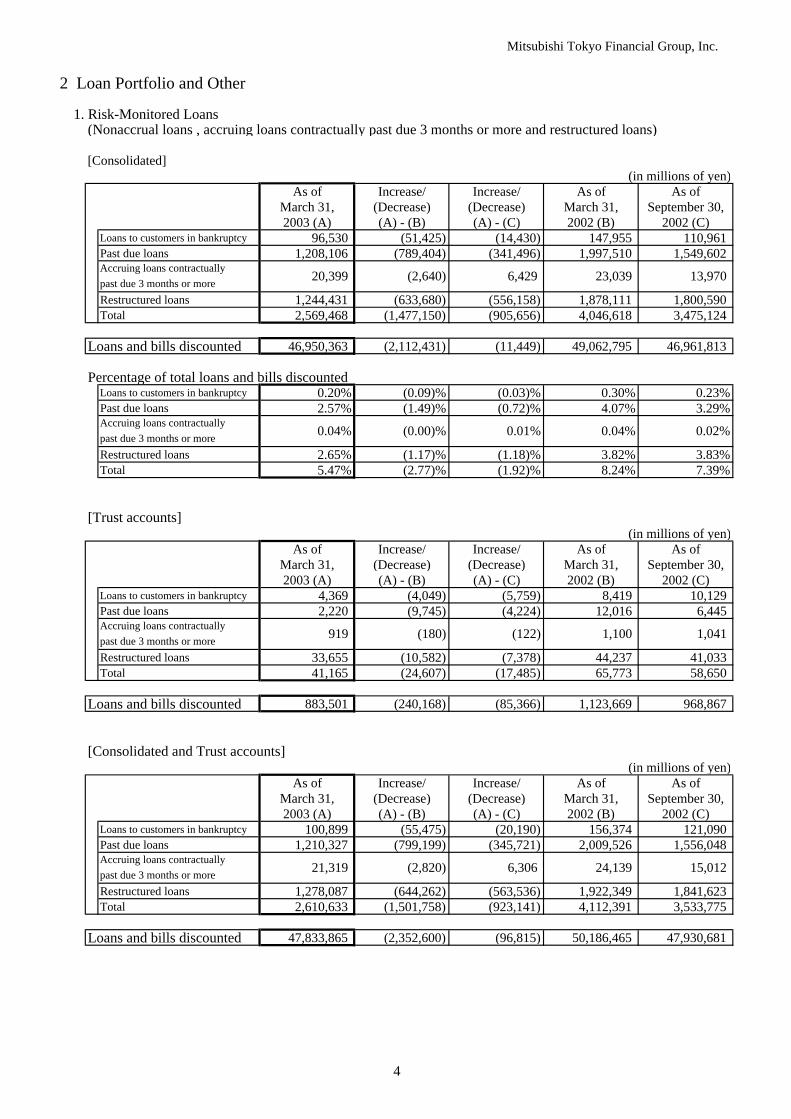
1. Risk-Monitored Loans(Nonaccrual loans , accruing loans contractually past due 3 months or more and restructured loans)
[Consolidated](in millions of yen)
As of Increase/ Increase/ As of As ofMarch 31, (Decrease) (Decrease) March 31, September 30,2003 (A) (A) - (B) (A) - (C) 2002 (B) 2002 (C)
Loans to customers in bankruptcy 96,530 (51,425) (14,430) 147,955 110,961 Past due loans 1,208,106 (789,404) (341,496) 1,997,510 1,549,602
past due 3 months or moreRestructured loans 1,244,431 (633,680) (556,158) 1,878,111 1,800,590 Total 2,569,468 (1,477,150) (905,656) 4,046,618 3,475,124
Loans and bills discounted 46,950,363 (2,112,431) (11,449) 49,062,795 46,961,813
Percentage of total loans and bills discountedLoans to customers in bankruptcy 0.20% (0.09)% (0.03)% 0.30% 0.23%Past due loans 2.57% (1.49)% (0.72)% 4.07% 3.29%
past due 3 months or moreRestructured loans 2.65% (1.17)% (1.18)% 3.82% 3.83%Total 5.47% (2.77)% (1.92)% 8.24% 7.39%
[Trust accounts](in millions of yen)
As of Increase/ Increase/ As of As ofMarch 31, (Decrease) (Decrease) March 31, September 30,2003 (A) (A) - (B) (A) - (C) 2002 (B) 2002 (C)
Loans to customers in bankruptcy 4,369 (4,049) (5,759) 8,419 10,129 Past due loans 2,220 (9,745) (4,224) 12,016 6,445
past due 3 months or moreRestructured loans 33,655 (10,582) (7,378) 44,237 41,033 Total 41,165 (24,607) (17,485) 65,773 58,650
Loans and bills discounted 883,501 (240,168) (85,366) 1,123,669 968,867
[Consolidated and Trust accounts](in millions of yen)
As of Increase/ Increase/ As of As ofMarch 31, (Decrease) (Decrease) March 31, September 30,2003 (A) (A) - (B) (A) - (C) 2002 (B) 2002 (C)
Loans to customers in bankruptcy 100,899 (55,475) (20,190) 156,374 121,090 Past due loans 1,210,327 (799,199) (345,721) 2,009,526 1,556,048
past due 3 months or moreRestructured loans 1,278,087 (644,262) (563,536) 1,922,349 1,841,623 Total 2,610,633 (1,501,758) (923,141) 4,112,391 3,533,775
Loans and bills discounted 47,833,865 (2,352,600) (96,815) 50,186,465 47,930,681
6,306 24,139 15,012 Accruing loans contractually
21,319 (2,820)
(0.00)% 0.01% 0.04% 0.02%
Accruing loans contractually20,399
Accruing loans contractually0.04%
(2,640) 6,429 23,039 13,970
(122) 1,100 1,041 Accruing loans contractually
919 (180)
4
Mitsubishi Tokyo Financial Group, Inc.
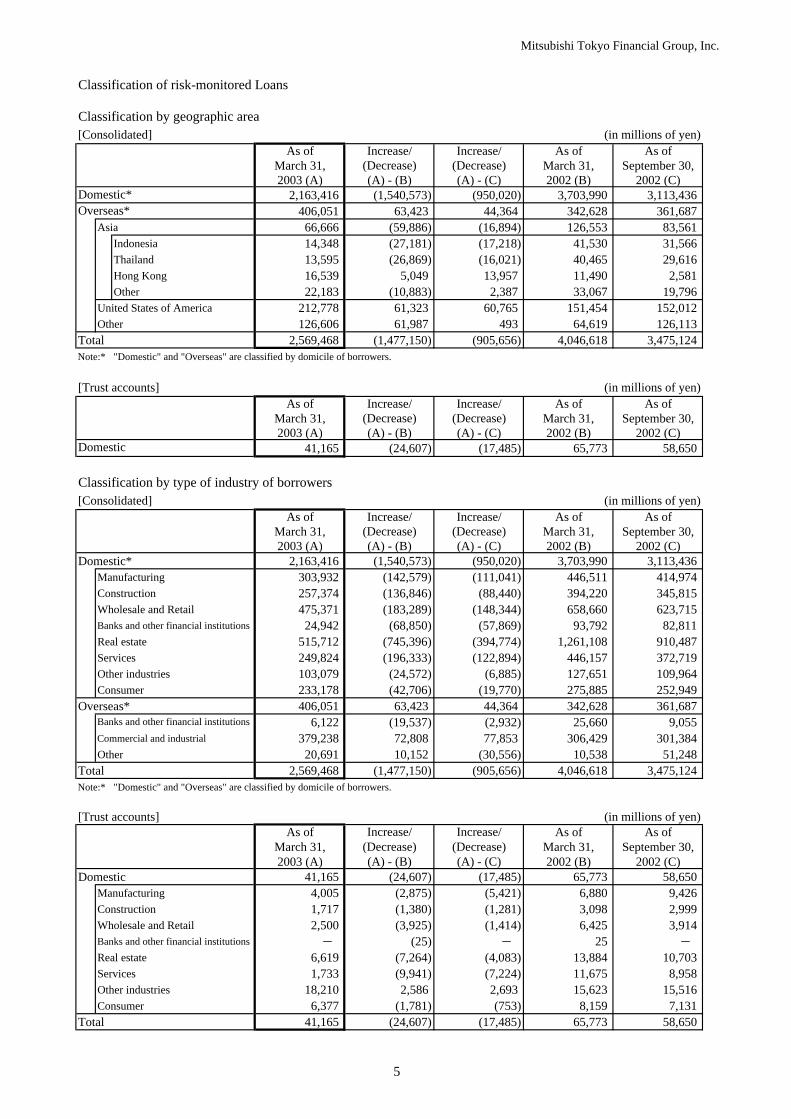
Classification of risk-monitored Loans
Classification by geographic area[Consolidated] (in millions of yen)
As of Increase/ Increase/ As of As ofMarch 31, (Decrease) (Decrease) March 31, September 30,2003 (A) (A) - (B) (A) - (C) 2002 (B) 2002 (C)
2,163,416 (1,540,573) (950,020) 3,703,990 3,113,436 406,051 63,423 44,364 342,628 361,687
Asia 66,666 (59,886) (16,894) 126,553 83,561 Indonesia 14,348 (27,181) (17,218) 41,530 31,566 Thailand 13,595 (26,869) (16,021) 40,465 29,616 Hong Kong 16,539 5,049 13,957 11,490 2,581 Other 22,183 (10,883) 2,387 33,067 19,796
United States of America 212,778 61,323 60,765 151,454 152,012 Other 126,606 61,987 493 64,619 126,113
Total 2,569,468 (1,477,150) (905,656) 4,046,618 3,475,124 Note:* "Domestic" and "Overseas" are classified by domicile of borrowers.
[Trust accounts] (in millions of yen)As of Increase/ Increase/ As of As of
March 31, (Decrease) (Decrease) March 31, September 30,2003 (A) (A) - (B) (A) - (C) 2002 (B) 2002 (C)
41,165 (24,607) (17,485) 65,773 58,650
Classification by type of industry of borrowers[Consolidated] (in millions of yen)
As of Increase/ Increase/ As of As ofMarch 31, (Decrease) (Decrease) March 31, September 30,2003 (A) (A) - (B) (A) - (C) 2002 (B) 2002 (C)
Domestic* 2,163,416 (1,540,573) (950,020) 3,703,990 3,113,436 Manufacturing 303,932 (142,579) (111,041) 446,511 414,974 Construction 257,374 (136,846) (88,440) 394,220 345,815 Wholesale and Retail 475,371 (183,289) (148,344) 658,660 623,715 Banks and other financial institutions 24,942 (68,850) (57,869) 93,792 82,811 Real estate 515,712 (745,396) (394,774) 1,261,108 910,487 Services 249,824 (196,333) (122,894) 446,157 372,719 Other industries 103,079 (24,572) (6,885) 127,651 109,964 Consumer 233,178 (42,706) (19,770) 275,885 252,949
Overseas* 406,051 63,423 44,364 342,628 361,687 6,122 (19,537) (2,932) 25,660 9,055
Commercial and industrial 379,238 72,808 77,853 306,429 301,384 Other 20,691 10,152 (30,556) 10,538 51,248
Total 2,569,468 (1,477,150) (905,656) 4,046,618 3,475,124 Note:* "Domestic" and "Overseas" are classified by domicile of borrowers.
[Trust accounts] (in millions of yen)As of Increase/ Increase/ As of As of
March 31, (Decrease) (Decrease) March 31, September 30,2003 (A) (A) - (B) (A) - (C) 2002 (B) 2002 (C)
Domestic 41,165 (24,607) (17,485) 65,773 58,650 Manufacturing 4,005 (2,875) (5,421) 6,880 9,426 Construction 1,717 (1,380) (1,281) 3,098 2,999 Wholesale and Retail 2,500 (3,925) (1,414) 6,425 3,914 Banks and other financial institutions (25) 25 Real estate 6,619 (7,264) (4,083) 13,884 10,703 Services 1,733 (9,941) (7,224) 11,675 8,958 Other industries 18,210 2,586 2,693 15,623 15,516 Consumer 6,377 (1,781) (753) 8,159 7,131
Total 41,165 (24,607) (17,485) 65,773 58,650
Banks and other financial institutions
Domestic*Overseas*
Domestic
5
Mitsubishi Tokyo Financial Group, Inc.
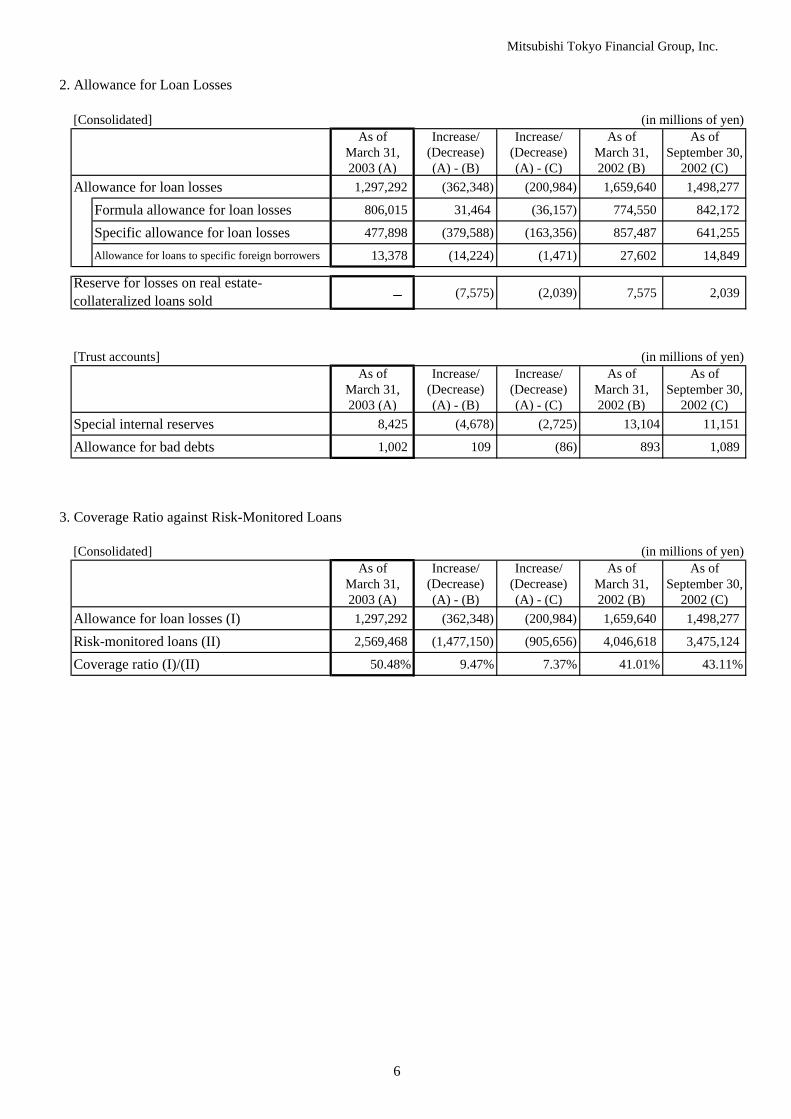
2. Allowance for Loan Losses
[Consolidated] (in millions of yen)As of Increase/ Increase/ As of As of
March 31, (Decrease) (Decrease) March 31, September 30,2003 (A) (A) - (B) (A) - (C) 2002 (B) 2002 (C)
Allowance for loan losses 1,297,292 (362,348) (200,984) 1,659,640 1,498,277
Formula allowance for loan losses 806,015 31,464 (36,157) 774,550 842,172
Specific allowance for loan losses 477,898 (379,588) (163,356) 857,487 641,255
Allowance for loans to specific foreign borrowers 13,378 (14,224) (1,471) 27,602 14,849
(7,575) (2,039) 7,575 2,039
[Trust accounts] (in millions of yen)As of Increase/ Increase/ As of As of
March 31, (Decrease) (Decrease) March 31, September 30,2003 (A) (A) - (B) (A) - (C) 2002 (B) 2002 (C)
Special internal reserves 8,425 (4,678) (2,725) 13,104 11,151
Allowance for bad debts 1,002 109 (86) 893 1,089
3. Coverage Ratio against Risk-Monitored Loans
[Consolidated] (in millions of yen)As of Increase/ Increase/ As of As of
March 31, (Decrease) (Decrease) March 31, September 30,2003 (A) (A) - (B) (A) - (C) 2002 (B) 2002 (C)
Allowance for loan losses (I) 1,297,292 (362,348) (200,984) 1,659,640 1,498,277
Risk-monitored loans (II) 2,569,468 (1,477,150) (905,656) 4,046,618 3,475,124
Coverage ratio (I)/(II) 50.48% 9.47% 7.37% 41.01% 43.11%
Reserve for losses on real estate-collateralized loans sold
6
Mitsubishi Tokyo Financial Group, Inc.
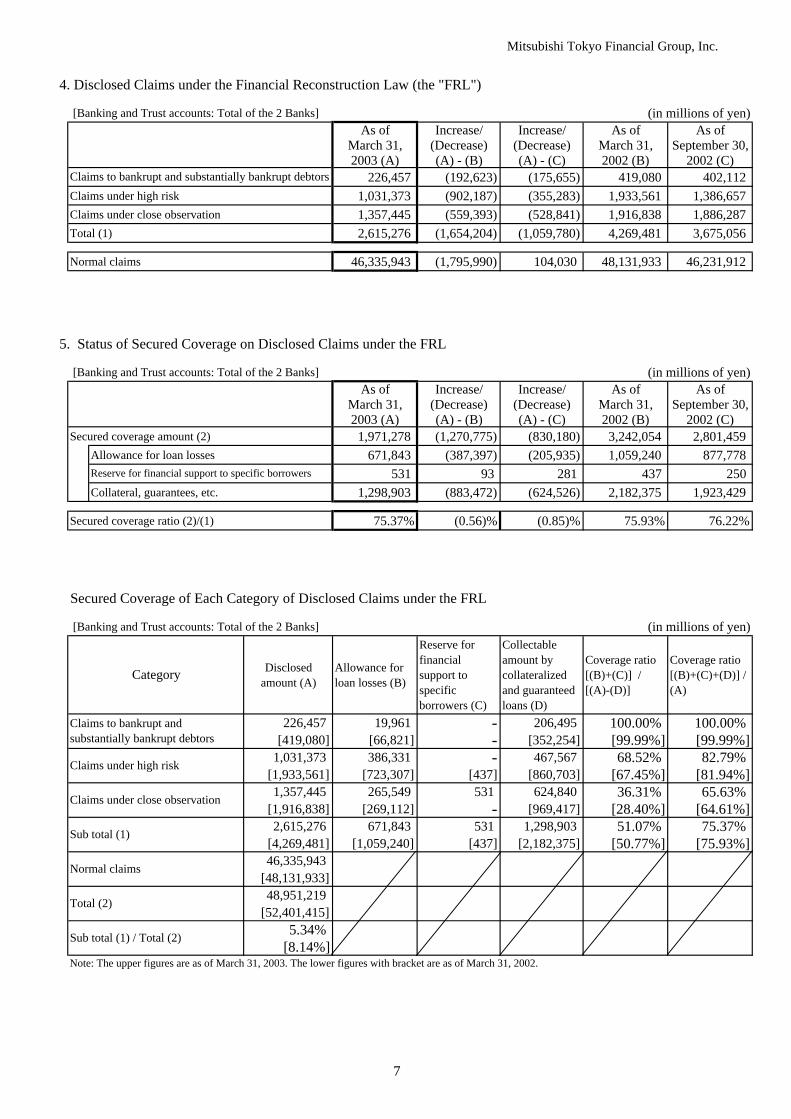
4. Disclosed Claims under the Financial Reconstruction Law (the "FRL")
[Banking and Trust accounts: Total of the 2 Banks] (in millions of yen)As of Increase/ Increase/ As of As of
March 31, (Decrease) (Decrease) March 31, September 30,2003 (A) (A) - (B) (A) - (C) 2002 (B) 2002 (C)
226,457 (192,623) (175,655) 419,080 402,112 Claims under high risk 1,031,373 (902,187) (355,283) 1,933,561 1,386,657 Claims under close observation 1,357,445 (559,393) (528,841) 1,916,838 1,886,287 Total (1) 2,615,276 (1,654,204) (1,059,780) 4,269,481 3,675,056
Normal claims 46,335,943 (1,795,990) 104,030 48,131,933 46,231,912
5. Status of Secured Coverage on Disclosed Claims under the FRL
[Banking and Trust accounts: Total of the 2 Banks] (in millions of yen)As of Increase/ Increase/ As of As of
March 31, (Decrease) (Decrease) March 31, September 30,2003 (A) (A) - (B) (A) - (C) 2002 (B) 2002 (C)
Secured coverage amount (2) 1,971,278 (1,270,775) (830,180) 3,242,054 2,801,459 Allowance for loan losses 671,843 (387,397) (205,935) 1,059,240 877,778
531 93 281 437 250 Collateral, guarantees, etc. 1,298,903 (883,472) (624,526) 2,182,375 1,923,429
Secured coverage ratio (2)/(1) 75.37% (0.56)% (0.85)% 75.93% 76.22%
Secured Coverage of Each Category of Disclosed Claims under the FRL
[Banking and Trust accounts: Total of the 2 Banks] (in millions of yen)
Disclosedamount (A)
Allowance forloan losses (B)
Reserve forfinancialsupport tospecificborrowers (C)
Collectableamount bycollateralizedand guaranteedloans (D)
Coverage ratio[(B)+(C)] /[(A)-(D)]
Coverage ratio[(B)+(C)+(D)] /(A)
226,457 19,961 - 206,495 100.00% 100.00% [419,080] [66,821] - [352,254] [99.99%] [99.99%]
1,031,373 386,331 - 467,567 68.52% 82.79% [1,933,561] [723,307] [437] [860,703] [67.45%] [81.94%]1,357,445 265,549 531 624,840 36.31% 65.63%
[1,916,838] [269,112] - [969,417] [28.40%] [64.61%]2,615,276 671,843 531 1,298,903 51.07% 75.37%
[4,269,481] [1,059,240] [437] [2,182,375] [50.77%] [75.93%]46,335,943
[48,131,933]48,951,219
[52,401,415]5.34%
[8.14%]
Claims to bankrupt andsubstantially bankrupt debtors
Claims under high risk
Sub total (1) / Total (2)
Claims under close observation
Sub total (1)
Normal claims
Total (2)
Note: The upper figures are as of March 31, 2003. The lower figures with bracket are as of March 31, 2002.
Claims to bankrupt and substantially bankrupt debtors
Reserve for financial support to specific borrowers
Category
7
Mitsubishi Tokyo Financial Group, Inc.
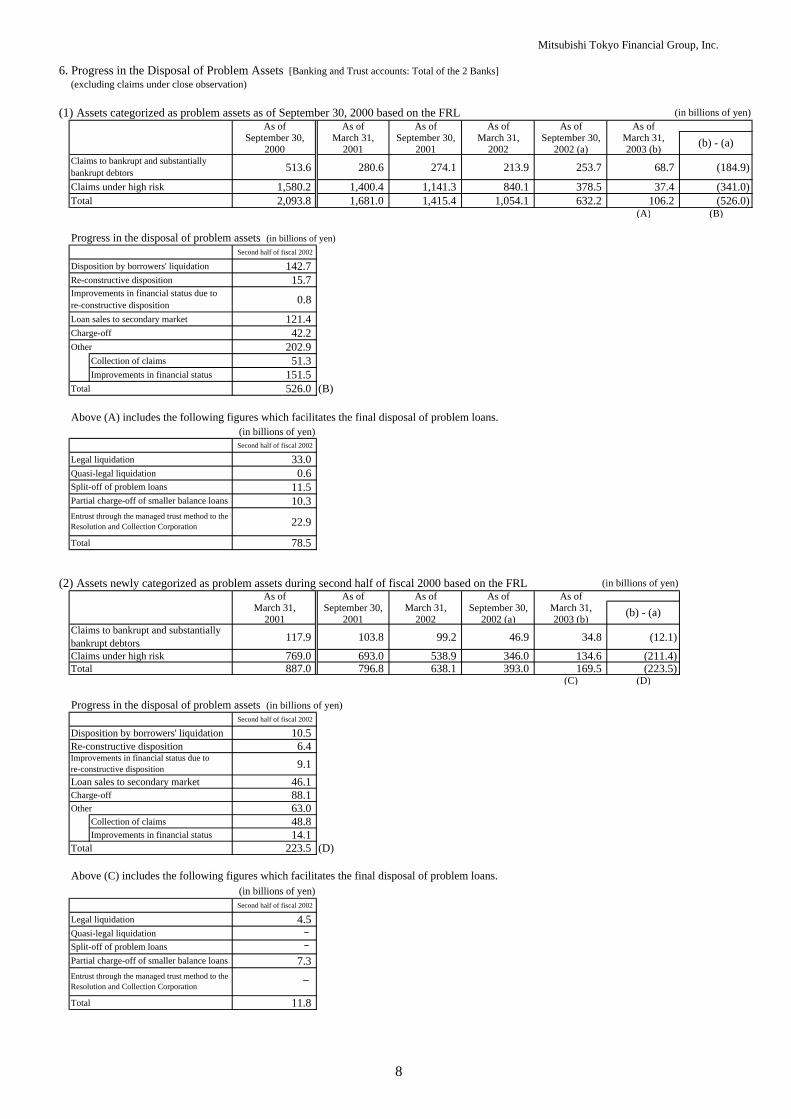
6. Progress in the Disposal of Problem Assets [Banking and Trust accounts: Total of the 2 Banks](excluding claims under close observation)
(1) Assets categorized as problem assets as of September 30, 2000 based on the FRL (in billions of yen)As of As of As of As of As of As of
September 30, March 31, September 30, March 31, September 30, March 31,2000 2001 2001 2002 2002 (a) 2003 (b)
513.6 280.6 274.1 213.9 253.7 68.7 (184.9)
Claims under high risk 1,580.2 1,400.4 1,141.3 840.1 378.5 37.4 (341.0)Total 2,093.8 1,681.0 1,415.4 1,054.1 632.2 106.2 (526.0)
(A) (B)
Progress in the disposal of problem assets (in billions of yen)Second half of fiscal 2002
Disposition by borrowers' liquidation 142.7 Re-constructive disposition 15.7
0.8
Loan sales to secondary market 121.4 Charge-off 42.2 Other 202.9
Collection of claims 51.3 Improvements in financial status 151.5
Total 526.0 (B)
Above (A) includes the following figures which facilitates the final disposal of problem loans. (in billions of yen)Second half of fiscal 2002
Legal liquidation 33.0 Quasi-legal liquidation 0.6
11.5 10.3
22.9
Total 78.5
(2) Assets newly categorized as problem assets during second half of fiscal 2000 based on the FRL (in billions of yen)As of As of As of As of As of
March 31, September 30, March 31, September 30, March 31,2001 2001 2002 2002 (a) 2003 (b)
117.9 103.8 99.2 46.9 34.8 (12.1)Claims under high risk 769.0 693.0 538.9 346.0 134.6 (211.4)Total 887.0 796.8 638.1 393.0 169.5 (223.5)
(C) (D)
Progress in the disposal of problem assets (in billions of yen)Second half of fiscal 2002
Disposition by borrowers' liquidation 10.5 Re-constructive disposition 6.4
9.1 Loan sales to secondary market 46.1 Charge-off 88.1 Other 63.0
Collection of claims 48.8 Improvements in financial status 14.1
Total 223.5 (D)
Above (C) includes the following figures which facilitates the final disposal of problem loans. (in billions of yen)Second half of fiscal 2002
Legal liquidation 4.5 Quasi-legal liquidation
7.3
Total 11.8
Partial charge-off of smaller balance loansEntrust through the managed trust method to theResolution and Collection Corporation
Split-off of problem loansPartial charge-off of smaller balance loansEntrust through the managed trust method to theResolution and Collection Corporation
Split-off of problem loans
(b) - (a)Claims to bankrupt and substantiallybankrupt debtors
Improvements in financial status due tore-constructive disposition
(b) - (a)
Improvements in financial status due tore-constructive disposition
Claims to bankrupt and substantiallybankrupt debtors
8
Mitsubishi Tokyo Financial Group, Inc.
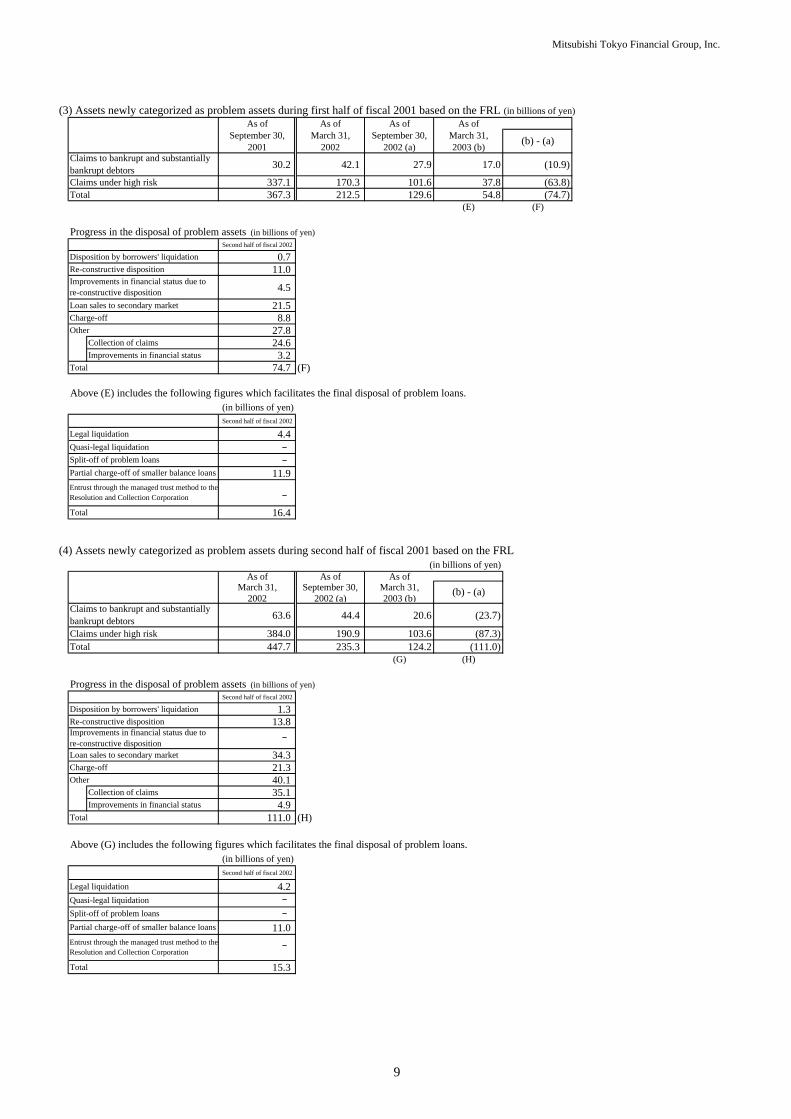
(3) Assets newly categorized as problem assets during first half of fiscal 2001 based on the FRL (in billions of yen)As of As of As of As of
September 30, March 31, September 30, March 31,2001 2002 2002 (a) 2003 (b)
30.2 42.1 27.9 17.0 (10.9)
Claims under high risk 337.1 170.3 101.6 37.8 (63.8)Total 367.3 212.5 129.6 54.8 (74.7)
(E) (F)
Progress in the disposal of problem assets (in billions of yen)Second half of fiscal 2002
Disposition by borrowers' liquidation 0.7 Re-constructive disposition 11.0
4.5 Loan sales to secondary market 21.5 Charge-off 8.8 Other 27.8
Collection of claims 24.6 Improvements in financial status 3.2
Total 74.7 (F)
Above (E) includes the following figures which facilitates the final disposal of problem loans. (in billions of yen)Second half of fiscal 2002
Legal liquidation 4.4 Quasi-legal liquidation
11.9
Total 16.4
(4) Assets newly categorized as problem assets during second half of fiscal 2001 based on the FRL(in billions of yen)
As of As of As ofMarch 31, September 30, March 31,
2002 2002 (a) 2003 (b)
63.6 44.4 20.6 (23.7)
Claims under high risk 384.0 190.9 103.6 (87.3)Total 447.7 235.3 124.2 (111.0)
(G) (H)
Progress in the disposal of problem assets (in billions of yen)Second half of fiscal 2002
Disposition by borrowers' liquidation 1.3 Re-constructive disposition 13.8
Loan sales to secondary market 34.3 Charge-off 21.3 Other 40.1
Collection of claims 35.1 Improvements in financial status 4.9
Total 111.0 (H)
Above (G) includes the following figures which facilitates the final disposal of problem loans. (in billions of yen)Second half of fiscal 2002
Legal liquidation 4.2 Quasi-legal liquidation
11.0
Total 15.3
(b) - (a)
Split-off of problem loansPartial charge-off of smaller balance loans
Entrust through the managed trust method to theResolution and Collection Corporation
(b) - (a)
Entrust through the managed trust method to theResolution and Collection Corporation
Claims to bankrupt and substantiallybankrupt debtors
Improvements in financial status due tore-constructive disposition
Partial charge-off of smaller balance loans
Improvements in financial status due tore-constructive disposition
Claims to bankrupt and substantiallybankrupt debtors
Split-off of problem loans
9
Mitsubishi Tokyo Financial Group, Inc.
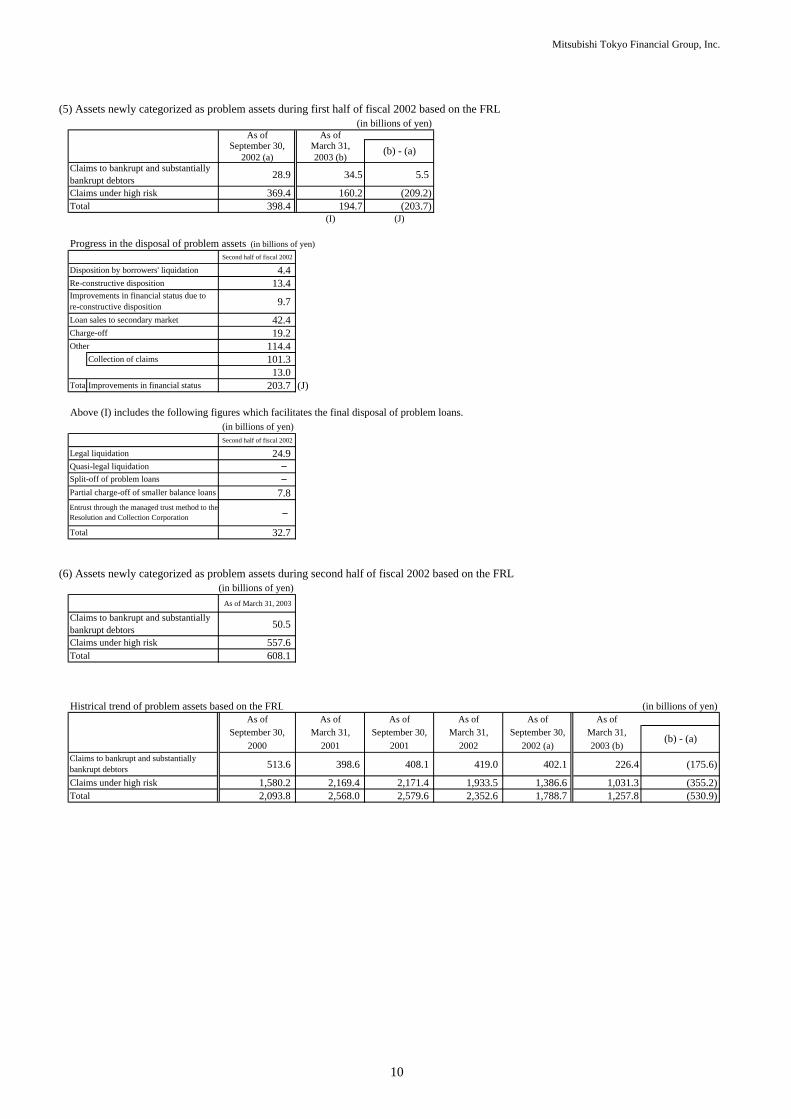
(5) Assets newly categorized as problem assets during first half of fiscal 2002 based on the FRL(in billions of yen)
As of As ofSeptember 30, March 31,
2002 (a) 2003 (b)
28.9 34.5 5.5
Claims under high risk 369.4 160.2 (209.2)Total 398.4 194.7 (203.7)
(I) (J)
Progress in the disposal of problem assets (in billions of yen)Second half of fiscal 2002
Disposition by borrowers' liquidation 4.4 Re-constructive disposition 13.4
9.7
Loan sales to secondary market 42.4 Charge-off 19.2 Other 114.4
Collection of claims 101.3 13.0
TotalImprovements in financial status 203.7 (J)
Above (I) includes the following figures which facilitates the final disposal of problem loans. (in billions of yen)Second half of fiscal 2002
Legal liquidation 24.9 Quasi-legal liquidation
7.8
Total 32.7
(6) Assets newly categorized as problem assets during second half of fiscal 2002 based on the FRL(in billions of yen)
As of March 31, 2003
50.5
Claims under high risk 557.6 Total 608.1
Histrical trend of problem assets based on the FRL (in billions of yen)As of As of As of As of As of As of
September 30, March 31, September 30, March 31, September 30, March 31,2000 2001 2001 2002 2002 (a) 2003 (b)
513.6 398.6 408.1 419.0 402.1 226.4 (175.6)
Claims under high risk 1,580.2 2,169.4 2,171.4 1,933.5 1,386.6 1,031.3 (355.2)Total 2,093.8 2,568.0 2,579.6 2,352.6 1,788.7 1,257.8 (530.9)
Claims to bankrupt and substantiallybankrupt debtors
(b) - (a)
Split-off of problem loansPartial charge-off of smaller balance loans
Entrust through the managed trust method to theResolution and Collection Corporation
Improvements in financial status due tore-constructive disposition
(b) - (a)
Claims to bankrupt and substantiallybankrupt debtors
Claims to bankrupt and substantiallybankrupt debtors
10

Mitsubishi Tokyo Financial Group, Inc.
7. Classification of Loans by Type of Industry
(1) Loans by type of industry [Total of the 2 Banks] (in millions of yen)As of Increase/ Increase/ As of As of
March 31, (Decrease) (Decrease) March 31, September 30,2003 (A) (A) - (B) (A) - (C) 2002 (B) 2002 (C)
Domestic offices (excluding loansbooked at offshore markets) 37,416,133 (665,900) 254,558 38,082,034 37,161,574
Manufacturing 5,472,979 (362,420) (205,323) 5,835,399 5,678,302
Agriculture 15,568 (3,022) (990) 18,590 16,558
Forestry 5,425 (330) 41 5,755 5,384
Fishery 25,293 9,869 5,798 15,424 19,495
Mining 39,493 (8,903) (1,650) 48,396 41,143
Construction 1,228,250 (242,446) (115,503) 1,470,696 1,343,753
Utilities 417,297 29,326 44,336 387,971 372,961
Media and Communication 1,496,867 (340,500) (481,541) 1,837,367 1,978,408
Wholesale and Retail 5,091,325 (527,536) (394,076) 5,618,861 5,485,401
Banks and other financial institutions 3,851,579 (334,040) (362,216) 4,185,619 4,213,795
Real estate 4,464,195 (485,262) (189,092) 4,949,457 4,653,287
Services 4,781,695 234,944 454,997 4,546,751 4,326,698
Municipal government 376,513 121,155 84,175 255,358 292,338
Other industries 10,149,646 1,243,264 1,415,600 8,906,381 8,734,045 Overseas offices and loans booked
at offshore markets 5,570,426 (1,009,393) (223,921) 6,579,819 5,794,347
Total 42,986,559 (1,675,294) 30,637 44,661,854 42,955,922
(2) Domestic consumer loans [Total of the 2 Banks] (in millions of yen)As of Increase/ Increase/ As of As of
March 31, (Decrease) (Decrease) March 31, September 30,2003 (A) (A) - (B) (A) - (C) 2002 (B) 2002 (C)
Total domestic consumer loans 7,464,720 485,123 211,300 6,979,596 7,253,420
Housing loans 6,941,192 565,187 243,559 6,376,005 6,697,632
Others 523,527 (80,063) (32,259) 603,591 555,787
(3) Domestic loans to small and medium-sized companies [Total of the 2 Banks] (in millions of yen)As of Increase/ Increase/ As of As of
March 31, (Decrease) (Decrease) March 31, September 30,2003 (A) (A) - (B) (A) - (C) 2002 (B) 2002 (C)
Domestic loans to small and medium-sized companies 19,920,352 (1,721,314) (965,336) 21,641,666 20,885,689
53.24% (3.58)% (2.96)% 56.82% 56.20%Percentage to total domestic loans
11
Mitsubishi Tokyo Financial Group, Inc.
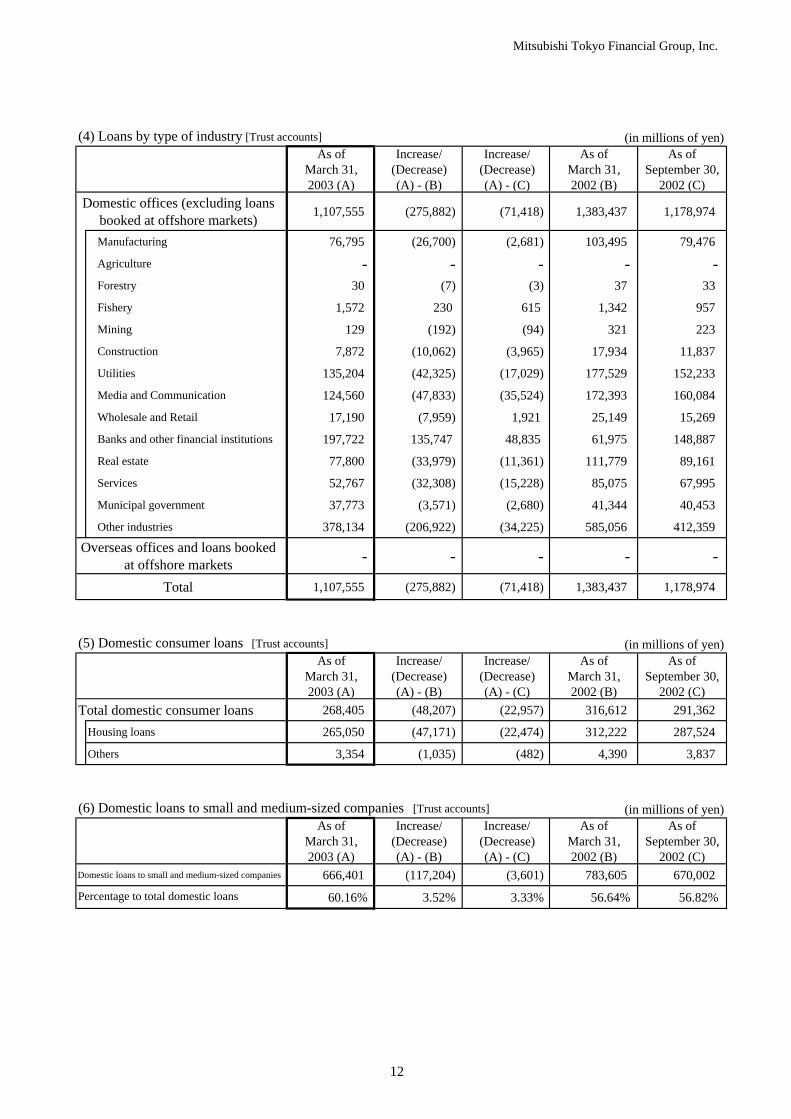
(4) Loans by type of industry [Trust accounts] (in millions of yen)As of Increase/ Increase/ As of As of
March 31, (Decrease) (Decrease) March 31, September 30,2003 (A) (A) - (B) (A) - (C) 2002 (B) 2002 (C)
Domestic offices (excluding loansbooked at offshore markets) 1,107,555 (275,882) (71,418) 1,383,437 1,178,974
Manufacturing 76,795 (26,700) (2,681) 103,495 79,476
Agriculture - - - - -Forestry 30 (7) (3) 37 33
Fishery 1,572 230 615 1,342 957
Mining 129 (192) (94) 321 223
Construction 7,872 (10,062) (3,965) 17,934 11,837
Utilities 135,204 (42,325) (17,029) 177,529 152,233
Media and Communication 124,560 (47,833) (35,524) 172,393 160,084
Wholesale and Retail 17,190 (7,959) 1,921 25,149 15,269
Banks and other financial institutions 197,722 135,747 48,835 61,975 148,887
Real estate 77,800 (33,979) (11,361) 111,779 89,161
Services 52,767 (32,308) (15,228) 85,075 67,995
Municipal government 37,773 (3,571) (2,680) 41,344 40,453
Other industries 378,134 (206,922) (34,225) 585,056 412,359 Overseas offices and loans booked
at offshore markets - - - - -
Total 1,107,555 (275,882) (71,418) 1,383,437 1,178,974
(5) Domestic consumer loans [Trust accounts] (in millions of yen)As of Increase/ Increase/ As of As of
March 31, (Decrease) (Decrease) March 31, September 30,2003 (A) (A) - (B) (A) - (C) 2002 (B) 2002 (C)
Total domestic consumer loans 268,405 (48,207) (22,957) 316,612 291,362
Housing loans 265,050 (47,171) (22,474) 312,222 287,524
Others 3,354 (1,035) (482) 4,390 3,837
(6) Domestic loans to small and medium-sized companies [Trust accounts] (in millions of yen)As of Increase/ Increase/ As of As of
March 31, (Decrease) (Decrease) March 31, September 30,2003 (A) (A) - (B) (A) - (C) 2002 (B) 2002 (C)
Domestic loans to small and medium-sized companies 666,401 (117,204) (3,601) 783,605 670,002
60.16% 3.52% 3.33% 56.64% 56.82%Percentage to total domestic loans
12
Mitsubishi Tokyo Financial Group,Inc.
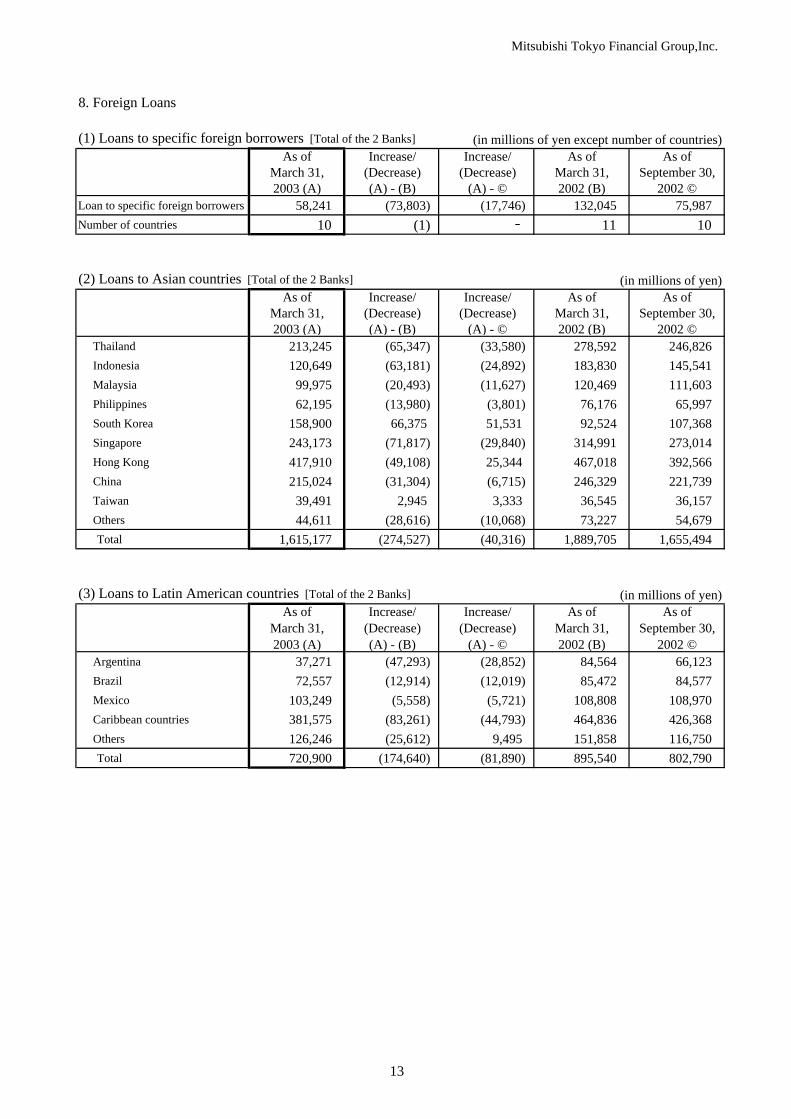
(1) Loans to specific foreign borrowers [Total of the 2 Banks] (in millions of yen except number of countries)As of Increase/ Increase/ As of As of
March 31, (Decrease) (Decrease) March 31, September 30,2003 (A) (A) - (B) (A) - © 2002 (B) 2002 ©
Loan to specific foreign borrowers 58,241 (73,803) (17,746) 132,045 75,987 Number of countries 10 (1) 11 10
(2) Loans to Asian countries [Total of the 2 Banks] (in millions of yen)As of Increase/ Increase/ As of As of
March 31, (Decrease) (Decrease) March 31, September 30,2003 (A) (A) - (B) (A) - © 2002 (B) 2002 ©
Thailand 213,245 (65,347) (33,580) 278,592 246,826 Indonesia 120,649 (63,181) (24,892) 183,830 145,541 Malaysia 99,975 (20,493) (11,627) 120,469 111,603 Philippines 62,195 (13,980) (3,801) 76,176 65,997 South Korea 158,900 66,375 51,531 92,524 107,368 Singapore 243,173 (71,817) (29,840) 314,991 273,014 Hong Kong 417,910 (49,108) 25,344 467,018 392,566 China 215,024 (31,304) (6,715) 246,329 221,739 Taiwan 39,491 2,945 3,333 36,545 36,157 Others 44,611 (28,616) (10,068) 73,227 54,679 Total 1,615,177 (274,527) (40,316) 1,889,705 1,655,494
(3) Loans to Latin American countries [Total of the 2 Banks] (in millions of yen)As of Increase/ Increase/ As of As of
March 31, (Decrease) (Decrease) March 31, September 30,2003 (A) (A) - (B) (A) - © 2002 (B) 2002 ©
Argentina 37,271 (47,293) (28,852) 84,564 66,123 Brazil 72,557 (12,914) (12,019) 85,472 84,577 Mexico 103,249 (5,558) (5,721) 108,808 108,970 Caribbean countries 381,575 (83,261) (44,793) 464,836 426,368 Others 126,246 (25,612) 9,495 151,858 116,750 Total 720,900 (174,640) (81,890) 895,540 802,790
8. Foreign Loans
13
Mitsubishi Tokyo Financial Group, Inc.
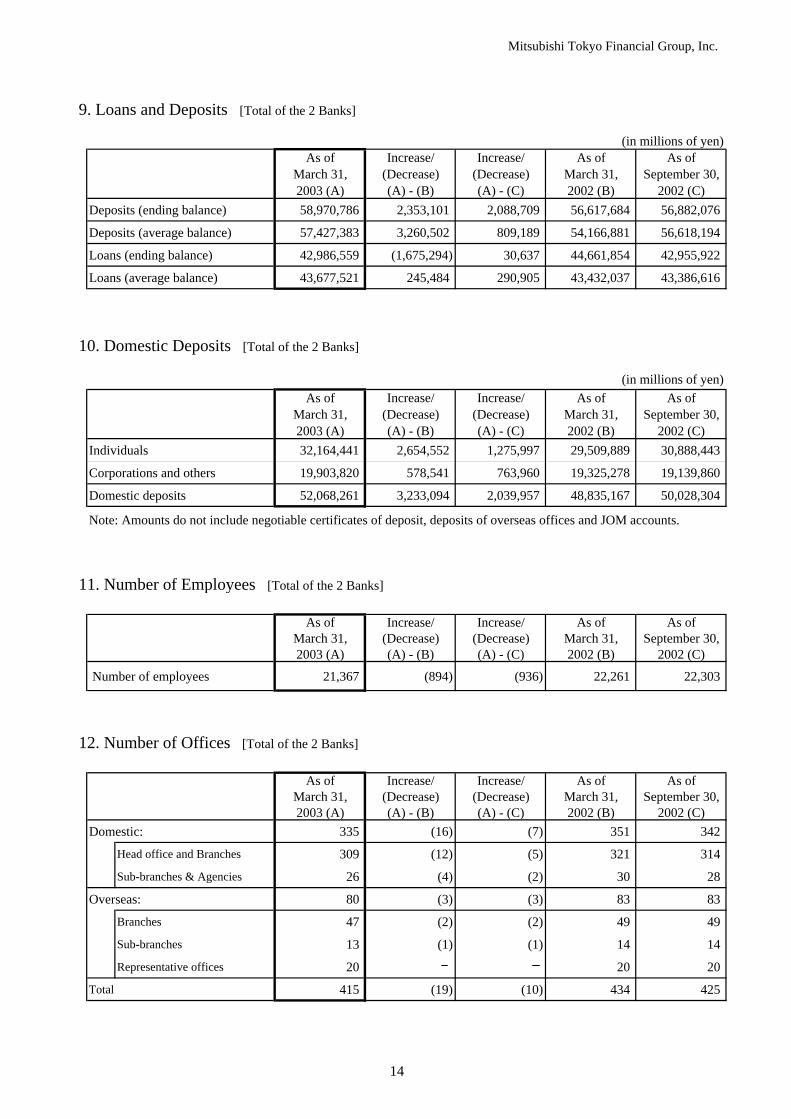
9. Loans and Deposits [Total of the 2 Banks]
(in millions of yen)As of Increase/ Increase/ As of As of
March 31, (Decrease) (Decrease) March 31, September 30,2003 (A) (A) - (B) (A) - (C) 2002 (B) 2002 (C)
Deposits (ending balance) 58,970,786 2,353,101 2,088,709 56,617,684 56,882,076
Deposits (average balance) 57,427,383 3,260,502 809,189 54,166,881 56,618,194
Loans (ending balance) 42,986,559 (1,675,294) 30,637 44,661,854 42,955,922
Loans (average balance) 43,677,521 245,484 290,905 43,432,037 43,386,616
10. Domestic Deposits [Total of the 2 Banks]
(in millions of yen)As of Increase/ Increase/ As of As of
March 31, (Decrease) (Decrease) March 31, September 30,2003 (A) (A) - (B) (A) - (C) 2002 (B) 2002 (C)
Individuals 32,164,441 2,654,552 1,275,997 29,509,889 30,888,443
Corporations and others 19,903,820 578,541 763,960 19,325,278 19,139,860
Domestic deposits 52,068,261 3,233,094 2,039,957 48,835,167 50,028,304
Note: Amounts do not include negotiable certificates of deposit, deposits of overseas offices and JOM accounts.
11. Number of Employees [Total of the 2 Banks]
As of Increase/ Increase/ As of As ofMarch 31, (Decrease) (Decrease) March 31, September 30,2003 (A) (A) - (B) (A) - (C) 2002 (B) 2002 (C)
Number of employees 21,367 (894) (936) 22,261 22,303
12. Number of Offices [Total of the 2 Banks]
As of Increase/ Increase/ As of As ofMarch 31, (Decrease) (Decrease) March 31, September 30,2003 (A) (A) - (B) (A) - (C) 2002 (B) 2002 (C)
Domestic: 335 (16) (7) 351 342
Head office and Branches 309 (12) (5) 321 314
Sub-branches & Agencies 26 (4) (2) 30 28
Overseas: 80 (3) (3) 83 83
Branches 47 (2) (2) 49 49
Sub-branches 13 (1) (1) 14 14
Representative offices 20 20 20
Total 415 (19) (10) 434 425
14
Mitsubishi Tokyo Financial Group, Inc.
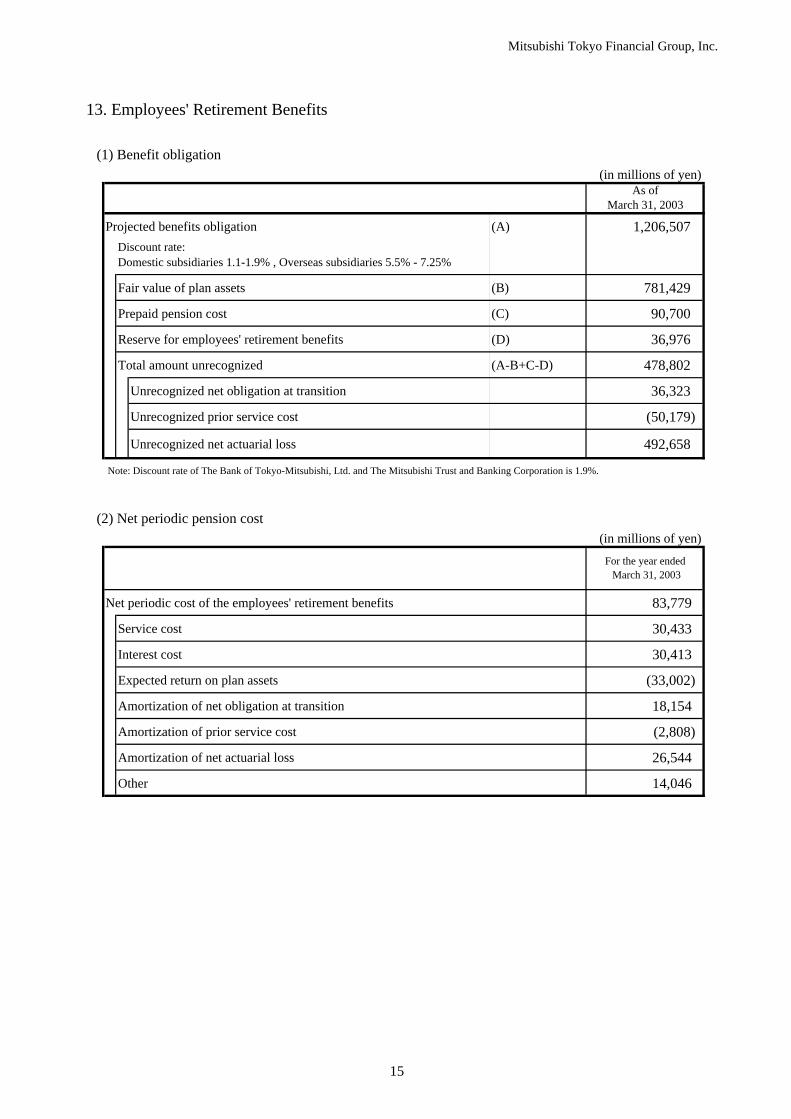
13. Employees' Retirement Benefits
(1) Benefit obligation(in millions of yen)
Projected benefits obligation (A) 1,206,507
Fair value of plan assets (B) 781,429
Prepaid pension cost (C) 90,700
Reserve for employees' retirement benefits (D) 36,976
Total amount unrecognized (A-B+C-D) 478,802
Unrecognized net obligation at transition 36,323
Unrecognized prior service cost (50,179)
Unrecognized net actuarial loss 492,658
(2) Net periodic pension cost(in millions of yen)
Net periodic cost of the employees' retirement benefits 83,779
Service cost 30,433
Interest cost 30,413
Expected return on plan assets (33,002)
Amortization of net obligation at transition 18,154
Amortization of prior service cost (2,808)
Amortization of net actuarial loss 26,544
Other 14,046
For the year ended March 31, 2003
As ofMarch 31, 2003
Discount rate:Domestic subsidiaries 1.1-1.9% , Overseas subsidiaries 5.5% - 7.25%
Note: Discount rate of The Bank of Tokyo-Mitsubishi, Ltd. and The Mitsubishi Trust and Banking Corporation is 1.9%.
15
Mitsubishi Tokyo Financial Group, Inc.
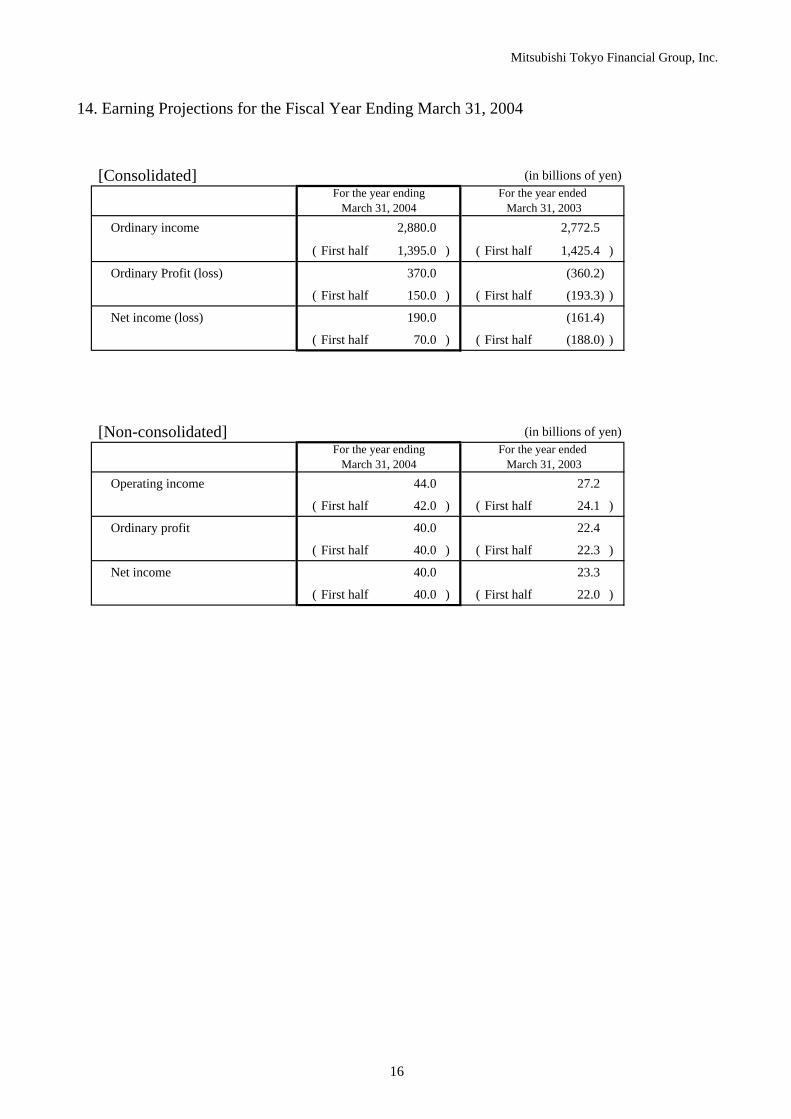
[Consolidated] (in billions of yen)
Ordinary income 2,880.0 2,772.5
( First half 1,395.0 ) ( First half 1,425.4 )
Ordinary Profit (loss) 370.0 (360.2)
( First half 150.0 ) ( First half (193.3) )
Net income (loss) 190.0 (161.4)
( First half 70.0 ) ( First half (188.0) )
[Non-consolidated] (in billions of yen)
Operating income 44.0 27.2
( First half 42.0 ) ( First half 24.1 )
Ordinary profit 40.0 22.4
( First half 40.0 ) ( First half 22.3 )
Net income 40.0 23.3
( First half 40.0 ) ( First half 22.0 )
For the year endingMarch 31, 2004
For the year ended March 31, 2003
14. Earning Projections for the Fiscal Year Ending March 31, 2004
For the year endingMarch 31, 2004
For the year ended March 31, 2003
16
Selected Financial Informationunder Japanese GAAP
For the Fiscal Year Ended March 31, 2003
The Bank of Tokyo-Mitsubishi, Ltd.
Mitsubishi Tokyo Financial Group, Inc.(The Bank of Tokyo-Mitsubishi, Ltd.)
1 Financial Highlights under Japanese GAAP for the Fiscal Year Ended March 31, 2003
1. Consolidated Balance Sheets ------------ 172 .Consolidated Statements of Operations ------------ 183. Consolidated Statement of Capital Surplus and Retained Earnings ------------ 194. Notional principal or contract amount, market value and valuation gains (losses) on derivatives ------------ 20
[Consolidated]
5. Financial Results [Consolidated], [Non-Consolidated] ------------ 236. Average interest rate spread [Non-Consolidated] ------------ 257. Valuation Differences on Securities [Consolidated] ------------ 258. Risk-Adjusted Capital Ratio Based on the Standards of the BIS [Consolidated] ------------ 26
2 Loan Portfolio and Other
1. Risk-Monitored Loans [Consolidated], [Non-Consolidated] ------------ 272. Allowance for Loan Losses [Consolidated], [Non-Consolidated] ------------ 293. Coverage Ratio against Risk-Monitored Loans [Consolidated], [Non-Consolidated] ------------ 294. Disclosed Claims under the Financial Reconstruction Law (the "FRL") [Non-Consolidated] ------------ 305. Status of Secured Coverage on Disclosed Claims under the FRL [Non-Consolidated] ------------ 306. Progress in the Disposal of Problem Assets [Non-Consolidated] ------------ 317. Classification of Loans by Type of Industry [Non-Consolidated] ------------ 348. Loans and Deposits [Non-Consolidated] ------------ 359. Domestic Deposits [Non-Consolidated] ------------ 3510. Number of Employees [Non-Consolidated] ------------ 3511. Number of Offices [Non-Consolidated] ------------ 3512. Earning Projections for the Fiscal Year Ending March 31, 2004 [Consolidated], [Non-Consolidated] ------------ 36
[Contents]
Mitsubishi Tokyo Financial Group, Inc.(The Bank of Tokyo-Mitsubishi, Ltd.)
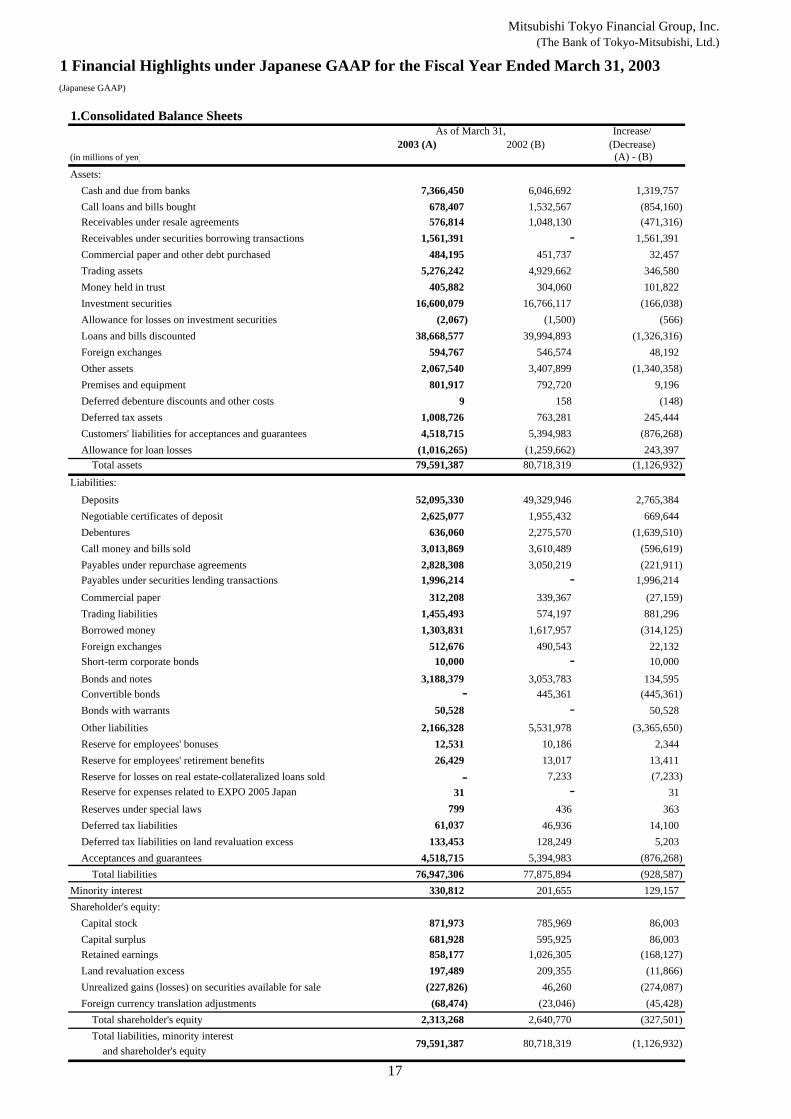
1 Financial Highlights under Japanese GAAP for the Fiscal Year Ended March 31, 2003(Japanese GAAP)
1.Consolidated Balance SheetsIncrease/
2003 (A) 2002 (B) (Decrease)(in millions of yen) (A) - (B)Assets:
Cash and due from banks 7,366,450 6,046,692 1,319,757Call loans and bills bought 678,407 1,532,567 (854,160)Receivables under resale agreements 576,814 1,048,130 (471,316)Receivables under securities borrowing transactions 1,561,391 - 1,561,391Commercial paper and other debt purchased 484,195 451,737 32,457Trading assets 5,276,242 4,929,662 346,580Money held in trust 405,882 304,060 101,822Investment securities 16,600,079 16,766,117 (166,038)Allowance for losses on investment securities (2,067) (1,500) (566)Loans and bills discounted 38,668,577 39,994,893 (1,326,316)Foreign exchanges 594,767 546,574 48,192Other assets 2,067,540 3,407,899 (1,340,358)Premises and equipment 801,917 792,720 9,196Deferred debenture discounts and other costs 9 158 (148)Deferred tax assets 1,008,726 763,281 245,444Customers' liabilities for acceptances and guarantees 4,518,715 5,394,983 (876,268)Allowance for loan losses (1,016,265) (1,259,662) 243,397 Total assets 79,591,387 80,718,319 (1,126,932)
Liabilities:Deposits 52,095,330 49,329,946 2,765,384Negotiable certificates of deposit 2,625,077 1,955,432 669,644Debentures 636,060 2,275,570 (1,639,510)Call money and bills sold 3,013,869 3,610,489 (596,619)Payables under repurchase agreements 2,828,308 3,050,219 (221,911)Payables under securities lending transactions 1,996,214 - 1,996,214Commercial paper 312,208 339,367 (27,159)Trading liabilities 1,455,493 574,197 881,296Borrowed money 1,303,831 1,617,957 (314,125)Foreign exchanges 512,676 490,543 22,132Short-term corporate bonds 10,000 - 10,000Bonds and notes 3,188,379 3,053,783 134,595Convertible bonds - 445,361 (445,361)Bonds with warrants 50,528 - 50,528Other liabilities 2,166,328 5,531,978 (3,365,650)Reserve for employees' bonuses 12,531 10,186 2,344Reserve for employees' retirement benefits 26,429 13,017 13,411Reserve for losses on real estate-collateralized loans sold - 7,233 (7,233)Reserve for expenses related to EXPO 2005 Japan 31 - 31Reserves under special laws 799 436 363Deferred tax liabilities 61,037 46,936 14,100Deferred tax liabilities on land revaluation excess 133,453 128,249 5,203Acceptances and guarantees 4,518,715 5,394,983 (876,268) Total liabilities 76,947,306 77,875,894 (928,587)
Minority interest 330,812 201,655 129,157Shareholder's equity:
Capital stock 871,973 785,969 86,003Capital surplus 681,928 595,925 86,003Retained earnings 858,177 1,026,305 (168,127)Land revaluation excess 197,489 209,355 (11,866)Unrealized gains (losses) on securities available for sale (227,826) 46,260 (274,087)Foreign currency translation adjustments (68,474) (23,046) (45,428) Total shareholder's equity 2,313,268 2,640,770 (327,501) Total liabilities, minority interest and shareholder's equity
As of March 31,
79,591,387 (1,126,932)80,718,319
17
Mitsubishi Tokyo Financial Group, Inc.(The Bank of Tokyo-Mitsubishi, Ltd.)
(Japanese GAAP)
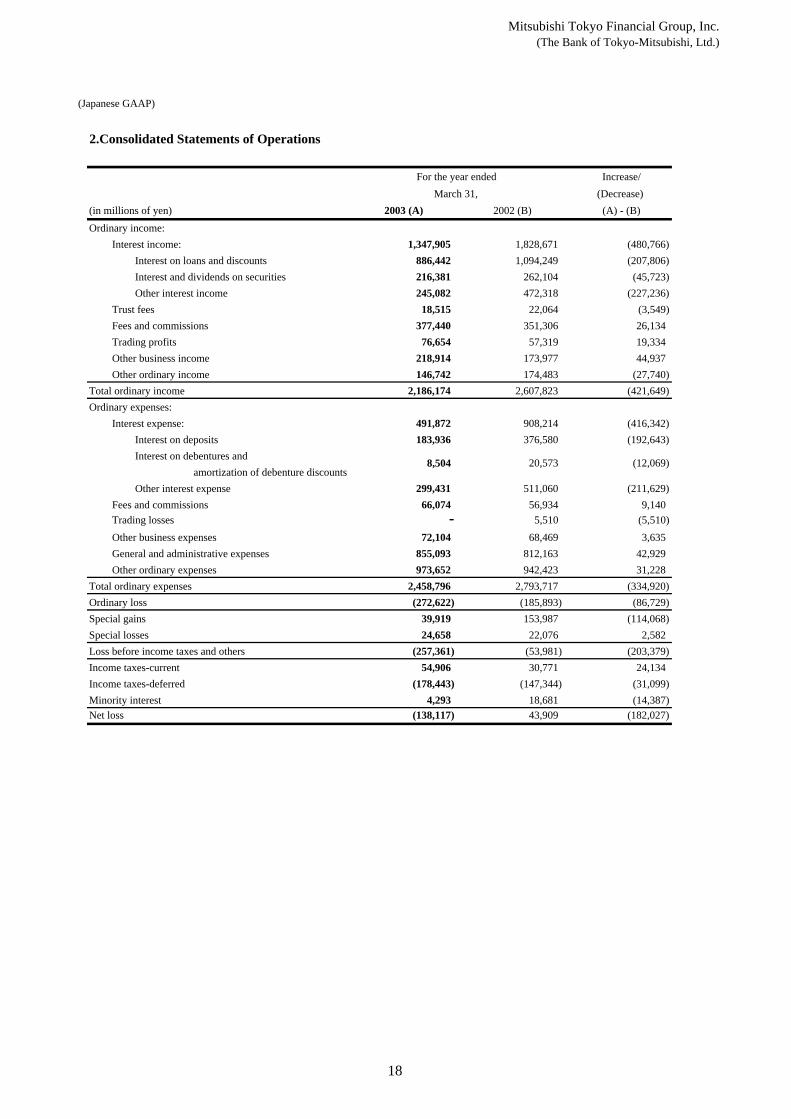
2.Consolidated Statements of Operations
Increase/ (Decrease)
(in millions of yen) 2003 (A) 2002 (B) (A) - (B)Ordinary income:
Interest income: 1,347,905 1,828,671 (480,766)Interest on loans and discounts 886,442 1,094,249 (207,806)Interest and dividends on securities 216,381 262,104 (45,723)Other interest income 245,082 472,318 (227,236)
Trust fees 18,515 22,064 (3,549)Fees and commissions 377,440 351,306 26,134Trading profits 76,654 57,319 19,334Other business income 218,914 173,977 44,937Other ordinary income 146,742 174,483 (27,740)
Total ordinary income 2,186,174 2,607,823 (421,649)Ordinary expenses:
Interest expense: 491,872 908,214 (416,342)Interest on deposits 183,936 376,580 (192,643)Interest on debentures and
amortization of debenture discountsOther interest expense 299,431 511,060 (211,629)
Fees and commissions 66,074 56,934 9,140Trading losses - 5,510 (5,510)Other business expenses 72,104 68,469 3,635General and administrative expenses 855,093 812,163 42,929Other ordinary expenses 973,652 942,423 31,228
Total ordinary expenses 2,458,796 2,793,717 (334,920)Ordinary loss (272,622) (185,893) (86,729)Special gains 39,919 153,987 (114,068)Special losses 24,658 22,076 2,582Loss before income taxes and others (257,361) (53,981) (203,379)Income taxes-current 54,906 30,771 24,134Income taxes-deferred (178,443) (147,344) (31,099)Minority interest 4,293 18,681 (14,387)Net loss (138,117) 43,909 (182,027)
(12,069)
March 31, For the year ended
8,504 20,573
18
Mitsubishi Tokyo Financial Group, Inc.(The Bank of Tokyo-Mitsubishi, Ltd.)
(Japanese GAAP)
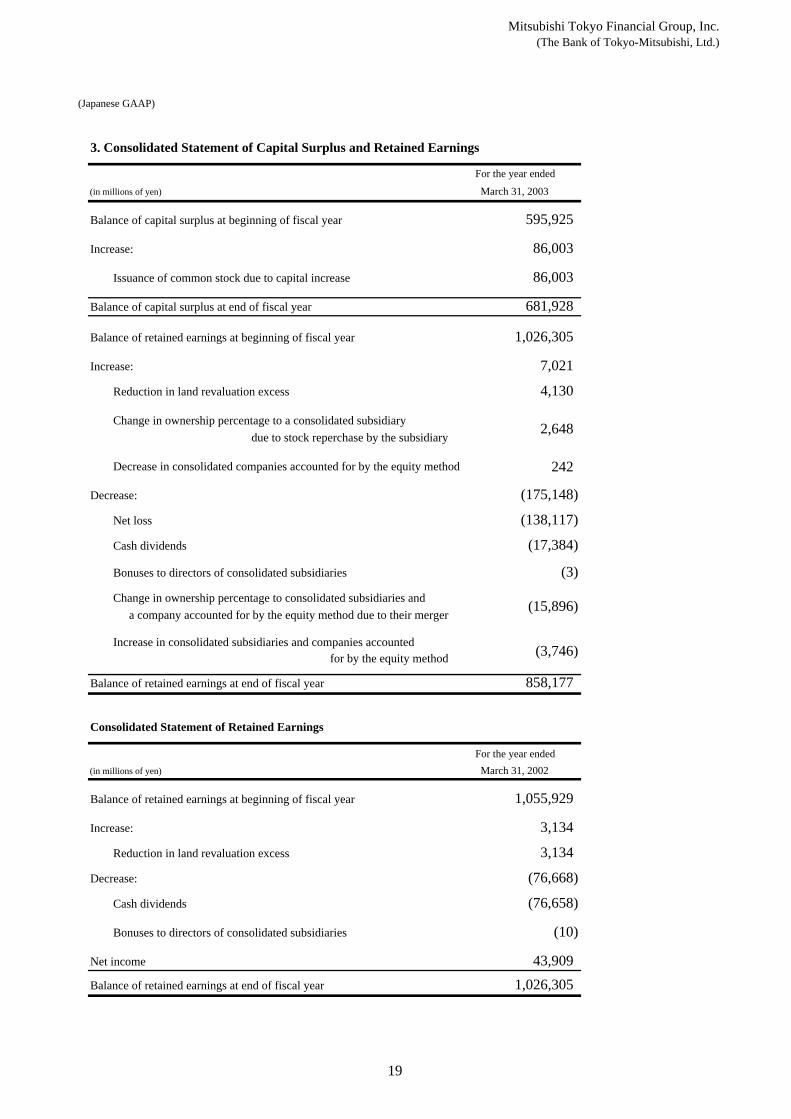
3. Consolidated Statement of Capital Surplus and Retained Earnings
(in millions of yen)
Balance of capital surplus at beginning of fiscal year 595,925
Increase: 86,003
Issuance of common stock due to capital increase 86,003
Balance of capital surplus at end of fiscal year 681,928
Balance of retained earnings at beginning of fiscal year 1,026,305
Increase: 7,021
Reduction in land revaluation excess 4,130
Change in ownership percentage to a consolidated subsidiarydue to stock reperchase by the subsidiary
Decrease in consolidated companies accounted for by the equity method 242
Decrease: (175,148)
Net loss (138,117)
Cash dividends (17,384)
Bonuses to directors of consolidated subsidiaries (3)
Change in ownership percentage to consolidated subsidiaries and
Increase in consolidated subsidiaries and companies accountedfor by the equity method
Balance of retained earnings at end of fiscal year 858,177
Consolidated Statement of Retained Earnings
(in millions of yen)
Balance of retained earnings at beginning of fiscal year 1,055,929
Increase: 3,134
Reduction in land revaluation excess 3,134
Decrease: (76,668)
Cash dividends (76,658)
Bonuses to directors of consolidated subsidiaries (10)
Net income 43,909Balance of retained earnings at end of fiscal year 1,026,305
For the year ended
March 31, 2003
(3,746)
2,648
a company accounted for by the equity method due to their merger(15,896)
For the year ended March 31, 2002
19
Mitsubishi Tokyo Financial Group, Inc.(The Bank of Tokyo-Mitsubishi, Ltd.)
(Japanese GAAP)
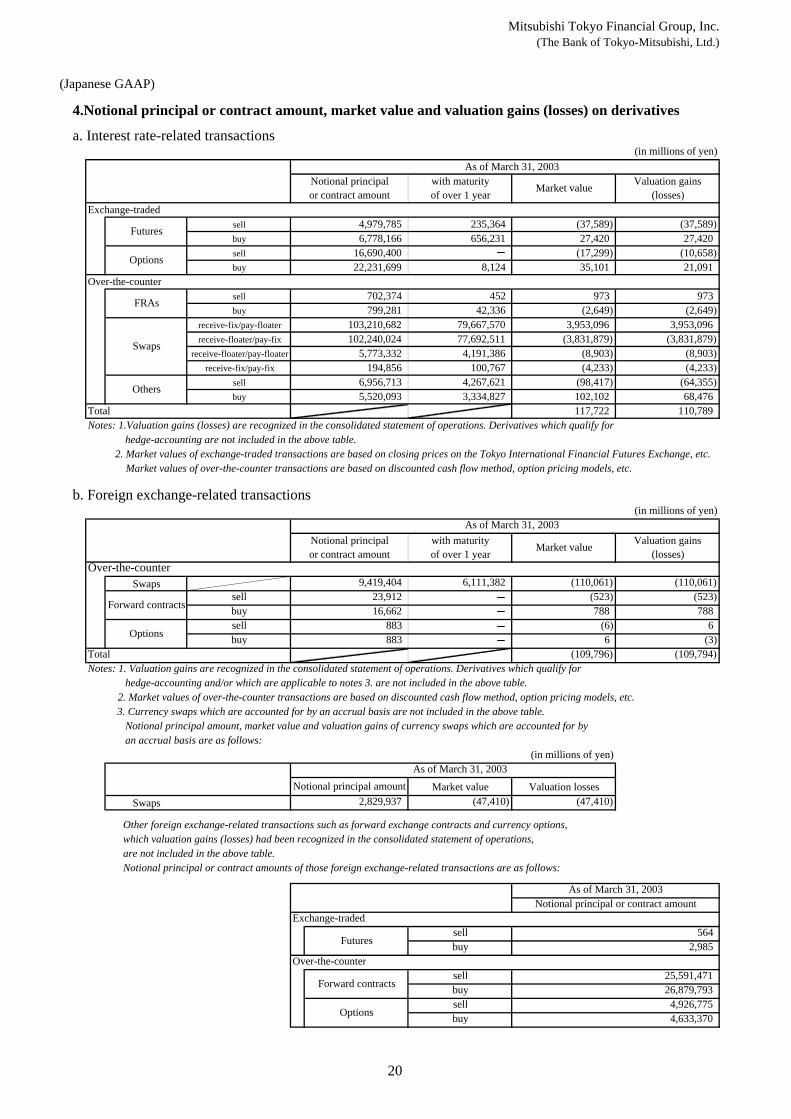
4.Notional principal or contract amount, market value and valuation gains (losses) on derivatives
a. Interest rate-related transactions(in millions of yen)
Exchange-tradedsell 4,979,785 235,364 (37,589) (37,589)buy 6,778,166 656,231 27,420 27,420sell 16,690,400 (17,299) (10,658)buy 22,231,699 8,124 35,101 21,091
Over-the-countersell 702,374 452 973 973buy 799,281 42,336 (2,649) (2,649)
receive-fix/pay-floater 103,210,682 79,667,570 3,953,096 3,953,096receive-floater/pay-fix 102,240,024 77,692,511 (3,831,879) (3,831,879)
receive-floater/pay-floater 5,773,332 4,191,386 (8,903) (8,903)receive-fix/pay-fix 194,856 100,767 (4,233) (4,233)
sell 6,956,713 4,267,621 (98,417) (64,355)buy 5,520,093 3,334,827 102,102 68,476
Total 117,722 110,789Notes: 1.Valuation gains (losses) are recognized in the consolidated statement of operations. Derivatives which qualify for hedge-accounting are not included in the above table.
2. Market values of exchange-traded transactions are based on closing prices on the Tokyo International Financial Futures Exchange, etc. Market values of over-the-counter transactions are based on discounted cash flow method, option pricing models, etc.
b. Foreign exchange-related transactions(in millions of yen)
Over-the-counterSwaps 9,419,404 6,111,382 (110,061) (110,061)
sell 23,912 (523) (523)buy 16,662 788 788sell 883 (6) 6buy 883 6 (3)
Total (109,796) (109,794)Notes: 1. Valuation gains are recognized in the consolidated statement of operations. Derivatives which qualify for hedge-accounting and/or which are applicable to notes 3. are not included in the above table.
2. Market values of over-the-counter transactions are based on discounted cash flow method, option pricing models, etc. 3. Currency swaps which are accounted for by an accrual basis are not included in the above table. Notional principal amount, market value and valuation gains of currency swaps which are accounted for by an accrual basis are as follows:
(in millions of yen)
Market value Valuation lossesSwaps 2,829,937 (47,410) (47,410)
Other foreign exchange-related transactions such as forward exchange contracts and currency options, which valuation gains (losses) had been recognized in the consolidated statement of operations, are not included in the above table. Notional principal or contract amounts of those foreign exchange-related transactions are as follows:
Exchange-tradedsell 564buy 2,985
Over-the-countersell 25,591,471buy 26,879,793sell 4,926,775buy 4,633,370
Forward contracts
Options
Notional principal amount
Forward contracts
As of March 31, 2003Notional principal or contract amount
Futures
Options
As of March 31, 2003
Others
Futures
Options
FRAs
Swaps
As of March 31, 2003Notional principalor contract amount
with maturityof over 1 year
As of March 31, 2003Notional principalor contract amount Market value Valuation gains
(losses)
with maturityof over 1 year Market value Valuation gains
(losses)
20
Mitsubishi Tokyo Financial Group, Inc.(The Bank of Tokyo-Mitsubishi, Ltd.)
(Japanese GAAP)
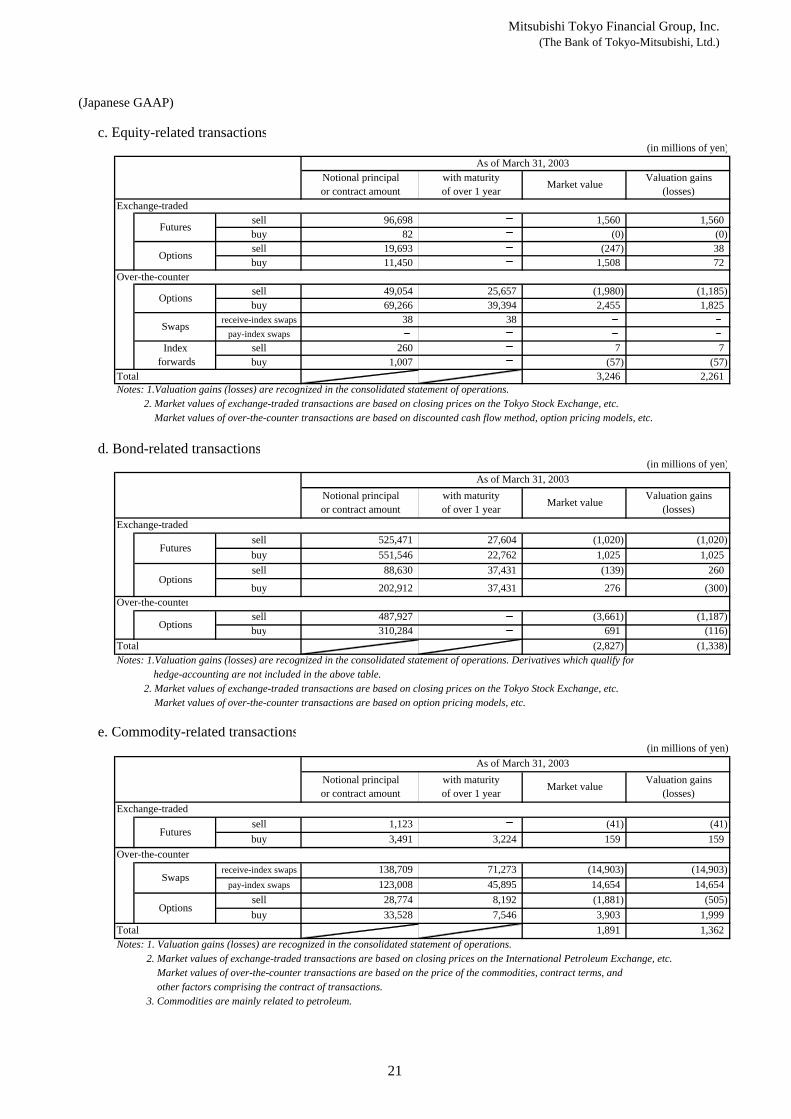
c. Equity-related transactions(in millions of yen)
Exchange-tradedsell 96,698 1,560 1,560buy 82 (0) (0)sell 19,693 (247) 38buy 11,450 1,508 72
Over-the-countersell 49,054 25,657 (1,980) (1,185)buy 69,266 39,394 2,455 1,825
receive-index swaps 38 38pay-index swaps
sell 260 7 7buy 1,007 (57) (57)
Total 3,246 2,261Notes: 1.Valuation gains (losses) are recognized in the consolidated statement of operations.
2. Market values of exchange-traded transactions are based on closing prices on the Tokyo Stock Exchange, etc. Market values of over-the-counter transactions are based on discounted cash flow method, option pricing models, etc.
d. Bond-related transactions(in millions of yen)
Exchange-tradedsell 525,471 27,604 (1,020) (1,020)buy 551,546 22,762 1,025 1,025sell 88,630 37,431 (139) 260
buy 202,912 37,431 276 (300)Over-the-counter
sell 487,927 (3,661) (1,187)buy 310,284 691 (116)
Total (2,827) (1,338)Notes: 1.Valuation gains (losses) are recognized in the consolidated statement of operations. Derivatives which qualify for hedge-accounting are not included in the above table.
2. Market values of exchange-traded transactions are based on closing prices on the Tokyo Stock Exchange, etc. Market values of over-the-counter transactions are based on option pricing models, etc.
e. Commodity-related transactions(in millions of yen)
Exchange-tradedsell 1,123 (41) (41)buy 3,491 3,224 159 159
Over-the-counterreceive-index swaps 138,709 71,273 (14,903) (14,903)
pay-index swaps 123,008 45,895 14,654 14,654sell 28,774 8,192 (1,881) (505)buy 33,528 7,546 3,903 1,999
Total 1,891 1,362Notes: 1. Valuation gains (losses) are recognized in the consolidated statement of operations.
2. Market values of exchange-traded transactions are based on closing prices on the International Petroleum Exchange, etc. Market values of over-the-counter transactions are based on the price of the commodities, contract terms, and other factors comprising the contract of transactions. 3. Commodities are mainly related to petroleum.
Valuation gains(losses)
Futures
Options
Options
As of March 31, 2003Notional principalor contract amount
with maturityof over 1 year Market value Valuation gains
(losses)
Futures
Options
Options
Swaps
Index forwards
As of March 31, 2003Notional principalor contract amount
with maturityof over 1 year Market value Valuation gains
(losses)
As of March 31, 2003Notional principalor contract amount
with maturityof over 1 year Market value
Swaps
Options
Futures
21
Mitsubishi Tokyo Financial Group, Inc.(The Bank of Tokyo-Mitsubishi, Ltd.)
(Japanese GAAP)
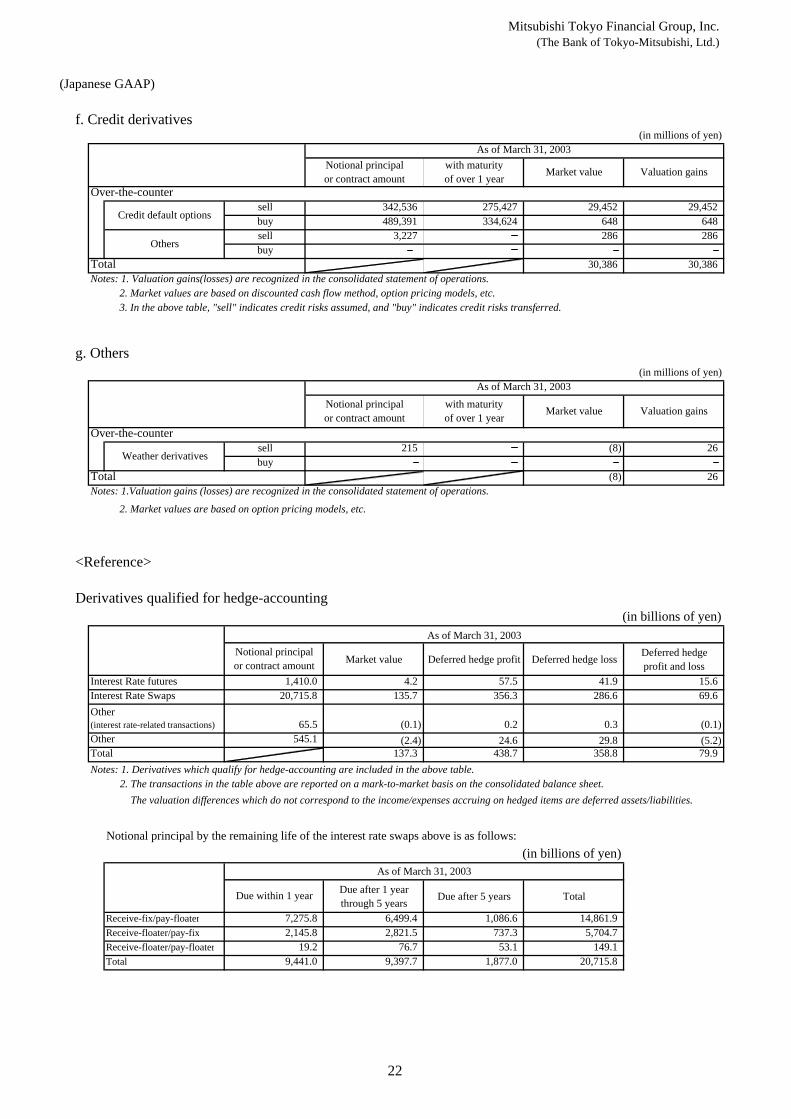
f. Credit derivatives (in millions of yen)
Over-the-countersell 342,536 275,427 29,452 29,452buy 489,391 334,624 648 648sell 3,227 286 286buy
Total 30,386 30,386Notes: 1. Valuation gains(losses) are recognized in the consolidated statement of operations.
2. Market values are based on discounted cash flow method, option pricing models, etc. 3. In the above table, "sell" indicates credit risks assumed, and "buy" indicates credit risks transferred.
g. Others(in millions of yen)
Over-the-countersell 215 (8) 26buy
Total (8) 26Notes: 1.Valuation gains (losses) are recognized in the consolidated statement of operations.
2. Market values are based on option pricing models, etc.
<Reference>
Derivatives qualified for hedge-accounting(in billions of yen)
Market value Deferred hedge profit Deferred hedge loss Deferred hedgeprofit and loss
Interest Rate futures 4.2 57.5 41.9 15.6Interest Rate Swaps 135.7 356.3 286.6 69.6
(0.1) 0.2 0.3 (0.1)(2.4) 24.6 29.8 (5.2)
Total 137.3 438.7 358.8 79.9Notes: 1. Derivatives which qualify for hedge-accounting are included in the above table. 2. The transactions in the table above are reported on a mark-to-market basis on the consolidated balance sheet. The valuation differences which do not correspond to the income/expenses accruing on hedged items are deferred assets/liabilities.
Notional principal by the remaining life of the interest rate swaps above is as follows:(in billions of yen)
Due after 1 yearthrough 5 years Due after 5 years Total
Receive-fix/pay-floater 6,499.4 1,086.6 14,861.9Receive-floater/pay-fix 2,821.5 737.3 5,704.7Receive-floater/pay-floater 76.7 53.1 149.1Total 9,397.7 1,877.0 20,715.8
Credit default options
Others
As of March 31, 2003
As of March 31, 2003Notional principalor contract amount
with maturityof over 1 year Market value Valuation gains
Notional principalor contract amount
with maturityof over 1 year Market value Valuation gains
Weather derivatives
Notional principalor contract amount
Other(interest rate-related transactions)
As of March 31, 2003
Other
1,410.020,715.8
65.5545.1
19.29,441.0
As of March 31, 2003
Due within 1 year
7,275.82,145.8
22
Mitsubishi Tokyo Financial Group, Inc.(The Bank of Tokyo-Mitsubishi, Ltd.)
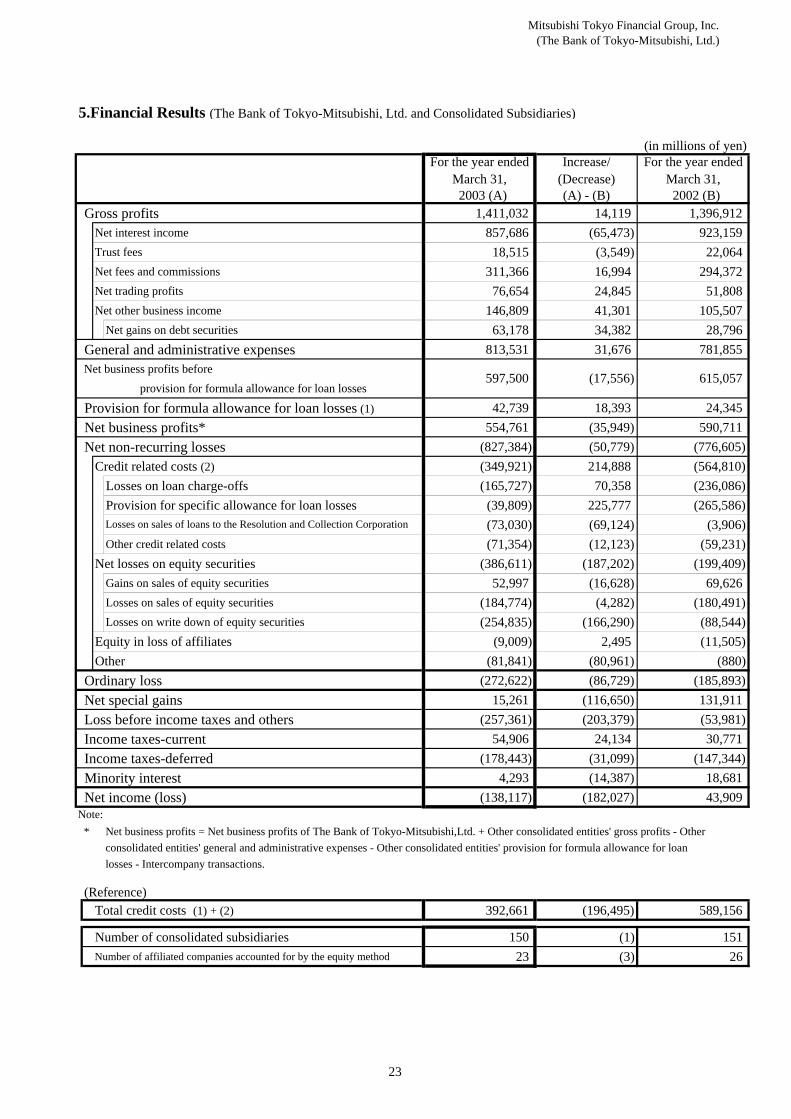
5.Financial Results (The Bank of Tokyo-Mitsubishi, Ltd. and Consolidated Subsidiaries)
(in millions of yen)For the year ended Increase/ For the year ended
March 31, (Decrease) March 31, 2003 (A) (A) - (B) 2002 (B)
Gross profits 1,411,032 14,119 1,396,912 Net interest income 857,686 (65,473) 923,159 Trust fees 18,515 (3,549) 22,064 Net fees and commissions 311,366 16,994 294,372 Net trading profits 76,654 24,845 51,808 Net other business income 146,809 41,301 105,507
Net gains on debt securities 63,178 34,382 28,796 General and administrative expenses 813,531 31,676 781,855 Net business profits before
provision for formula allowance for loan losses
Provision for formula allowance for loan losses (1) 42,739 18,393 24,345 Net business profits* 554,761 (35,949) 590,711 Net non-recurring losses (827,384) (50,779) (776,605)
Credit related costs (2) (349,921) 214,888 (564,810)Losses on loan charge-offs (165,727) 70,358 (236,086)Provision for specific allowance for loan losses (39,809) 225,777 (265,586)
(73,030) (69,124) (3,906)Other credit related costs (71,354) (12,123) (59,231)
Net losses on equity securities (386,611) (187,202) (199,409)Gains on sales of equity securities 52,997 (16,628) 69,626 Losses on sales of equity securities (184,774) (4,282) (180,491)Losses on write down of equity securities (254,835) (166,290) (88,544)
Equity in loss of affiliates (9,009) 2,495 (11,505)Other (81,841) (80,961) (880)
Ordinary loss (272,622) (86,729) (185,893)Net special gains 15,261 (116,650) 131,911 Loss before income taxes and others (257,361) (203,379) (53,981)Income taxes-current 54,906 24,134 30,771 Income taxes-deferred (178,443) (31,099) (147,344)Minority interest 4,293 (14,387) 18,681 Net income (loss) (138,117) (182,027) 43,909
* Net business profits = Net business profits of The Bank of Tokyo-Mitsubishi,Ltd. + Other consolidated entities' gross profits - Other consolidated entities' general and administrative expenses - Other consolidated entities' provision for formula allowance for loanlosses - Intercompany transactions.
(Reference)Total credit costs (1) + (2) 392,661 (196,495) 589,156
Number of consolidated subsidiaries 150 (1) 151 Number of affiliated companies accounted for by the equity method 23 (3) 26
597,500 (17,556) 615,057
Note:
Losses on sales of loans to the Resolution and Collection Corporation
23
Mitsubishi Tokyo Financial Group, Inc.(The Bank of Tokyo-Mitsubishi, Ltd.)
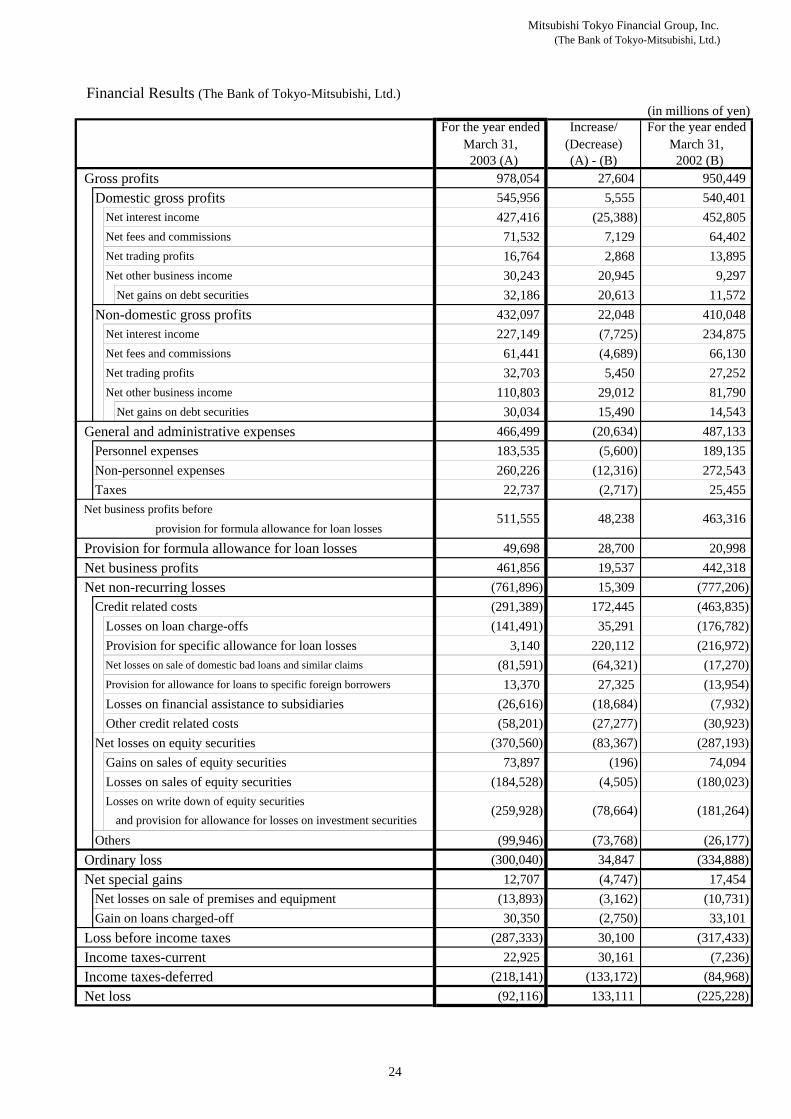
Financial Results (The Bank of Tokyo-Mitsubishi, Ltd.)(in millions of yen)
For the year ended Increase/ For the year ended March 31, (Decrease) March 31, 2003 (A) (A) - (B) 2002 (B)
Gross profits 978,054 27,604 950,449 Domestic gross profits 545,956 5,555 540,401
Net interest income 427,416 (25,388) 452,805 Net fees and commissions 71,532 7,129 64,402 Net trading profits 16,764 2,868 13,895 Net other business income 30,243 20,945 9,297
Net gains on debt securities 32,186 20,613 11,572 Non-domestic gross profits 432,097 22,048 410,048
Net interest income 227,149 (7,725) 234,875 Net fees and commissions 61,441 (4,689) 66,130 Net trading profits 32,703 5,450 27,252 Net other business income 110,803 29,012 81,790
Net gains on debt securities 30,034 15,490 14,543 General and administrative expenses 466,499 (20,634) 487,133
Personnel expenses 183,535 (5,600) 189,135 Non-personnel expenses 260,226 (12,316) 272,543 Taxes 22,737 (2,717) 25,455
Net business profits before provision for formula allowance for loan losses
Provision for formula allowance for loan losses 49,698 28,700 20,998 Net business profits 461,856 19,537 442,318 Net non-recurring losses (761,896) 15,309 (777,206)
Credit related costs (291,389) 172,445 (463,835)Losses on loan charge-offs (141,491) 35,291 (176,782)Provision for specific allowance for loan losses 3,140 220,112 (216,972)Net losses on sale of domestic bad loans and similar claims (81,591) (64,321) (17,270)Provision for allowance for loans to specific foreign borrowers 13,370 27,325 (13,954)Losses on financial assistance to subsidiaries (26,616) (18,684) (7,932)Other credit related costs (58,201) (27,277) (30,923)
Net losses on equity securities (370,560) (83,367) (287,193)Gains on sales of equity securities 73,897 (196) 74,094 Losses on sales of equity securities (184,528) (4,505) (180,023)Losses on write down of equity securities
Others (99,946) (73,768) (26,177)Ordinary loss (300,040) 34,847 (334,888)Net special gains 12,707 (4,747) 17,454
Net losses on sale of premises and equipment (13,893) (3,162) (10,731)Gain on loans charged-off 30,350 (2,750) 33,101
Loss before income taxes (287,333) 30,100 (317,433)Income taxes-current 22,925 30,161 (7,236)Income taxes-deferred (218,141) (133,172) (84,968)Net loss (92,116) 133,111 (225,228)
511,555 48,238 463,316
(259,928) (78,664) (181,264)and provision for allowance for losses on investment securities
24
Mitsubishi Tokyo Financial Group, Inc.(The Bank of Tokyo-Mitsubishi, Ltd.)
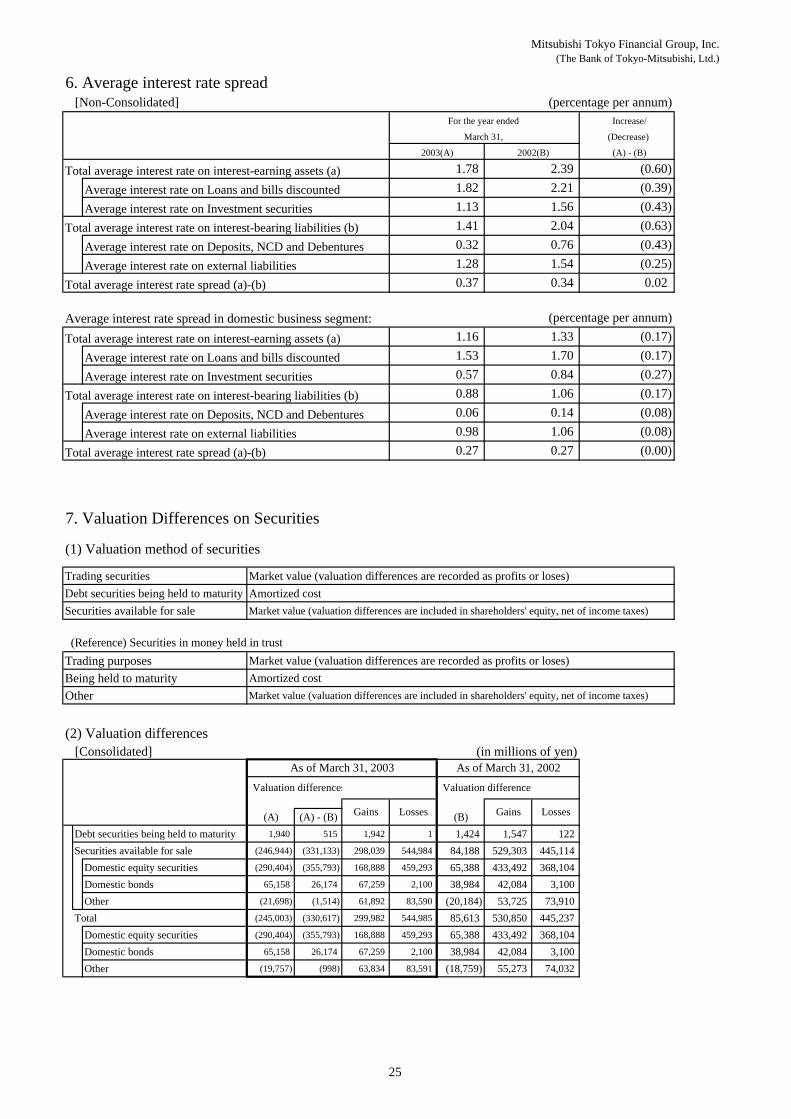
6. Average interest rate spread[Non-Consolidated] (percentage per annum)
Total average interest rate on interest-earning assets (a) Average interest rate on Loans and bills discounted Average interest rate on Investment securities
Total average interest rate on interest-bearing liabilities (b)Average interest rate on Deposits, NCD and DebenturesAverage interest rate on external liabilities
Total average interest rate spread (a)-(b)
Average interest rate spread in domestic business segment:Total average interest rate on interest-earning assets (a)
Average interest rate on Loans and bills discountedAverage interest rate on Investment securities
Total average interest rate on interest-bearing liabilities (b)Average interest rate on Deposits, NCD and DebenturesAverage interest rate on external liabilities
Total average interest rate spread (a)-(b)
7. Valuation Differences on Securities
(1) Valuation method of securities
Trading securities Market value (valuation differences are recorded as profits or loses)Debt securities being held to maturity Amortized costSecurities available for sale Market value (valuation differences are included in shareholders' equity, net of income taxes)
(Reference) Securities in money held in trustTrading purposes Market value (valuation differences are recorded as profits or loses)Being held to maturity Amortized costOther Market value (valuation differences are included in shareholders' equity, net of income taxes)
(2) Valuation differences[Consolidated] (in millions of yen)
(A) (A) - (B) (B)Debt securities being held to maturity 1,940 515 1,942 1 1,424 1,547 122 Securities available for sale (246,944) (331,133) 298,039 544,984 84,188 529,303 445,114
Domestic equity securities (290,404) (355,793) 168,888 459,293 65,388 433,492 368,104 Domestic bonds 65,158 26,174 67,259 2,100 38,984 42,084 3,100 Other (21,698) (1,514) 61,892 83,590 (20,184) 53,725 73,910
Total (245,003) (330,617) 299,982 544,985 85,613 530,850 445,237 Domestic equity securities (290,404) (355,793) 168,888 459,293 65,388 433,492 368,104 Domestic bonds 65,158 26,174 67,259 2,100 38,984 42,084 3,100 Other (19,757) (998) 63,834 83,591 (18,759) 55,273 74,032
Losses
Valuation differences
As of March 31, 2002As of March 31, 2003
Valuation differences
Gains LossesGains
2003(A) 2002(B)
Increase/
(Decrease)
(A) - (B)
For the year ended
March 31,
1.78 1.82 1.13 1.41 0.32 1.28 0.37
1.16 1.53 0.57 0.88 0.06 0.98 0.27
2.39 (0.60)2.21 (0.39)1.56 (0.43)2.04 (0.63)0.76 (0.43)1.54 (0.25)
1.33 (0.17)(percentage per annum)
0.34 0.02
1.70 (0.17)0.84 (0.27)1.06 (0.17)0.14 (0.08)1.06 (0.08)0.27 (0.00)
25
Mitsubishi Tokyo Financial Group, Inc.(The Bank of Tokyo-Mitsubishi, Ltd.)
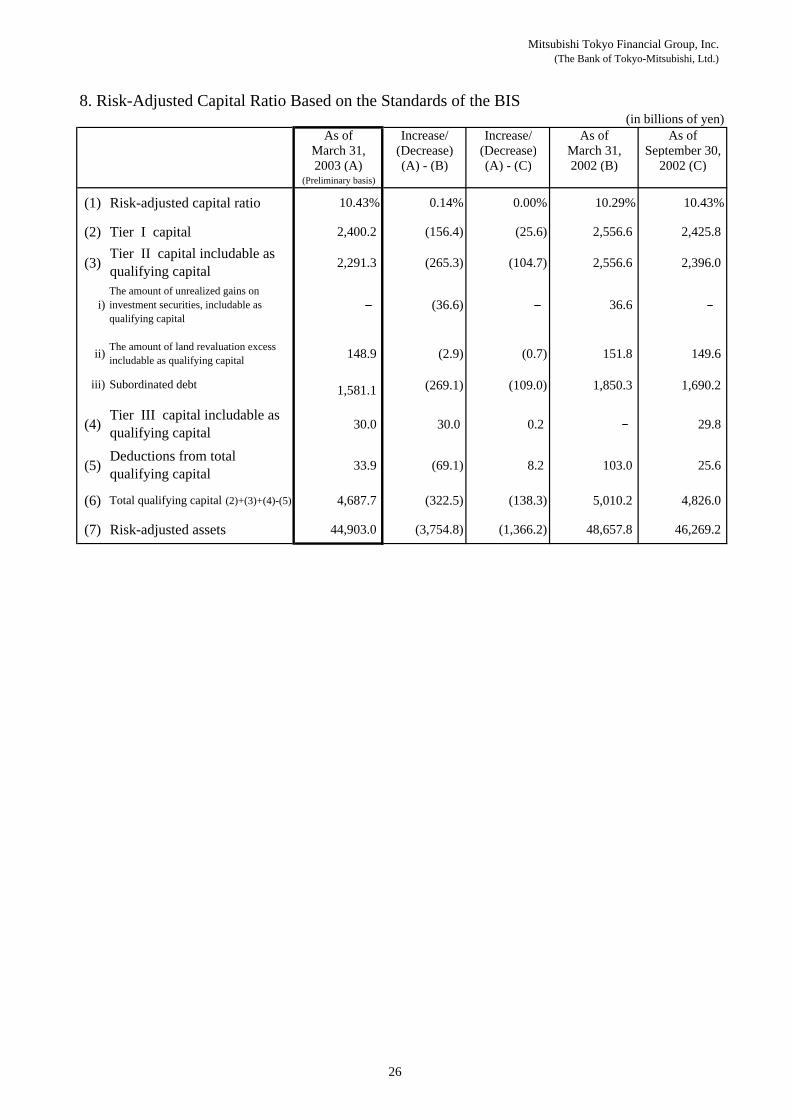
8. Risk-Adjusted Capital Ratio Based on the Standards of the BIS(in billions of yen)
As of Increase/ Increase/ As of As ofMarch 31, (Decrease) (Decrease) March 31, September 30,2003 (A) (A) - (B) (A) - (C) 2002 (B) 2002 (C)
(Preliminary basis)
(1) Risk-adjusted capital ratio 10.43% 0.14% 0.00% 10.29% 10.43%
(2) Tier I capital 2,400.2 (156.4) (25.6) 2,556.6 2,425.8
(3) 2,291.3 (265.3) (104.7) 2,556.6 2,396.0
iii) Subordinated debt 1,581.1 (269.1) (109.0) 1,850.3 1,690.2
(4) 30.0 30.0 0.2 29.8
(5) 33.9 (69.1) 8.2 103.0 25.6
(6) Total qualifying capital (2)+(3)+(4)-(5) 4,687.7 (322.5) (138.3) 5,010.2 4,826.0
(7) Risk-adjusted assets 44,903.0 (3,754.8) (1,366.2) 48,657.8 46,269.2
(36.6) 36.6
Deductions from totalqualifying capital
149.6 148.9 (2.9) (0.7) 151.8 The amount of land revaluation excessincludable as qualifying capital
i)
ii)
Tier III capital includable asqualifying capital
Tier II capital includable asqualifying capitalThe amount of unrealized gains oninvestment securities, includable asqualifying capital
26
Mitsubishi Tokyo Financial Group, Inc.(The Bank of Tokyo-Mitsubishi, Ltd)
2 Loan Portfolio and Other
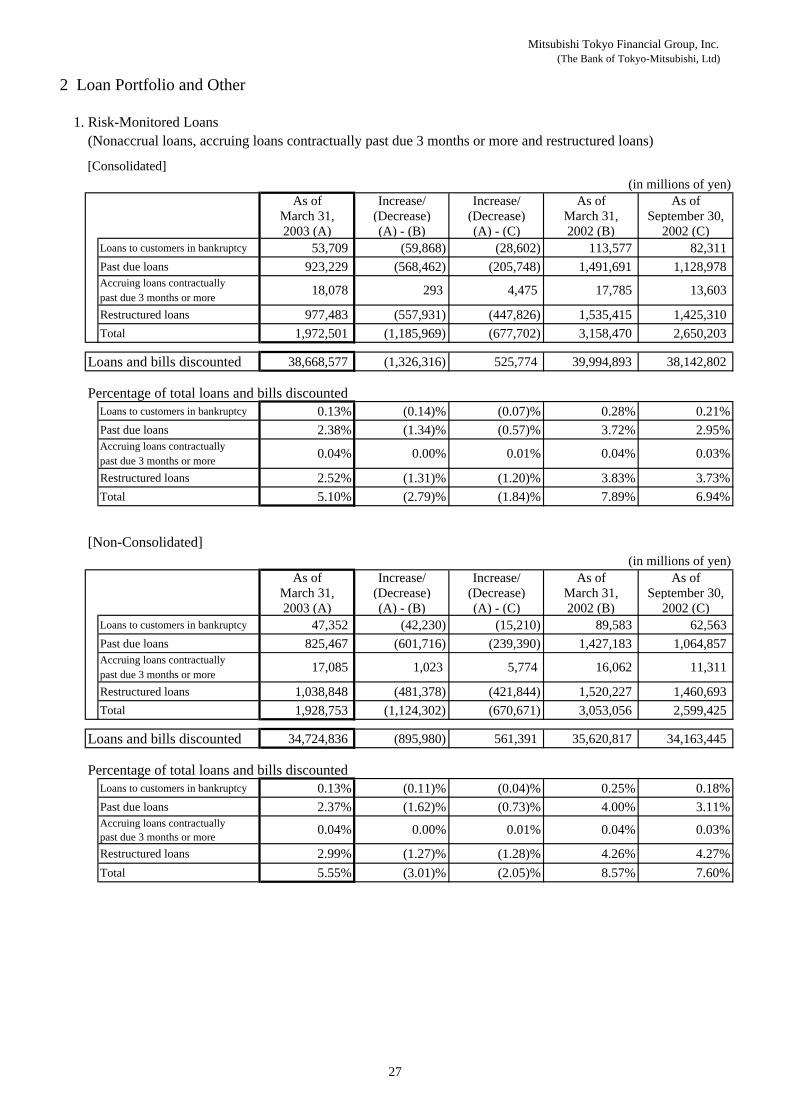
1. Risk-Monitored Loans(Nonaccrual loans, accruing loans contractually past due 3 months or more and restructured loans)
[Consolidated](in millions of yen)
As of Increase/ Increase/ As of As ofMarch 31, (Decrease) (Decrease) March 31, September 30,2003 (A) (A) - (B) (A) - (C) 2002 (B) 2002 (C)
Loans to customers in bankruptcy 53,709 (59,868) (28,602) 113,577 82,311 Past due loans 923,229 (568,462) (205,748) 1,491,691 1,128,978
past due 3 months or moreRestructured loans 977,483 (557,931) (447,826) 1,535,415 1,425,310 Total 1,972,501 (1,185,969) (677,702) 3,158,470 2,650,203
Loans and bills discounted 38,668,577 (1,326,316) 525,774 39,994,893 38,142,802
Percentage of total loans and bills discountedLoans to customers in bankruptcy 0.13% (0.14)% (0.07)% 0.28% 0.21%Past due loans 2.38% (1.34)% (0.57)% 3.72% 2.95%
past due 3 months or moreRestructured loans 2.52% (1.31)% (1.20)% 3.83% 3.73%Total 5.10% (2.79)% (1.84)% 7.89% 6.94%
[Non-Consolidated](in millions of yen)
As of Increase/ Increase/ As of As ofMarch 31, (Decrease) (Decrease) March 31, September 30,2003 (A) (A) - (B) (A) - (C) 2002 (B) 2002 (C)
Loans to customers in bankruptcy 47,352 (42,230) (15,210) 89,583 62,563 Past due loans 825,467 (601,716) (239,390) 1,427,183 1,064,857
past due 3 months or moreRestructured loans 1,038,848 (481,378) (421,844) 1,520,227 1,460,693 Total 1,928,753 (1,124,302) (670,671) 3,053,056 2,599,425
Loans and bills discounted 34,724,836 (895,980) 561,391 35,620,817 34,163,445
Percentage of total loans and bills discountedLoans to customers in bankruptcy 0.13% (0.11)% (0.04)% 0.25% 0.18%Past due loans 2.37% (1.62)% (0.73)% 4.00% 3.11%
past due 3 months or moreRestructured loans 2.99% (1.27)% (1.28)% 4.26% 4.27%Total 5.55% (3.01)% (2.05)% 8.57% 7.60%
0.04% 0.03%Accruing loans contractually 0.04% 0.00% 0.01%
0.00% 0.01% 0.04% 0.03%
Accruing loans contractually 18,078
Accruing loans contractually 0.04%
293 4,475 17,785 13,603
5,774 16,062 11,311 Accruing loans contractually 17,085 1,023
27
Mitsubishi Tokyo Financial Group, Inc.(The Bank of Tokyo-Mitsubishi, Ltd.)
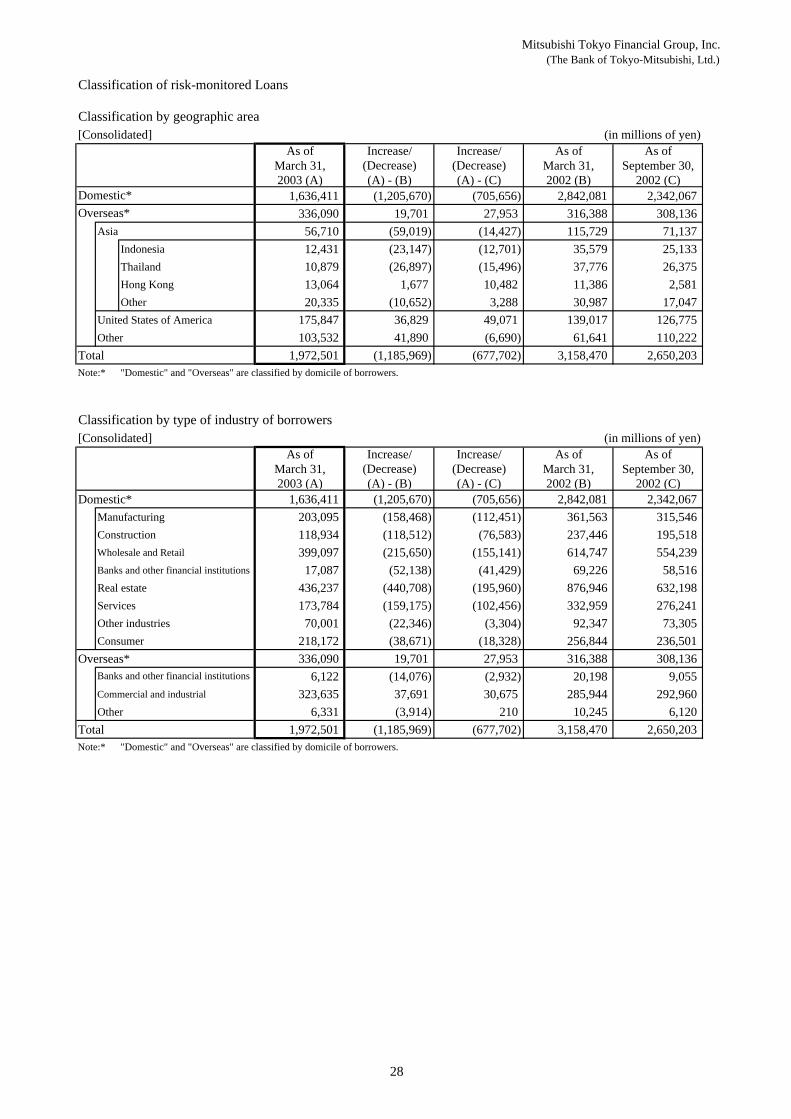
Classification of risk-monitored Loans
Classification by geographic area[Consolidated] (in millions of yen)
As of Increase/ Increase/ As of As ofMarch 31, (Decrease) (Decrease) March 31, September 30,2003 (A) (A) - (B) (A) - (C) 2002 (B) 2002 (C)
1,636,411 (1,205,670) (705,656) 2,842,081 2,342,067 336,090 19,701 27,953 316,388 308,136
Asia 56,710 (59,019) (14,427) 115,729 71,137 Indonesia 12,431 (23,147) (12,701) 35,579 25,133 Thailand 10,879 (26,897) (15,496) 37,776 26,375 Hong Kong 13,064 1,677 10,482 11,386 2,581 Other 20,335 (10,652) 3,288 30,987 17,047
United States of America 175,847 36,829 49,071 139,017 126,775 Other 103,532 41,890 (6,690) 61,641 110,222
Total 1,972,501 (1,185,969) (677,702) 3,158,470 2,650,203 Note:* "Domestic" and "Overseas" are classified by domicile of borrowers.
Classification by type of industry of borrowers[Consolidated] (in millions of yen)
As of Increase/ Increase/ As of As ofMarch 31, (Decrease) (Decrease) March 31, September 30,2003 (A) (A) - (B) (A) - (C) 2002 (B) 2002 (C)
Domestic* 1,636,411 (1,205,670) (705,656) 2,842,081 2,342,067 Manufacturing 203,095 (158,468) (112,451) 361,563 315,546 Construction 118,934 (118,512) (76,583) 237,446 195,518 Wholesale and Retail 399,097 (215,650) (155,141) 614,747 554,239 Banks and other financial institutions 17,087 (52,138) (41,429) 69,226 58,516 Real estate 436,237 (440,708) (195,960) 876,946 632,198 Services 173,784 (159,175) (102,456) 332,959 276,241 Other industries 70,001 (22,346) (3,304) 92,347 73,305 Consumer 218,172 (38,671) (18,328) 256,844 236,501
Overseas* 336,090 19,701 27,953 316,388 308,136 6,122 (14,076) (2,932) 20,198 9,055
Commercial and industrial 323,635 37,691 30,675 285,944 292,960 Other 6,331 (3,914) 210 10,245 6,120
Total 1,972,501 (1,185,969) (677,702) 3,158,470 2,650,203 Note:* "Domestic" and "Overseas" are classified by domicile of borrowers.
Banks and other financial institutions
Domestic*Overseas*
28
Mitsubishi Tokyo Financial Group, Inc.(The Bank of Tokyo-Mitsubishi, Ltd.)
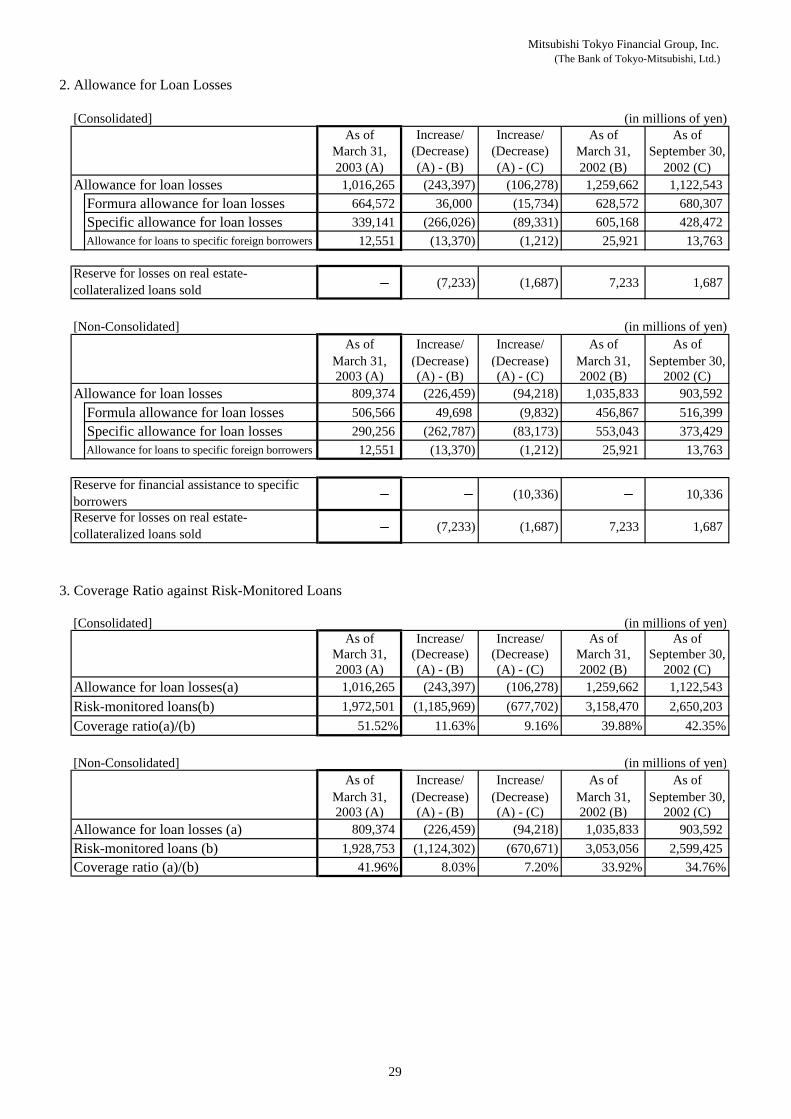
2. Allowance for Loan Losses
[Consolidated] (in millions of yen)As of Increase/ Increase/ As of As of
March 31, (Decrease) (Decrease) March 31, September 30,2003 (A) (A) - (B) (A) - (C) 2002 (B) 2002 (C)
Allowance for loan losses 1,016,265 (243,397) (106,278) 1,259,662 1,122,543 Formura allowance for loan losses 664,572 36,000 (15,734) 628,572 680,307 Specific allowance for loan losses 339,141 (266,026) (89,331) 605,168 428,472 Allowance for loans to specific foreign borrowers 12,551 (13,370) (1,212) 25,921 13,763
(7,233) (1,687) 7,233 1,687
[Non-Consolidated] (in millions of yen)As of Increase/ Increase/ As of As of
March 31, (Decrease) (Decrease) March 31, September 30,2003 (A) (A) - (B) (A) - (C) 2002 (B) 2002 (C)
Allowance for loan losses 809,374 (226,459) (94,218) 1,035,833 903,592 Formula allowance for loan losses 506,566 49,698 (9,832) 456,867 516,399 Specific allowance for loan losses 290,256 (262,787) (83,173) 553,043 373,429 Allowance for loans to specific foreign borrowers 12,551 (13,370) (1,212) 25,921 13,763
(10,336) 10,336
(7,233) (1,687) 7,233 1,687
3. Coverage Ratio against Risk-Monitored Loans
[Consolidated] (in millions of yen)As of Increase/ Increase/ As of As of
March 31, (Decrease) (Decrease) March 31, September 30,2003 (A) (A) - (B) (A) - (C) 2002 (B) 2002 (C)
Allowance for loan losses(a) 1,016,265 (243,397) (106,278) 1,259,662 1,122,543 Risk-monitored loans(b) 1,972,501 (1,185,969) (677,702) 3,158,470 2,650,203 Coverage ratio(a)/(b) 51.52% 11.63% 9.16% 39.88% 42.35%
[Non-Consolidated] (in millions of yen)As of Increase/ Increase/ As of As of
March 31, (Decrease) (Decrease) March 31, September 30,2003 (A) (A) - (B) (A) - (C) 2002 (B) 2002 (C)
Allowance for loan losses (a) 809,374 (226,459) (94,218) 1,035,833 903,592 Risk-monitored loans (b) 1,928,753 (1,124,302) (670,671) 3,053,056 2,599,425 Coverage ratio (a)/(b) 41.96% 8.03% 7.20% 33.92% 34.76%
Reserve for losses on real estate-collateralized loans sold
Reserve for financial assistance to specificborrowersReserve for losses on real estate-collateralized loans sold
29
Mitsubishi Tokyo Financial Group, Inc.(The Bank of Tokyo-Mitsubishi, Ltd.)
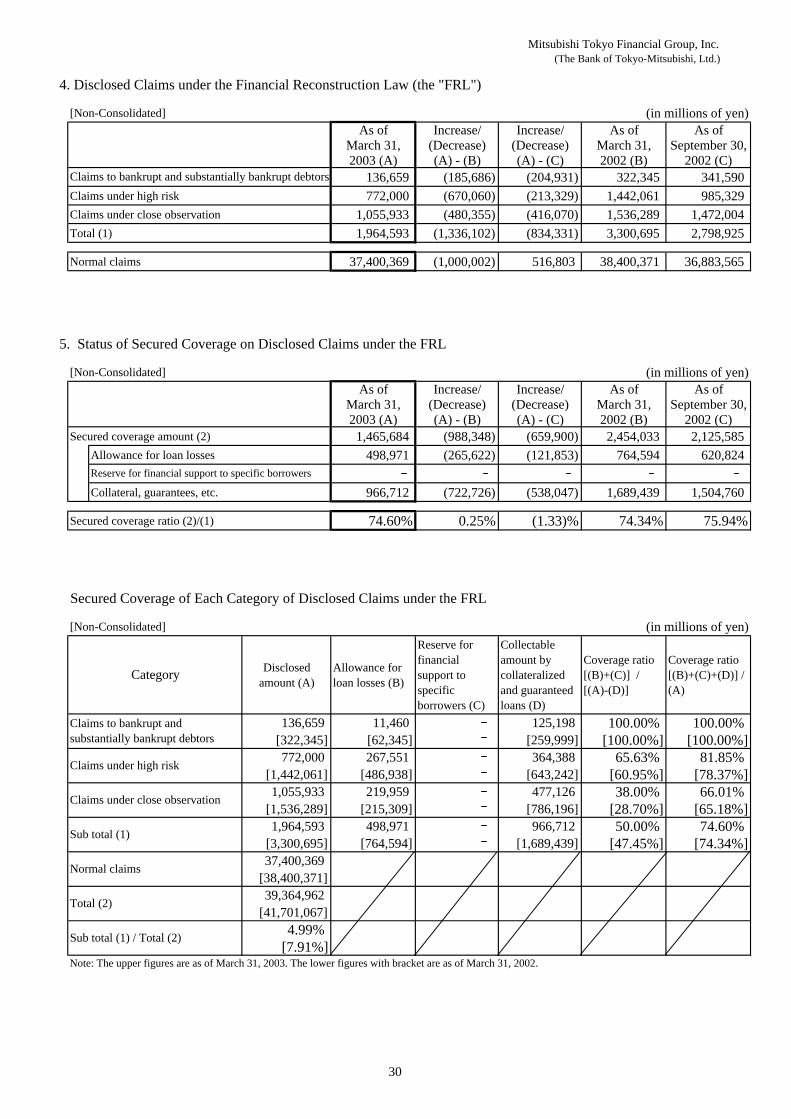
4. Disclosed Claims under the Financial Reconstruction Law (the "FRL")
[Non-Consolidated] (in millions of yen)As of Increase/ Increase/ As of As of
March 31, (Decrease) (Decrease) March 31, September 30,2003 (A) (A) - (B) (A) - (C) 2002 (B) 2002 (C)
136,659 (185,686) (204,931) 322,345 341,590 Claims under high risk 772,000 (670,060) (213,329) 1,442,061 985,329 Claims under close observation 1,055,933 (480,355) (416,070) 1,536,289 1,472,004 Total (1) 1,964,593 (1,336,102) (834,331) 3,300,695 2,798,925
Normal claims 37,400,369 (1,000,002) 516,803 38,400,371 36,883,565
5. Status of Secured Coverage on Disclosed Claims under the FRL
[Non-Consolidated] (in millions of yen)As of Increase/ Increase/ As of As of
March 31, (Decrease) (Decrease) March 31, September 30,2003 (A) (A) - (B) (A) - (C) 2002 (B) 2002 (C)
Secured coverage amount (2) 1,465,684 (988,348) (659,900) 2,454,033 2,125,585 Allowance for loan losses 498,971 (265,622) (121,853) 764,594 620,824
Collateral, guarantees, etc. 966,712 (722,726) (538,047) 1,689,439 1,504,760
Secured coverage ratio (2)/(1) 74.60% 0.25% (1.33)% 74.34% 75.94%
Secured Coverage of Each Category of Disclosed Claims under the FRL
[Non-Consolidated] (in millions of yen)
Disclosedamount (A)
Allowance forloan losses (B)
Reserve forfinancialsupport tospecificborrowers (C)
Collectableamount bycollateralizedand guaranteedloans (D)
Coverage ratio[(B)+(C)] /[(A)-(D)]
Coverage ratio[(B)+(C)+(D)] /(A)
136,659 11,460 125,198 100.00% 100.00% [322,345] [62,345] [259,999] [100.00%] [100.00%]772,000 267,551 364,388 65.63% 81.85%
[1,442,061] [486,938] [643,242] [60.95%] [78.37%]1,055,933 219,959 477,126 38.00% 66.01%
[1,536,289] [215,309] [786,196] [28.70%] [65.18%]1,964,593 498,971 966,712 50.00% 74.60%
[3,300,695] [764,594] [1,689,439] [47.45%] [74.34%]37,400,369
[38,400,371]39,364,962
[41,701,067]4.99%
[7.91%]
Claims to bankrupt and substantially bankrupt debtors
Reserve for financial support to specific borrowers
Category
Claims to bankrupt andsubstantially bankrupt debtors
Claims under high risk
Sub total (1) / Total (2)
Claims under close observation
Sub total (1)
Normal claims
Total (2)
Note: The upper figures are as of March 31, 2003. The lower figures with bracket are as of March 31, 2002.
30
Mitsubishi Tokyo Financial Group, Inc.(The Bank of Tokyo-Mitsubishi, Ltd.)
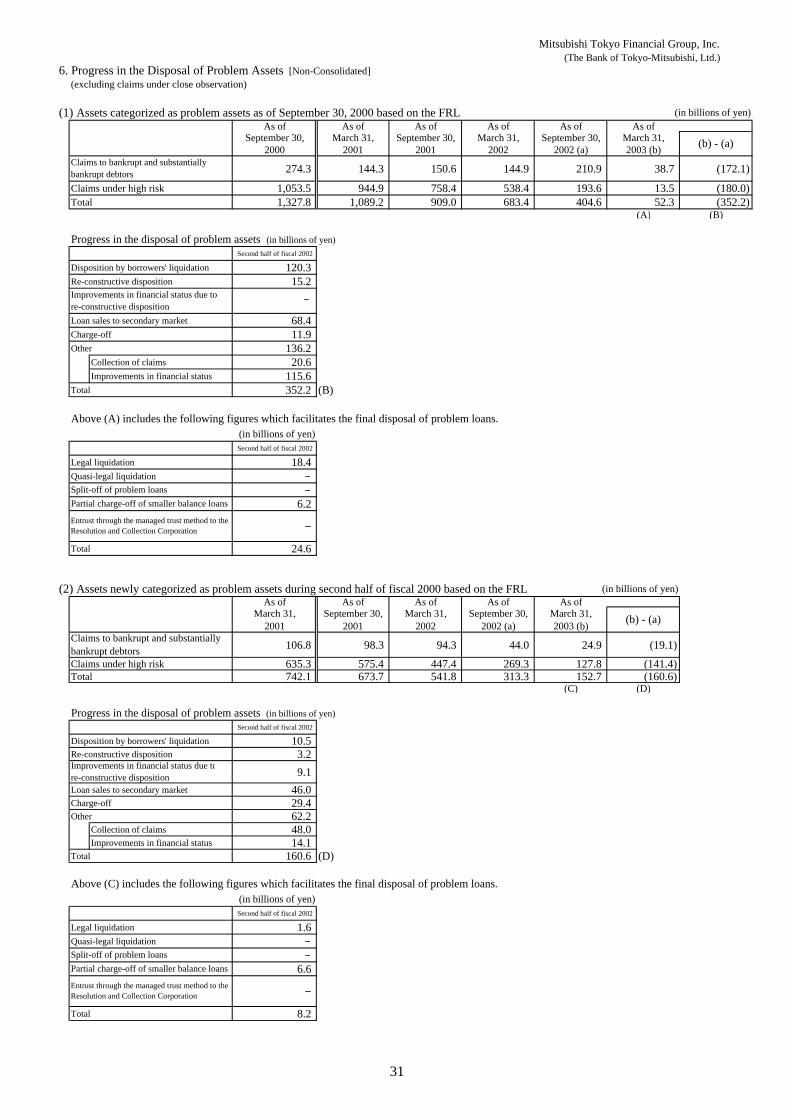
6. Progress in the Disposal of Problem Assets [Non-Consolidated](excluding claims under close observation)
(1) Assets categorized as problem assets as of September 30, 2000 based on the FRL (in billions of yen)As of As of As of As of As of As of
September 30, March 31, September 30, March 31, September 30, March 31,2000 2001 2001 2002 2002 (a) 2003 (b)
274.3 144.3 150.6 144.9 210.9 38.7 (172.1)
Claims under high risk 1,053.5 944.9 758.4 538.4 193.6 13.5 (180.0)Total 1,327.8 1,089.2 909.0 683.4 404.6 52.3 (352.2)
(A) (B)
Progress in the disposal of problem assets (in billions of yen)Second half of fiscal 2002
Disposition by borrowers' liquidation 120.3 Re-constructive disposition 15.2
Loan sales to secondary market 68.4 Charge-off 11.9 Other 136.2
Collection of claims 20.6 Improvements in financial status 115.6
Total 352.2 (B)
Above (A) includes the following figures which facilitates the final disposal of problem loans. (in billions of yen)Second half of fiscal 2002
Legal liquidation 18.4 Quasi-legal liquidation
6.2
Total 24.6
(2) Assets newly categorized as problem assets during second half of fiscal 2000 based on the FRL (in billions of yen)As of As of As of As of As of
March 31, September 30, March 31, September 30, March 31,2001 2001 2002 2002 (a) 2003 (b)
106.8 98.3 94.3 44.0 24.9 (19.1)Claims under high risk 635.3 575.4 447.4 269.3 127.8 (141.4)Total 742.1 673.7 541.8 313.3 152.7 (160.6)
(C) (D)
Progress in the disposal of problem assets (in billions of yen)Second half of fiscal 2002
Disposition by borrowers' liquidation 10.5 Re-constructive disposition 3.2
9.1 Loan sales to secondary market 46.0 Charge-off 29.4 Other 62.2
Collection of claims 48.0 Improvements in financial status 14.1
Total 160.6 (D)
Above (C) includes the following figures which facilitates the final disposal of problem loans. (in billions of yen)Second half of fiscal 2002
Legal liquidation 1.6 Quasi-legal liquidation
6.6
Total 8.2
(b) - (a)
Improvements in financial status due tore-constructive disposition
Claims to bankrupt and substantiallybankrupt debtors
(b) - (a)Claims to bankrupt and substantiallybankrupt debtors
Improvements in financial status due tore-constructive disposition
Partial charge-off of smaller balance loans
Entrust through the managed trust method to theResolution and Collection Corporation
Split-off of problem loansPartial charge-off of smaller balance loans
Entrust through the managed trust method to theResolution and Collection Corporation
Split-off of problem loans
31
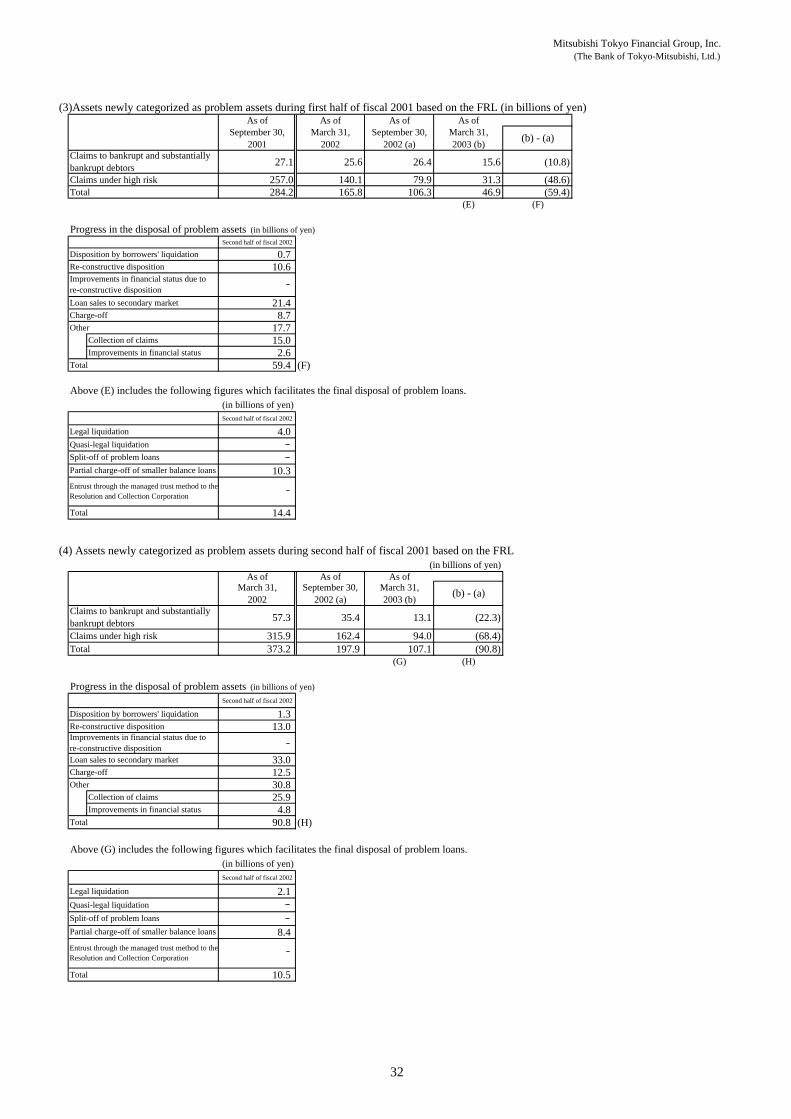
Mitsubishi Tokyo Financial Group, Inc.(The Bank of Tokyo-Mitsubishi, Ltd.)
(3)Assets newly categorized as problem assets during first half of fiscal 2001 based on the FRL (in billions of yen)As of As of As of As of
September 30, March 31, September 30, March 31,2001 2002 2002 (a) 2003 (b)
27.1 25.6 26.4 15.6 (10.8)
Claims under high risk 257.0 140.1 79.9 31.3 (48.6)Total 284.2 165.8 106.3 46.9 (59.4)
(E) (F)
Progress in the disposal of problem assets (in billions of yen)Second half of fiscal 2002
Disposition by borrowers' liquidation 0.7 Re-constructive disposition 10.6
Loan sales to secondary market 21.4 Charge-off 8.7 Other 17.7
Collection of claims 15.0 Improvements in financial status 2.6
Total 59.4 (F)
Above (E) includes the following figures which facilitates the final disposal of problem loans. (in billions of yen)Second half of fiscal 2002
Legal liquidation 4.0 Quasi-legal liquidation
10.3
Total 14.4
(4) Assets newly categorized as problem assets during second half of fiscal 2001 based on the FRL(in billions of yen)
As of As of As ofMarch 31, September 30, March 31,
2002 2002 (a) 2003 (b)
57.3 35.4 13.1 (22.3)
Claims under high risk 315.9 162.4 94.0 (68.4)Total 373.2 197.9 107.1 (90.8)
(G) (H)
Progress in the disposal of problem assets (in billions of yen)Second half of fiscal 2002
Disposition by borrowers' liquidation 1.3 Re-constructive disposition 13.0
Loan sales to secondary market 33.0 Charge-off 12.5 Other 30.8
Collection of claims 25.9 Improvements in financial status 4.8
Total 90.8 (H)
Above (G) includes the following figures which facilitates the final disposal of problem loans. (in billions of yen)Second half of fiscal 2002
Legal liquidation 2.1 Quasi-legal liquidation
8.4
Total 10.5
(b) - (a)
Entrust through the managed trust method to theResolution and Collection Corporation
Claims to bankrupt and substantiallybankrupt debtors
Improvements in financial status due tore-constructive disposition
Partial charge-off of smaller balance loans
Improvements in financial status due tore-constructive disposition
Claims to bankrupt and substantiallybankrupt debtors
Split-off of problem loans
(b) - (a)
Split-off of problem loansPartial charge-off of smaller balance loans
Entrust through the managed trust method to theResolution and Collection Corporation
32
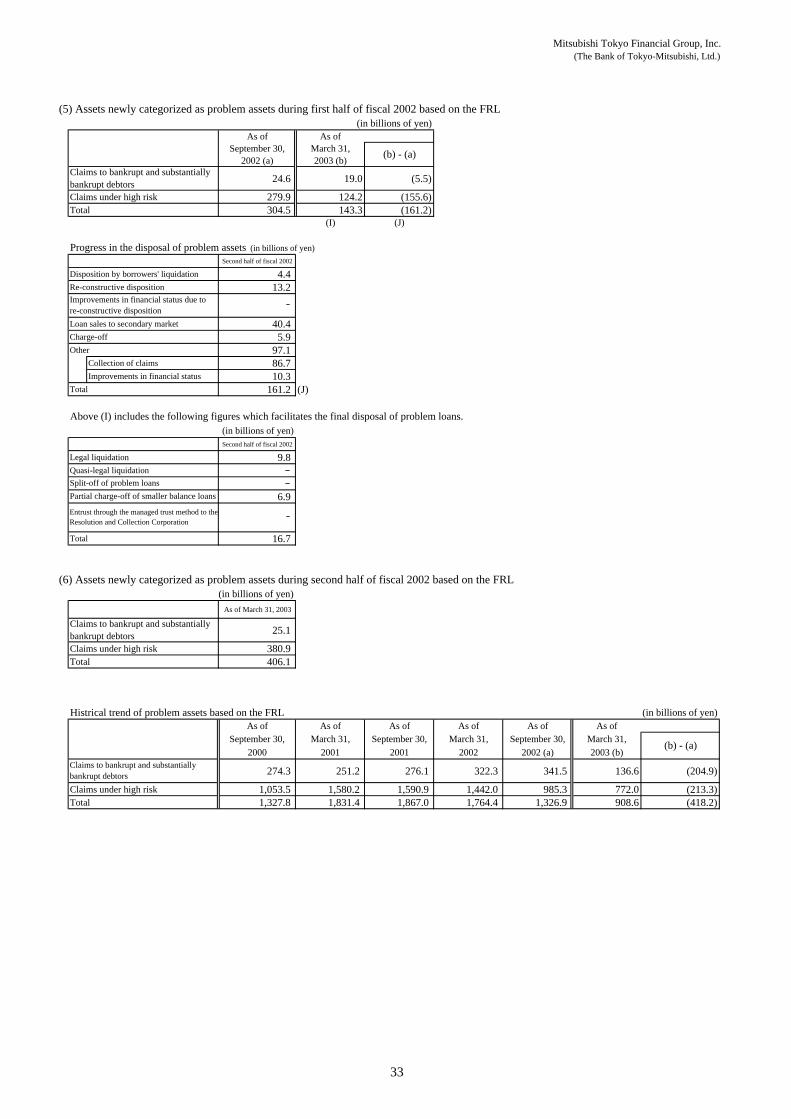
Mitsubishi Tokyo Financial Group, Inc.(The Bank of Tokyo-Mitsubishi, Ltd.)
(5) Assets newly categorized as problem assets during first half of fiscal 2002 based on the FRL(in billions of yen)
As of As ofSeptember 30, March 31,
2002 (a) 2003 (b)
24.6 19.0 (5.5)
Claims under high risk 279.9 124.2 (155.6)Total 304.5 143.3 (161.2)
(I) (J)
Progress in the disposal of problem assets (in billions of yen)Second half of fiscal 2002
Disposition by borrowers' liquidation 4.4 Re-constructive disposition 13.2
Loan sales to secondary market 40.4 Charge-off 5.9 Other 97.1
Collection of claims 86.7 Improvements in financial status 10.3
Total 161.2 (J)
Above (I) includes the following figures which facilitates the final disposal of problem loans. (in billions of yen)Second half of fiscal 2002
Legal liquidation 9.8 Quasi-legal liquidation
6.9
Total 16.7
(6) Assets newly categorized as problem assets during second half of fiscal 2002 based on the FRL(in billions of yen)
As of March 31, 2003
25.1
Claims under high risk 380.9 Total 406.1
Histrical trend of problem assets based on the FRL (in billions of yen)As of As of As of As of As of As of
September 30, March 31, September 30, March 31, September 30, March 31,2000 2001 2001 2002 2002 (a) 2003 (b)
274.3 251.2 276.1 322.3 341.5 136.6 (204.9)
Claims under high risk 1,053.5 1,580.2 1,590.9 1,442.0 985.3 772.0 (213.3)Total 1,327.8 1,831.4 1,867.0 1,764.4 1,326.9 908.6 (418.2)
(b) - (a)
Claims to bankrupt and substantiallybankrupt debtors
Claims to bankrupt and substantiallybankrupt debtors
Claims to bankrupt and substantiallybankrupt debtors
(b) - (a)
Split-off of problem loansPartial charge-off of smaller balance loans
Entrust through the managed trust method to theResolution and Collection Corporation
Improvements in financial status due tore-constructive disposition
33
Mitsubishi Tokyo Financial Group, Inc.(The Bank of Tokyo-Mitsubishi, Ltd.)
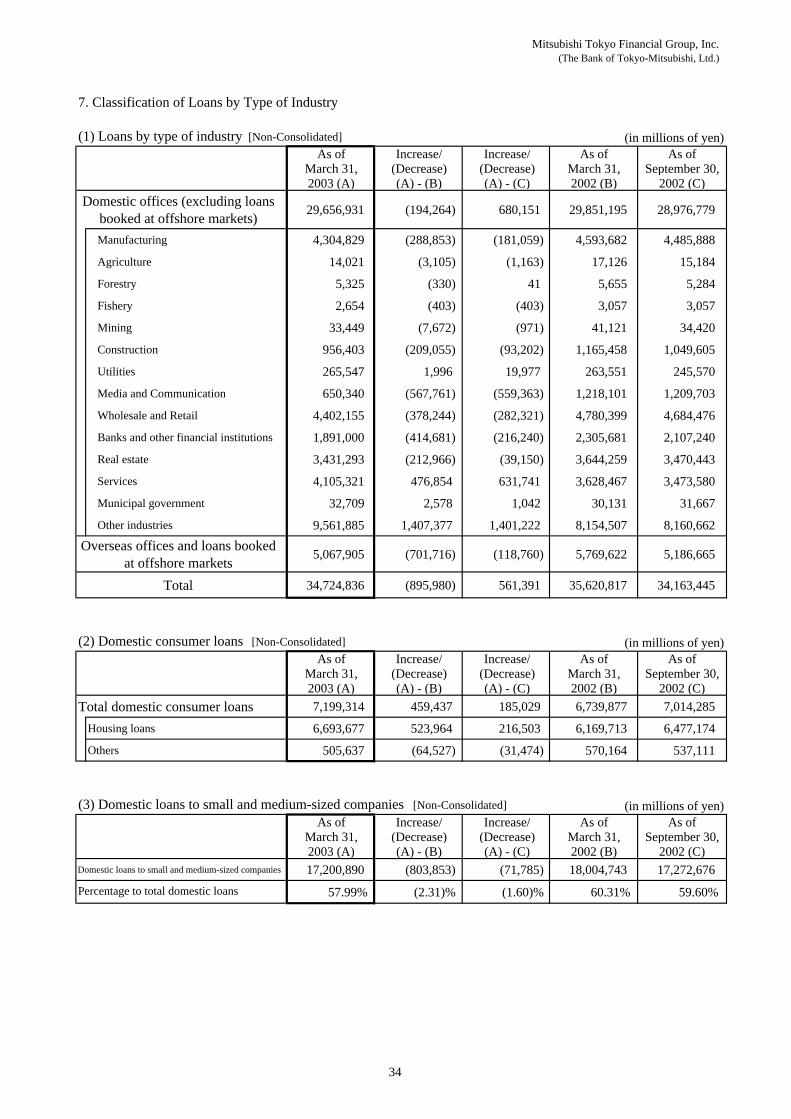
7. Classification of Loans by Type of Industry
(1) Loans by type of industry [Non-Consolidated] (in millions of yen)As of Increase/ Increase/ As of As of
March 31, (Decrease) (Decrease) March 31, September 30,2003 (A) (A) - (B) (A) - (C) 2002 (B) 2002 (C)
Domestic offices (excluding loansbooked at offshore markets) 29,656,931 (194,264) 680,151 29,851,195 28,976,779
Manufacturing 4,304,829 (288,853) (181,059) 4,593,682 4,485,888
Agriculture 14,021 (3,105) (1,163) 17,126 15,184
Forestry 5,325 (330) 41 5,655 5,284
Fishery 2,654 (403) (403) 3,057 3,057
Mining 33,449 (7,672) (971) 41,121 34,420
Construction 956,403 (209,055) (93,202) 1,165,458 1,049,605
Utilities 265,547 1,996 19,977 263,551 245,570
Media and Communication 650,340 (567,761) (559,363) 1,218,101 1,209,703
Wholesale and Retail 4,402,155 (378,244) (282,321) 4,780,399 4,684,476
Banks and other financial institutions 1,891,000 (414,681) (216,240) 2,305,681 2,107,240
Real estate 3,431,293 (212,966) (39,150) 3,644,259 3,470,443
Services 4,105,321 476,854 631,741 3,628,467 3,473,580
Municipal government 32,709 2,578 1,042 30,131 31,667
Other industries 9,561,885 1,407,377 1,401,222 8,154,507 8,160,662 Overseas offices and loans booked
at offshore markets 5,067,905 (701,716) (118,760) 5,769,622 5,186,665
Total 34,724,836 (895,980) 561,391 35,620,817 34,163,445
(2) Domestic consumer loans [Non-Consolidated] (in millions of yen)As of Increase/ Increase/ As of As of
March 31, (Decrease) (Decrease) March 31, September 30,2003 (A) (A) - (B) (A) - (C) 2002 (B) 2002 (C)
Total domestic consumer loans 7,199,314 459,437 185,029 6,739,877 7,014,285
Housing loans 6,693,677 523,964 216,503 6,169,713 6,477,174
Others 505,637 (64,527) (31,474) 570,164 537,111
(3) Domestic loans to small and medium-sized companies [Non-Consolidated] (in millions of yen)As of Increase/ Increase/ As of As of
March 31, (Decrease) (Decrease) March 31, September 30,2003 (A) (A) - (B) (A) - (C) 2002 (B) 2002 (C)
Domestic loans to small and medium-sized companies 17,200,890 (803,853) (71,785) 18,004,743 17,272,676
57.99% (2.31)% (1.60)% 60.31% 59.60%Percentage to total domestic loans
34
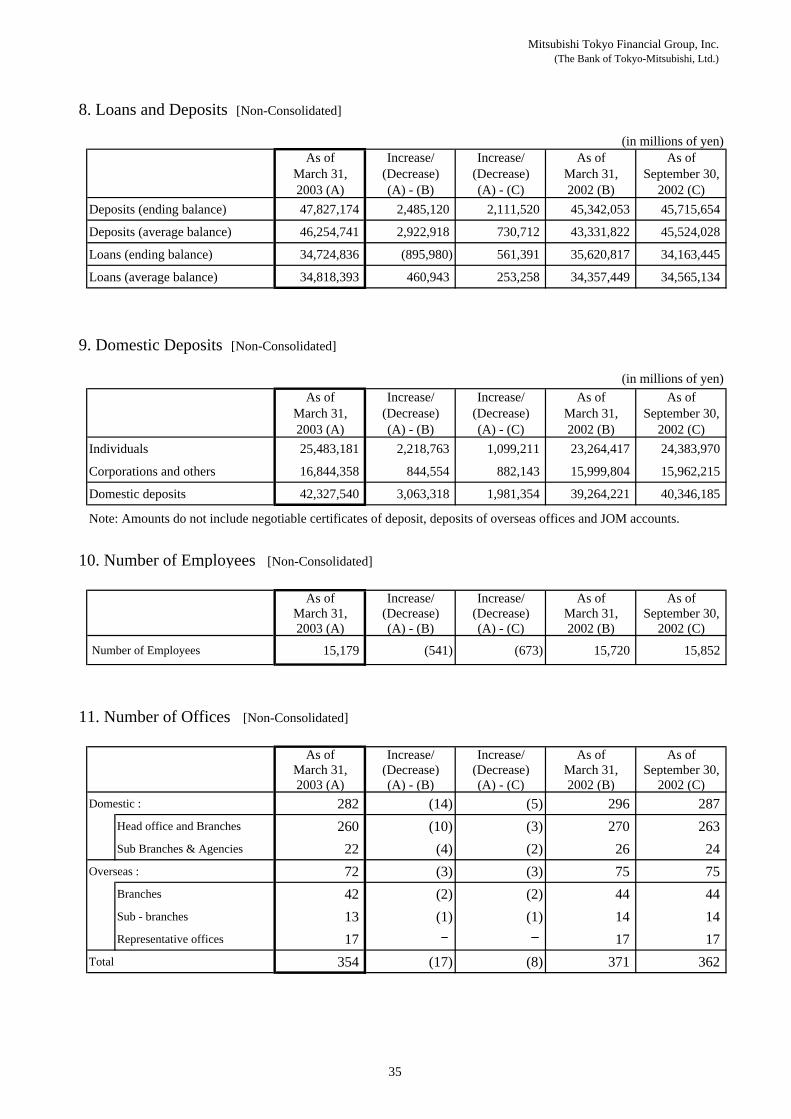
Mitsubishi Tokyo Financial Group, Inc.(The Bank of Tokyo-Mitsubishi, Ltd.)
8. Loans and Deposits [Non-Consolidated]
(in millions of yen)As of Increase/ Increase/ As of As of
March 31, (Decrease) (Decrease) March 31, September 30,2003 (A) (A) - (B) (A) - (C) 2002 (B) 2002 (C)
Deposits (ending balance) 47,827,174 2,485,120 2,111,520 45,342,053 45,715,654
Deposits (average balance) 46,254,741 2,922,918 730,712 43,331,822 45,524,028
Loans (ending balance) 34,724,836 (895,980) 561,391 35,620,817 34,163,445
Loans (average balance) 34,818,393 460,943 253,258 34,357,449 34,565,134
9. Domestic Deposits [Non-Consolidated]
(in millions of yen)As of Increase/ Increase/ As of As of
March 31, (Decrease) (Decrease) March 31, September 30,2003 (A) (A) - (B) (A) - (C) 2002 (B) 2002 (C)
Individuals 25,483,181 2,218,763 1,099,211 23,264,417 24,383,970
Corporations and others 16,844,358 844,554 882,143 15,999,804 15,962,215
Domestic deposits 42,327,540 3,063,318 1,981,354 39,264,221 40,346,185
Note: Amounts do not include negotiable certificates of deposit, deposits of overseas offices and JOM accounts.
10. Number of Employees [Non-Consolidated]
As of Increase/ Increase/ As of As ofMarch 31, (Decrease) (Decrease) March 31, September 30,2003 (A) (A) - (B) (A) - (C) 2002 (B) 2002 (C)
Number of Employees 15,179 (541) (673) 15,720 15,852
11. Number of Offices [Non-Consolidated]
As of Increase/ Increase/ As of As ofMarch 31, (Decrease) (Decrease) March 31, September 30,2003 (A) (A) - (B) (A) - (C) 2002 (B) 2002 (C)
Domestic : 282 (14) (5) 296 287 Head office and Branches 260 (10) (3) 270 263 Sub Branches & Agencies 22 (4) (2) 26 24
Overseas : 72 (3) (3) 75 75 Branches 42 (2) (2) 44 44 Sub - branches 13 (1) (1) 14 14 Representative offices 17 17 17
Total 354 (17) (8) 371 362
35
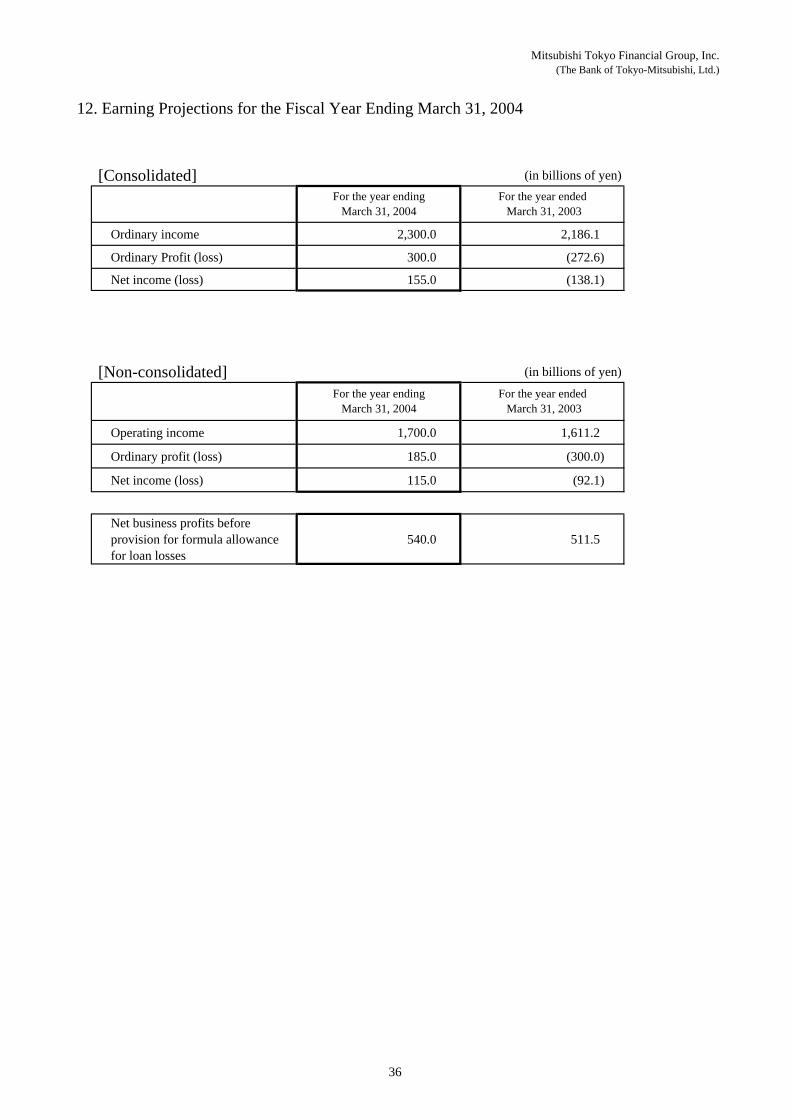
Mitsubishi Tokyo Financial Group, Inc.(The Bank of Tokyo-Mitsubishi, Ltd.)
[Consolidated] (in billions of yen)
Ordinary income 2,300.0 2,186.1
Ordinary Profit (loss) 300.0 (272.6)
Net income (loss) 155.0 (138.1)
[Non-consolidated] (in billions of yen)
Operating income 1,700.0 1,611.2
Ordinary profit (loss) 185.0 (300.0)
Net income (loss) 115.0 (92.1)
Net business profits beforeprovision for formula allowancefor loan losses
540.0 511.5
For the year endingMarch 31, 2004
For the year ended March 31, 2003
12. Earning Projections for the Fiscal Year Ending March 31, 2004
For the year endingMarch 31, 2004
For the year ended March 31, 2003
36
The Mitsubishi Trust and Banking Corporation
Selected Financial Informationunder Japanese GAAP
For the Fiscal Year Ended March 31, 2003
Mitsubishi Tokyo Financial Group, Inc.(The Mitsubishi Trust and Banking Corporation)
1 Financial Highlights under Japanese GAAP for the Fiscal Year Ended March 31, 2003
1. Consolidated Balance Sheets ------------ 372. Consolidated Statements of Operations ------------ 383. Consolidated Statement of Capital Surplus and Retained Earnings ------------ 394. Notional principal or contract amount, market value and valuation gains (losses) on derivatives ------------ 40
[Consolidated]
5. Comparison of Statement of Trust Assets and Liabilities [Trust], [Non-Consolidated] ------------ 436. Financial Results [Consolidated], [Non-Consolidated]------------ 467. Average interest rate spread [Non-Consolidated] ------------ 488. Valuation Differences on Securities [Consolidated], [Trust] ------------ 489. Risk-Adjusted Capital Ratio Based on the Standards of the BIS [Consolidated] ------------ 49
2 Loan Portfolio and Other
1. Risk-Monitored Loans [Consolidated], [Non-Consolidated], [Trust] ------------ 50 [Consolidated and Trust], [Non-Consolidated and Trust]
2. Allowance for Loan Losses [Consolidated], [Non-Consolidated], [Trust] ------------ 533. Coverage Ratio against Risk-Monitored Loans [Consolidated], [Non-Consolidated]------------ 534. Disclosed Claims under the Financial Reconstruction Law(the"FRL") [Non-Consolidated], [Trust] ------------ 54
[Non-Consolidated and Trust]
5. Status of Secured Coverage on Disclosed Claims under the FRL [Non-Consolidated], [Trust] ------------ 55[Non-Consolidated and Trust]
6. Progress in the Disposal of Problem Assets [Non-Consolidated and Trust] ------------ 577. Classification of Loans by Type of Industry [Non-Consolidated], [Trust] ------------ 60
[Non-Consolidated and Trust]
8. Loans and Deposits [Non-Consolidated] ------------ 639. Domestic Deposits [Non-Consolidated] ------------ 6310. Number of Employees [Non-Consolidated] ------------ 6311. Number of Offices [Non-Consolidated] ------------ 6312. Earning Projections for the Fiscal Year ending March 31, 2004 [Consolidated], [Non-Consolidated]------------ 64
[Contents]
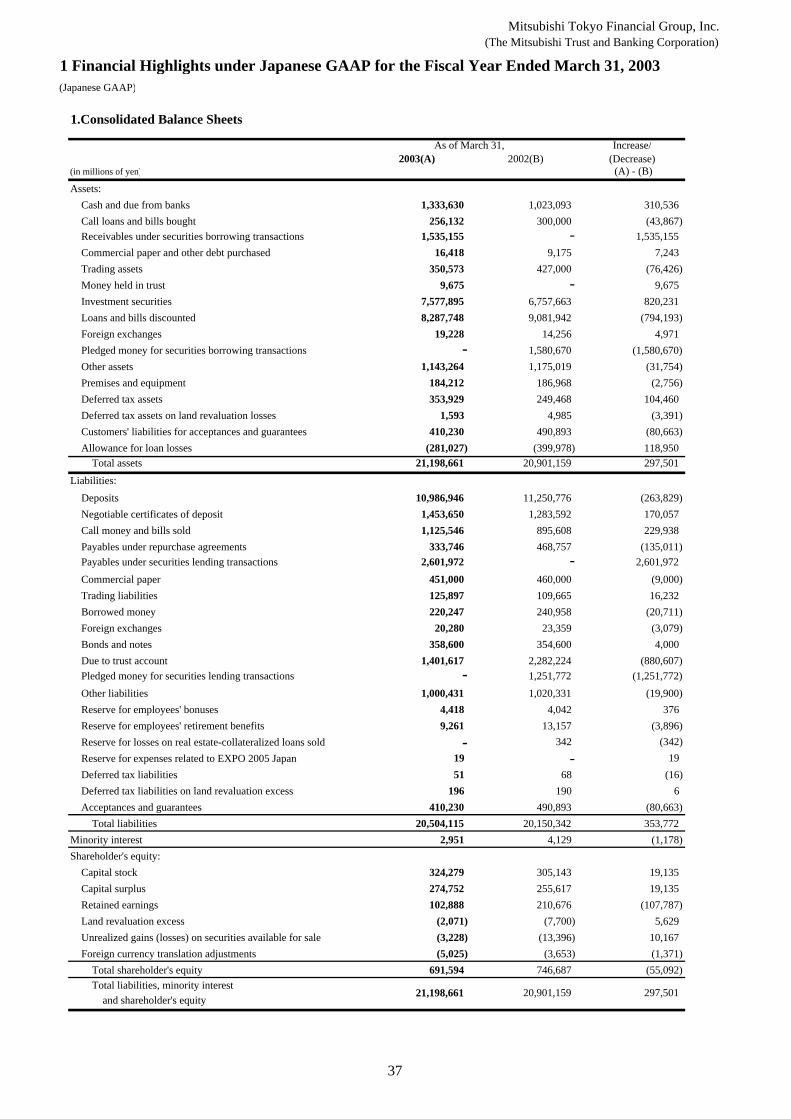
Mitsubishi Tokyo Financial Group, Inc.(The Mitsubishi Trust and Banking Corporation)
1 Financial Highlights under Japanese GAAP for the Fiscal Year Ended March 31, 2003(Japanese GAAP)
1.Consolidated Balance Sheets
Increase/2003(A) 2002(B) (Decrease)
(in millions of yen) (A) - (B)Assets:
Cash and due from banks 1,333,630 1,023,093 310,536Call loans and bills bought 256,132 300,000 (43,867)Receivables under securities borrowing transactions 1,535,155 - 1,535,155Commercial paper and other debt purchased 16,418 9,175 7,243Trading assets 350,573 427,000 (76,426)Money held in trust 9,675 - 9,675Investment securities 7,577,895 6,757,663 820,231Loans and bills discounted 8,287,748 9,081,942 (794,193)Foreign exchanges 19,228 14,256 4,971Pledged money for securities borrowing transactions - 1,580,670 (1,580,670)Other assets 1,143,264 1,175,019 (31,754)Premises and equipment 184,212 186,968 (2,756)Deferred tax assets 353,929 249,468 104,460Deferred tax assets on land revaluation losses 1,593 4,985 (3,391)Customers' liabilities for acceptances and guarantees 410,230 490,893 (80,663)Allowance for loan losses (281,027) (399,978) 118,950 Total assets 21,198,661 20,901,159 297,501
Liabilities:Deposits 10,986,946 11,250,776 (263,829)Negotiable certificates of deposit 1,453,650 1,283,592 170,057Call money and bills sold 1,125,546 895,608 229,938Payables under repurchase agreements 333,746 468,757 (135,011)Payables under securities lending transactions 2,601,972 - 2,601,972Commercial paper 451,000 460,000 (9,000)Trading liabilities 125,897 109,665 16,232Borrowed money 220,247 240,958 (20,711)Foreign exchanges 20,280 23,359 (3,079)Bonds and notes 358,600 354,600 4,000Due to trust account 1,401,617 2,282,224 (880,607)Pledged money for securities lending transactions - 1,251,772 (1,251,772)Other liabilities 1,000,431 1,020,331 (19,900)Reserve for employees' bonuses 4,418 4,042 376Reserve for employees' retirement benefits 9,261 13,157 (3,896)Reserve for losses on real estate-collateralized loans sold - 342 (342)Reserve for expenses related to EXPO 2005 Japan 19 - 19Deferred tax liabilities 51 68 (16)Deferred tax liabilities on land revaluation excess 196 190 6Acceptances and guarantees 410,230 490,893 (80,663) Total liabilities 20,504,115 20,150,342 353,772
Minority interest 2,951 4,129 (1,178)Shareholder's equity:
Capital stock 324,279 305,143 19,135Capital surplus 274,752 255,617 19,135Retained earnings 102,888 210,676 (107,787)Land revaluation excess (2,071) (7,700) 5,629Unrealized gains (losses) on securities available for sale (3,228) (13,396) 10,167Foreign currency translation adjustments (5,025) (3,653) (1,371) Total shareholder's equity 691,594 746,687 (55,092) Total liabilities, minority interest and shareholder's equity
As of March 31,
21,198,661 20,901,159 297,501
37
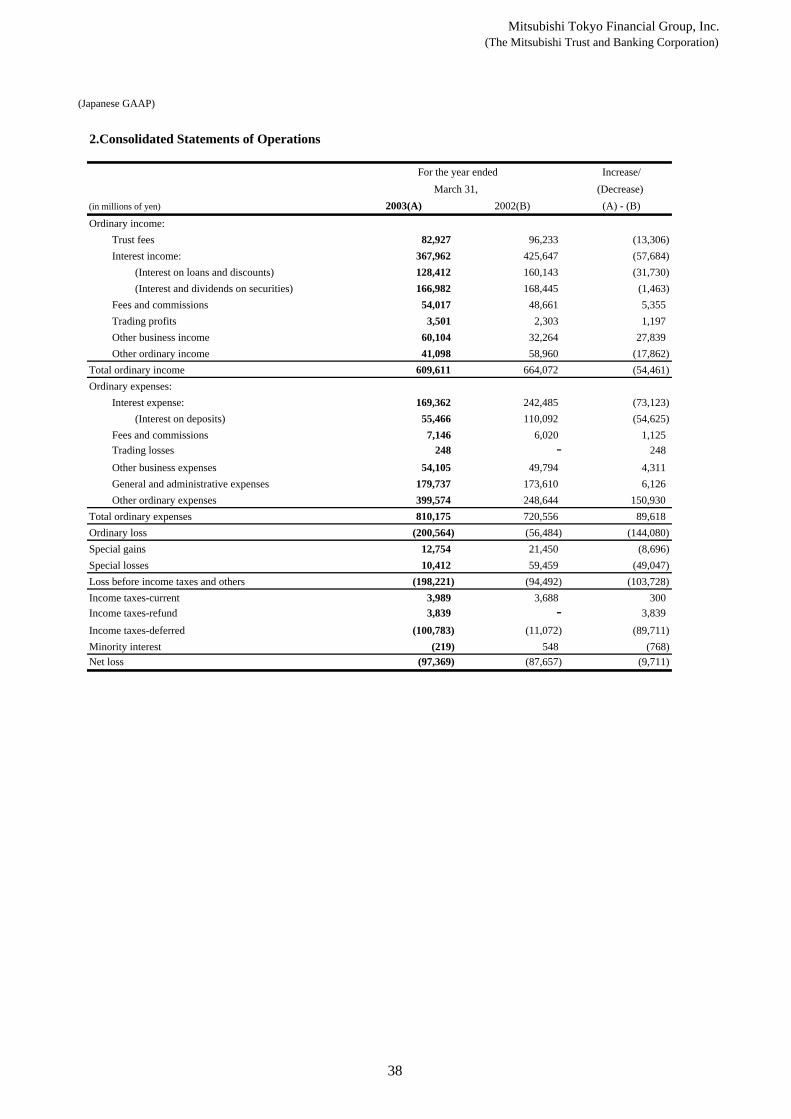
Mitsubishi Tokyo Financial Group, Inc.(The Mitsubishi Trust and Banking Corporation)
(Japanese GAAP)
2.Consolidated Statements of Operations
Increase/ (Decrease)
(in millions of yen) 2003(A) 2002(B) (A) - (B)Ordinary income:
Trust fees 82,927 96,233 (13,306)Interest income: 367,962 425,647 (57,684)
(Interest on loans and discounts) 128,412 160,143 (31,730)(Interest and dividends on securities) 166,982 168,445 (1,463)
Fees and commissions 54,017 48,661 5,355Trading profits 3,501 2,303 1,197Other business income 60,104 32,264 27,839Other ordinary income 41,098 58,960 (17,862)
Total ordinary income 609,611 664,072 (54,461)Ordinary expenses:
Interest expense: 169,362 242,485 (73,123)(Interest on deposits) 55,466 110,092 (54,625)
Fees and commissions 7,146 6,020 1,125Trading losses 248 - 248Other business expenses 54,105 49,794 4,311General and administrative expenses 179,737 173,610 6,126Other ordinary expenses 399,574 248,644 150,930
Total ordinary expenses 810,175 720,556 89,618Ordinary loss (200,564) (56,484) (144,080)Special gains 12,754 21,450 (8,696)Special losses 10,412 59,459 (49,047)Loss before income taxes and others (198,221) (94,492) (103,728)Income taxes-current 3,989 3,688 300Income taxes-refund 3,839 - 3,839Income taxes-deferred (100,783) (11,072) (89,711)Minority interest (219) 548 (768)Net loss (97,369) (87,657) (9,711)
March 31, For the year ended
38
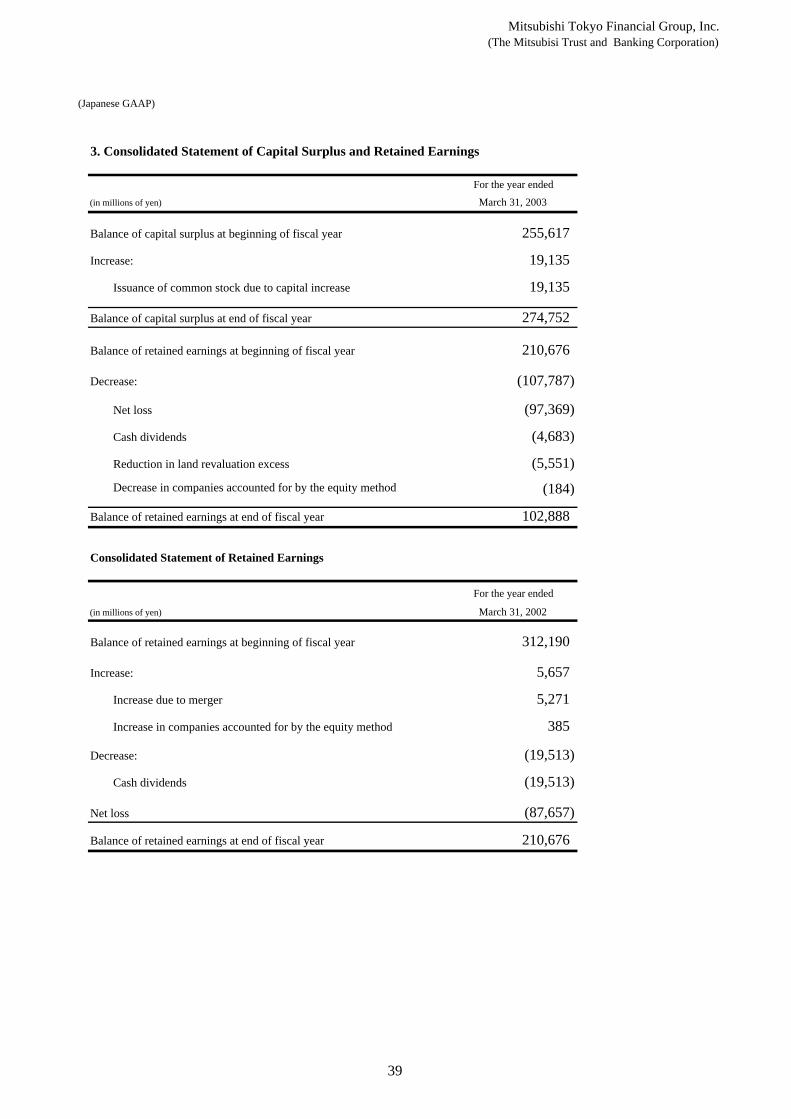
Mitsubishi Tokyo Financial Group, Inc.(The Mitsubisi Trust and Banking Corporation)
(Japanese GAAP)
3. Consolidated Statement of Capital Surplus and Retained Earnings
(in millions of yen)
Balance of capital surplus at beginning of fiscal year 255,617
Increase: 19,135
Issuance of common stock due to capital increase 19,135
Balance of capital surplus at end of fiscal year 274,752
Balance of retained earnings at beginning of fiscal year 210,676
Decrease: (107,787)
Net loss (97,369)
Cash dividends (4,683)
Reduction in land revaluation excess (5,551)Decrease in companies accounted for by the equity method (184)
Balance of retained earnings at end of fiscal year 102,888
Consolidated Statement of Retained Earnings
(in millions of yen)
Balance of retained earnings at beginning of fiscal year 312,190
Increase: 5,657
Increase due to merger 5,271
Increase in companies accounted for by the equity method 385
Decrease: (19,513)
Cash dividends (19,513)
Net loss (87,657)
Balance of retained earnings at end of fiscal year 210,676
For the year ended
March 31, 2002
For the year ended
March 31, 2003
39
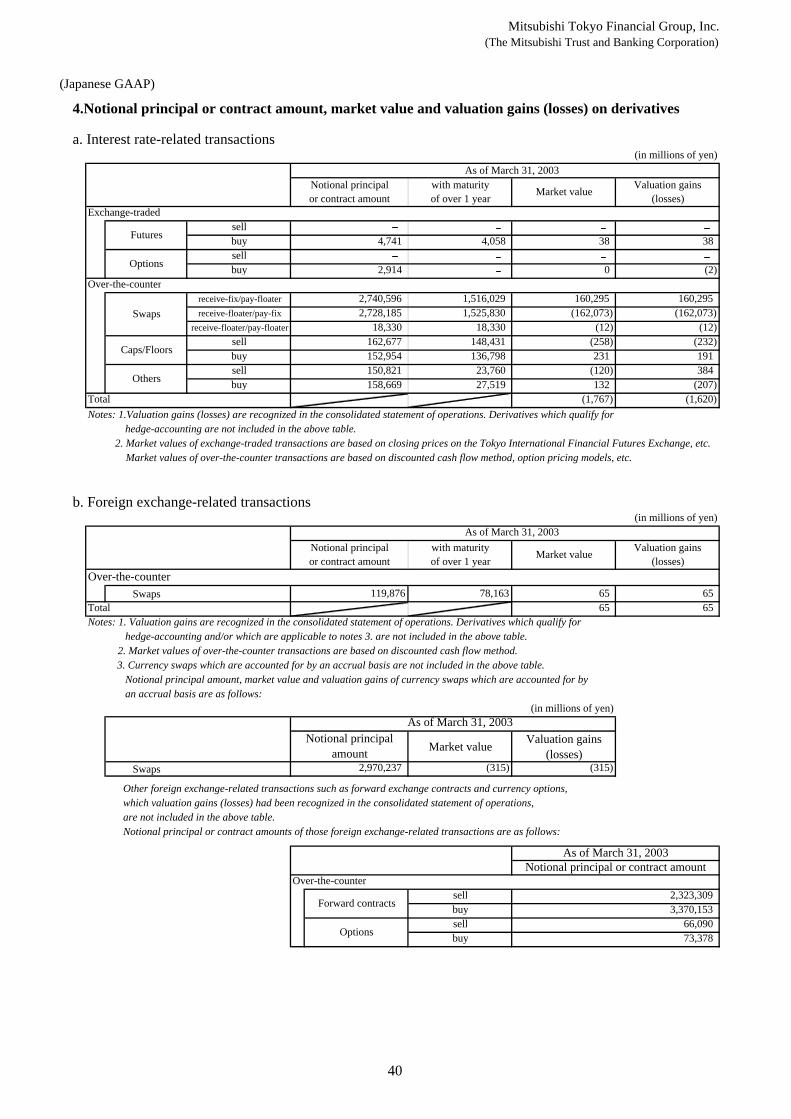
Mitsubishi Tokyo Financial Group, Inc.(The Mitsubishi Trust and Banking Corporation)
(Japanese GAAP)
4.Notional principal or contract amount, market value and valuation gains (losses) on derivatives
a. Interest rate-related transactions(in millions of yen)
Exchange-tradedsellbuy 4,741 4,058 38 38sellbuy 2,914 0 (2)
Over-the-counterreceive-fix/pay-floater 2,740,596 1,516,029 160,295 160,295receive-floater/pay-fix 2,728,185 1,525,830 (162,073) (162,073)
receive-floater/pay-floater 18,330 18,330 (12) (12)sell 162,677 148,431 (258) (232)buy 152,954 136,798 231 191sell 150,821 23,760 (120) 384buy 158,669 27,519 132 (207)
Total (1,767) (1,620)Notes: 1.Valuation gains (losses) are recognized in the consolidated statement of operations. Derivatives which qualify for hedge-accounting are not included in the above table.
2. Market values of exchange-traded transactions are based on closing prices on the Tokyo International Financial Futures Exchange, etc. Market values of over-the-counter transactions are based on discounted cash flow method, option pricing models, etc.
b. Foreign exchange-related transactions(in millions of yen)
Over-the-counterSwaps 119,876 78,163 65 65
Total 65 65Notes: 1. Valuation gains are recognized in the consolidated statement of operations. Derivatives which qualify for hedge-accounting and/or which are applicable to notes 3. are not included in the above table.
2. Market values of over-the-counter transactions are based on discounted cash flow method. 3. Currency swaps which are accounted for by an accrual basis are not included in the above table. Notional principal amount, market value and valuation gains of currency swaps which are accounted for by an accrual basis are as follows:
(in millions of yen)
Market value Valuation gains(losses)
Swaps 2,970,237 (315) (315)
Other foreign exchange-related transactions such as forward exchange contracts and currency options, which valuation gains (losses) had been recognized in the consolidated statement of operations, are not included in the above table. Notional principal or contract amounts of those foreign exchange-related transactions are as follows:
Over-the-countersell 2,323,309buy 3,370,153sell 66,090buy 73,378
As of March 31, 2003
Market value Valuation gains(losses)
Notional principalor contract amount
with maturityof over 1 year
Notional principalor contract amount
Futures
Options
Swaps
As of March 31, 2003with maturityof over 1 year Market value Valuation gains
(losses)
Caps/Floors
Others
Options
As of March 31, 2003
Forward contracts
Notional principal or contract amount
Notional principalamount
As of March 31, 2003
40
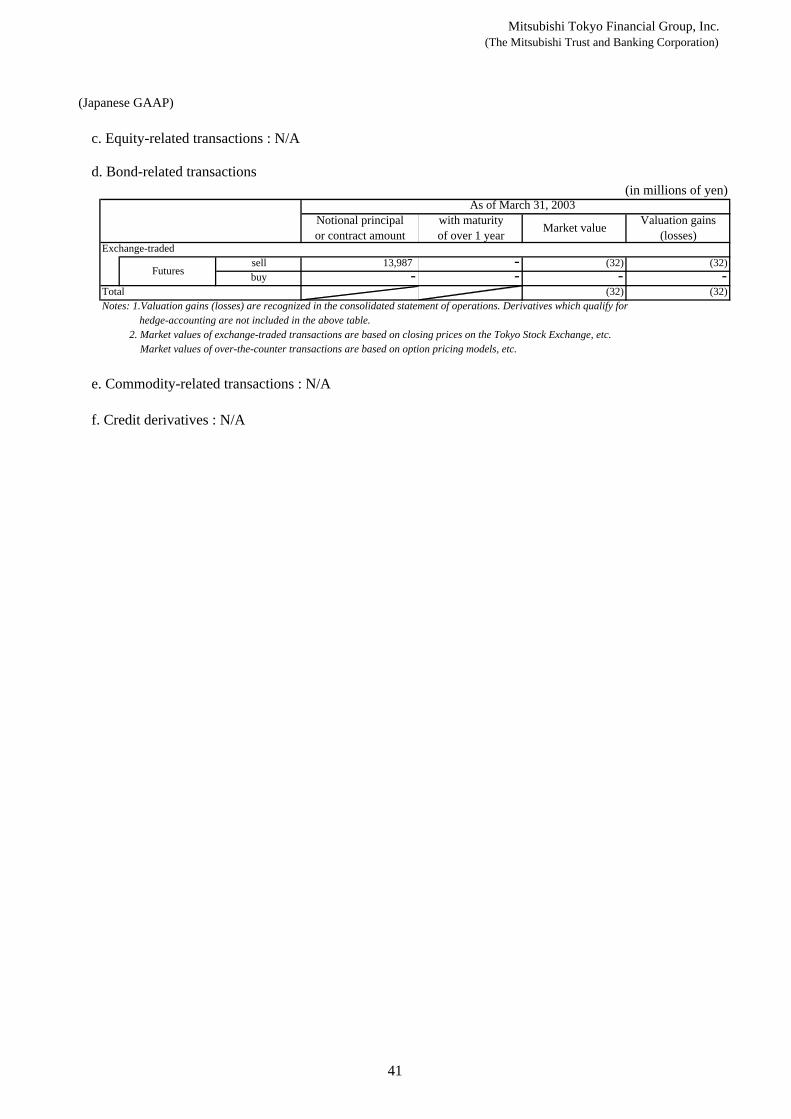
Mitsubishi Tokyo Financial Group, Inc.(The Mitsubishi Trust and Banking Corporation)
(Japanese GAAP)
c. Equity-related transactions : N/A
d. Bond-related transactions(in millions of yen)
Exchange-tradedsell 13,987 - (32) (32)buy - - - -
Total (32) (32)Notes: 1.Valuation gains (losses) are recognized in the consolidated statement of operations. Derivatives which qualify for hedge-accounting are not included in the above table.
2. Market values of exchange-traded transactions are based on closing prices on the Tokyo Stock Exchange, etc. Market values of over-the-counter transactions are based on option pricing models, etc.
e. Commodity-related transactions : N/A
f. Credit derivatives : N/A
Futures
As of March 31, 2003with maturityof over 1 year
Notional principalor contract amount Market value Valuation gains
(losses)
41
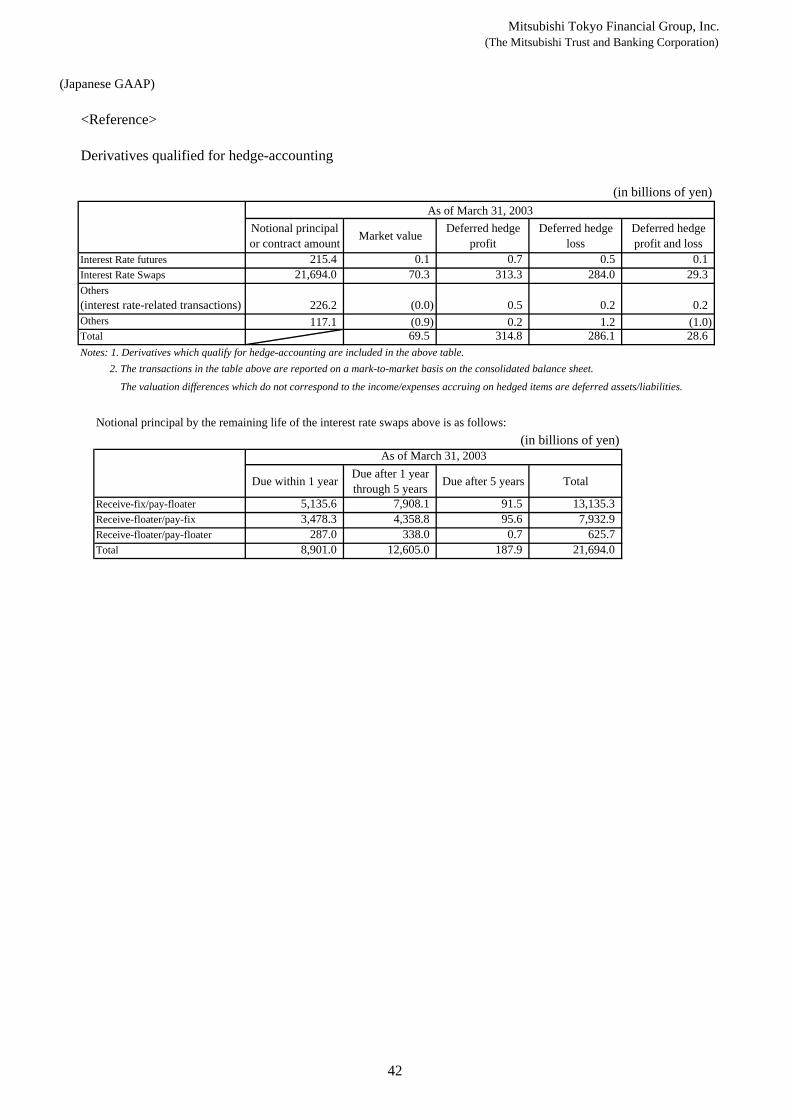
Mitsubishi Tokyo Financial Group, Inc.(The Mitsubishi Trust and Banking Corporation)
(Japanese GAAP)
<Reference>
Derivatives qualified for hedge-accounting
(in billions of yen)
Notional principalor contract amount Market value Deferred hedge
profitDeferred hedge
lossDeferred hedgeprofit and loss
Interest Rate futures 215.4 0.1 0.7 0.5 0.1Interest Rate Swaps 21,694.0 70.3 313.3 284.0 29.3
226.2 (0.0) 0.5 0.2 0.2117.1 (0.9) 0.2 1.2 (1.0)
Total 69.5 314.8 286.1 28.6Notes: 1. Derivatives which qualify for hedge-accounting are included in the above table. 2. The transactions in the table above are reported on a mark-to-market basis on the consolidated balance sheet.
The valuation differences which do not correspond to the income/expenses accruing on hedged items are deferred assets/liabilities.
Notional principal by the remaining life of the interest rate swaps above is as follows:(in billions of yen)
Due within 1 year Due after 1 yearthrough 5 years Due after 5 years Total
Receive-fix/pay-floater 5,135.6 7,908.1 91.5 13,135.3Receive-floater/pay-fix 3,478.3 4,358.8 95.6 7,932.9Receive-floater/pay-floater 287.0 338.0 0.7 625.7Total 8,901.0 12,605.0 187.9 21,694.0
As of March 31, 2003
As of March 31, 2003
Others(interest rate-related transactions)Others
42
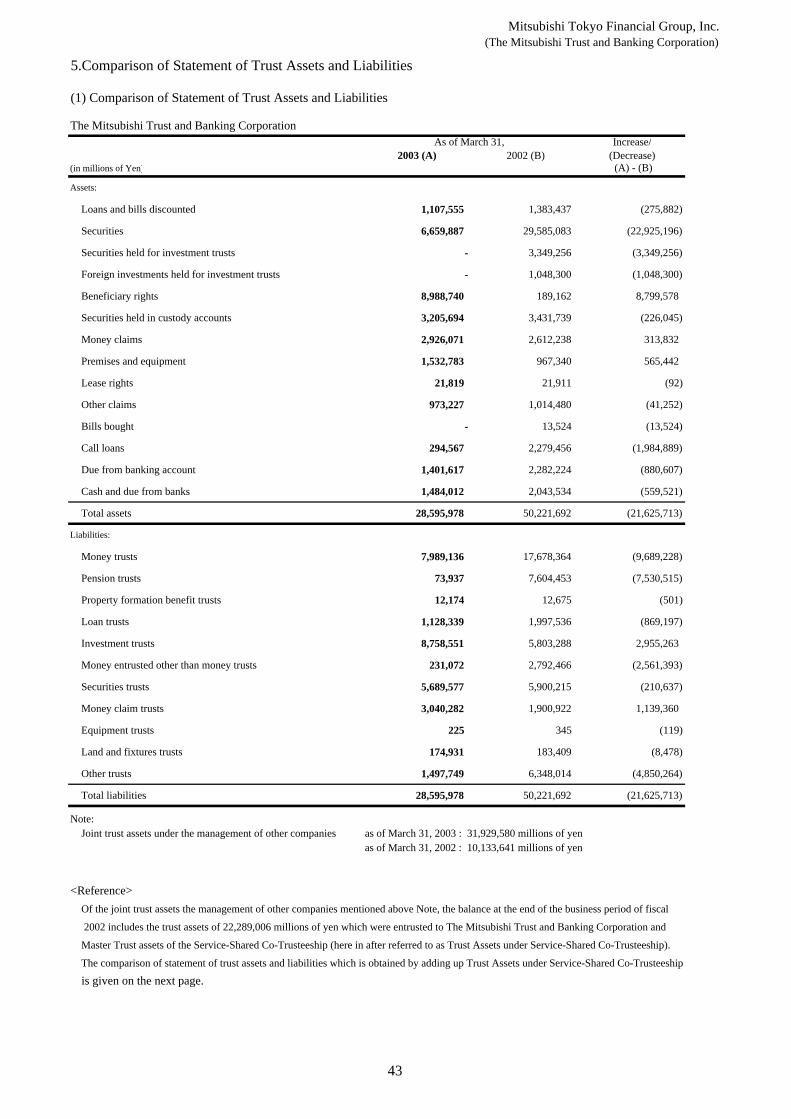
Mitsubishi Tokyo Financial Group, Inc.(The Mitsubishi Trust and Banking Corporation)
5.Comparison of Statement of Trust Assets and Liabilities
(1) Comparison of Statement of Trust Assets and Liabilities
The Mitsubishi Trust and Banking CorporationIncrease/
2003 (A) 2002 (B) (Decrease)(in millions of Yen) (A) - (B)
Assets:
Loans and bills discounted 1,107,555 1,383,437 (275,882)
Securities 6,659,887 29,585,083 (22,925,196)
Securities held for investment trusts - 3,349,256 (3,349,256)
Foreign investments held for investment trusts - 1,048,300 (1,048,300)
Beneficiary rights 8,988,740 189,162 8,799,578
Securities held in custody accounts 3,205,694 3,431,739 (226,045)
Money claims 2,926,071 2,612,238 313,832
Premises and equipment 1,532,783 967,340 565,442
Lease rights 21,819 21,911 (92)
Other claims 973,227 1,014,480 (41,252)
Bills bought - 13,524 (13,524)
Call loans 294,567 2,279,456 (1,984,889)
Due from banking account 1,401,617 2,282,224 (880,607)
Cash and due from banks 1,484,012 2,043,534 (559,521)
Total assets 28,595,978 50,221,692 (21,625,713)
Liabilities:
Money trusts 7,989,136 17,678,364 (9,689,228)
Pension trusts 73,937 7,604,453 (7,530,515)
Property formation benefit trusts 12,174 12,675 (501)
Loan trusts 1,128,339 1,997,536 (869,197)
Investment trusts 8,758,551 5,803,288 2,955,263
Money entrusted other than money trusts 231,072 2,792,466 (2,561,393)
Securities trusts 5,689,577 5,900,215 (210,637)
Money claim trusts 3,040,282 1,900,922 1,139,360
Equipment trusts 225 345 (119)
Land and fixtures trusts 174,931 183,409 (8,478)
Other trusts 1,497,749 6,348,014 (4,850,264)
Total liabilities 28,595,978 50,221,692 (21,625,713)
Note:Joint trust assets under the management of other companies as of March 31, 2003 : 31,929,580 millions of yen
as of March 31, 2002 : 10,133,641 millions of yen
<Reference>Of the joint trust assets the management of other companies mentioned above Note, the balance at the end of the business period of fiscal
2002 includes the trust assets of 22,289,006 millions of yen which were entrusted to The Mitsubishi Trust and Banking Corporation and
Master Trust assets of the Service-Shared Co-Trusteeship (here in after referred to as Trust Assets under Service-Shared Co-Trusteeship).
The comparison of statement of trust assets and liabilities which is obtained by adding up Trust Assets under Service-Shared Co-Trusteeship
is given on the next page.
As of March 31,
43
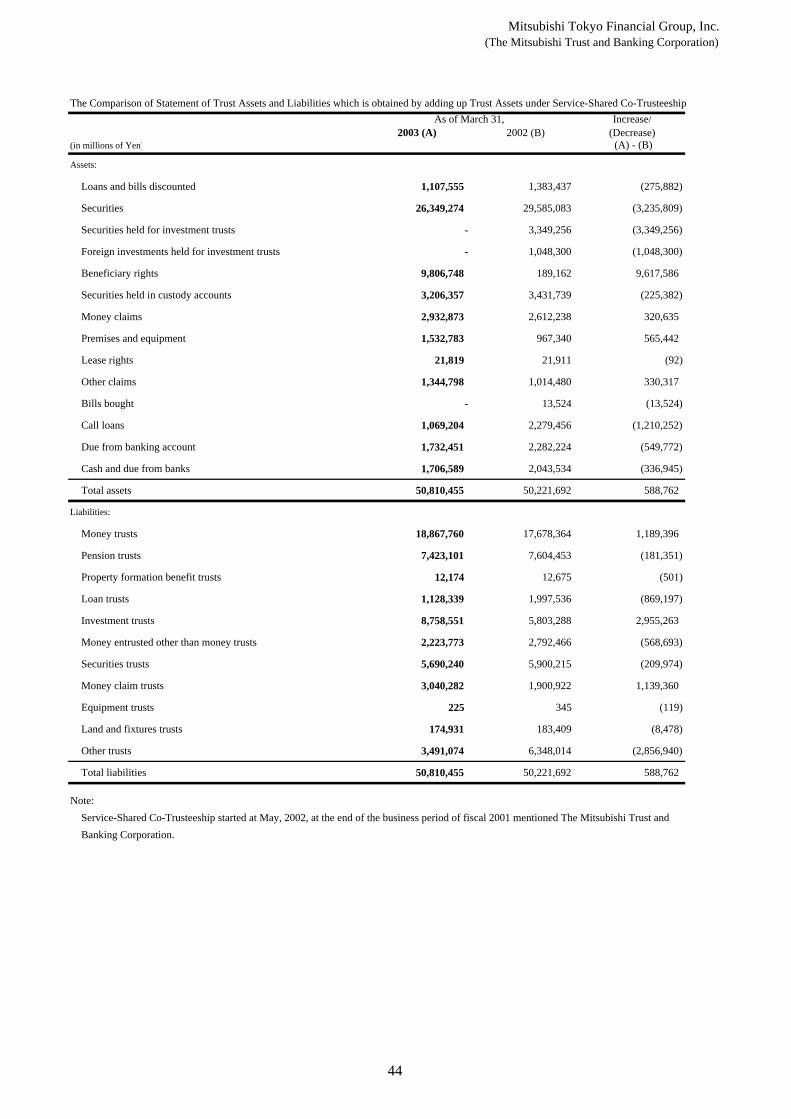
Mitsubishi Tokyo Financial Group, Inc.(The Mitsubishi Trust and Banking Corporation)
The Comparison of Statement of Trust Assets and Liabilities which is obtained by adding up Trust Assets under Service-Shared Co-TrusteeshipIncrease/
2003 (A) 2002 (B) (Decrease)(in millions of Yen) (A) - (B)
Assets:
Loans and bills discounted 1,107,555 1,383,437 (275,882)
Securities 26,349,274 29,585,083 (3,235,809)
Securities held for investment trusts - 3,349,256 (3,349,256)
Foreign investments held for investment trusts - 1,048,300 (1,048,300)
Beneficiary rights 9,806,748 189,162 9,617,586
Securities held in custody accounts 3,206,357 3,431,739 (225,382)
Money claims 2,932,873 2,612,238 320,635
Premises and equipment 1,532,783 967,340 565,442
Lease rights 21,819 21,911 (92)
Other claims 1,344,798 1,014,480 330,317
Bills bought - 13,524 (13,524)
Call loans 1,069,204 2,279,456 (1,210,252)
Due from banking account 1,732,451 2,282,224 (549,772)
Cash and due from banks 1,706,589 2,043,534 (336,945)
Total assets 50,810,455 50,221,692 588,762
Liabilities:
Money trusts 18,867,760 17,678,364 1,189,396
Pension trusts 7,423,101 7,604,453 (181,351)
Property formation benefit trusts 12,174 12,675 (501)
Loan trusts 1,128,339 1,997,536 (869,197)
Investment trusts 8,758,551 5,803,288 2,955,263
Money entrusted other than money trusts 2,223,773 2,792,466 (568,693)
Securities trusts 5,690,240 5,900,215 (209,974)
Money claim trusts 3,040,282 1,900,922 1,139,360
Equipment trusts 225 345 (119)
Land and fixtures trusts 174,931 183,409 (8,478)
Other trusts 3,491,074 6,348,014 (2,856,940)
Total liabilities 50,810,455 50,221,692 588,762
Note:Service-Shared Co-Trusteeship started at May, 2002, at the end of the business period of fiscal 2001 mentioned The Mitsubishi Trust and Banking Corporation.
As of March 31,
44
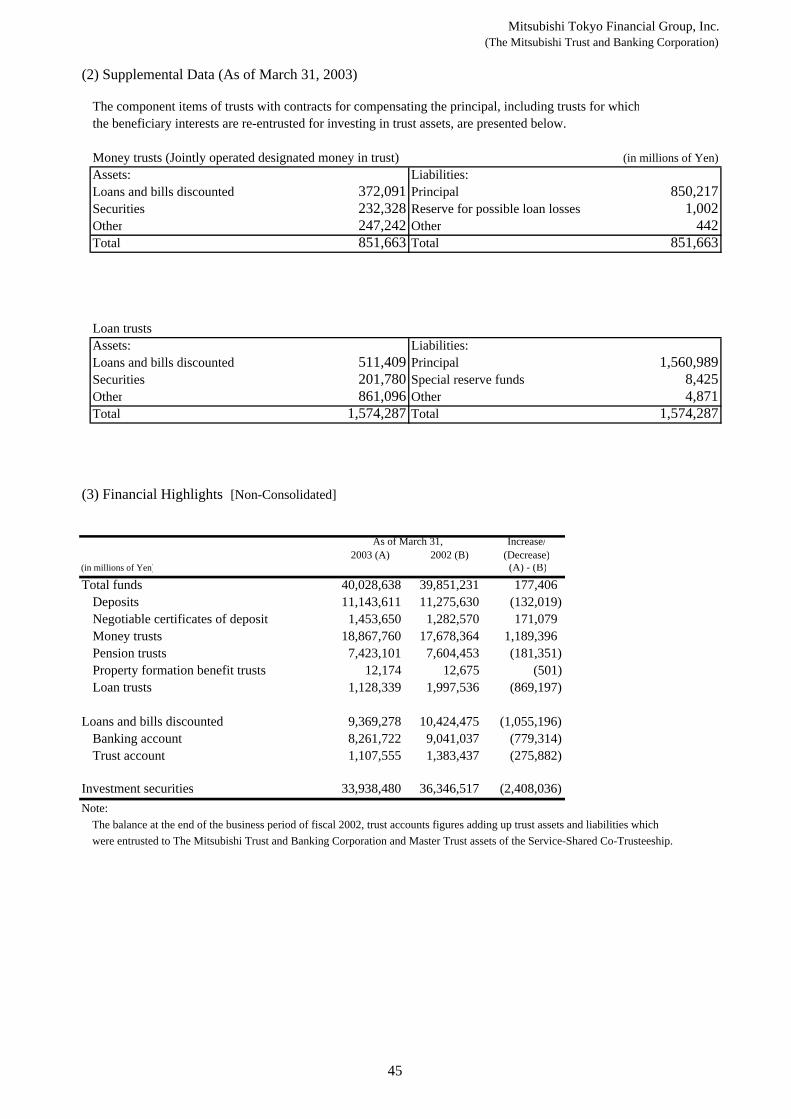
Mitsubishi Tokyo Financial Group, Inc.(The Mitsubishi Trust and Banking Corporation)
(2) Supplemental Data (As of March 31, 2003)
The component items of trusts with contracts for compensating the principal, including trusts for whichthe beneficiary interests are re-entrusted for investing in trust assets, are presented below.
Money trusts (Jointly operated designated money in trust) (in millions of Yen)Assets: Liabilities:Loans and bills discounted 372,091 Principal 850,217Securities 232,328 Reserve for possible loan losses 1,002Other 247,242 Other 442Total 851,663 Total 851,663
Loan trustsAssets: Liabilities:Loans and bills discounted 511,409 Principal 1,560,989Securities 201,780 Special reserve funds 8,425Other 861,096 Other 4,871Total 1,574,287 Total 1,574,287
(3) Financial Highlights [Non-Consolidated]
Increase/2003 (A) 2002 (B) (Decrease)
(in millions of Yen) (A) - (B)
Total funds 40,028,638 39,851,231 177,406Deposits 11,143,611 11,275,630 (132,019)Negotiable certificates of deposit 1,453,650 1,282,570 171,079Money trusts 18,867,760 17,678,364 1,189,396Pension trusts 7,423,101 7,604,453 (181,351)Property formation benefit trusts 12,174 12,675 (501)Loan trusts 1,128,339 1,997,536 (869,197)
Loans and bills discounted 9,369,278 10,424,475 (1,055,196)Banking account 8,261,722 9,041,037 (779,314)Trust account 1,107,555 1,383,437 (275,882)
Investment securities 33,938,480 36,346,517 (2,408,036)Note:
The balance at the end of the business period of fiscal 2002, trust accounts figures adding up trust assets and liabilities which were entrusted to The Mitsubishi Trust and Banking Corporation and Master Trust assets of the Service-Shared Co-Trusteeship.
As of March 31,
45
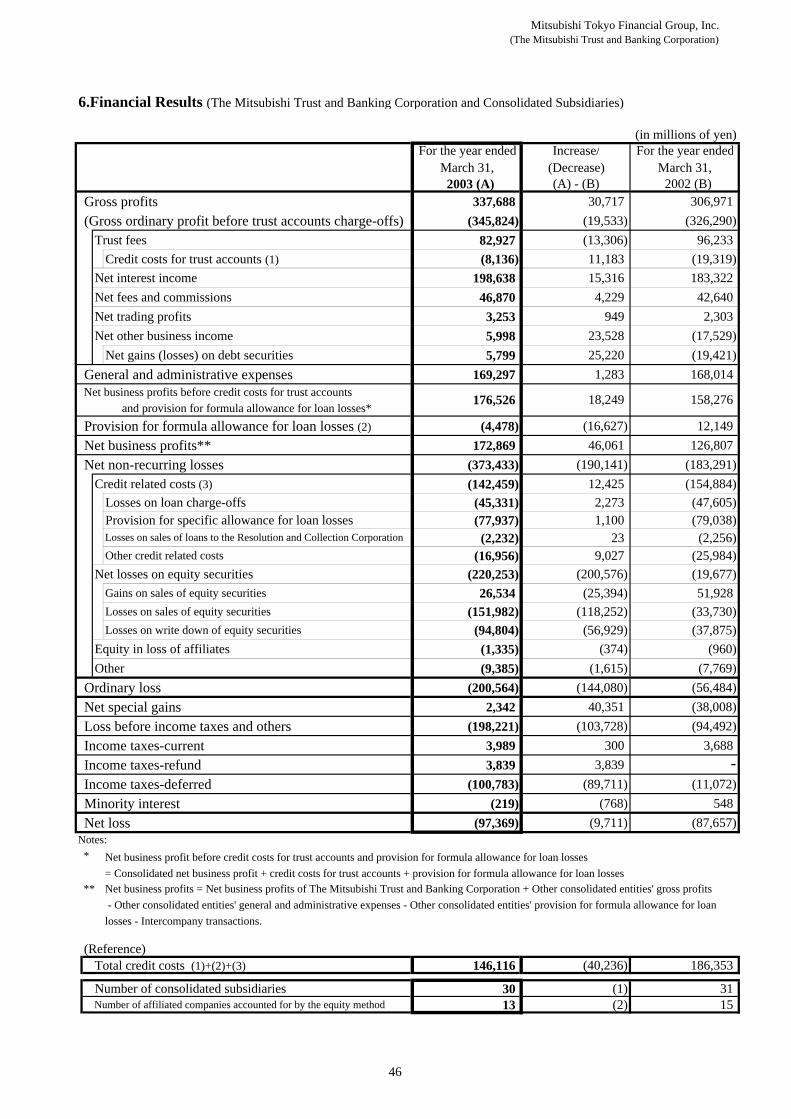
Mitsubishi Tokyo Financial Group, Inc.(The Mitsubishi Trust and Banking Corporation)
6.Financial Results (The Mitsubishi Trust and Banking Corporation and Consolidated Subsidiaries)
(in millions of yen)For the year ended Increase/ For the year ended
March 31, (Decrease) March 31, 2003 (A) (A) - (B) 2002 (B)
Gross profits 337,688 30,717 306,971 (Gross ordinary profit before trust accounts charge-offs) (345,824) (19,533) (326,290)
Trust fees 82,927 (13,306) 96,233 Credit costs for trust accounts (1) (8,136) 11,183 (19,319)
Net interest income 198,638 15,316 183,322 Net fees and commissions 46,870 4,229 42,640 Net trading profits 3,253 949 2,303 Net other business income 5,998 23,528 (17,529)
Net gains (losses) on debt securities 5,799 25,220 (19,421)General and administrative expenses 169,297 1,283 168,014 Net business profits before credit costs for trust accounts
and provision for formula allowance for loan losses*Provision for formula allowance for loan losses (2) (4,478) (16,627) 12,149 Net business profits** 172,869 46,061 126,807 Net non-recurring losses (373,433) (190,141) (183,291)
Credit related costs (3) (142,459) 12,425 (154,884)Losses on loan charge-offs (45,331) 2,273 (47,605)Provision for specific allowance for loan losses (77,937) 1,100 (79,038)
(2,232) 23 (2,256)Other credit related costs (16,956) 9,027 (25,984)
Net losses on equity securities (220,253) (200,576) (19,677)Gains on sales of equity securities 26,534 (25,394) 51,928 Losses on sales of equity securities (151,982) (118,252) (33,730)Losses on write down of equity securities (94,804) (56,929) (37,875)
Equity in loss of affiliates (1,335) (374) (960)Other (9,385) (1,615) (7,769)
Ordinary loss (200,564) (144,080) (56,484)Net special gains 2,342 40,351 (38,008)Loss before income taxes and others (198,221) (103,728) (94,492)Income taxes-current 3,989 300 3,688 Income taxes-refund 3,839 3,839 -Income taxes-deferred (100,783) (89,711) (11,072)Minority interest (219) (768) 548 Net loss (97,369) (9,711) (87,657)
* Net business profit before credit costs for trust accounts and provision for formula allowance for loan losses= Consolidated net business profit + credit costs for trust accounts + provision for formula allowance for loan losses
** Net business profits = Net business profits of The Mitsubishi Trust and Banking Corporation + Other consolidated entities' gross profits - Other consolidated entities' general and administrative expenses - Other consolidated entities' provision for formula allowance for loanlosses - Intercompany transactions.
(Reference)Total credit costs (1)+(2)+(3) 146,116 (40,236) 186,353
Number of consolidated subsidiaries 30 (1) 31 Number of affiliated companies accounted for by the equity method 13 (2) 15
176,526 18,249 158,276
Notes:
Losses on sales of loans to the Resolution and Collection Corporation
46
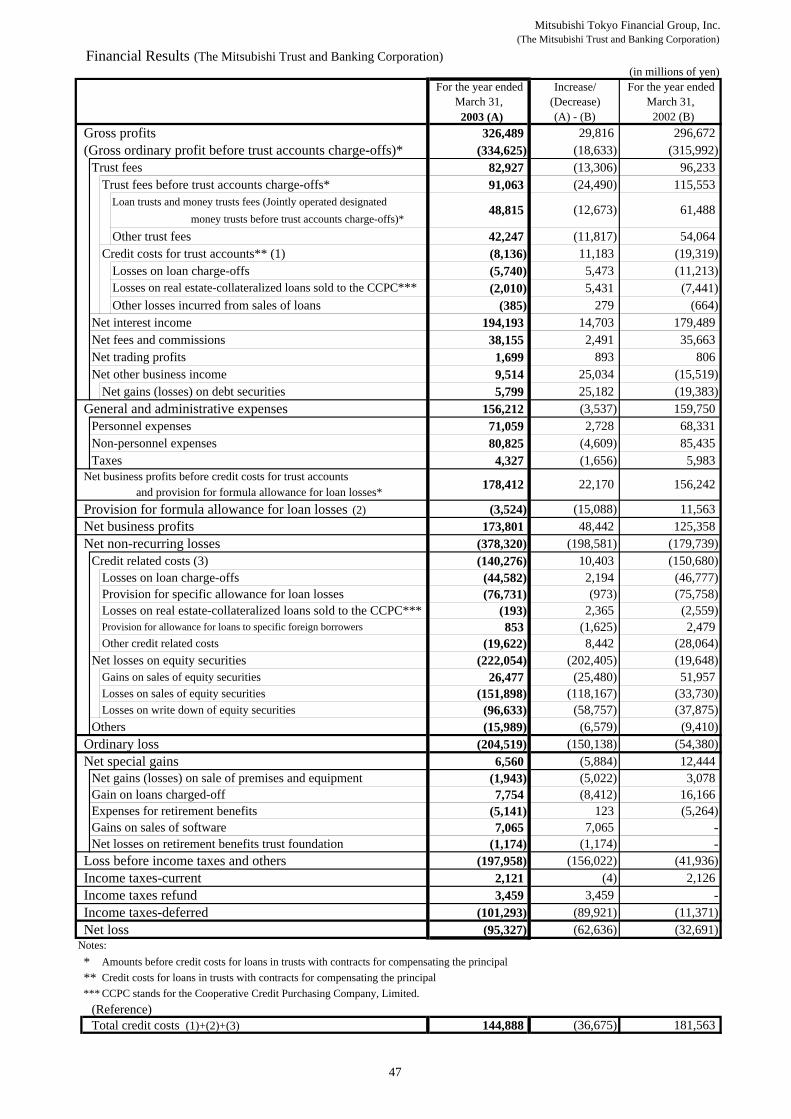
Mitsubishi Tokyo Financial Group, Inc.(The Mitsubishi Trust and Banking Corporation)
Financial Results (The Mitsubishi Trust and Banking Corporation)(in millions of yen)
For the year ended Increase/ For the year ended March 31, (Decrease) March 31, 2003 (A) (A) - (B) 2002 (B)
Gross profits 326,489 29,816 296,672 (Gross ordinary profit before trust accounts charge-offs)* (334,625) (18,633) (315,992)
Trust fees 82,927 (13,306) 96,233 Trust fees before trust accounts charge-offs* 91,063 (24,490) 115,553
Loan trusts and money trusts fees (Jointly operated designatedmoney trusts before trust accounts charge-offs)*
Other trust fees 42,247 (11,817) 54,064 Credit costs for trust accounts** (1) (8,136) 11,183 (19,319)
Losses on loan charge-offs (5,740) 5,473 (11,213)(2,010) 5,431 (7,441)
Other losses incurred from sales of loans (385) 279 (664)Net interest income 194,193 14,703 179,489 Net fees and commissions 38,155 2,491 35,663 Net trading profits 1,699 893 806 Net other business income 9,514 25,034 (15,519)
Net gains (losses) on debt securities 5,799 25,182 (19,383)General and administrative expenses 156,212 (3,537) 159,750
Personnel expenses 71,059 2,728 68,331 Non-personnel expenses 80,825 (4,609) 85,435 Taxes 4,327 (1,656) 5,983
Net business profits before credit costs for trust accountsand provision for formula allowance for loan losses*
Provision for formula allowance for loan losses (2) (3,524) (15,088) 11,563 Net business profits 173,801 48,442 125,358 Net non-recurring losses (378,320) (198,581) (179,739)
Credit related costs (3) (140,276) 10,403 (150,680)Losses on loan charge-offs (44,582) 2,194 (46,777)Provision for specific allowance for loan losses (76,731) (973) (75,758)Losses on real estate-collateralized loans sold to the CCPC*** (193) 2,365 (2,559)Provision for allowance for loans to specific foreign borrowers 853 (1,625) 2,479 Other credit related costs (19,622) 8,442 (28,064)
Net losses on equity securities (222,054) (202,405) (19,648)Gains on sales of equity securities 26,477 (25,480) 51,957 Losses on sales of equity securities (151,898) (118,167) (33,730)Losses on write down of equity securities (96,633) (58,757) (37,875)
Others (15,989) (6,579) (9,410)Ordinary loss (204,519) (150,138) (54,380)Net special gains 6,560 (5,884) 12,444
Net gains (losses) on sale of premises and equipment (1,943) (5,022) 3,078 Gain on loans charged-off 7,754 (8,412) 16,166 Expenses for retirement benefits (5,141) 123 (5,264)Gains on sales of software 7,065 7,065 -Net losses on retirement benefits trust foundation (1,174) (1,174) -
Loss before income taxes and others (197,958) (156,022) (41,936)Income taxes-current 2,121 (4) 2,126 Income taxes refund 3,459 3,459 -Income taxes-deferred (101,293) (89,921) (11,371)Net loss (95,327) (62,636) (32,691)
* Amounts before credit costs for loans in trusts with contracts for compensating the principal** Credit costs for loans in trusts with contracts for compensating the principal*** CCPC stands for the Cooperative Credit Purchasing Company, Limited.
(Reference)Total credit costs (1)+(2)+(3) 144,888 (36,675) 181,563
48,815 (12,673) 61,488
Losses on real estate-collateralized loans sold to the CCPC***
178,412 22,170 156,242
Notes:
47
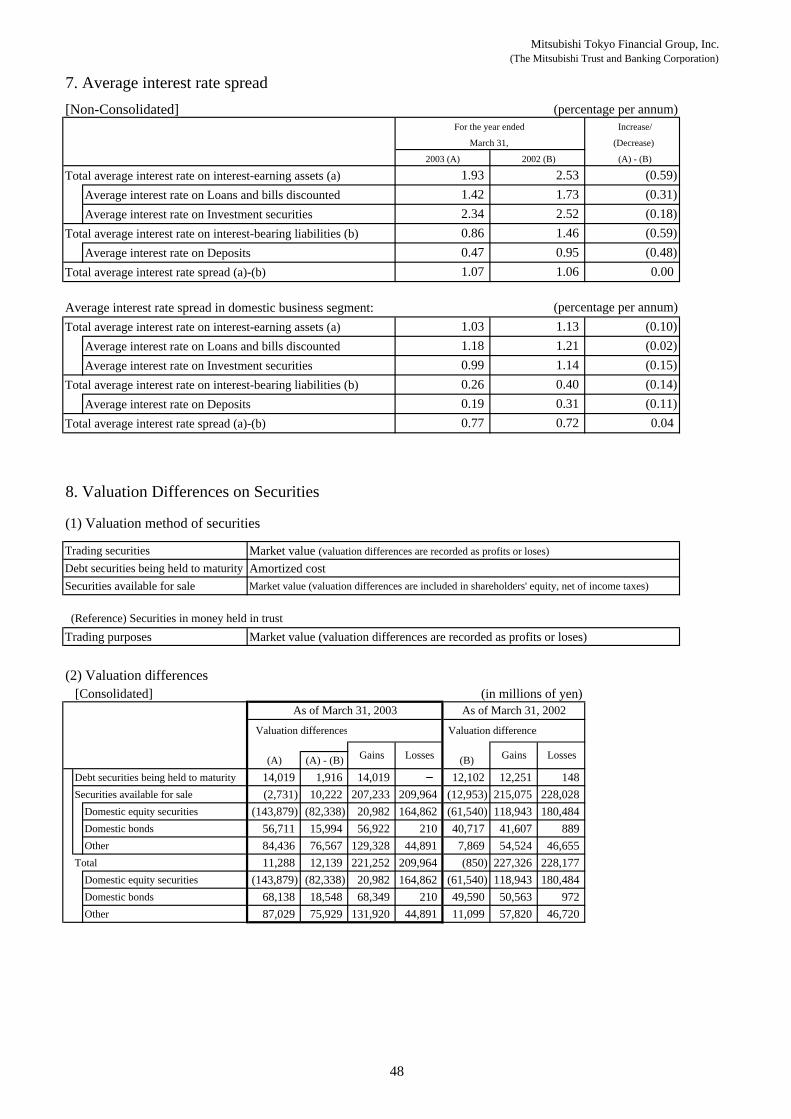
Mitsubishi Tokyo Financial Group, Inc.(The Mitsubishi Trust and Banking Corporation)
7. Average interest rate spread[Non-Consolidated] (percentage per annum)
Total average interest rate on interest-earning assets (a) Average interest rate on Loans and bills discounted Average interest rate on Investment securities
Total average interest rate on interest-bearing liabilities (b)Average interest rate on Deposits
Total average interest rate spread (a)-(b)
Average interest rate spread in domestic business segment:Total average interest rate on interest-earning assets (a)
Average interest rate on Loans and bills discountedAverage interest rate on Investment securities
Total average interest rate on interest-bearing liabilities (b)Average interest rate on Deposits
Total average interest rate spread (a)-(b)
8. Valuation Differences on Securities
(1) Valuation method of securities
Trading securities Market value (valuation differences are recorded as profits or loses)Debt securities being held to maturity Amortized costSecurities available for sale Market value (valuation differences are included in shareholders' equity, net of income taxes)
(Reference) Securities in money held in trustTrading purposes Market value (valuation differences are recorded as profits or loses)
(2) Valuation differences[Consolidated] (in millions of yen)
(A) (A) - (B) (B)Debt securities being held to maturity 14,019 1,916 14,019 12,102 12,251 148 Securities available for sale (2,731) 10,222 207,233 209,964 (12,953) 215,075 228,028
Domestic equity securities (143,879) (82,338) 20,982 164,862 (61,540) 118,943 180,484 Domestic bonds 56,711 15,994 56,922 210 40,717 41,607 889 Other 84,436 76,567 129,328 44,891 7,869 54,524 46,655
Total 11,288 12,139 221,252 209,964 (850) 227,326 228,177 Domestic equity securities (143,879) (82,338) 20,982 164,862 (61,540) 118,943 180,484 Domestic bonds 68,138 18,548 68,349 210 49,590 50,563 972 Other 87,029 75,929 131,920 44,891 11,099 57,820 46,720
As of March 31, 2002
Valuation differences
GainsLosses Losses
Valuation differences
As of March 31, 2003
Gains
2003 (A)
1.93 1.42 2.34 0.86 0.47 1.07
2002 (B)
Increase/
(Decrease)
(A) - (B)
For the year ended
March 31,
1.03 1.18 0.99 0.26 0.19 0.77
2.53 (0.59)1.73 (0.31)2.52 (0.18)1.46 (0.59)0.95 (0.48)
1.13 (0.10)(percentage per annum)
1.06 0.00
1.21 (0.02)1.14 (0.15)
0.72 0.04
0.40 (0.14)0.31 (0.11)
48
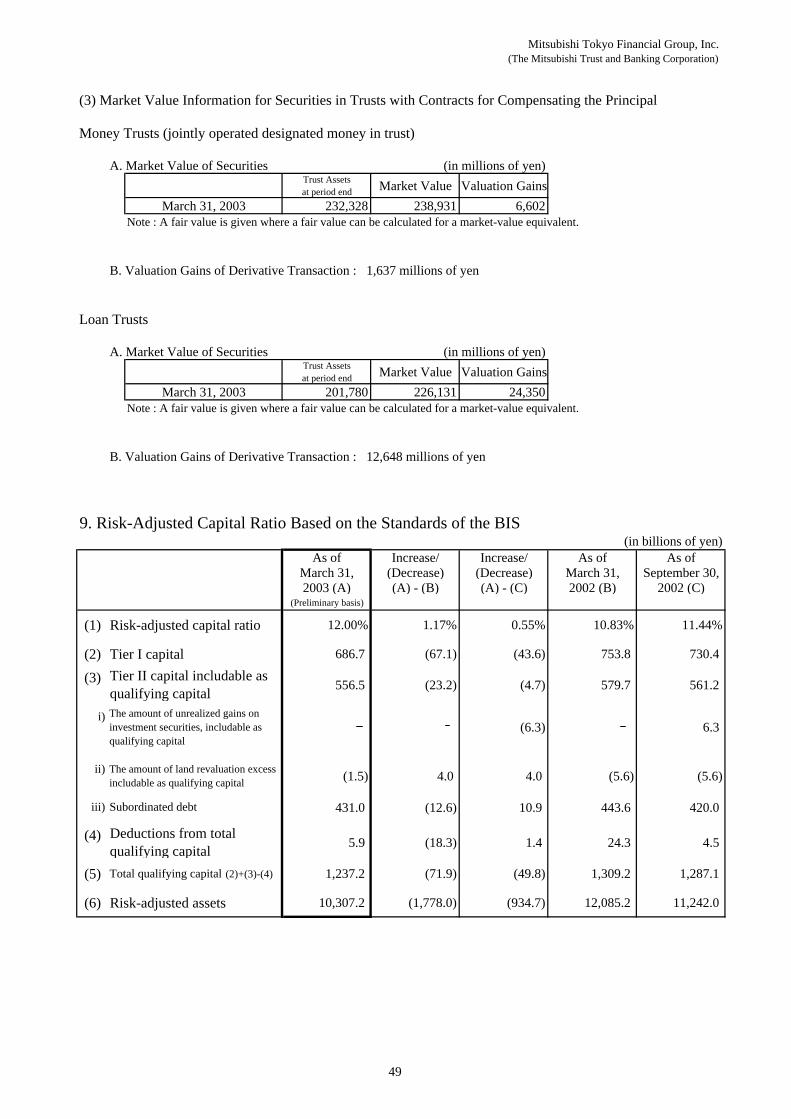
Mitsubishi Tokyo Financial Group, Inc.(The Mitsubishi Trust and Banking Corporation)
(3) Market Value Information for Securities in Trusts with Contracts for Compensating the Principal
Money Trusts (jointly operated designated money in trust)
A. Market Value of Securities (in millions of yen)Trust Assetsat period end Market Value Valuation Gains
March 31, 2003 232,328 238,931 6,602Note : A fair value is given where a fair value can be calculated for a market-value equivalent.
B. Valuation Gains of Derivative Transaction : 1,637 millions of yen
Loan Trusts
A. Market Value of Securities (in millions of yen)Trust Assetsat period end Market Value Valuation Gains
March 31, 2003 201,780 226,131 24,350Note : A fair value is given where a fair value can be calculated for a market-value equivalent.
B. Valuation Gains of Derivative Transaction : 12,648 millions of yen
9. Risk-Adjusted Capital Ratio Based on the Standards of the BIS(in billions of yen)
As of Increase/ Increase/ As of As ofMarch 31, (Decrease) (Decrease) March 31, September 30,2003 (A) (A) - (B) (A) - (C) 2002 (B) 2002 (C)
(Preliminary basis)
(1) Risk-adjusted capital ratio 12.00% 1.17% 0.55% 10.83% 11.44%
(2) Tier I capital 686.7 (67.1) (43.6) 753.8 730.4
(3) 556.5 (23.2) (4.7) 579.7 561.2
i)
ii)
iii) Subordinated debt 431.0 (12.6) 10.9 443.6 420.0
(4) 5.9 (18.3) 1.4 24.3 4.5
(5) Total qualifying capital (2)+(3)-(4) 1,237.2 (71.9) (49.8) 1,309.2 1,287.1
(6) Risk-adjusted assets 10,307.2 (1,778.0) (934.7) 12,085.2 11,242.0
Deductions from totalqualifying capital
(5.6)(1.5) 4.0 4.0 (5.6)The amount of land revaluation excessincludable as qualifying capital
6.3
Tier II capital includable asqualifying capital
(6.3)The amount of unrealized gains oninvestment securities, includable asqualifying capital
49
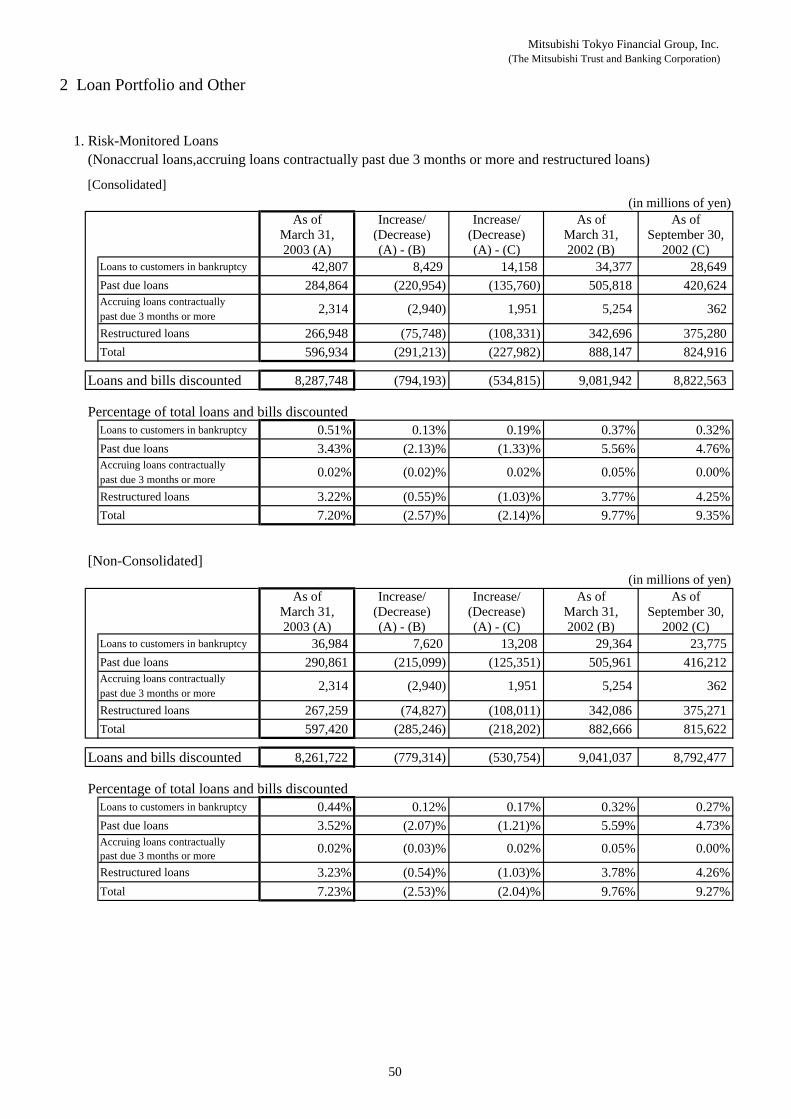
Mitsubishi Tokyo Financial Group, Inc.(The Mitsubishi Trust and Banking Corporation)
2 Loan Portfolio and Other
1. Risk-Monitored Loans(Nonaccrual loans,accruing loans contractually past due 3 months or more and restructured loans)
[Consolidated](in millions of yen)
As of Increase/ Increase/ As of As ofMarch 31, (Decrease) (Decrease) March 31, September 30,2003 (A) (A) - (B) (A) - (C) 2002 (B) 2002 (C)
Loans to customers in bankruptcy 42,807 8,429 14,158 34,377 28,649 Past due loans 284,864 (220,954) (135,760) 505,818 420,624
past due 3 months or moreRestructured loans 266,948 (75,748) (108,331) 342,696 375,280 Total 596,934 (291,213) (227,982) 888,147 824,916
Loans and bills discounted 8,287,748 (794,193) (534,815) 9,081,942 8,822,563
Percentage of total loans and bills discountedLoans to customers in bankruptcy 0.51% 0.13% 0.19% 0.37% 0.32%Past due loans 3.43% (2.13)% (1.33)% 5.56% 4.76%
past due 3 months or moreRestructured loans 3.22% (0.55)% (1.03)% 3.77% 4.25%Total 7.20% (2.57)% (2.14)% 9.77% 9.35%
[Non-Consolidated](in millions of yen)
As of Increase/ Increase/ As of As ofMarch 31, (Decrease) (Decrease) March 31, September 30,2003 (A) (A) - (B) (A) - (C) 2002 (B) 2002 (C)
Loans to customers in bankruptcy 36,984 7,620 13,208 29,364 23,775 Past due loans 290,861 (215,099) (125,351) 505,961 416,212
past due 3 months or moreRestructured loans 267,259 (74,827) (108,011) 342,086 375,271 Total 597,420 (285,246) (218,202) 882,666 815,622
Loans and bills discounted 8,261,722 (779,314) (530,754) 9,041,037 8,792,477
Percentage of total loans and bills discountedLoans to customers in bankruptcy 0.44% 0.12% 0.17% 0.32% 0.27%Past due loans 3.52% (2.07)% (1.21)% 5.59% 4.73%
past due 3 months or moreRestructured loans 3.23% (0.54)% (1.03)% 3.78% 4.26%Total 7.23% (2.53)% (2.04)% 9.76% 9.27%
1,951 5,254 362 Accruing loans contractually 2,314 (2,940)
Accruing loans contractually 2,314
Accruing loans contractually 0.02%
(2,940) 1,951 5,254 362
(0.02)% 0.02% 0.05% 0.00%
0.05% 0.00%Accruing loans contractually 0.02% (0.03)% 0.02%
50
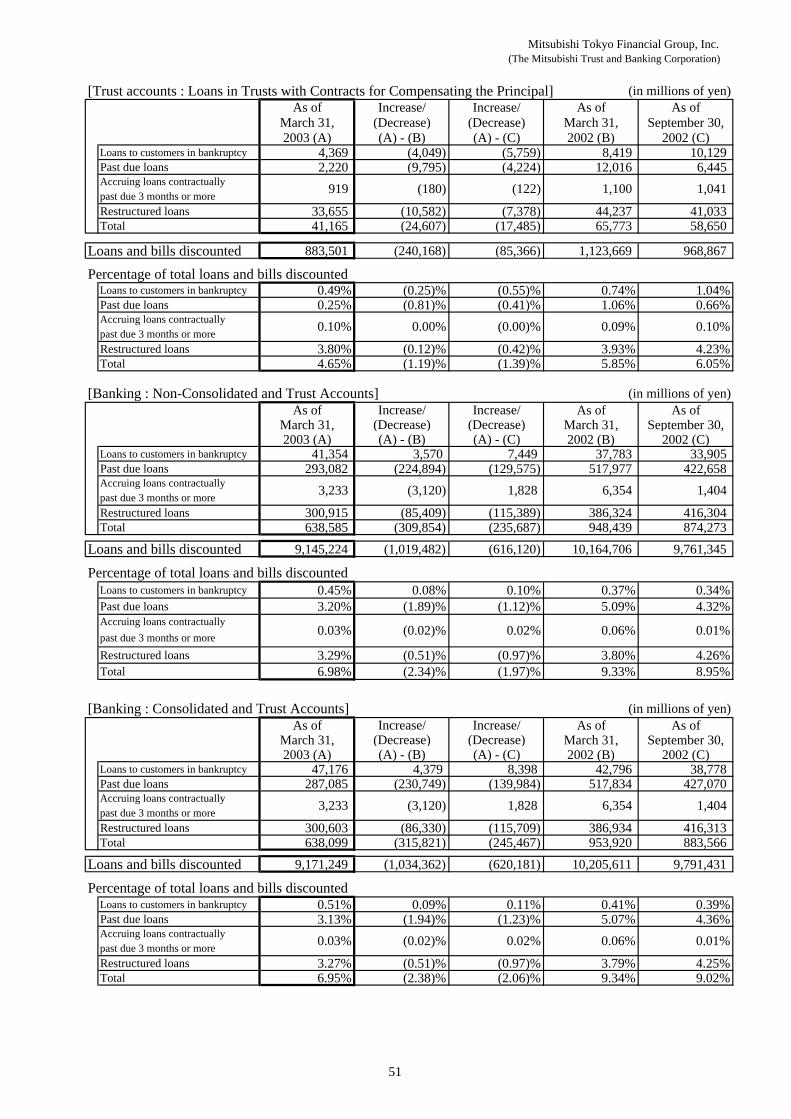
Mitsubishi Tokyo Financial Group, Inc.(The Mitsubishi Trust and Banking Corporation)
[Trust accounts : Loans in Trusts with Contracts for Compensating the Principal] (in millions of yen)As of Increase/ Increase/ As of As of
March 31, (Decrease) (Decrease) March 31, September 30,2003 (A) (A) - (B) (A) - (C) 2002 (B) 2002 (C)
Loans to customers in bankruptcy 4,369 (4,049) (5,759) 8,419 10,129 Past due loans 2,220 (9,795) (4,224) 12,016 6,445
past due 3 months or moreRestructured loans 33,655 (10,582) (7,378) 44,237 41,033 Total 41,165 (24,607) (17,485) 65,773 58,650
Loans and bills discounted 883,501 (240,168) (85,366) 1,123,669 968,867
Percentage of total loans and bills discountedLoans to customers in bankruptcy 0.49% (0.25)% (0.55)% 0.74% 1.04%Past due loans 0.25% (0.81)% (0.41)% 1.06% 0.66%
past due 3 months or moreRestructured loans 3.80% (0.12)% (0.42)% 3.93% 4.23%Total 4.65% (1.19)% (1.39)% 5.85% 6.05%
[Banking : Non-Consolidated and Trust Accounts] (in millions of yen)As of Increase/ Increase/ As of As of
March 31, (Decrease) (Decrease) March 31, September 30,2003 (A) (A) - (B) (A) - (C) 2002 (B) 2002 (C)
Loans to customers in bankruptcy 41,354 3,570 7,449 37,783 33,905 Past due loans 293,082 (224,894) (129,575) 517,977 422,658
past due 3 months or moreRestructured loans 300,915 (85,409) (115,389) 386,324 416,304 Total 638,585 (309,854) (235,687) 948,439 874,273
Loans and bills discounted 9,145,224 (1,019,482) (616,120) 10,164,706 9,761,345
Percentage of total loans and bills discountedLoans to customers in bankruptcy 0.45% 0.08% 0.10% 0.37% 0.34%Past due loans 3.20% (1.89)% (1.12)% 5.09% 4.32%
past due 3 months or moreRestructured loans 3.29% (0.51)% (0.97)% 3.80% 4.26%Total 6.98% (2.34)% (1.97)% 9.33% 8.95%
[Banking : Consolidated and Trust Accounts] (in millions of yen)As of Increase/ Increase/ As of As of
March 31, (Decrease) (Decrease) March 31, September 30,2003 (A) (A) - (B) (A) - (C) 2002 (B) 2002 (C)
Loans to customers in bankruptcy 47,176 4,379 8,398 42,796 38,778 Past due loans 287,085 (230,749) (139,984) 517,834 427,070
past due 3 months or moreRestructured loans 300,603 (86,330) (115,709) 386,934 416,313 Total 638,099 (315,821) (245,467) 953,920 883,566
Loans and bills discounted 9,171,249 (1,034,362) (620,181) 10,205,611 9,791,431
Percentage of total loans and bills discountedLoans to customers in bankruptcy 0.51% 0.09% 0.11% 0.41% 0.39%Past due loans 3.13% (1.94)% (1.23)% 5.07% 4.36%
past due 3 months or moreRestructured loans 3.27% (0.51)% (0.97)% 3.79% 4.25%Total 6.95% (2.38)% (2.06)% 9.34% 9.02%
0.06% 0.01%Accruing loans contractually 0.03% (0.02)% 0.02%
1,828 6,354 1,404 Accruing loans contractually 3,233 (3,120)
Accruing loans contractually0.03% (0.02)% 0.02% 0.06% 0.01%
1,828 6,354 1,404 Accruing loans contractually 3,233 (3,120)
Accruing loans contractually 919
Accruing loans contractually 0.10%
(180) (122) 1,100 1,041
0.00% (0.00)% 0.09% 0.10%
51
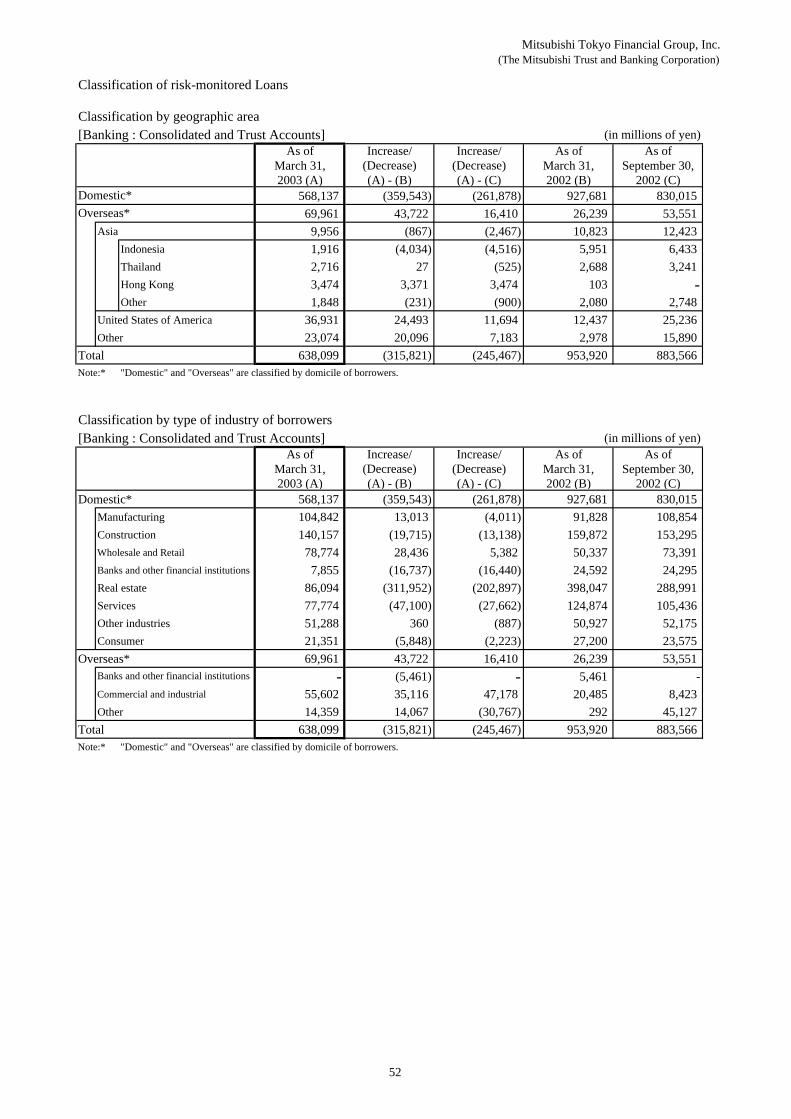
Mitsubishi Tokyo Financial Group, Inc.(The Mitsubishi Trust and Banking Corporation)
Classification of risk-monitored Loans
Classification by geographic area[Banking : Consolidated and Trust Accounts] (in millions of yen)
As of Increase/ Increase/ As of As ofMarch 31, (Decrease) (Decrease) March 31, September 30,2003 (A) (A) - (B) (A) - (C) 2002 (B) 2002 (C)
568,137 (359,543) (261,878) 927,681 830,015 69,961 43,722 16,410 26,239 53,551
Asia 9,956 (867) (2,467) 10,823 12,423 Indonesia 1,916 (4,034) (4,516) 5,951 6,433 Thailand 2,716 27 (525) 2,688 3,241 Hong Kong 3,474 3,371 3,474 103 -Other 1,848 (231) (900) 2,080 2,748
United States of America 36,931 24,493 11,694 12,437 25,236 Other 23,074 20,096 7,183 2,978 15,890
Total 638,099 (315,821) (245,467) 953,920 883,566 Note:* "Domestic" and "Overseas" are classified by domicile of borrowers.
Classification by type of industry of borrowers[Banking : Consolidated and Trust Accounts] (in millions of yen)
As of Increase/ Increase/ As of As ofMarch 31, (Decrease) (Decrease) March 31, September 30,2003 (A) (A) - (B) (A) - (C) 2002 (B) 2002 (C)
Domestic* 568,137 (359,543) (261,878) 927,681 830,015 Manufacturing 104,842 13,013 (4,011) 91,828 108,854 Construction 140,157 (19,715) (13,138) 159,872 153,295 Wholesale and Retail 78,774 28,436 5,382 50,337 73,391 Banks and other financial institutions 7,855 (16,737) (16,440) 24,592 24,295 Real estate 86,094 (311,952) (202,897) 398,047 288,991 Services 77,774 (47,100) (27,662) 124,874 105,436 Other industries 51,288 360 (887) 50,927 52,175 Consumer 21,351 (5,848) (2,223) 27,200 23,575
Overseas* 69,961 43,722 16,410 26,239 53,551 - (5,461) - 5,461 -
Commercial and industrial 55,602 35,116 47,178 20,485 8,423 Other 14,359 14,067 (30,767) 292 45,127
Total 638,099 (315,821) (245,467) 953,920 883,566 Note:* "Domestic" and "Overseas" are classified by domicile of borrowers.
Banks and other financial institutions
Domestic*Overseas*
52
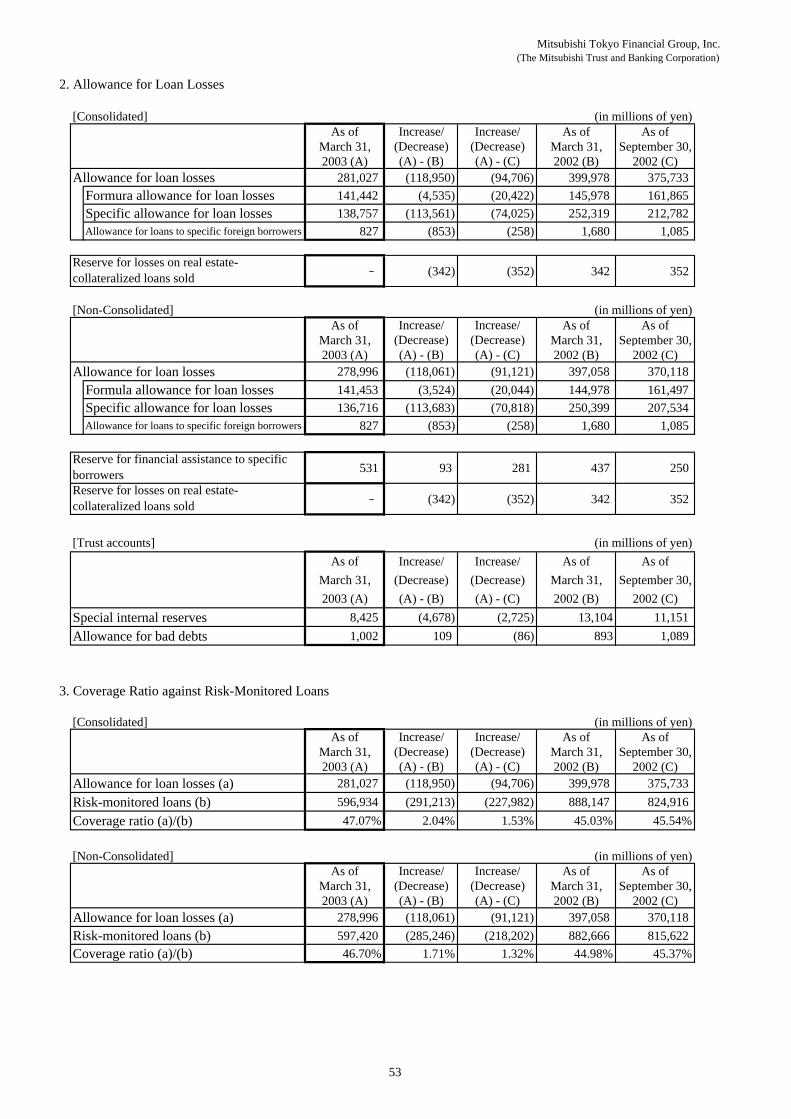
Mitsubishi Tokyo Financial Group, Inc.(The Mitsubishi Trust and Banking Corporation)
2. Allowance for Loan Losses
[Consolidated] (in millions of yen)As of Increase/ Increase/ As of As of
March 31, (Decrease) (Decrease) March 31, September 30,2003 (A) (A) - (B) (A) - (C) 2002 (B) 2002 (C)
Allowance for loan losses 281,027 (118,950) (94,706) 399,978 375,733 Formura allowance for loan losses 141,442 (4,535) (20,422) 145,978 161,865 Specific allowance for loan losses 138,757 (113,561) (74,025) 252,319 212,782 Allowance for loans to specific foreign borrowers 827 (853) (258) 1,680 1,085
(342) (352) 342 352
[Non-Consolidated] (in millions of yen)As of Increase/ Increase/ As of As of
March 31, (Decrease) (Decrease) March 31, September 30,2003 (A) (A) - (B) (A) - (C) 2002 (B) 2002 (C)
Allowance for loan losses 278,996 (118,061) (91,121) 397,058 370,118 Formula allowance for loan losses 141,453 (3,524) (20,044) 144,978 161,497 Specific allowance for loan losses 136,716 (113,683) (70,818) 250,399 207,534 Allowance for loans to specific foreign borrowers 827 (853) (258) 1,680 1,085
531 93 281 437 250
(342) (352) 342 352
[Trust accounts] (in millions of yen)As of Increase/ Increase/ As of As of
March 31, (Decrease) (Decrease) March 31, September 30,2003 (A) (A) - (B) (A) - (C) 2002 (B) 2002 (C)
Special internal reserves 8,425 (4,678) (2,725) 13,104 11,151 Allowance for bad debts 1,002 109 (86) 893 1,089
3. Coverage Ratio against Risk-Monitored Loans
[Consolidated] (in millions of yen)As of Increase/ Increase/ As of As of
March 31, (Decrease) (Decrease) March 31, September 30,2003 (A) (A) - (B) (A) - (C) 2002 (B) 2002 (C)
Allowance for loan losses (a) 281,027 (118,950) (94,706) 399,978 375,733 Risk-monitored loans (b) 596,934 (291,213) (227,982) 888,147 824,916 Coverage ratio (a)/(b) 47.07% 2.04% 1.53% 45.03% 45.54%
[Non-Consolidated] (in millions of yen)As of Increase/ Increase/ As of As of
March 31, (Decrease) (Decrease) March 31, September 30,2003 (A) (A) - (B) (A) - (C) 2002 (B) 2002 (C)
Allowance for loan losses (a) 278,996 (118,061) (91,121) 397,058 370,118 Risk-monitored loans (b) 597,420 (285,246) (218,202) 882,666 815,622 Coverage ratio (a)/(b) 46.70% 1.71% 1.32% 44.98% 45.37%
Reserve for losses on real estate-collateralized loans sold
Reserve for financial assistance to specificborrowersReserve for losses on real estate-collateralized loans sold
53
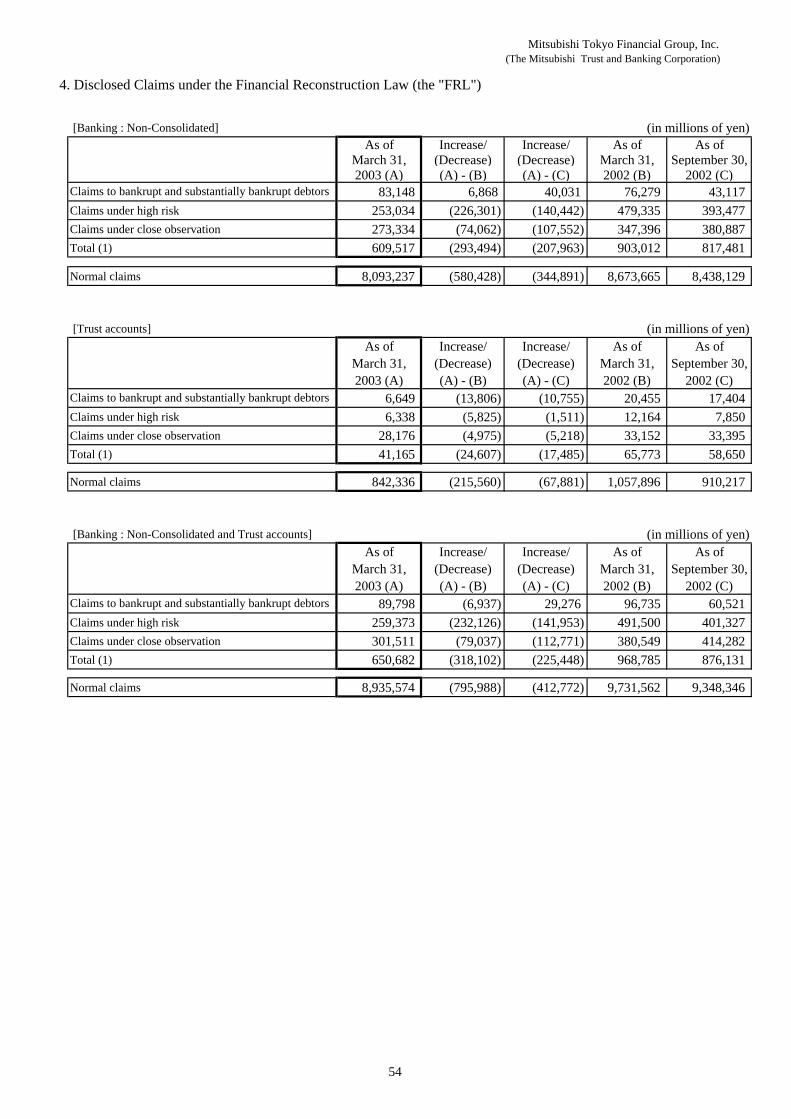
Mitsubishi Tokyo Financial Group, Inc.(The Mitsubishi Trust and Banking Corporation)
4. Disclosed Claims under the Financial Reconstruction Law (the "FRL")
[Banking : Non-Consolidated] (in millions of yen)As of Increase/ Increase/ As of As of
March 31, (Decrease) (Decrease) March 31, September 30,2003 (A) (A) - (B) (A) - (C) 2002 (B) 2002 (C)
83,148 6,868 40,031 76,279 43,117 Claims under high risk 253,034 (226,301) (140,442) 479,335 393,477 Claims under close observation 273,334 (74,062) (107,552) 347,396 380,887 Total (1) 609,517 (293,494) (207,963) 903,012 817,481
Normal claims 8,093,237 (580,428) (344,891) 8,673,665 8,438,129
[Trust accounts] (in millions of yen)As of Increase/ Increase/ As of As of
March 31, (Decrease) (Decrease) March 31, September 30,2003 (A) (A) - (B) (A) - (C) 2002 (B) 2002 (C)
6,649 (13,806) (10,755) 20,455 17,404 Claims under high risk 6,338 (5,825) (1,511) 12,164 7,850 Claims under close observation 28,176 (4,975) (5,218) 33,152 33,395 Total (1) 41,165 (24,607) (17,485) 65,773 58,650
Normal claims 842,336 (215,560) (67,881) 1,057,896 910,217
[Banking : Non-Consolidated and Trust accounts] (in millions of yen)As of Increase/ Increase/ As of As of
March 31, (Decrease) (Decrease) March 31, September 30,2003 (A) (A) - (B) (A) - (C) 2002 (B) 2002 (C)
89,798 (6,937) 29,276 96,735 60,521 Claims under high risk 259,373 (232,126) (141,953) 491,500 401,327 Claims under close observation 301,511 (79,037) (112,771) 380,549 414,282 Total (1) 650,682 (318,102) (225,448) 968,785 876,131
Normal claims 8,935,574 (795,988) (412,772) 9,731,562 9,348,346
Claims to bankrupt and substantially bankrupt debtors
Claims to bankrupt and substantially bankrupt debtors
Claims to bankrupt and substantially bankrupt debtors
54
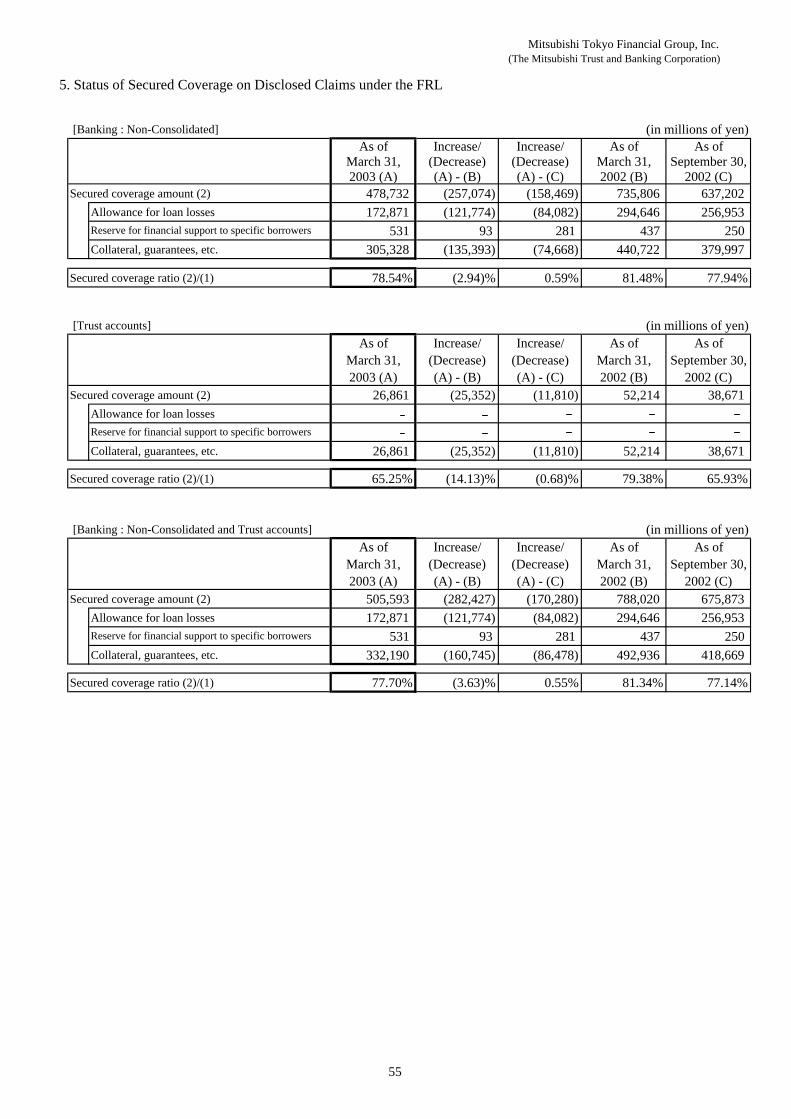
Mitsubishi Tokyo Financial Group, Inc.(The Mitsubishi Trust and Banking Corporation)
5. Status of Secured Coverage on Disclosed Claims under the FRL
[Banking : Non-Consolidated] (in millions of yen)As of Increase/ Increase/ As of As of
March 31, (Decrease) (Decrease) March 31, September 30,2003 (A) (A) - (B) (A) - (C) 2002 (B) 2002 (C)
Secured coverage amount (2) 478,732 (257,074) (158,469) 735,806 637,202 Allowance for loan losses 172,871 (121,774) (84,082) 294,646 256,953
531 93 281 437 250 Collateral, guarantees, etc. 305,328 (135,393) (74,668) 440,722 379,997
Secured coverage ratio (2)/(1) 78.54% (2.94)% 0.59% 81.48% 77.94%
[Trust accounts] (in millions of yen)As of Increase/ Increase/ As of As of
March 31, (Decrease) (Decrease) March 31, September 30,2003 (A) (A) - (B) (A) - (C) 2002 (B) 2002 (C)
Secured coverage amount (2) 26,861 (25,352) (11,810) 52,214 38,671 Allowance for loan losses
Collateral, guarantees, etc. 26,861 (25,352) (11,810) 52,214 38,671
Secured coverage ratio (2)/(1) 65.25% (14.13)% (0.68)% 79.38% 65.93%
[Banking : Non-Consolidated and Trust accounts] (in millions of yen)As of Increase/ Increase/ As of As of
March 31, (Decrease) (Decrease) March 31, September 30,2003 (A) (A) - (B) (A) - (C) 2002 (B) 2002 (C)
Secured coverage amount (2) 505,593 (282,427) (170,280) 788,020 675,873 Allowance for loan losses 172,871 (121,774) (84,082) 294,646 256,953
531 93 281 437 250 Collateral, guarantees, etc. 332,190 (160,745) (86,478) 492,936 418,669
Secured coverage ratio (2)/(1) 77.70% (3.63)% 0.55% 81.34% 77.14%
Reserve for financial support to specific borrowers
Reserve for financial support to specific borrowers
Reserve for financial support to specific borrowers
55
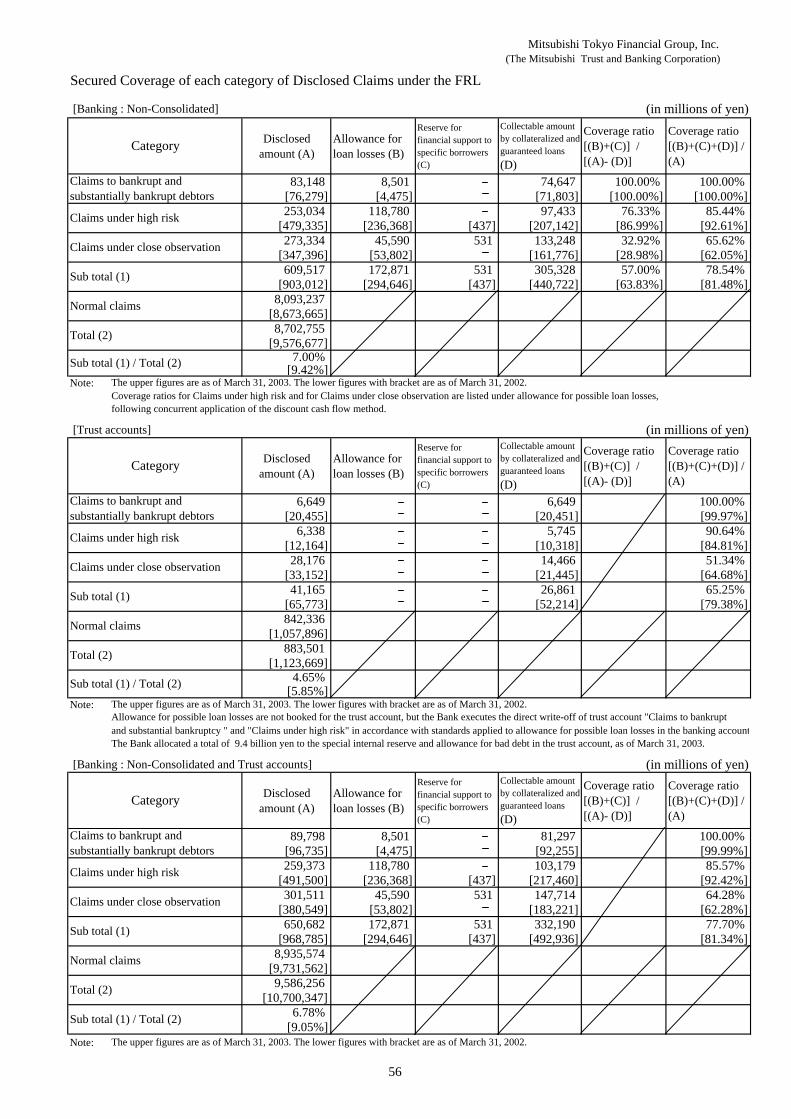
Mitsubishi Tokyo Financial Group, Inc.(The Mitsubishi Trust and Banking Corporation)
Secured Coverage of each category of Disclosed Claims under the FRL
[Banking : Non-Consolidated] (in millions of yen)
Disclosedamount (A)
Allowance forloan losses (B)
Reserve forfinancial support tospecific borrowers(C)
Collectable amountby collateralized andguaranteed loans(D)
Coverage ratio[(B)+(C)] /[(A)- (D)]
Coverage ratio[(B)+(C)+(D)] /(A)
83,148 8,501 74,647 100.00% 100.00% [76,279] [4,475] [71,803] [100.00%] [100.00%]253,034 118,780 97,433 76.33% 85.44%
[479,335] [236,368] [437] [207,142] [86.99%] [92.61%]273,334 45,590 531 133,248 32.92% 65.62%
[347,396] [53,802] [161,776] [28.98%] [62.05%]609,517 172,871 531 305,328 57.00% 78.54%
[903,012] [294,646] [437] [440,722] [63.83%] [81.48%]8,093,237
[8,673,665]8,702,755
[9,576,677]7.00%
[9.42%]Note:
Coverage ratios for Claims under high risk and for Claims under close observation are listed under allowance for possible loan losses,following concurrent application of the discount cash flow method.
[Trust accounts] (in millions of yen)
Disclosedamount (A)
Allowance forloan losses (B)
Reserve forfinancial support tospecific borrowers(C)
Collectable amountby collateralized andguaranteed loans(D)
Coverage ratio[(B)+(C)] /[(A)- (D)]
Coverage ratio[(B)+(C)+(D)] /(A)
6,649 6,649 100.00% [20,455] [20,451] [99.97%]
6,338 5,745 90.64% [12,164] [10,318] [84.81%]28,176 14,466 51.34%
[33,152] [21,445] [64.68%]41,165 26,861 65.25%
[65,773] [52,214] [79.38%]842,336
[1,057,896]883,501
[1,123,669]4.65%
[5.85%]Note:
and substantial bankruptcy " and "Claims under high risk" in accordance with standards applied to allowance for possible loan losses in the banking accountThe Bank allocated a total of 9.4 billion yen to the special internal reserve and allowance for bad debt in the trust account, as of March 31, 2003.
[Banking : Non-Consolidated and Trust accounts] (in millions of yen)
Disclosedamount (A)
Allowance forloan losses (B)
Reserve forfinancial support tospecific borrowers(C)
Collectable amountby collateralized andguaranteed loans(D)
Coverage ratio[(B)+(C)] /[(A)- (D)]
Coverage ratio[(B)+(C)+(D)] /(A)
89,798 8,501 81,297 100.00% [96,735] [4,475] [92,255] [99.99%]259,373 118,780 103,179 85.57%
[491,500] [236,368] [437] [217,460] [92.42%]301,511 45,590 531 147,714 64.28%
[380,549] [53,802] [183,221] [62.28%]650,682 172,871 531 332,190 77.70%
[968,785] [294,646] [437] [492,936] [81.34%]8,935,574
[9,731,562]9,586,256
[10,700,347]6.78%
[9.05%]Note:
Category
Category
Claims to bankrupt andsubstantially bankrupt debtors
Claims to bankrupt andsubstantially bankrupt debtors
Claims under high risk
Sub total (1) / Total (2)
Claims under close observation
Total (2)
The upper figures are as of March 31, 2003. The lower figures with bracket are as of March 31, 2002.
Sub total (1)
Normal claims
Total (2)
Sub total (1) / Total (2)
Sub total (1)
Normal claims
Claims under high risk
Claims under close observation
The upper figures are as of March 31, 2003. The lower figures with bracket are as of March 31, 2002.
Category
Allowance for possible loan losses are not booked for the trust account, but the Bank executes the direct write-off of trust account "Claims to bankrupt
Claims to bankrupt andsubstantially bankrupt debtors
Total (2)
Sub total (1) / Total (2)
The upper figures are as of March 31, 2003. The lower figures with bracket are as of March 31, 2002.
Claims under high risk
Claims under close observation
Sub total (1)
Normal claims
56
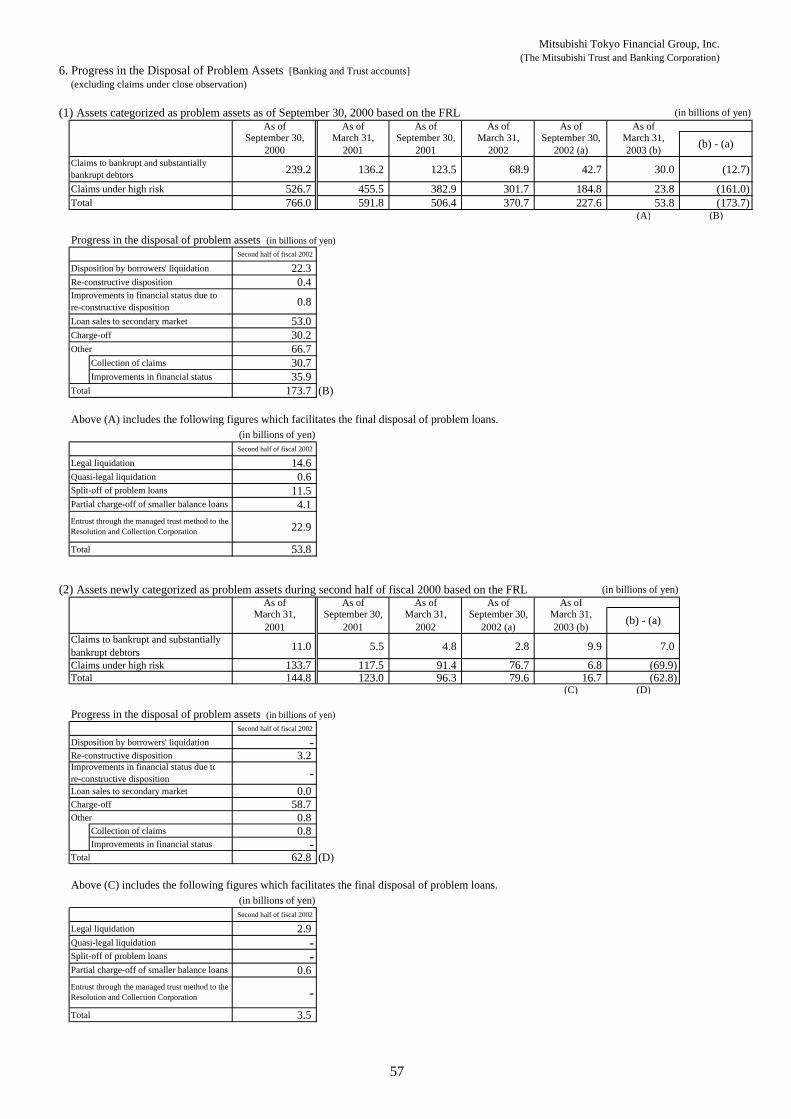
Mitsubishi Tokyo Financial Group, Inc.(The Mitsubishi Trust and Banking Corporation)
6. Progress in the Disposal of Problem Assets [Banking and Trust accounts](excluding claims under close observation)
(1) Assets categorized as problem assets as of September 30, 2000 based on the FRL (in billions of yen)As of As of As of As of As of As of
September 30, March 31, September 30, March 31, September 30, March 31,2000 2001 2001 2002 2002 (a) 2003 (b)
239.2 136.2 123.5 68.9 42.7 30.0 (12.7)
Claims under high risk 526.7 455.5 382.9 301.7 184.8 23.8 (161.0)Total 766.0 591.8 506.4 370.7 227.6 53.8 (173.7)
(A) (B)
Progress in the disposal of problem assets (in billions of yen)Second half of fiscal 2002
Disposition by borrowers' liquidation 22.3 Re-constructive disposition 0.4
0.8
Loan sales to secondary market 53.0 Charge-off 30.2 Other 66.7
Collection of claims 30.7 Improvements in financial status 35.9
Total 173.7 (B)
Above (A) includes the following figures which facilitates the final disposal of problem loans. (in billions of yen)Second half of fiscal 2002
Legal liquidation 14.6 Quasi-legal liquidation 0.6
11.5 4.1
22.9
Total 53.8
(2) Assets newly categorized as problem assets during second half of fiscal 2000 based on the FRL (in billions of yen)As of As of As of As of As of
March 31, September 30, March 31, September 30, March 31,2001 2001 2002 2002 (a) 2003 (b)
11.0 5.5 4.8 2.8 9.9 7.0 Claims under high risk 133.7 117.5 91.4 76.7 6.8 (69.9)Total 144.8 123.0 96.3 79.6 16.7 (62.8)
(C) (D)
Progress in the disposal of problem assets (in billions of yen)Second half of fiscal 2002
Disposition by borrowers' liquidation -Re-constructive disposition 3.2
-Loan sales to secondary market 0.0 Charge-off 58.7 Other 0.8
Collection of claims 0.8 Improvements in financial status -
Total 62.8 (D)
Above (C) includes the following figures which facilitates the final disposal of problem loans. (in billions of yen)Second half of fiscal 2002
Legal liquidation 2.9 Quasi-legal liquidation -
-0.6
-Total 3.5
Partial charge-off of smaller balance loans
Entrust through the managed trust method to theResolution and Collection Corporation
Split-off of problem loansPartial charge-off of smaller balance loans
Entrust through the managed trust method to theResolution and Collection Corporation
Split-off of problem loans
(b) - (a)Claims to bankrupt and substantiallybankrupt debtors
Improvements in financial status due tore-constructive disposition
(b) - (a)
Improvements in financial status due tore-constructive disposition
Claims to bankrupt and substantiallybankrupt debtors
57
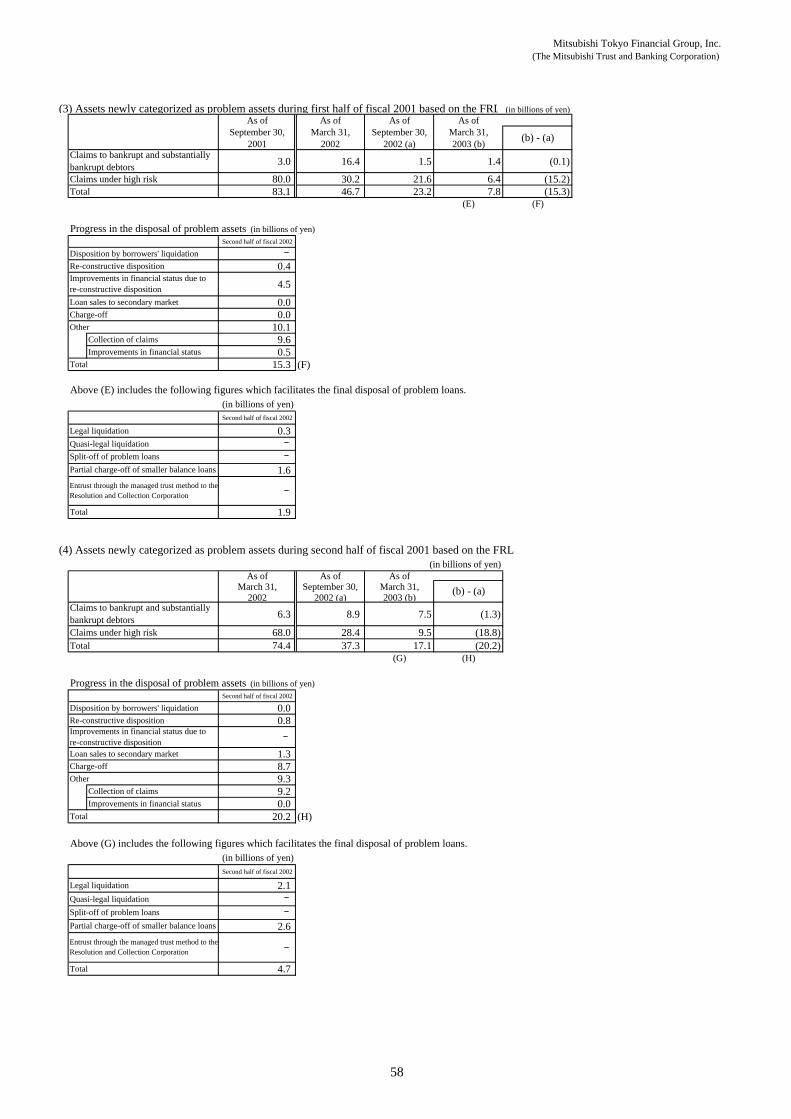
Mitsubishi Tokyo Financial Group, Inc.(The Mitsubishi Trust and Banking Corporation)
(3) Assets newly categorized as problem assets during first half of fiscal 2001 based on the FRL (in billions of yen)As of As of As of As of
September 30, March 31, September 30, March 31,2001 2002 2002 (a) 2003 (b)
3.0 16.4 1.5 1.4 (0.1)
Claims under high risk 80.0 30.2 21.6 6.4 (15.2)Total 83.1 46.7 23.2 7.8 (15.3)
(E) (F)
Progress in the disposal of problem assets (in billions of yen)Second half of fiscal 2002
Disposition by borrowers' liquidationRe-constructive disposition 0.4
4.5 Loan sales to secondary market 0.0 Charge-off 0.0 Other 10.1
Collection of claims 9.6 Improvements in financial status 0.5
Total 15.3 (F)
Above (E) includes the following figures which facilitates the final disposal of problem loans. (in billions of yen)Second half of fiscal 2002
Legal liquidation 0.3 Quasi-legal liquidation
1.6
Total 1.9
(4) Assets newly categorized as problem assets during second half of fiscal 2001 based on the FRL(in billions of yen)
As of As of As ofMarch 31, September 30, March 31,
2002 2002 (a) 2003 (b)
6.3 8.9 7.5 (1.3)
Claims under high risk 68.0 28.4 9.5 (18.8)Total 74.4 37.3 17.1 (20.2)
(G) (H)
Progress in the disposal of problem assets (in billions of yen)Second half of fiscal 2002
Disposition by borrowers' liquidation 0.0 Re-constructive disposition 0.8
Loan sales to secondary market 1.3 Charge-off 8.7 Other 9.3
Collection of claims 9.2 Improvements in financial status 0.0
Total 20.2 (H)
Above (G) includes the following figures which facilitates the final disposal of problem loans. (in billions of yen)Second half of fiscal 2002
Legal liquidation 2.1 Quasi-legal liquidation
2.6
Total 4.7
(b) - (a)
Split-off of problem loansPartial charge-off of smaller balance loans
Entrust through the managed trust method to theResolution and Collection Corporation
(b) - (a)
Entrust through the managed trust method to theResolution and Collection Corporation
Claims to bankrupt and substantiallybankrupt debtors
Improvements in financial status due tore-constructive disposition
Partial charge-off of smaller balance loans
Improvements in financial status due tore-constructive disposition
Claims to bankrupt and substantiallybankrupt debtors
Split-off of problem loans
58

Mitsubishi Tokyo Financial Group, Inc.(The Mitsubishi Trust and Banking Corporation)
(5) Assets newly categorized as problem assets during first half of fiscal 2002 based on the FRL(in billions of yen)
As of As ofSeptember 30, March 31,
2002 (a) 2003 (b)
4.3 15.4 11.1
Claims under high risk 89.5 35.9 (53.6)Total 93.9 51.3 (42.5)
(I) (J)
Progress in the disposal of problem assets (in billions of yen)Second half of fiscal 2002
Disposition by borrowers' liquidation -Re-constructive disposition 0.1
9.7
Loan sales to secondary market 2.0 Charge-off 13.2 Other 17.3
Collection of claims 14.6 Improvements in financial status 2.6
Total 42.5 (J)
Above (I) includes the following figures which facilitates the final disposal of problem loans. (in billions of yen)Second half of fiscal 2002
Legal liquidation 15.1 Quasi-legal liquidation -
-0.9
-Total 16.0
(6) Assets newly categorized as problem assets during second half of fiscal 2002 based on the FRL(in billions of yen)
As of March 31, 2003
25.3
Claims under high risk 176.6 Total 202.0
Histrical trend of problem assets based on the FRL (in billions of yen)As of As of As of As of As of As of
September 30, March 31, September 30, March 31, September 30, March 31,2000 2001 2001 2002 2002 (a) 2003 (b)
239.2 147.3 132.0 96.7 60.5 89.7 29.2
Claims under high risk 526.7 589.2 580.5 491.5 401.3 259.3 (142.0)Total 766.0 736.6 712.6 588.2 461.8 349.1 (112.7)
Claims to bankrupt and substantiallybankrupt debtors
Claims to bankrupt and substantiallybankrupt debtors
Claims to bankrupt and substantiallybankrupt debtors
Split-off of problem loansPartial charge-off of smaller balance loans
Entrust through the managed trust method to theResolution and Collection Corporation
Improvements in financial status due tore-constructive disposition
(b) - (a)
(b) - (a)
59
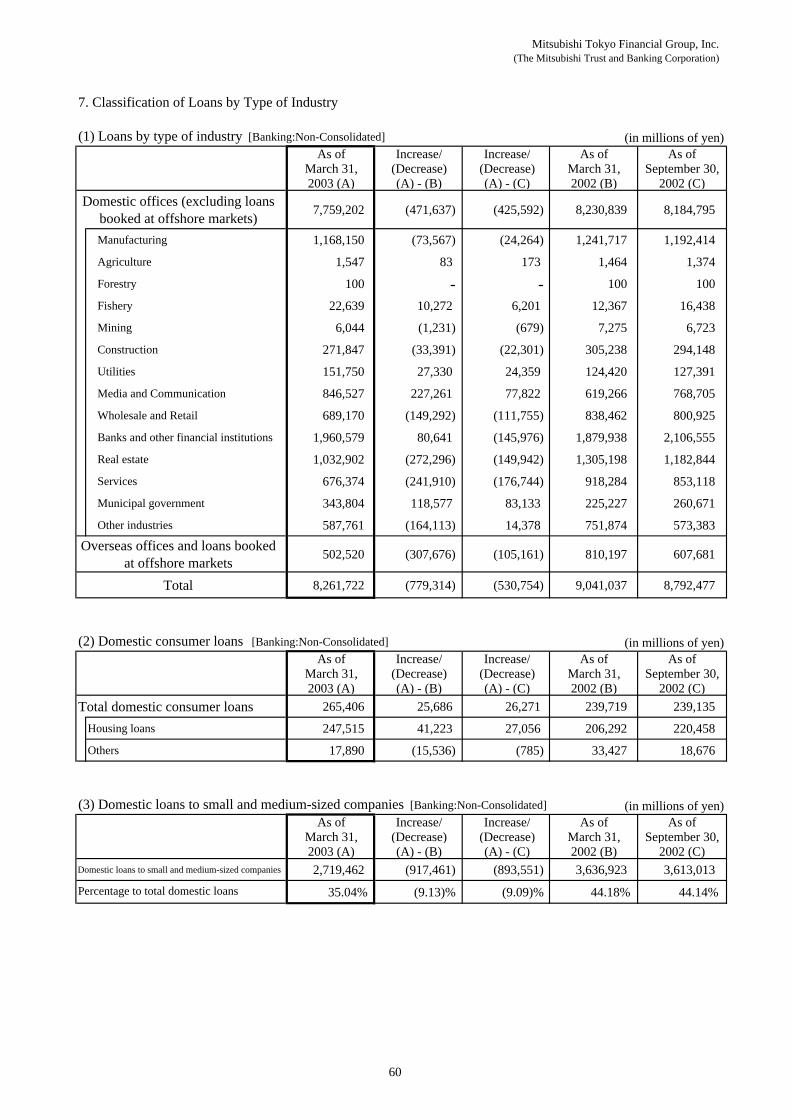
Mitsubishi Tokyo Financial Group, Inc.(The Mitsubishi Trust and Banking Corporation)
7. Classification of Loans by Type of Industry
(1) Loans by type of industry [Banking:Non-Consolidated] (in millions of yen)As of Increase/ Increase/ As of As of
March 31, (Decrease) (Decrease) March 31, September 30,2003 (A) (A) - (B) (A) - (C) 2002 (B) 2002 (C)
Domestic offices (excluding loansbooked at offshore markets) 7,759,202 (471,637) (425,592) 8,230,839 8,184,795
Manufacturing 1,168,150 (73,567) (24,264) 1,241,717 1,192,414
Agriculture 1,547 83 173 1,464 1,374
Forestry 100 - - 100 100
Fishery 22,639 10,272 6,201 12,367 16,438
Mining 6,044 (1,231) (679) 7,275 6,723
Construction 271,847 (33,391) (22,301) 305,238 294,148
Utilities 151,750 27,330 24,359 124,420 127,391
Media and Communication 846,527 227,261 77,822 619,266 768,705
Wholesale and Retail 689,170 (149,292) (111,755) 838,462 800,925
Banks and other financial institutions 1,960,579 80,641 (145,976) 1,879,938 2,106,555
Real estate 1,032,902 (272,296) (149,942) 1,305,198 1,182,844
Services 676,374 (241,910) (176,744) 918,284 853,118
Municipal government 343,804 118,577 83,133 225,227 260,671
Other industries 587,761 (164,113) 14,378 751,874 573,383 Overseas offices and loans booked
at offshore markets 502,520 (307,676) (105,161) 810,197 607,681
Total 8,261,722 (779,314) (530,754) 9,041,037 8,792,477
(2) Domestic consumer loans [Banking:Non-Consolidated] (in millions of yen)As of Increase/ Increase/ As of As of
March 31, (Decrease) (Decrease) March 31, September 30,2003 (A) (A) - (B) (A) - (C) 2002 (B) 2002 (C)
Total domestic consumer loans 265,406 25,686 26,271 239,719 239,135
Housing loans 247,515 41,223 27,056 206,292 220,458
Others 17,890 (15,536) (785) 33,427 18,676
(3) Domestic loans to small and medium-sized companies [Banking:Non-Consolidated] (in millions of yen)As of Increase/ Increase/ As of As of
March 31, (Decrease) (Decrease) March 31, September 30,2003 (A) (A) - (B) (A) - (C) 2002 (B) 2002 (C)
Domestic loans to small and medium-sized companies 2,719,462 (917,461) (893,551) 3,636,923 3,613,013
35.04% (9.13)% (9.09)% 44.18% 44.14%Percentage to total domestic loans
60
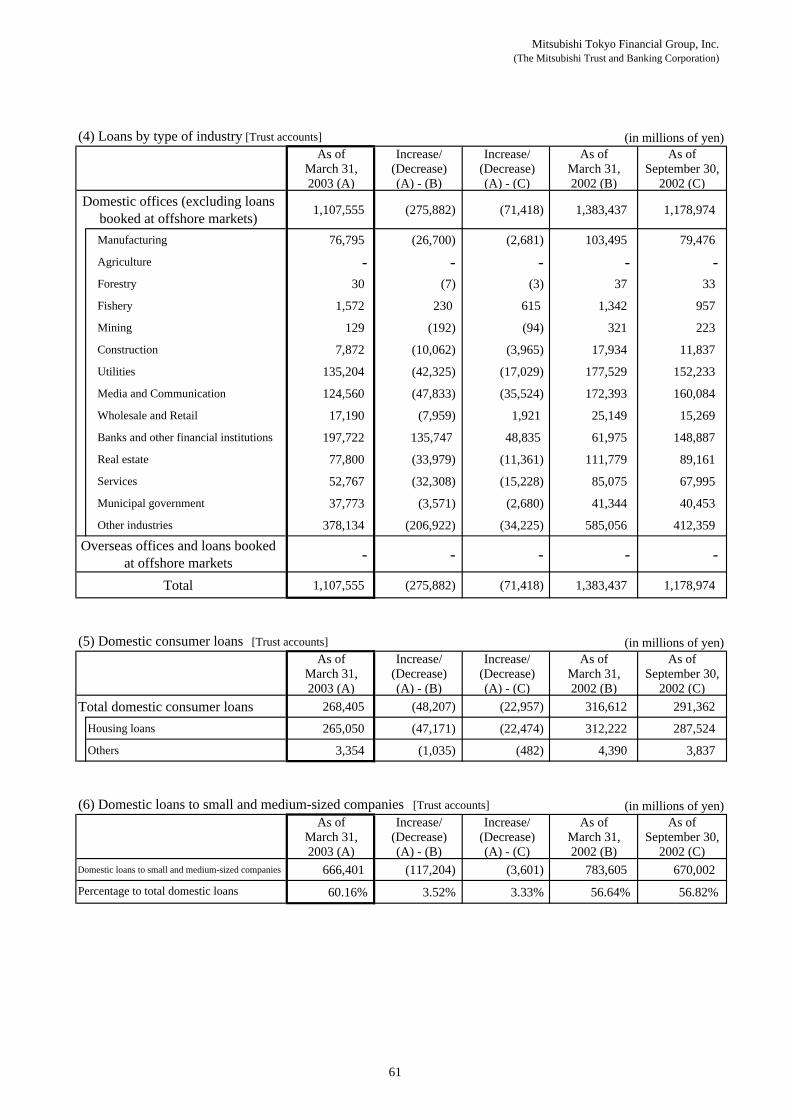
Mitsubishi Tokyo Financial Group, Inc.(The Mitsubishi Trust and Banking Corporation)
(4) Loans by type of industry [Trust accounts] (in millions of yen)As of Increase/ Increase/ As of As of
March 31, (Decrease) (Decrease) March 31, September 30,2003 (A) (A) - (B) (A) - (C) 2002 (B) 2002 (C)
Domestic offices (excluding loansbooked at offshore markets) 1,107,555 (275,882) (71,418) 1,383,437 1,178,974
Manufacturing 76,795 (26,700) (2,681) 103,495 79,476
Agriculture - - - - -Forestry 30 (7) (3) 37 33
Fishery 1,572 230 615 1,342 957
Mining 129 (192) (94) 321 223
Construction 7,872 (10,062) (3,965) 17,934 11,837
Utilities 135,204 (42,325) (17,029) 177,529 152,233
Media and Communication 124,560 (47,833) (35,524) 172,393 160,084
Wholesale and Retail 17,190 (7,959) 1,921 25,149 15,269
Banks and other financial institutions 197,722 135,747 48,835 61,975 148,887
Real estate 77,800 (33,979) (11,361) 111,779 89,161
Services 52,767 (32,308) (15,228) 85,075 67,995
Municipal government 37,773 (3,571) (2,680) 41,344 40,453
Other industries 378,134 (206,922) (34,225) 585,056 412,359 Overseas offices and loans booked
at offshore markets - - - - -
Total 1,107,555 (275,882) (71,418) 1,383,437 1,178,974
(5) Domestic consumer loans [Trust accounts] (in millions of yen)As of Increase/ Increase/ As of As of
March 31, (Decrease) (Decrease) March 31, September 30,2003 (A) (A) - (B) (A) - (C) 2002 (B) 2002 (C)
Total domestic consumer loans 268,405 (48,207) (22,957) 316,612 291,362
Housing loans 265,050 (47,171) (22,474) 312,222 287,524
Others 3,354 (1,035) (482) 4,390 3,837
(6) Domestic loans to small and medium-sized companies [Trust accounts] (in millions of yen)As of Increase/ Increase/ As of As of
March 31, (Decrease) (Decrease) March 31, September 30,2003 (A) (A) - (B) (A) - (C) 2002 (B) 2002 (C)
Domestic loans to small and medium-sized companies 666,401 (117,204) (3,601) 783,605 670,002
60.16% 3.52% 3.33% 56.64% 56.82%Percentage to total domestic loans
61
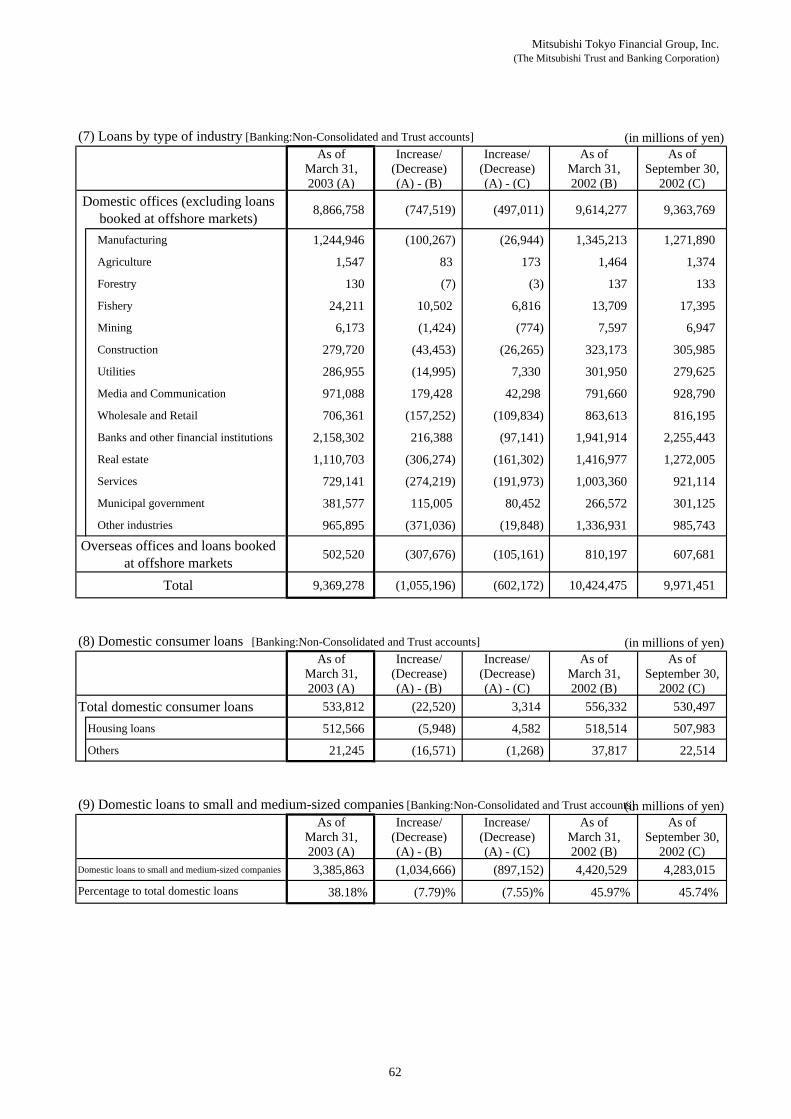
Mitsubishi Tokyo Financial Group, Inc.(The Mitsubishi Trust and Banking Corporation)
(7) Loans by type of industry [Banking:Non-Consolidated and Trust accounts] (in millions of yen)As of Increase/ Increase/ As of As of
March 31, (Decrease) (Decrease) March 31, September 30,2003 (A) (A) - (B) (A) - (C) 2002 (B) 2002 (C)
Domestic offices (excluding loansbooked at offshore markets) 8,866,758 (747,519) (497,011) 9,614,277 9,363,769
Manufacturing 1,244,946 (100,267) (26,944) 1,345,213 1,271,890
Agriculture 1,547 83 173 1,464 1,374
Forestry 130 (7) (3) 137 133
Fishery 24,211 10,502 6,816 13,709 17,395
Mining 6,173 (1,424) (774) 7,597 6,947
Construction 279,720 (43,453) (26,265) 323,173 305,985
Utilities 286,955 (14,995) 7,330 301,950 279,625
Media and Communication 971,088 179,428 42,298 791,660 928,790
Wholesale and Retail 706,361 (157,252) (109,834) 863,613 816,195
Banks and other financial institutions 2,158,302 216,388 (97,141) 1,941,914 2,255,443
Real estate 1,110,703 (306,274) (161,302) 1,416,977 1,272,005
Services 729,141 (274,219) (191,973) 1,003,360 921,114
Municipal government 381,577 115,005 80,452 266,572 301,125
Other industries 965,895 (371,036) (19,848) 1,336,931 985,743 Overseas offices and loans booked
at offshore markets 502,520 (307,676) (105,161) 810,197 607,681
Total 9,369,278 (1,055,196) (602,172) 10,424,475 9,971,451
(8) Domestic consumer loans [Banking:Non-Consolidated and Trust accounts] (in millions of yen)As of Increase/ Increase/ As of As of
March 31, (Decrease) (Decrease) March 31, September 30,2003 (A) (A) - (B) (A) - (C) 2002 (B) 2002 (C)
Total domestic consumer loans 533,812 (22,520) 3,314 556,332 530,497
Housing loans 512,566 (5,948) 4,582 518,514 507,983
Others 21,245 (16,571) (1,268) 37,817 22,514
(9) Domestic loans to small and medium-sized companies [Banking:Non-Consolidated and Trust accounts](in millions of yen)As of Increase/ Increase/ As of As of
March 31, (Decrease) (Decrease) March 31, September 30,2003 (A) (A) - (B) (A) - (C) 2002 (B) 2002 (C)
Domestic loans to small and medium-sized companies 3,385,863 (1,034,666) (897,152) 4,420,529 4,283,015
38.18% (7.79)% (7.55)% 45.97% 45.74%Percentage to total domestic loans
62
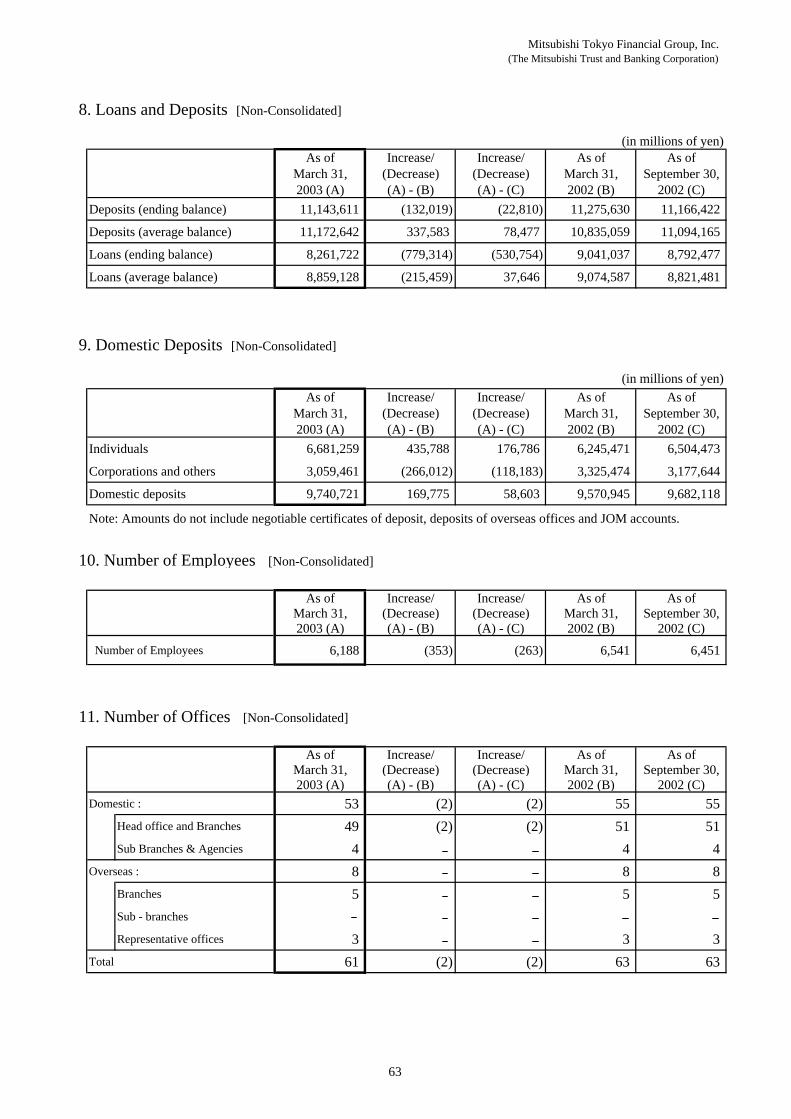
Mitsubishi Tokyo Financial Group, Inc.(The Mitsubishi Trust and Banking Corporation)
8. Loans and Deposits [Non-Consolidated]
(in millions of yen)As of Increase/ Increase/ As of As of
March 31, (Decrease) (Decrease) March 31, September 30,2003 (A) (A) - (B) (A) - (C) 2002 (B) 2002 (C)
Deposits (ending balance) 11,143,611 (132,019) (22,810) 11,275,630 11,166,422
Deposits (average balance) 11,172,642 337,583 78,477 10,835,059 11,094,165
Loans (ending balance) 8,261,722 (779,314) (530,754) 9,041,037 8,792,477
Loans (average balance) 8,859,128 (215,459) 37,646 9,074,587 8,821,481
9. Domestic Deposits [Non-Consolidated]
(in millions of yen)As of Increase/ Increase/ As of As of
March 31, (Decrease) (Decrease) March 31, September 30,2003 (A) (A) - (B) (A) - (C) 2002 (B) 2002 (C)
Individuals 6,681,259 435,788 176,786 6,245,471 6,504,473
Corporations and others 3,059,461 (266,012) (118,183) 3,325,474 3,177,644
Domestic deposits 9,740,721 169,775 58,603 9,570,945 9,682,118
Note: Amounts do not include negotiable certificates of deposit, deposits of overseas offices and JOM accounts.
10. Number of Employees [Non-Consolidated]
As of Increase/ Increase/ As of As ofMarch 31, (Decrease) (Decrease) March 31, September 30,2003 (A) (A) - (B) (A) - (C) 2002 (B) 2002 (C)
Number of Employees 6,188 (353) (263) 6,541 6,451
11. Number of Offices [Non-Consolidated]
As of Increase/ Increase/ As of As ofMarch 31, (Decrease) (Decrease) March 31, September 30,2003 (A) (A) - (B) (A) - (C) 2002 (B) 2002 (C)
Domestic : 53 (2) (2) 55 55 Head office and Branches 49 (2) (2) 51 51 Sub Branches & Agencies 4 4 4
Overseas : 8 8 8 Branches 5 5 5 Sub - branches
Representative offices 3 3 3 Total 61 (2) (2) 63 63
63
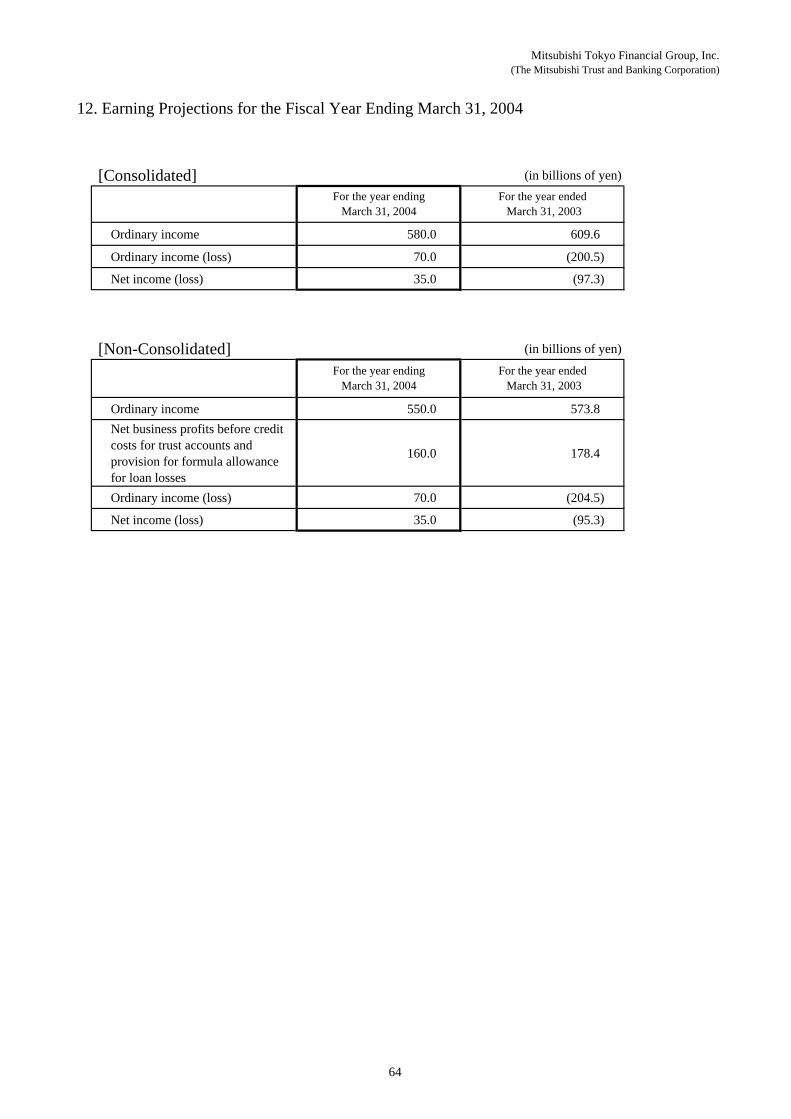
Mitsubishi Tokyo Financial Group, Inc.(The Mitsubishi Trust and Banking Corporation)
[Consolidated] (in billions of yen)
Ordinary income 580.0 609.6
Ordinary income (loss) 70.0 (200.5)
Net income (loss) 35.0 (97.3)
[Non-Consolidated] (in billions of yen)
Ordinary income 550.0 573.8Net business profits before creditcosts for trust accounts andprovision for formula allowancefor loan losses
160.0 178.4
Ordinary income (loss) 70.0 (204.5)
Net income (loss) 35.0 (95.3)
For the year endingMarch 31, 2004
For the year ended March 31, 2003
12. Earning Projections for the Fiscal Year Ending March 31, 2004
For the year endingMarch 31, 2004
For the year ended March 31, 2003
64