Embed Size (px)
Citation preview
SELECTED MILLENNIUM DEVELOPMENT GOALS
(MDG) INDICATORS
Department of Census and Statistics Sri Lanka

A. G. W. NanayakkaraDirector General
Department of Census and Statistics,P.O. Box 563,Maitland Crescent,Colombo 07. January, 2005.
Tel: +94 - 011 - 2682176E-mail: [email protected]: www.statistics.gov.lk
Any suggestions for the improvement of this publication from the users and producers ofdata will be most welcome.
Preface
“Selected Millennium Development Goals (MDG) Indicators for Sri Lanka" isthe first issue prepared by the Department of Census and Statistics (DCS). This contains selectedMDG indicators which can easily be prepared by DCS from its Censuses, surveys and otheradministrative records.
Of the 48 indicators developed by the United Nations, this publication contains onlytwenty three. UN definitions and method of computation for each indicator was carefully examinedbefore the computation was done. If it is different from what has been used, methods used arealso given with a clarification for each indicator. Considering the national requirement, eachindicator is given not only at national level, but also at Province, District and by gender where everpossible. Every effort was made to include most comprehensive and upto date information onMillennium Development Indicators of Sri Lanka. I hope that these data will serve the needs ofpolicy planners and other data users.
The preparation of this report was done by Mrs. D. B. P. S. Vidyaratne, Director (1)and Ms. W. J. Nigamuni, Senior Statistician of this department. Different subject matter divisionssupplied the information. Contributions were made by Ms. Inoka Randeniya, Coding Clerk whocomputer typeset the report, staff of the publication division, Mr. H. A. Samarasinghe and his stafffor printing of this report. Contributions made by all of them are grateful appreciated.

Goal 1: Eradicate extreme poverty and hungerTarget 1: Halve, between 1990 and 2015, the proportion of people whose
income is less than one dollar a day1-A. Poverty headcount ratio (percentage of population below the national poverty line) 2. Poverty gap ratio [incidence multiplied by depth of poverty]3. Share of poorest quintile in national consumption
Target 2: Halve, between 1990 and 2015, the proportion of people whosuffer from hunger4. Prevalence of underweight children under five years of age5. Proportion of the population below minimum level of dietary energy consumption
Goal 2: Achieve universal primary educationTarget 3: Ensure that, by 2015, children everywhere, boys and girls alike,
will be able to complete a full course of primary schooling6. Net enrolment ratio in primary education
6 – 10 years11 – 14 years
7. Proportion of pupils starting grade 1 who reach grade 58. Literacy rate of 15-24 year-olds
Goal 3: Promote gender equality and empower womenTarget 4: Eliminate gender disparity in primary and secondary education,
preferably by 2005, and in all levels of education no later than 20159. Ratio of girls to boys in primary, secondary and tertiary education
Primary 6 – 10 yearsJunior secondary 11 – 14 yearsSenior secondary 15 – 19 yearsTertiary 20 -24 years
10. Ratio of literate women to men, 15-24 years old11. Share of women in wage employment in the non-agricultural sector
Goal 4: Reduce child mortalityTarget 5: Reduce by two thirds, between 1990 and 2015, the under-five
mortality rate13. Under-five mortality rate14. Infant mortality rate15. Proportion of 1 year-old children immunized against measles
Contents
Millennium Development Goals (MDGs) Indicators

Goal 5: Improve maternal healthTarget 6: Reduce by three quarters, between 1990 and 2015, the maternal
mortality ratio16. Maternal mortality ratio17. Proportion of births attended by skilled health personnel
Goal 6: Combat HIV/AIDS, malaria and other diseasesTarget 7: Have halted by 2015 and begun to reverse the spread of HIV/AIDS
19. Condom use rate of the contraceptive prevalence rate19c. Contraceptive prevalence rate
Goal 7: Ensure environmental sustainabilityTarget 9: Integrate the principles of sustainable development into country
policies and programmes and reverse the loss of environmentalresources29. Proportion of the population using solid fuels
Target 10: Halve, by 2015, the proportion of people without sustainable access to safe drinking water and basic sanitation30. Proportion of population with sustainable access to an improved water source, urban and rural31. Proportion of population with access to improved sanitation, urban and rural
Target 11: By 2020, to have achieved a significant improvement in the lives of at least 100 million slum dwellers32. Proportion of households with access to secure tenure
Goal 8: Develop a global partnership for developmentTarget 16: In cooperation with developing countries, develop and implement
strategies for decent and productive work for youth 45. Unemployment rate of young people aged 15-24 years, each sex and total
Target 18: In cooperation with the private sector, make available the benefits of new technologies, especially information and communicationtechnologies48. Personal computers in use per 100 population48b. Internet users per 100 population

Goal 1. Eradicate extreme poverty and hunger
1. Indicator
1990/ 91 200226.1 22.7
2. Definition
United Nations Definition
Definition used
3. Method of computation
Method of computation given by United Nations
Method of computation used
4. Data source, geographical coverage and periodicity
4.1 Data source and geographical coverage
Data source : Household Income and Expenditure Survey - 1990/91 , 2002
Geographical coverage : All districts other than districts in Northern and Eastern provinces in Sri Lanka
4.2 Periodicity Once in 5 years
5. Accuracy and data limitations
Once the number of households that are below the poverty line has been estimated, the number of peoplein those households is aggregated to estimate the percentage of the population below the line.
Target 1. Halve, between 1990 and 2015, the proportion of people whose income is less than one dollar aday
Same as the UN method of computation.
The poverty headcount ratio is the proportion of the national population whose incomes are below theofficial threshold (or thresholds) set by the national Government. National poverty lines are usually set forhouseholds of various compositions to allow for different family sizes. Where there are no official povertylines, they may be defined as the level of income required to have only sufficient food or food plus othernecessities for survival.
Same as the UN definition
YearIndicator
1-A. Poverty headcount ratio (percentage of population below the national povertyline)
Household income (or consumption) and its distribution are estimated from household surveys (SEEINDICATOR 1). The incomes of various household types, by composition, may then be compared with thepoverty lines for those types of household. If the poverty lines are expressed in terms of income per adultequivalent or some similar measure, the incomes of the households must be measured on a similar basis.Household income may be converted to income per adult equivalent by using the modified equivalencescale of the Organisation for Economic Co-operation and Development (OECD)—in which the firsthousehold member over 16 equals 1, all others over 16 equal 0.5, all under 16 equal 0.3 —or some otherequivalence scale. Household incomes are then divided by the “equivalized” number of people in thehousehold (two adults would equal 1.5 according to the OECD scale) to establish income per person.
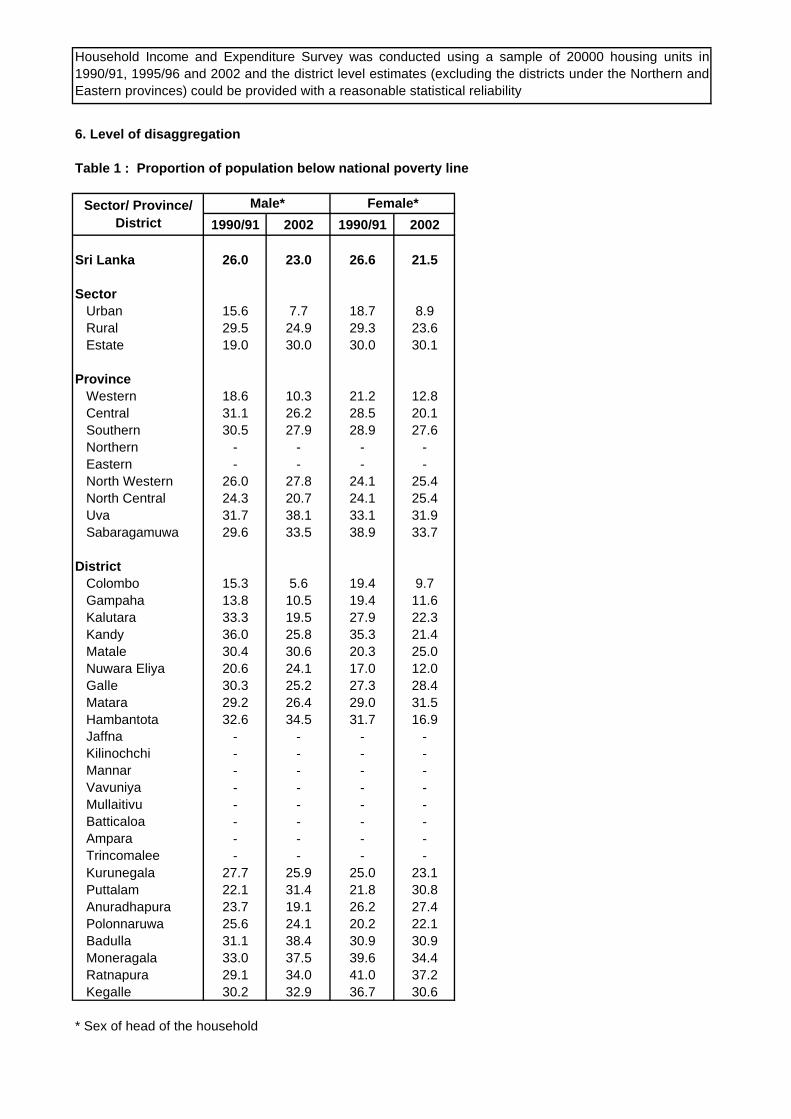
6. Level of disaggregation
Table 1 : Proportion of population below national poverty line
1990/91 2002 1990/91 2002
Sri Lanka 26.0 23.0 26.6 21.5
SectorUrban 15.6 7.7 18.7 8.9Rural 29.5 24.9 29.3 23.6Estate 19.0 30.0 30.0 30.1
ProvinceWestern 18.6 10.3 21.2 12.8Central 31.1 26.2 28.5 20.1Southern 30.5 27.9 28.9 27.6Northern - - - -Eastern - - - -North Western 26.0 27.8 24.1 25.4North Central 24.3 20.7 24.1 25.4Uva 31.7 38.1 33.1 31.9Sabaragamuwa 29.6 33.5 38.9 33.7
DistrictColombo 15.3 5.6 19.4 9.7Gampaha 13.8 10.5 19.4 11.6Kalutara 33.3 19.5 27.9 22.3Kandy 36.0 25.8 35.3 21.4Matale 30.4 30.6 20.3 25.0Nuwara Eliya 20.6 24.1 17.0 12.0Galle 30.3 25.2 27.3 28.4Matara 29.2 26.4 29.0 31.5Hambantota 32.6 34.5 31.7 16.9Jaffna - - - -Kilinochchi - - - -Mannar - - - -Vavuniya - - - -Mullaitivu - - - -Batticaloa - - - -Ampara - - - -Trincomalee - - - -Kurunegala 27.7 25.9 25.0 23.1Puttalam 22.1 31.4 21.8 30.8Anuradhapura 23.7 19.1 26.2 27.4Polonnaruwa 25.6 24.1 20.2 22.1Badulla 31.1 38.4 30.9 30.9Moneragala 33.0 37.5 39.6 34.4Ratnapura 29.1 34.0 41.0 37.2Kegalle 30.2 32.9 36.7 30.6
* Sex of head of the household
Male* Female*Sector/ Province/ District
Household Income and Expenditure Survey was conducted using a sample of 20000 housing units in1990/91, 1995/96 and 2002 and the district level estimates (excluding the districts under the Northern andEastern provinces) could be provided with a reasonable statistical reliability

1. Indicator
1990/91 20025.6 5.1
2. Definition
United Nations Definition
Definition used
3. Method of computation
Method of computation given by United Nations
q
PG = 1 � z - yi
n i =1 zWhere,z = poverty lineyi = income of individual iq = number of poor peoplen = size of the population
Where,PG = I * HWhere,
H = q I = z - yq
n zWhere,
q
Yq = 1 � yi
q i =1
Method of computation used
q
PG = 1 � z - yi
n i =1 zWhere,z = poverty lineyi = income of individual iq = number of poor peoplen = size of the population
Same as the UN definition
Year
Goal 1. Eradicate extreme poverty and hunger
Target 1. Halve, between 1990 and 2015, the proportion of people whose income is less than one dollar a day
Indicator
2. Poverty gap ratio [incidence x depth of poverty]
Poverty gap ratio is the mean distance separating the population from the poverty line (with the non-poor being given a distance of zero), expressed as a percentage of the poverty line.
The poverty gap ratio is the sum of the income gap ratios for the population below the poverty line,divided by the total population.
This can also be expressed as the product of the average income gap ratio of poor people and thehead count ratio, that is
All the formulas are calculated based on data on individuals (yi = individual income or consumption).If household level data are used, the formulas have to be adjusted by the weight wi, which is thehousehold size times sampling expansion factor for every household i.
The poverty gap ratio is the sum of the income gap ratios for the population below the poverty line,divided by the total population.

4. Data source, geographical coverage and periodicity
4.1 Data source and geographical coverageData source :Household Income and Expenditure Survey - 1990/91 , 2002
Geographical coverage : All districts other than districts in Northern & Eastern provinces in Sri Lanka
4.2 Periodicity Once in 5 years
5. Accuracy and data limitationsHousehold Income and Expenditure Survey was conducted using a sample of 20000 housing units in1990/91, 1995/96 and 2002 and the district level estimates (excluding the districts under the Northernand Eastern provinces) could be provided with a reasonable statistical reliability

6. Level of disaggregation
Table 1: Poverty gap ratio in Sri Lanka
2002
Sri Lanka 4.8
SectorUrban 2.1Rural 5.3Estate 5.4
ProvinceWestern 2.8Central 4.2Southern 5.8Northern -Eastern -North Western 6.4North Central 4.4Uva 8.1Sabaragamuwa 8.0
DistrictColombo 1.9Gampaha 2.8Kalutara 4.9Kandy 4.5Matale 6.1Nuwara Eliya 1.8Galle 5.3Matara 7.5Hambantota 3.8Jaffna -Kilinochchi -Mannar -Vavuniya -Mullaitivu -Batticaloa -Ampara -Trincomalee -Kurunegala 5.6Puttalam 8.3Anuradhapura 4.6Polonnaruwa 4.1Badulla 7.8Moneragala 9.1Ratnapura 7.8Kegalle 8.2
* Sex of head of the household
---
8.85.23.9
5.67.0
-5.15.6
9.3
4.42.97.3
10.1
----
6.6---
-
5.24.17.57.84.03.95.56.3
----
5.96.38.5
4.6
1.12.14.2
5.56.7
1.65.6
--
Male*
3.8
1990/91
5.1
7.18.0
3.42.4
--
6.84.36.85.9
5.36.0
7.3
5.3
------
7.76.07.6
8.57.17.89.8
5.14.2
5.36.2
6.4
6.0--
5.33.8
5.9
4.39.17.5
6.96.6
8.08.9
--
5.34.56.66.7
6.1
6.1
2.1
5.5
Female*
6.0
Sector/ Province/ District 1990/91 2002
3.46.32.9
4.66.55.9

Goal 1. Eradicate extreme poverty and hunger
1. Indicator
1990/91 20028.9 7.0
2. Definition
United Nations Definition
Definition used
3. Method of computation
Method of computation given by United Nations
Method of computation used
4. Data source, geographical coverage and periodicity
4.1 Data source and geographical coverage
Data source : Household Income and Expenditure Survey - 1995/96, 2002
Geographical coverage : All districts other than districts in Northern and Eastern provinces in Sri Lanka
4.2 PeriodicityOnce in 5 years
5. Accuracy and data limitations
Household Income and Expenditure Survey was conducted using a sample of 20000 housing units in1990/91, 1995/96 and 2002 and the district level estimates (excluding the districts under the Northern andEastern provinces) could be provided with a reasonable statistical reliability
Same as the UN method of computation. But real per capita expenditure was used instead of per capitaincome.
Household income and its distribution are estimated from household surveys. Household income isadjusted for household size to provide a more consistent measure of per capita income for consumption.Household income is divided by the number of people in the household to establish income per person.The population is then ranked by income. The income of the bottom fifth is expressed as a percentage ofaggregate household income. The calculations are made in local currency, without adjustment for pricechanges or exchange rates or for spatial differences in cost of living within countries, because the dataneeded for such calculations are generally unavailable.
Target 1. Halve, between 1990 and 2015, the proportion of people whose income is less than one dollara day
Share of the poorest quintile in national consumption is the income that accrues to the poorest fifth of thepopulation.
Same as the UN definition. But, real per capita expenditure was used instead of per capita income.
YearIndicator
3. Share of poorest quintile in national consumption

6. Level of disaggregation
Table 1: Share of poorest quintile in national consumption
1990/91 2002 1990/91 2002
Sri Lanka 8.8 7.2 9.3 6.2
SectorUrban 3.4 1.1 4.6 1.7Rural 11.4 8.4 11.3 7.3Estate 5.0 15.2 13.7 10.3
ProvinceWestern 4.3 1.7 5.8 2.4Central 10.8 9.3 10.2 5.8Southern 11.4 11.1 10.6 8.7Northern - - - -Eastern - - - -North Western 11.7 11.0 11.3 10.2North Central 11.0 8.6 9.8 10.2Uva 13.1 17.4 12.6 11.2Sabaragamuwa 11.1 13.4 16.5 13.2
DistrictColombo 2.7 0.6 4.7 1.8Gampaha 3.7 1.8 5.1 2.5Kalutara 10.5 4.5 10.2 4.0Kandy 13.0 7.6 12.8 6.0Matale 12.9 13.3 8.6 10.4Nuwara Eliya 4.8 10.5 4.7 2.0Galle 11.0 7.9 9.8 7.4Matara 10.8 10.3 10.5 10.3Hambantota 12.9 19.3 12.1 8.4Jaffna - - - -Kilinochchi - - - -Mannar - - - -Vavuniya - - - -Mullaitivu - - - -Batticaloa - - - -Ampara - - - -Trincomalee - - - -Kurunegala 12.5 10.8 11.7 9.0Puttalam 9.8 11.6 10.1 13.5Anuradhapura 11.8 8.0 14.3 11.1Polonnaruwa 9.2 9.9 3.8 8.8Badulla 12.5 17.9 10.9 10.0Moneragala 14.5 16.7 17.7 15.6Ratnapura 9.8 13.4 15.9 14.7Kegalle 12.8 13.4 17.2 11.8
* Sex of head of the household
Male* Female*Sector/ Province/ District

1. Indicator
1993 20004. Prevalence of underweight children under 5 years of age 37.7 29.4
2. Definition
United Nations Definition
Definition used
4. Data source, geographical coverage and periodicity
4.1 Data source and geographical coverageData source :Sri Lanka Demographic & Health Survey 1993, 2000
Geographical coverage :
4.2 PeriodicityOnce in 5 years
5. Accuracy and data limitations
6. Level of disaggregation
The weights of the under -five child population in a country are compared with the weights given in theNCHS/ WHO table of child weights for each age group. The percentages of children in each age groupwhose weights are more than 2 standard deviations less than the median are then aggregated to form thetotal percentage of children under age 5 who are underweight.
Method of computation given by United Nations
Same as the UN method of computation.
Target group was confined to children aged 3-59 months only, due to difficulty in measuring theparameters accurately for infants < 3 months.
The country has been stratified into nine zones on the basis of socio - economic and ecological criteriabut both surveys (1993, 2000) were conducted only for seven zones, excluding the zone 8th and zone 9th(Eastern and Northern provinces) due to the unsettled conditions that prevailed in these zones.
Method of computation used
Goal 1. Eradicate extreme poverty and hunger
Target 2. Halve, between 1990 and 2015, the proportion of people who suffer from hunger
IndicatorYear
Prevalence of (moderately or severely) underweight children is the percentage of children under fiveyears old whose weight for age is less than minus two standard deviations from the median for theinternational reference population ages 0-59 months. The international reference population wasformulated by the National Center for Health Statistics (NCHS) as a reference for the United States andlater adopted by the World Health Organization (WHO) for international use (often referred to as theNCHS/WHO reference population).
Same as the UN definition. But target group was confined to children aged 3-59 months. Infants less than3 months were not considered.
3. Method of computation

Table 1: Prevalence of underweight children under 5 years of age
1993 2000Sri Lanka 37.7 29.4
SexMale 34.8 29.0Female 40.9 29.8
Sector Colombo metro 31.2 18.2Other urban 29.9 21.3Rural 38.3 30.8Estate 52.1 44.1
ZoneZone 1 31.2 18.2Zone 2 25.2 20.2Zone 3 34.6 28.9Zone 4 38.1 30.6Zone 5 43.7 37.8Zone 6 44.9 32.2Zone 7 48.0 36.9
Zone1 Part of Colombo, Gampaha districts
Zone2 Part of Colombo, Gampaha, Kalutara districts
Zone3 Full districts of Galle, Matara
Part of Kalutara district
Zone4 Full district of Matale
Part of Kurunegala, Kegale, Ratnapura districts
Zone5 Full districts of Badulla, Nuwara Eliya, Kandy
Part of Kegalle, Ratnapura districts
Zone6 Full district of Polonnaruwa
Part of Anuradhapura, Hambantota districts
Zone7 Full districts of Puttalam, Moneragala
Part of Kurunegala, Anuradhapura, Hambantota districts
Table 2: Prevalence of underweight children under 5 years of age
1993 2000Child's age in months
3-5 5.8 0.76-11 17.9 20.212-23 36.3 28.824-35 42.4 34.036-47 46.7 30.748-59 43.0 37.9
Previous birth interval<2 years 48.1 35.62-3 years 43.7 36.84 years or more 32.7 30.8First birth 31.5 24.6Twins 44.4 25.9
Educational level of motherNo schooling 53.9 48.0Primary 47.8 41.4secondary 39.1 31.7G.C.E. (O/L) 24.6 24.8G.C.E. (A/L) & higher 13.3
Year
Child's age in months/ Previous birth interval/ Educational level of mother
Sex/ Sector/ Zone
Year

Goal 1. Eradicate extreme poverty and hunger
1. Indicator
1990/91 200250.9 51.3
2. Definition
United Nations Definition
Definition used
3. Method of computation
Method of computation given by United Nations
Method of computation used
4. Data source, geographical coverage and periodicity
4.1 Data source and geographical coverage
Data source : Household Income and Expenditure Survey - 1990/91, 2002
Geographical coverage : All districts other than districts in Northern and Eastern provinces in Sri Lanka
4.2 PeriodicityOnce in 5 years
Target 2. Halve, between 1990 and 2015, the proportion of people who suffer from hunger
Proportion of the population below the minimum level of dietary energy consumption is the percentage of thepopulation whose food intake falls below the minimum level of dietary energy requirements. This is alsoreferred to as the prevalence of under-nourishment, which is the percentage of the population that isundernourished.
YearIndicator
5. Proportion of the population below minimum level of dietary energy consumption
Same as the UN definition.
Estimation of the proportion of people with insufficient food (undernourishment) involves specification of thedistribution of dietary energy consumption, considering the total food availability (from national globalstatistics) and inequality in access to food (from national household surveys). The distribution is used inestimating the proportion of the population below a minimum energy requirement level or cut-off point. The cut-off point is estimated as a population per capita average value, based on dietary energy needed by differentage and gender groups and the proportion of the population represented by each age group. The estimatesare not normally available in countries. The Food and Agriculture Organization of the United Nations (FAO)prepares the estimates at the national level. They are then aggregated to obtain regional and globalestimates.
Estimation of the proportion of people with insufficient food (undernourishment) involves specification of thedistribution of dietary energy consumption, considering the total food availability (from national globalstatistics) and inequality in access to food (from national household surveys). The distribution is assumed tobe unimodal and skewed. The log-normal function is used in estimating the proportion of the population belowa minimum energy requirement level or cut-off point. The cut-off point is estimated as a population per capitaaverage value, based on dietary energy needed by different age and gender groups and the proportion of thepopulation represented by each age group. The estimates are not normally available in countries. The Foodand Agriculture Organization of the United Nations (FAO) prepares the estimates at the national level. Theyare then aggregated to obtain regional and global estimates.

5. Accuracy and data limitations
6. Level of disaggregation
Table 1: Proportion of population below minimum level of dietary energy consumption
1990/91 2002 1990/91 2002
Sri Lanka 50.8 51.1 51.8 52.2
SectorUrban 56.3 58.4 62.4 58.6Rural 51.3 51.7 48.7 52.1Estate 30.0 28.6 39.7 31.4
ProvinceWestern 53.6 54.2 57.1 56.2Central 49.6 45.1 47.8 44.2Southern 57.0 54.5 54.7 53.4Northern - - - -Eastern - - - -North Western 43.9 52.6 41.7 55.9North Central 49.0 42.3 42.6 43.4Uva 47.2 47.1 51.2 43.6Sabaragamuwa 48.8 52.2 54.5 53.3
DistrictColombo 54.7 54.9 65.1 58.1Gampaha 50.2 54.7 46.4 54.3Kalutara 56.8 52.1 54.4 56.6Kandy 57.3 50.4 54.0 47.0Matale 43.9 58.5 45.8 59.1Nuwara Eliya 36.7 28.7 32.9 23.4Galle 56.8 54.9 53.3 55.5Matara 57.1 55.0 56.6 58.2Hambantota 57.1 53.2 54.5 37.3Jaffna - - - -Kilinochchi - - - -Mannar - - - -Vavuniya - - - -Mullaitivu - - - -Batticaloa - - - -Ampara - - - -Trincomalee - - - -Kurunegala 40.7 49.1 38.2 52.8Puttalam 51.7 59.3 50.1 63.2Anuradhapura 51.0 44.7 45.2 45.1Polonnaruwa 44.3 37.3 37.8 40.7Badulla 49.4 47.7 52.9 45.1Moneragala 43.1 46.0 46.1 39.6Ratnapura 46.3 47.2 49.5 47.2Kegalle 51.9 59.2 59.8 58.7
* Sex of head of the household
Male* Female*
Household Income and Expenditure Survey was conducted using a sample of 20000 housing units in1990/91, 1995/96 and 2002 and the district level estimates (excluding the districts under the Northern andEastern provinces) could be provided with a reasonable statistical reliability
Sector/ Province/ District

Goal 2. Achieve universal primary education
1. Indicator
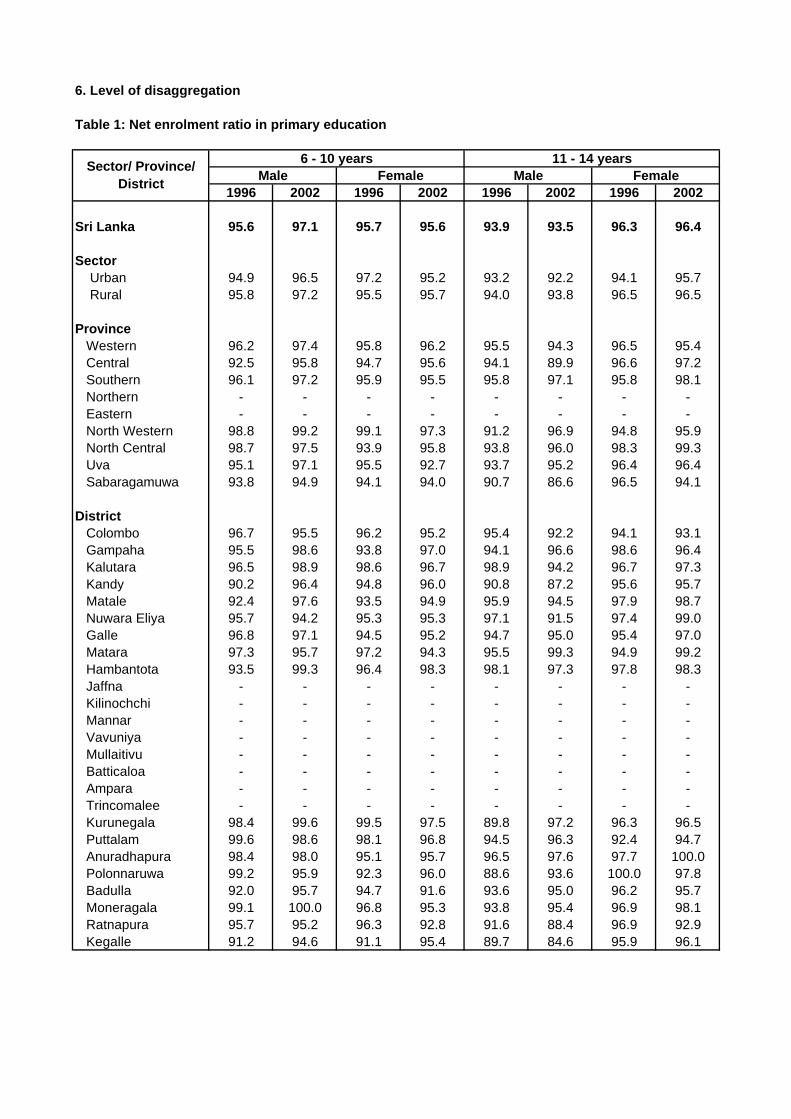
1996 20026. Net enrolment ratio in primary education
6 - 10 years 95.7 96.311 - 14 years 93.8 96.3
2. Definition
United Nations Definition
Definition used
3. Method of computation
Method of computation given by United Nations
Method of computation used
4. Data source, geographical coverage and periodicity
4.1 Data source and geographical coverage
Data source :Sri Lanka Labour Force Survey
Geographical coverage : All districts other than districts in Northern and Eastern provinces in Sri Lanka
4.2 PeriodicityQuarterly
5. Accuracy and data limitations
Target 3. Ensure that, by 2015, children everywhere, boys and girls alike, will be able to complete a fullcourse of primary schooling
Net primary enrolment ratio is the ratio of the number of children of official school age (as defined by thenational education system) who are enrolled in primary school to the total population of children of officialschool age. Primary education provides children with basic reading, writing, and mathematics skills alongwith an elementary understanding of such subjects as history, geography, natural science, social science,art and music.
Same as the UN method of computation.
Sri Lanka Labour Force Survey was conducted using a sample of 16000 housing units until 2003 and thedistrict level estimates (excluding the districts under the Northern and Eastern provinces) could be providedwith a reasonable statistical reliability. Survey operations have commenced in the districts under theNorthern and Eastern provinces in 2004 and district level estimates for these districts could also be provided2004 onwards
Same as the UN definition.
The indicator is calculated as the number of enrolled students within the appropriate age cohort according toschool records as reported to ministries of education, divided by the number of children of primary schoolage.
YearIndicator
6. Level of disaggregation
Table 1: Net enrolment ratio in primary education
1996 2002 1996 2002 1996 2002 1996 2002
Sri Lanka 95.6 97.1 95.7 95.6 93.9 93.5 96.3 96.4
Sector Urban 94.9 96.5 97.2 95.2 93.2 92.2 94.1 95.7 Rural 95.8 97.2 95.5 95.7 94.0 93.8 96.5 96.5
ProvinceWestern 96.2 97.4 95.8 96.2 95.5 94.3 96.5 95.4Central 92.5 95.8 94.7 95.6 94.1 89.9 96.6 97.2Southern 96.1 97.2 95.9 95.5 95.8 97.1 95.8 98.1Northern - - - - - - - -Eastern - - - - - - - -North Western 98.8 99.2 99.1 97.3 91.2 96.9 94.8 95.9North Central 98.7 97.5 93.9 95.8 93.8 96.0 98.3 99.3Uva 95.1 97.1 95.5 92.7 93.7 95.2 96.4 96.4Sabaragamuwa 93.8 94.9 94.1 94.0 90.7 86.6 96.5 94.1
DistrictColombo 96.7 95.5 96.2 95.2 95.4 92.2 94.1 93.1Gampaha 95.5 98.6 93.8 97.0 94.1 96.6 98.6 96.4Kalutara 96.5 98.9 98.6 96.7 98.9 94.2 96.7 97.3Kandy 90.2 96.4 94.8 96.0 90.8 87.2 95.6 95.7Matale 92.4 97.6 93.5 94.9 95.9 94.5 97.9 98.7Nuwara Eliya 95.7 94.2 95.3 95.3 97.1 91.5 97.4 99.0Galle 96.8 97.1 94.5 95.2 94.7 95.0 95.4 97.0Matara 97.3 95.7 97.2 94.3 95.5 99.3 94.9 99.2Hambantota 93.5 99.3 96.4 98.3 98.1 97.3 97.8 98.3Jaffna - - - - - - - -Kilinochchi - - - - - - - -Mannar - - - - - - - -Vavuniya - - - - - - - -Mullaitivu - - - - - - - -Batticaloa - - - - - - - -Ampara - - - - - - - -Trincomalee - - - - - - - -Kurunegala 98.4 99.6 99.5 97.5 89.8 97.2 96.3 96.5Puttalam 99.6 98.6 98.1 96.8 94.5 96.3 92.4 94.7Anuradhapura 98.4 98.0 95.1 95.7 96.5 97.6 97.7 100.0Polonnaruwa 99.2 95.9 92.3 96.0 88.6 93.6 100.0 97.8Badulla 92.0 95.7 94.7 91.6 93.6 95.0 96.2 95.7Moneragala 99.1 100.0 96.8 95.3 93.8 95.4 96.9 98.1Ratnapura 95.7 95.2 96.3 92.8 91.6 88.4 96.9 92.9Kegalle 91.2 94.6 91.1 95.4 89.7 84.6 95.9 96.1
Sector/ Province/ District
Male FemaleMale Female6 - 10 years 11 - 14 years

Goal 2. Achieve universal primary education
1. Indicator
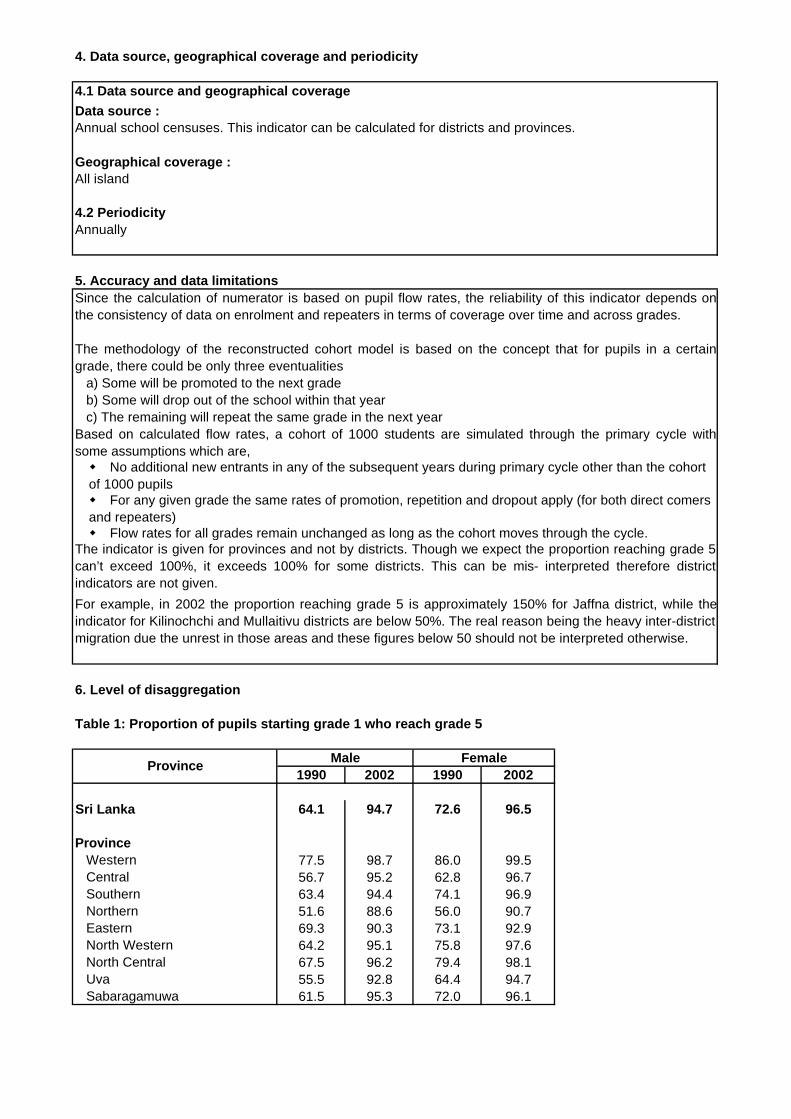
1990 20027. Proportion of pupils starting grade 1 who reach grade 5 68.1 95.6
2. Definition
United Nations Definition
Definition usedSame as the UN definition.
3. Method of computation
Method of computation given by United Nations
Method of computation used
Same as the UN method of computation.
The proportion of pupils starting grade 1 who reach grade 5 =
X 100
The indicator is typically estimated from data on enrolment and repetition by grade for two consecutiveyears, in a procedure called the reconstructed cohort method. This method makes three assumptions:dropouts never return to school; promotion, repetition and dropout rates remain constant over the entireperiod in which the cohort is enrolled in school; and the same rates apply to all pupils enrolled in a givengrade, regardless of whether they previously repeated a grade.The calculation is made by dividing the total number of pupils belonging to a school cohort who reach eachsuccessive grade of the specified level of education by the number of pupils in the school cohort (in thiscase students originally enrolled in grade 1 of primary education) and multiplying the result by 100.When estimated from household survey data, the proportion is estimated as the product of the proportionsof transition for each grade up to grade 5. The estimation follows the method of the United NationsEducational, Scientific and Cultural Organization (UNESCO).
The numerator was estimated using data on enrolment and repetition by grade for two consecutive years, ina procedure called the reconstructed cohort method. The year corresponding to the indicator is the year that cohort started grade 1, not the year they reachgrade 5.
Number of pupils in the school cohort (originally enrolled in grade 1 of primary education)
Total number of pupils belonging to a school cohort who reach each successive grade of the level of primary education
Target 3. Ensure that, by 2015, children everywhere, boys and girls alike, will be able to complete a fullcourse of primary schooling
IndicatorYear
The proportion of pupils starting grade 1 who reach grade 5, known as the survival rate to grade 5, is thepercentage of a cohort of pupils enrolled in grade 1 of the primary level of education in a given school yearwho are expected to reach grade 5.
4. Data source, geographical coverage and periodicity
4.1 Data source and geographical coverage
Data source :Annual school censuses. This indicator can be calculated for districts and provinces.
Geographical coverage :All island
4.2 PeriodicityAnnually
5. Accuracy and data limitations
6. Level of disaggregation
Table 1: Proportion of pupils starting grade 1 who reach grade 5
1990 2002 1990 2002
Sri Lanka 64.1 94.7 72.6 96.5
ProvinceWestern 77.5 98.7 86.0 99.5Central 56.7 95.2 62.8 96.7Southern 63.4 94.4 74.1 96.9Northern 51.6 88.6 56.0 90.7Eastern 69.3 90.3 73.1 92.9North Western 64.2 95.1 75.8 97.6North Central 67.5 96.2 79.4 98.1Uva 55.5 92.8 64.4 94.7Sabaragamuwa 61.5 95.3 72.0 96.1
Male Female
w No additional new entrants in any of the subsequent years during primary cycle other than the cohort of 1000 pupilsw For any given grade the same rates of promotion, repetition and dropout apply (for both direct comers and repeaters)w Flow rates for all grades remain unchanged as long as the cohort moves through the cycle.
Province
c) The remaining will repeat the same grade in the next year
The methodology of the reconstructed cohort model is based on the concept that for pupils in a certaingrade, there could be only three eventualities
a) Some will be promoted to the next gradeb) Some will drop out of the school within that year
Based on calculated flow rates, a cohort of 1000 students are simulated through the primary cycle withsome assumptions which are,
The indicator is given for provinces and not by districts. Though we expect the proportion reaching grade 5can’t exceed 100%, it exceeds 100% for some districts. This can be mis- interpreted therefore districtindicators are not given.
For example, in 2002 the proportion reaching grade 5 is approximately 150% for Jaffna district, while theindicator for Kilinochchi and Mullaitivu districts are below 50%. The real reason being the heavy inter-districtmigration due the unrest in those areas and these figures below 50 should not be interpreted otherwise.
Since the calculation of numerator is based on pupil flow rates, the reliability of this indicator depends onthe consistency of data on enrolment and repeaters in terms of coverage over time and across grades.

Goal 2. Achieve universal primary education
1. Indicator
Year2001
8. Literacy rate of 15-24 year-olds 95.6
2. Definition
United Nations Definition
Definition used
3. Method of computation
Method of computation given by United Nations
Method of computation used
4. Data source, geographical coverage and periodicity
4.1 Data source and geographical coverage Data source:Census of Population and Housing 2001
Geographical coverage: Only for completely enumerated districts in Census of Population and Housing 2001
4.2 PeriodicityOnce in 10 years
5. Accuracy and data limitations
Divide the number of people ages 15-24 who are literate by the total population in the same age groupand multiply the total by 100.
The census enumeration was able to carry out completely in 18 districts out of 25 districts due to theunsettled conditions in Northern and Eastern provinces. This includes Ampara district in Easternprovince and the 17 districts not belonging to Northern and Eastern provinces.
The usual method of computation is to divide the number of people ages 15–24 who are literate by thetotal population in the same age group and to multiply the total by 100. Since literacy data are notalways available for all countries and all censuses, the UNESCO Institute for Statistics uses modelingtechniques to produce annual estimates based on literacy information obtained from national censusesand surveys.
Target 3 - Ensure that, by 2015, children everywhere, boys and girls alike, will be able to complete afull course of primary schooling.
Indicator
Literacy rate of 15-24 year-olds , or the youth literacy rate, is the percentage of the population 15-24years old who can both read and write with understanding a short simple statement on everyday life.The definition of literacy sometimes extends to basic arithmetic and other life skills.
Literacy rate of 15-24 year-olds, or the youth literacy rate, is the percentage of the population 15-24years old who can both read and write with understanding a short simple statement on everyday life.

6. Level of disaggregation
Table 1: Literacy rate of 15-24 year-olds
Total Male Female
Sri Lanka 95.6 95.1 96.0
Sector Urban 95.5 94.9 96.0Rural 96.3 95.7 96.9Estate 85.5 87.0 84.0
Province
Western 96.2 95.5 97.0Central 94.9 95.0 94.8Southern 96.0 95.5 96.6Northern - - -Eastern - - -North Western 93.4 95.2 96.5North Central 95.8 95.1 96.5Uva 94.1 93.8 94.4Sabaragamuwa 94.8 94.2 95.4
DistrictColombo 95.3 94.6 96.2Gampaha 97.3 96.7 97.8Kalutara 96.0 95.2 96.8Kandy 96.4 96.4 96.5Matale 95.1 94.3 96.0Nuwara Eliya 91.8 92.7 91.0Galle 96.2 95.7 96.7Matara 95.4 94.9 96.0Hambantota 96.6 95.9 97.3Jaffna - - -Kilinochchi - - -Mannar - - -Vavuniya - - -Mullaitivu - - -Batticaloa - - -Ampara 93.5 93.1 93.9Trincomalee - - -Kurunegala 96.7 96.1 97.3Puttalam 94.2 93.5 94.9Anuradhapura 96.1 95.4 96.7Polonnaruwa 95.2 94.5 96.0Badulla 93.9 93.8 94.0Moneragala 94.5 93.8 95.2Ratnapura 94.1 93.5 94.6Kegalle 95.8 95.1 96.5
Sector/ Province/ DistrictYear 2001

Goal 3. Promote gender equality and empower women
1. Indicator
1996 2002
9. Ratio of girls to boys in primary, secondary and tertiary education Primary (6 - 10 yrs.) 94.2 94.6Junior secondary (11 - 14 yrs.) 91.2 94.8Senior secondary (15 - 19 yrs.) 107.7 101.8Tertiary (20 - 24 yrs.) 75.4 113.8
2. Definition
United Nations Definition
Definition used
3. Method of computation
Method of computation given by United Nations
Method of computation used
4. Data source, geographical coverage and periodicity
4.1 Data source and geographical coverage
Data source : Sri Lanka Labour Force Survey
Geographical coverage : All districts other than districts in Northern and Eastern provinces in Sri Lanka
4.2 PeriodicityQuarterly
5. Accuracy and data limitations
Target 4. Eliminate gender disparity in primary and secondary education, preferably by 2005, and in alllevels of education no later than 2015
Ratio of girls to boys in primary, secondary and tertiary education is the ratio of the number of femalestudents enrolled at primary, secondary and tertiary levels in public and private schools to the number ofmale students.
YearIndicator
Same as the UN definition.
The indicator is a ratio of the number of enrolled girls to enrolled boys, regardless of ages.
Same as the UN method of computation.
Sri Lanka Labour Force Survey was conducted using a sample of 16000 housing units until 2003 and thedistrict level estimates (excluding the districts under the Northern and Eastern provinces) could be providedwith a reasonable statistical reliability. Survey operations have commenced in the districts under theNorthern and Eastern provinces in 2004 and district level estimates for these districts could also beprovided 2004 onwards

6. Level of disaggregation
Table 1: Ratio of girls to boys in primary, secondary and tertiary education
6 - 10years
11 - 14 years
15 - 19years
20 - 24years
6 - 10 years
11 - 14 years
15 - 19years
20 - 24years
Sri Lanka 94.2 91.2 107.7 75.4 94.6 94.8 101.8 113.8
Sector Urban 103.3 94.0 96.9 * 90.2 97.0 89.3 * Rural 92.7 90.8 109.7 * 95.2 94.6 103.3 *
ProvinceWestern 93.8 85.0 111.3 * 93.6 84.1 96.9 *Central 89.3 92.4 111.0 * 95.0 96.2 103.2 *Southern 103.7 89.9 94.2 * 98.0 98.3 108.9 *Northern - - - - - - - -Eastern - - - - - - - -North Western 97.2 98.5 111.4 * 93.6 92.5 101.2 *North Central 77.8 79.7 105.1 * 114.0 97.7 103.9 *Uva 91.2 96.4 98.8 * 90.0 109.8 89.8 *Sabaragamuwa 99.1 102.9 120.3 * 86.2 108.2 112.3 *
DistrictColombo 90.8 83.7 101.0 * 91.3 84.8 93.1 *Gampaha 92.7 84.5 127.8 * 90.5 76.3 105.3 *Kalutara 102.6 89.1 104.3 * 104.6 96.4 89.7 *Kandy 92.8 109.2 117.8 * 115.3 105.8 101.0 *Matale 91.8 79.3 103.5 * 92.2 90.6 103.9 *Nuwara Eliya 83.7 81.4 104.4 * 72.2 85.9 107.0 *Galle 108.4 87.7 95.2 * 91.2 100.5 101.1 *Matara 105.3 89.9 87.6 * 118.7 86.1 124.5 *Hambantota 94.2 93.1 102.5 * 83.7 112.9 104.1 *Jaffna - - - - - - - -Kilinochchi - - - - - - - -Mannar - - - - - - - -Vavuniya - - - - - - - -Mullaitivu - - - - - - - -Batticaloa - - - - - - - -Ampara - - - - - - - -Trincomalee - - - - - - - -Kurunegala 102.1 97.3 109.3 * 92.3 99.0 94.4 *Puttalam 85.5 101.0 115.8 * 95.7 81.3 121.7 *Anuradhapura 64.8 69.6 103.8 * 106.0 91.0 96.8 *Polonnaruwa 105.5 101.4 107.6 * 138.6 118.4 119.3 *Badulla 102.3 86.6 107.0 * 93.2 112.2 89.5 *Moneragala 77.6 112.0 90.2 * 83.6 104.7 90.4 *Ratnapura 102.5 98.1 102.4 * 78.6 117.8 120.0 *Kegalle 94.3 109.6 144.8 * 96.6 96.2 103.2 *
* Sample size is not adequate to provide data
1996 2002Sector/ Province/ District

Goal 3. Promote gender equality and empower women
1. Indicator
Year2001
10. Ratio of literate women to men, 15-24 years old 100.9
2. Definition
United Nations Definition
Definition used
3. Method of computation
Method of computation given by United Nations
Method of computation used
4. Data source, geographical coverage and periodicity
4.1 Data source and geographical coverage Data source :Census of Population and Housing 2001
Geographical coverage: Only for completely enumerated districts in Census of Population and Housing 2001
4.2 PeriodicityOnce in 10 years
5. Accuracy and data limitations
The indicator is derived by dividing the literacy rate of women ages 15-24 by the literacy rate of menages 15-24.
The indicator is derived by dividing the literacy rate of women ages 15-24 by the literacy rate of menages 15-24.
The census enumeration was able to carry out completely in 18 districts out of 25 districts due to theunsettled conditions in Northern and Eastern provinces. This includes Ampara district in Easternprovince and the 17 districts not belonging to Northern and Eastern provinces.
Target 4. Eliminate gender disparity in primary and secondary education preferably by 2005, and in alllevels of education no later than 2015
Indicator
The ratio of literate women to men, 15-24 years old (literacy gender parity index) is the ratio of thefemale literacy rate to the male literacy rate for the age group 15-24.
The ratio of literate women to men, 15-24 years old (literacy gender parity index) is the ratio of thefemale literacy rate to the male literacy rate for the age group 15-24.

6. Level of disaggregation
Table 1 : Ratio of literate women to men, 15-24 years old
Year2001
Sri Lanka 100.9
Sector Urban 101.2Rural 101.3Estate 96.6
ProvinceWestern 101.6Central 99.8Southern 101.2Northern -Eastern -North Western 101.4North Central 101.5Uva 100.6Sabaragamuwa 101.3
DistrictColombo 101.7Gampaha 101.1Kalutara 101.7Kandy 100.1Matale 101.8Nuwara Eliya 98.2Galle 101.0Matara 101.2Hambantota 101.5Jaffna -Kilinochchi -Mannar -Vavuniya -Mullaitivu -Batticaloa -Ampara 100.9Trincomalee -Kurunegala 101.2Puttalam 101.5Anuradhapura 101.4Polonnaruwa 101.6Badulla 100.2Moneragala 101.5Ratnapura 101.2Kegalle 101.5
Sector/ Province/ District

Goal 3 - Promote gender equality and empower women
1. Indicator
Year2001
11. Share of women in wage employment in the non-agricultural sector 32.8
2. Definition
United Nations Definition
Definition used
3. Method of computation
Method of computation given by United Nations
Method of computation used
4. Data source, geographical coverage and periodicity
4.1 Data source and geographical coverage Data source :Census of Population and Housing 2001
Geographical coverage: Only for completely enumerated districts in Census of Population and Housing 2001
4.2 PeriodicityOnce in 10 years
The total number of women in paid employees who are in the non-agricultural sector is divided by the totalnumber of people employed in that same sector.
Employment refers to people above a certain age who worked or held a job during a reference period.Employment data include both full-time and part-time workers whose remuneration is determined on thebasis of hours worked or number of items produced and is independent of profits or expectation of profits.
The share of women in paid employees in the non-agricultural sector expressed as a percentage of totalemployment in the sector.
The non-agricultural sector includes industry and services. Following the International StandardClassification (ISIC) of All Economic Activities, industry includes mining and quarrying (including oilproduction), manufacturing, construction, electricity, gas and water, services includes wholesale and retailtrade; restaurants and hotels; transport, storage and communications; financing, insurance, education, realestate and business services; public administration and defence; health, community, and social andpersonal services.
The total number of women in paid employment in the non-agricultural sector is divided by the total numberof people in paid employment in that same sector.
Target 4 - Eliminate gender disparity in primary and secondary education preferably by 2005, and in alllevels of education no later than 2015
Indicator
The share of women in wage employment in the non-agricultural sector is the share of female workers inthe non-agricultural sector expressed as a percentage of total employment in the sector.
The non-agricultural sector includes industry and services. Following the International StandardClassification (ISIC) of All Economic Activities, industry includes mining and quarrying (including oilproduction), manufacturing, construction, electricity, gas and water. Services includes wholesale and retailtrade; restaurants and hotels; transport, storage and communications; financing, insurance, real estate andbusiness services; and community, social, social and personal services.

5. Accuracy and data limitations
6. Level of disaggregation
Table 1: Share of women in wage employment in the non-agricultural sector
Year2001
Sri Lanka 32.8
SectorUrban 33.7Rural 32.6Estate 30.5
ProvinceWestern 34.6Central 30.6Southern 32.9Northern -Eastern -North Western 31.1North Central 26.7Uva 29.4Sabaragamuwa 31.8
DistrictColombo 33.6Gampaha 36.6Kalutara 32.0Kandy 29.4Matale 29.9Nuwara Eliya 35.4Galle 32.2Matara 33.1Hambantota 34.7Jaffna -Kilinochchi -Mannar -Vavuniya -Mullaitivu -Batticaloa -Ampara 18.6Trincomalee -Kurunegala 32.1Puttalam 29.0Anuradhapura 27.1Polonnaruwa 25.7Badulla 30.0Moneragala 28.0Ratnapura 30.2Kegalle 33.3
The census enumeration was able to carry out completely in 18 districts out of 25 districts due to theunsettled conditions in Northern and Eastern provinces. This includes Ampara district in Eastern provinceand the 17 districts not belonging to Northern and Eastern provinces.
Sector/ Province/ District

Goal 4. Reduce child mortality
1. Indicator
1991 200213. Under-five mortality rate
Child mortality rate 22.2 13.5
2. Definition
United Nations Definition
Definition used
3. Method of computation
Method of computation given by United Nations
Method of computation used
CMR = Number of deaths under five years of age X 1000 Total number of live births
4. Data source, geographical coverage and periodicity
4.1 Data source and geographical coverage
Data source :Civil Registration System of the Registrar General's Department
Geographical coverage :All island
4.2 PeriodicityAnnually
5. Accuracy and data limitations
The under-five mortality rate is the probability (expressed as a rate per 1,000 live births) of a child born in aspecified year dying before reaching the age of five if subject to current age-specific mortality rates.
Child Mortality Rate is defined as the probability (expressed as a rate per 1000 live births) of a child born ina specified year dying before reaching the age of five if subjected to current age-specific mortality rates.
Age-specific mortality rates are calculated from data on births and deaths in vital statistics registries,censuses and household surveys in developing countries. Estimates based on household survey data areobtained directly (using birth history, as in Demographic and Health Survey Health Surveys) or indirectly(Brass method, as in Multiple Indicator Cluster Surveys). The data are then summed for children under five,and the results are expressed as a rate per 1,000 live births.
The number of live births in one year and the number of deaths in the same year of children under five arecalculated through the Vital Statistics System. The number of deaths is divided by the number of births andthe result is multiplied by 1000.
Target 5. Reduce by two thirds, between 1990 and 2015, the under-five mortality rate
IndicatorYear
6. Level of disaggregation
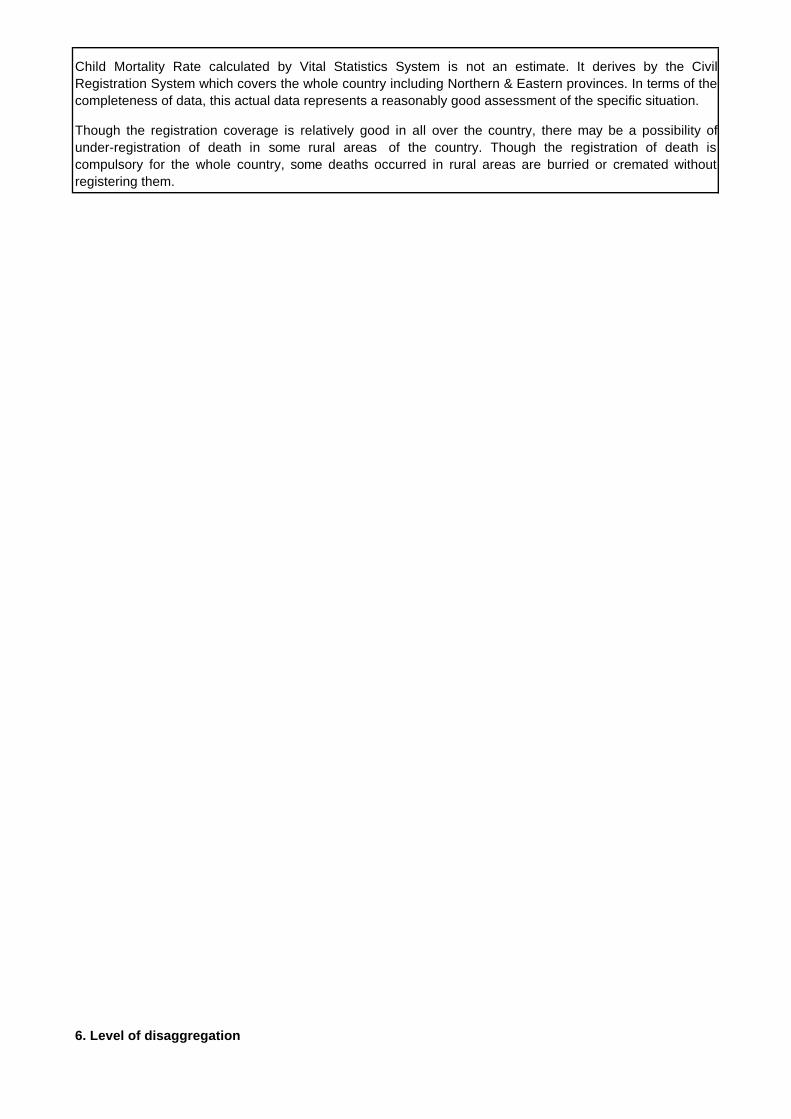
Though the registration coverage is relatively good in all over the country, there may be a possibility ofunder-registration of death in some rural areas of the country. Though the registration of death iscompulsory for the whole country, some deaths occurred in rural areas are burried or cremated withoutregistering them.
Child Mortality Rate calculated by Vital Statistics System is not an estimate. It derives by the CivilRegistration System which covers the whole country including Northern & Eastern provinces. In terms of thecompleteness of data, this actual data represents a reasonably good assessment of the specific situation.

Table 1: Under-five mortality rate
Male Female Male FemaleSri Lanka 24.3 20.0 14.9 12.0
SectorUrban 31.3 24.6 18.7 14.9Rural 12.3 11.1 7.6 6.4Estate 38.1 41.0 22.1 20.6
ProvinceWestern 26.7 22.0 15.6 12.2Central 33.1 29.4 18.2 14.5Southern 20.5 16.3 10.3 7.4Northern 12.2 10.9 10.5 8.7Eastern 16.3 14.6 15.0 11.4North Western 27.4 19.9 12.5 11.1North Central 22.9 18.5 20.3 17.5Uva 18.4 16.1 16.0 12.2Sabaragamuwa 27.1 21.0 15.0 13.6
DistrictColombo 34.7 28.2 21.2 16.6Gampaha 12.1 11.6 9.2 6.2Kalutara 22.7 17.3 4.9 5.7Kandy 35.3 29.6 20.8 15.7Matale 17.3 14.1 10.5 7.2Nuwara Eliya 38.0 37.8 17.3 16.9Galle 17.1 14.2 11.8 7.7Matara 31.9 23.1 9.9 7.9Hambantota 9.2 9.6 7.1 5.4Jaffna 14.0 12.6 8.2 7.0Kilinochchi 7.7 8.7 6.6 4.8Mannar 83.3* 0.0 7.3 5.2Vavuniya 8.4 5.4 18.9 16.4Mullaitivu 6.8 4.5 13.4 11.1Batticaloa 21.6 18.9 23.6 17.5Ampara 14.6 13.6 11.5 9.1Trincomalee 9.2 8.0 7.1 4.9Kurunegala 28.0 18.1 15.0 12.7Puttalam 26.3 23.5 8.3 8.5Anuradhapura 28.5 21.9 21.5 18.1Polonnaruwa 10.5 10.7 17.6 16.1Badulla 20.8 18.2 20.6 15.4Moneragala 12.3 11.0 3.8 3.5Ratnapura 29.7 25.0 15.8 14.8Kegalle 22.2 13.3 13.4 11.3
* Since the population of Mannar in 1991 was very few, number of births were also recorded in … smallnumber. Therefore, when the denominator become very low figure, the CMR for that particular district showsan unreliable picture.
Sector/ Province/ District 1991 2002Year

Goal 4. Reduce child mortality
1. Indicator
1991 2002
14. Infant mortality rate 17.7 11.2
2. Definition
United Nations Definition
Definition used
3. Method of computation
Method of computation given by United Nations
Method of computation used
IMR = Number of deaths under one year of age in year X 1000 Total number of live births in the year
4. Data source, geographical coverage and periodicity
4.1 Data source and geographical coverageData source :Civil Registration System of the Registrar General's Department
Geographical coverage :All island
4.2 PeriodicityAnnually
The number of live births in one year and the number of deaths in the same year of children under one arecollected from the Vital Statistics System. The number of deaths is divided by the number of births and theresult is multiplied by 1000.
The infant mortality rate is typically defined as the number of infants dying before reaching the age of oneyear per 1,000 live births in a given year.
Infant Mortality Rate is the probability (expressed as a rate per 1000 live births) of a child born in a specifiedyear dying before reaching the age of one if subjected to current age-specific mortality rates.
The indicator is the number of deaths of infants under one year of age in the indicated year per 1,000 livebirths in the same year.For data from vital statistics registrations (when reliable), the number of live births and deaths in the sameyear of children under one year old are estimated. The number of deaths is divided by the number of birthsand the result is multiplied by 1,000.For data from household surveys, infant mortality estimates are obtained directly (using birth history, as inDemographic and Health Surveys) or indirectly (Brass method, as in Multiple Indicator Cluster Surveys).When estimated indirectly, the under-one mortality estimates must be consistent with the under fivemortality estimates.
Target 5. Reduce by two thirds, between 1990 and 2015, the under-five mortality rate
YearIndicator

5. Accuracy and data limitations
6. Level of disaggregation
Infant Mortality Rate is not an estimate. It derives by the Civil Registration System which covers the wholecountry including Northern & Eastern parts of the island. In terms of the completeness, this actual datarepresents a reasonably good assessment of the situation.
Though the registration coverage is relatively good in all over the country, there may be a possibility ofunder-registration of death in some rural areas of the country. Though the registration of death iscompulsory for the whole country, some deaths occurred in rural areas are burried or cremated withoutregistering them.

Table1: Infant mortality rate
Male Female Male FemaleSri Lanka 19.9 15.4 12.9 10.2
SectorUrban 27.1 20.3 16.9 13.1Rural 7.9 6.6 5.2 4.6Estate 30.5 30.1 16.4 15.7
ProvinceWestern 23.2 18.2 14.0 10.5Central 26.8 22.9 16.1 12.4Southern 17.2 13.0 9.3 6.7Northern 9.2 7.8 7.6 6.1Eastern 10.4 8.1 10.6 8.1North Western 23.0 15.3 10.8 9.6North Central 18.9 14.2 18.6 15.8Uva 13.4 10.5 14.4 10.8Sabaragamuwa 22.5 16.9 12.7 11.4
DistrictColombo 30.2 23.6 18.8 13.8Gampaha 10.3 9.6 9.1 6.2Kalutara 19.7 13.4 3.9 5.1Kandy 29.7 23.8 18.2 12.8Matale 13.1 9.8 9.4 6.5Nuwara Eliya 29.2 28.7 16.0 15.8Galle 14.7 11.2 11.3 7.6Matara 27.3 19.0 8.7 6.8Hambantota 6.1 6.9 5.1 4.2Jaffna 10.9 9.5 6.2 5.1Kilinochchi 3.9 4.0 3.9 3.6Mannar 83.3* 0.0 4.8 5.2Vavuniya 6.0 2.7 12.4 12.0Mullaitivu 5.1 3.6 11.3 6.4Batticaloa 14.3 10.3 17.4 14.4Ampara 8.8 7.1 7.9 5.4Trincomalee 5.8 5.5 3.9 2.2Kurunegala 24.2 13.9 13.1 11.2Puttalam 20.6 18.0 6.8 7.0Anuradhapura 24.5 17.3 19.1 15.7Polonnaruwa 6.6 6.7 17.6 16.1Badulla 16.2 13.0 19.1 14.0Moneragala 6.2 4.5 2.0 2.2Ratnapura 24.9 20.3 13.7 12.9Kegalle 18.0 10.4 10.6 8.5
* Since the population of Mannar in 1991 was very few, number of births were also recorded in … smallnumber. Therefore, when the denominator become very low figure, the CMR for that particular district showsan unreliable picture.
Sector/ Province/ District 1991 2002Year

1. Indicator
1993 2000
15. Proportion of 1-year- old children immunized against measles 95.5 94.2
2. Definition
United Nations Definition
Definition used
4. Data source, geographical coverage and periodicity
Data source : Sri Lanka Demographic & Health Survey 1993, 2000
Geographical coverage :
4.2 PeriodicityOnce in 5 years
5. Accuracy and data limitations
Method of computation usedSame as the UN method of computation.
4.1 Data source and geographical coverage
Target group was confined to children who are having the Child Development Record (CHDR) at the time ofthe survey.
The country has been stratified into nine zones on the basis of socio - economic and ecological criteria, but
both surveys (1993, 2000) were conducted only for seven zones, excluding the zone 8th and zone 9th
(Eastern and Northern provinces) due to the unsettled conditions that prevailed in these zones.
The proportion of 1- year- old children immunized against measles is the percentage of children under oneyear of age who have received at least one dose of measles vaccine.
Out of the children aged 12-23 months who are having the Child Development Record, the proportion whohave received at least one dose of measles vaccine.
3. Method of computation
The indicator is estimated as the percentage of children aged 12-23 months who received at least one doseof measles vaccine either any time before the survey or before the age of 12 months. Estimates ofimmunization coverage are generally based on two sources of empirical data: administrative data andcoverage surveys (see 'Data collection and sources'). For estimates based on administrative data,immunization coverage is derived by dividing the total number of vaccinations by the number of children inthe target population. For most vaccines, the target population is the national annual number of births ornumber of surviving infants (this may vary depending on a country's policies and the specific vaccine).Immunization coverage surveys are frequently used in connection with administrative data.
Method of computation given by United Nations
Goal 4. Reduce child mortality
Target 5. Reduce by two thirds, between 1990 and 2015, the under-five mortality rate
IndicatorYear

6. Level of Disaggregation
Table 1: Proportion of 1-year- old children immunized against measles
1993 2000
Sri Lanka 95.5 94.2
SexMale 94.4Female 94.1
Sector Colombo metro 94.4 91.2Other urban 96.3 94.6Rural 96.1 95.5Estate 84.7 86.1
ZoneZone 1 94.4 91.2Zone 2 98.4 100.0Zone 3 97.7 97.8Zone 4 94.4 91.1Zone 5 93.6 90.6Zone 6 95.5 100.0Zone 7 94.9 97.6
Zone1 Part of Colombo, Gampaha districts
Zone2 Part of Colombo, Gampaha, Kalutara districts
Zone3 Full districts of Galle, Matara
Part of Kalutara district
Zone4 Full district of Matale
Part of Kurunegala, Kegale, Ratnapura districts
Zone5 Full districts of Badulla, Nuwara Eliya, Kandy
Part of Kegalle, Ratnapura districts
Zone6 Full district of Polonnaruwa
Part of Anuradhapura, Hambantota districts
Zone7 Full districts of Puttalam, Moneragala
Part of Kurunegala, Anuradhapura, Hambantota districts
Table 2: Proportion of 1-year- old children immunized against measles
1993 2000
Educational level of motherNo schooling 90.0 81.2Primary 94.6 93.1Secondary 95.6 94.3G.C.E.(O/L) 97.0 94.6G.C.E.(A/L) & higher 96.6
Year
Year
Educational level of mother
Sex/ Sector/ Zone

Goal 5. Improve maternal health
1. Indicator
1991 2002
42.3 27.5
2. Definition
United Nations Definition
Definition used
Method of computation given by United Nations
Method of computation used
Another problem is the need for large sample sizes, which raises costs. This can be overcome by usingsisterhood methods. The indirect sisterhood method asks respondents four simple questions about how manyof their sisters reached adulthood, how many have died and whether those who died were pregnant aroundthe time of death. However, the reference period of the estimate is at least 10–12 years before the survey.The direct sisterhood method used in Demographic and Health Surveys also asks respondents to provide thedate of death, which permits the calculation of more recent estimates, but even then the reference periodtends to center on 0–6 years before the survey.
Maternal deaths should be divided into two groups. Direct obstetric deaths result from obstetric complicationsof the pregnant state (pregnancy, labour and puerperium); from interventions, omissions or incorrecttreatment; or from a chain of events resulting from any of these. Indirect obstetric deaths result frompreviously existing disease or disease that developed during pregnancy and that was not directly due toobstetric causes but was aggravated by the physiologic effects of pregnancy. Published maternal mortalityratios should always specify whether the numerator (number of recorded maternal deaths) is the number ofrecorded direct obstetric deaths or the number of recorded obstetric deaths (direct plus indirect). Maternaldeaths from HIV/AIDS and obstetrical tetanus are included in the maternal mortality ratio.
Maternal death is the death of a woman while pregnant or within 42 days of termination of pregnancy,irrespective of the duration and the site of the pregnancy, from any cause related to or aggravated by thepregnancy or its management, but not from accidental or incidental causes.
The maternal mortality ratio can be calculated by dividing recorded (or estimated) maternal deaths by totalrecorded (or estimated) live births in the same period and multiplying by 100,000. The indicator can becalculated directly from data collected through vital statistics registrations, household surveys or hospitalstudies. However, those sources all have data quality problems (see “Data collection and sources”).Alternative methods include a review of all deaths of women of reproductive age (so-called Reproductive AgeMortality Surveys, or RAMOS), longitudinal studies of pregnant women and repeated household studies. Allthese methods, however, still rely on accurate reporting of deaths of pregnant women and of the cause ofdeath, something that is difficult to obtain.
Maternal deaths should be subdivided into two groups:
Direct obstetric deaths: Those resulting from obstetric complications of the pregnant state (pregnancy,labour and puerperium), from interventions, omissions, incorrect treatment or from a chain of events resultingfrom any of the above.Indirect obstetric deaths: Those resulting from previous existing disease or disease that developed duringpregnancy and which was not due to direct obstetric causes, but which was aggravated by physiologic effectsof pregnancy.
3. Method of computation
Target 6. Reduce by three quarters, between 1990 and 2015, the maternal mortality ratio
IndicatorYear
The maternal mortality ratio is the number of women who die from any cause related to or aggravated bypregnancy or its management (excluding accidental or incidental causes) during pregnancy and childbirth orwithin 42 days of termination of pregnancy, irrespective of the duration and site of the pregnancy, per 100,000live births. The 10th revision of the International Classification of Diseases makes provision for including latematernal deaths occurring between six weeks and one year after childbirth.
16. Maternal mortality ratio

MMR = Maternal deaths (direct and indirect) X 100,000 Live births
4. Data source, geographical coverage and periodicity
4.1 Data source and geographical coverage
Data source :Civil Registration System of the Registrar General's Department
Geographical coverage :All island
4.2 Periodicity Annually
5. Accuracy and data limitations
6. Level of disaggregation
The accuracy of Maternal Mortality Rate is under concern due to several factors. The major problem is theidentification of maternal death depends on the statement written by lay registerars on the Statistical Returns.This contains several types of errors such as, mis-reporting, mis-spelling and mis-interpretation of the causeof death. As a result of this, the rate of under estimation of MMR figure of the Registrar General's Departmenthas been calculated as one third of the actual count of maternal deaths occurred in the country. (Study doneby UNICEF) "Maternal deaths in Sri Lanka" (Review of estimates and censes in 1996) Steps have been takento resolve this problems from 2005 by joining with the Family Health Bureau of the Health Ministry and to usecrosstab procedure to check data collected through both sources and pool the results of both institutionsbefore releasing MMR. And also to use the statement on cause of death written practioners, instead of by themedical referring the statement written by the registars to identify the correct cause of death.
Though the registration coverage is relatively good in all over the country, there may be a possibility of under-registration of death in some rural areas of the country. Though the registration of death is compulsory bylaw, some deaths occurred in rural areas are burried or cremated without registering them.
For the purpose of the international reporting of maternal mortality, only those maternal deaths occurringbefore the end of the 42-day reference period should be included in the calculation of the various ratios andrates, although the recording of later deaths is useful for national analytical purposes.
Published maternal mortality rates should always specify the numerator number of recorded maternal deaths), which can be given as:
# the number of recorded direct obstetric deaths, or# the number of recorded obstetric deaths (direct plus indirect)
The denominator used for calculating maternal mortality should be specified as the number of live births orthe number of total births (live births plus fetal deaths). Where both denominators are available, a calculationshould be published for each.
Results should be expressed as a ratio of the numerator to the denominator, multiplied by k (where k may be1000, 10,000 or 100,000, as preferred and indicated by the country). Maternal mortality ratios and rates canthus be expressed as follows:
The number of maternal deaths (direct and indirect) are identified through the total deaths occurred in oneyear. Total births of the same year are also calculated from the Vital statistics System. The number ofmaternal deaths is divided by number of live births and the result is multiplied by 100,000.
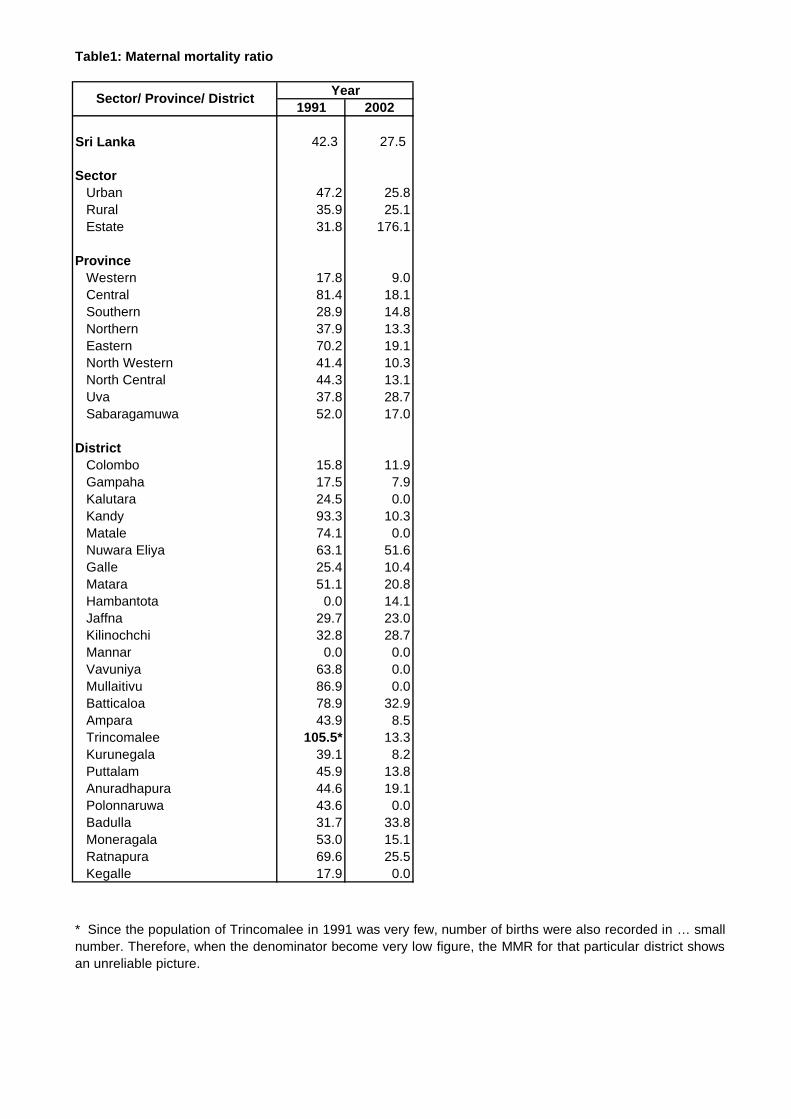
Table1: Maternal mortality ratio
1991 2002
Sri Lanka 42.3 27.5
SectorUrban 47.2 25.8Rural 35.9 25.1Estate 31.8 176.1
ProvinceWestern 17.8 9.0Central 81.4 18.1Southern 28.9 14.8Northern 37.9 13.3Eastern 70.2 19.1North Western 41.4 10.3North Central 44.3 13.1Uva 37.8 28.7Sabaragamuwa 52.0 17.0
DistrictColombo 15.8 11.9Gampaha 17.5 7.9Kalutara 24.5 0.0Kandy 93.3 10.3Matale 74.1 0.0Nuwara Eliya 63.1 51.6Galle 25.4 10.4Matara 51.1 20.8Hambantota 0.0 14.1Jaffna 29.7 23.0Kilinochchi 32.8 28.7Mannar 0.0 0.0Vavuniya 63.8 0.0Mullaitivu 86.9 0.0Batticaloa 78.9 32.9Ampara 43.9 8.5Trincomalee 105.5* 13.3Kurunegala 39.1 8.2Puttalam 45.9 13.8Anuradhapura 44.6 19.1Polonnaruwa 43.6 0.0Badulla 31.7 33.8Moneragala 53.0 15.1Ratnapura 69.6 25.5Kegalle 17.9 0.0
* Since the population of Trincomalee in 1991 was very few, number of births were also recorded in … smallnumber. Therefore, when the denominator become very low figure, the MMR for that particular district showsan unreliable picture.
Sector/ Province/ DistrictYear

1. Indicator
1993 200017. Proportion of births attended by skilled health personnel 94.1 96.0
2. Definition
United Nations Definition
Definition used
4. Data source, geographical coverage and periodicity
Data source :Sri Lanka Demographic & Health Survey 1993, 2000
Geographical coverage :
4.2 Periodicity Once in 5 years
5. Accuracy and data limitations
6. Level of Disaggregation
The country has been stratified into nine zones on the basis of socio - economic and ecological criteria, but
both surveys (1993, 2000) were conducted only for seven zones, excluding the zone 8th and zone 9th
(Eastern and Northern provinces) due to the unsettled conditions that prevailed in these zones.
Method of computation given by United Nations
Same as the UN method of computation. The reference period is considered as the five years prior to thesurvey.
Only the last birth of the mother that had occurred during the 5 year period preceding the survey, was takeninto consideration in the computation.
4.1 Data source and geographical coverage
Method of computation used
Goal 5. Improve maternal health
Target 6. Reduce by three quarters, between 1990 and 2015, the maternal mortality ratio
IndicatorYear
3. Method of computation
The number of births attended by skilled health personnel (doctors, nurses or midwives) is expressed as apercentage of deliveries (or births if those are the only data available) in the same period.
The proportion of births attended by skilled health personnel is the percentage of deliveries attended bypersonnel trained to give the necessary supervision, care and advice to women during pregnancy, labourand the post-partum period; to conduct deliveries on their own; and to care for newborns. Skilled health personnel include only those who are properly trained and who have appropriate equipmentand drugs. Traditional birth attendants, even if they have received a short training course, are not to beincluded.
The proportion of births attended by skilled health personnel is the percentage of the deliveries attended bypersonnel trained to conduct deliveries on their own. It is the same as the UN definition.
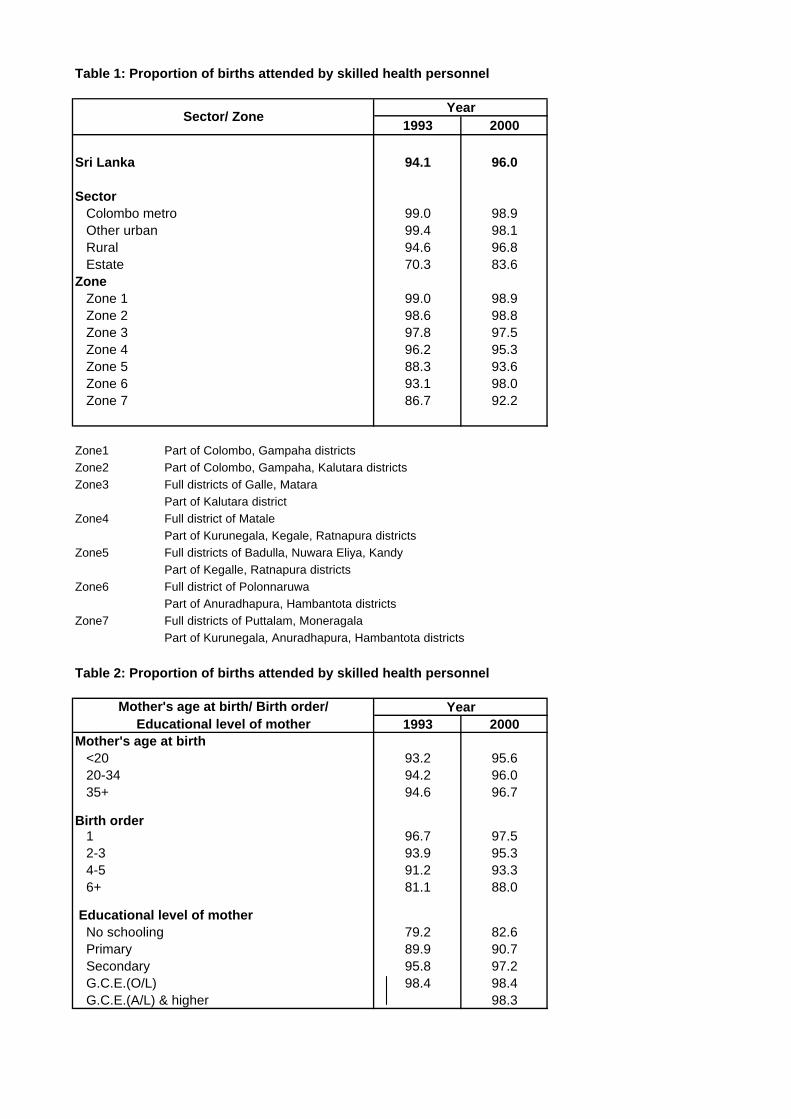
Table 1: Proportion of births attended by skilled health personnel
1993 2000
Sri Lanka 94.1 96.0
Sector Colombo metro 99.0 98.9Other urban 99.4 98.1Rural 94.6 96.8Estate 70.3 83.6
ZoneZone 1 99.0 98.9Zone 2 98.6 98.8Zone 3 97.8 97.5Zone 4 96.2 95.3Zone 5 88.3 93.6Zone 6 93.1 98.0Zone 7 86.7 92.2
Zone1 Part of Colombo, Gampaha districts
Zone2 Part of Colombo, Gampaha, Kalutara districts
Zone3 Full districts of Galle, Matara
Part of Kalutara district
Zone4 Full district of Matale
Part of Kurunegala, Kegale, Ratnapura districts
Zone5 Full districts of Badulla, Nuwara Eliya, Kandy
Part of Kegalle, Ratnapura districts
Zone6 Full district of Polonnaruwa
Part of Anuradhapura, Hambantota districts
Zone7 Full districts of Puttalam, Moneragala
Part of Kurunegala, Anuradhapura, Hambantota districts
Table 2: Proportion of births attended by skilled health personnel
1993 2000Mother's age at birth
<20 93.2 95.620-34 94.2 96.035+ 94.6 96.7
Birth order1 96.7 97.52-3 93.9 95.34-5 91.2 93.36+ 81.1 88.0
Educational level of motherNo schooling 79.2 82.6Primary 89.9 90.7Secondary 95.8 97.2G.C.E.(O/L) 98.4 98.4G.C.E.(A/L) & higher 98.3
Year
Year
Mother's age at birth/ Birth order/Educational level of mother
Sector/ Zone

1. Indicator
1993 20005.0 5.3
2. Definition
United Nations Definition
Definition used
4. Data source, geographical coverage and periodicity
Data source :Sri Lanka Demographic & Health Survey 1993, 2000
Geographical coverage :
4.2 Periodicity :Once in 5 years
19. Condom use rate of the contraceptive prevalence rate
The country has been stratified into nine zones on the basis of socio - economic and ecological criteria, but
both surveys (1993, 2000) were conducted only for seven zones, excluding the zone 8th and zone 9th
(Eastern and Northern provinces) due to the unsettled conditions that prevailed in these zones.
Condom use rate of the contraceptive prevalence rate is the number of women aged 15-49 years in maritalor consensual unions who are practising contraception by using condoms as a proportion of all of women ofthe same age group in consensual unions who are practising, or whose sexual partners are practising, anyform of contraception.
Same as the UN definition.
3. Method of computation
The number of women aged 15-49 in marital or consensual unions who report that they are using a condomto avoid pregnancy (regardless of whether they are also using additional methods) is divided by the totalnumber of women aged 15- 49 in unions who are practising, or whose sexual partners are practising,contraception.The indicator is not equivalent to condom use prevalence, which is the number of women aged 15-49 inmarital or consensual unions who are practising (or whose sexual partners are practising) contraception byusing condoms as a percentage of the total number of women of the same age group (and same maritalstatus, if applicable) in the survey.Irrespective of the contraceptive prevalence rate, if 10 percent of those practising contraception usecondoms, then the rate for indicator 19 is 10 percent.The definition and method of calculation of the indicator differ when it is used for monitoring contraceptiveuse only. In that case, the numerator is the number of women aged 15-49 in marital or consensual unionswho report that they are using a condom as their main method of contraception.
Method of computation given by United Nations
Method of computation usedNumber of currently married women aged (15-49) yrs. who report that they are using a condom to avoidpregnancy (regardless of whether they are also using additional methods) is divided by the total number ofcurrently married women aged (15-49) yrs. who are practising contraception.
4.1 Data source and geographical coverage
Goal 6. Combat HIV / AIDS, malaria and other diseases
Target 7. Have halted by 2015 and begun to reverse the spread of HIV / AIDS
IndicatorYear

5. Accuracy and data limitations
6. Level of Disaggregation
Table 1: Condom use rate of the contraceptive prevalence rate
Year2000
Sri Lanka 5.3
SectorColombo metro 9.9Other urban 8.5Rural 4.5Estate 2.4
ZoneZone 1 9.9Zone 2 7.2Zone 3 6.5Zone 4 4.7Zone 5 2.8Zone 6 2.9Zone 7 3.2
Zone1 Part of Colombo, Gampaha districts
Zone2 Part of Colombo, Gampaha, Kalutara districts
Zone3 Full districts of Galle, Matara
Part of Kalutara district
Zone4 Full district of Matale
Part of Kurunegala, Kegale, Ratnapura districts
Zone5 Full districts of Badulla, Nuwara Eliya, Kandy
Part of Kegalle, Ratnapura districts
Zone6 Full district of Polonnaruwa
Part of Anuradhapura, Hambantota districts
Zone7 Full districts of Puttalam, Moneragala
Part of Kurunegala, Anuradhapura, Hambantota districts
Table 2: Condom use rate of the contraceptive prevalence rate
1993 2000
15-19 2.6 2.320-24 4.5 4.125-29 5.3 7.830-34 8.0 6.735-39 5.0 5.340-44 4.2 4.545-49 2.2 2.8
Current age (yrs.)Year
Sector/ Zone
Union outside wedlock was not taken into consideration.

1. Indicator
1993 2000
66.1 70.0
2. Definition
United Nations Definition
Definition used
4. Data source, geographical coverage and periodicity
Data source : Sri Lanka Demographic & Health Survey 1993, 2000
Geographical coverage :
4.2 PeriodicityOnce in 5 years
5. Accuracy and data limitations
6. Level of disaggregation
The number of currently married women aged 15-49 who are practising any method of contraception isdivided by the total number of currently married women in the same age group.
4.1 Data source and geographical coverage
Union outside wedlock was not taken into consideration. The target group was confined to currently marriedwomen.
Goal 6. Combat HIV / AIDS, malaria and other diseases
Target 7. Have halted by 2015 and begun to reverse the spread of HIV / AIDS
IndicatorYear
19c. Contraceptive prevalence rate
The country has been stratified into nine zones on the basis of socio - economic and ecological criteria, but
both surveys (1993, 2000) were conducted only for seven zones, excluding the zone 8th and zone 9th
(Eastern and Northern provinces) due to the unsettled conditions that prevailed in these zones.
The number of women ages 15-49 in marital or consensual unions who report that they are practising (orwhose sexual partners are practising) contraception is divided by the total number of women ages 15-49(and same marital status, if applicable) in the survey.
The contraceptive prevalence rate is the percentage of women who are practising or whose sexual partnersare practising any form of contraception. It is usually reported for women ages 15-49 in marital orconsensual unions.
The percentage of married couples using any form of contraception.
3. Method of computation
Method of computation given by United Nations
Method of computation used

Table 1: Contraceptive prevalence rate
1993 2000Sri Lanka 66.1 70.0
SectorColombo metro 62.7 64.1Other urban 57.7 65.5Rural 68.3 72.0Estate 54.5 63.1
ZoneZone 1 62.7 64.1Zone 2 71.1 68.2Zone 3 64.0 68.7Zone 4 67.6 73.9Zone 5 63.7 71.3Zone 6 67.2 74.7Zone 7 65.9 66.4
Zone1 Part of Colombo, Gampaha districts
Zone2 Part of Colombo, Gampaha, Kalutara districts
Zone3 Full districts of Galle, Matara
Part of Kalutara district
Zone4 Full district of Matale
Part of Kurunegala, Kegale, Ratnapura districts
Zone5 Full districts of Badulla, Nuwara Eliya, Kandy
Part of Kegalle, Ratnapura districts
Zone6 Full district of Polonnaruwa
Part of Anuradhapura, Hambantota districts
Zone7 Full districts of Puttalam, Moneragala
Part of Kurunegala, Anuradhapura, Hambantota districts
1993 2000Current age (yrs.)
15-19 30.3 52.820-24 53.6 61.225-29 60.7 65.030-34 67.4 72.835-39 76.7 77.540-44 74.4 75.245-49 62.4 63.8
Parity0 11.7 15.81 52.4 63.22 72.7 77.53 80.0 81.74+ 79.0 83.8
Educational level of motherNo schooling 58.2 72.1Primary 68.9 74.2Secondary 67.8 71.1G.C.E. (O/L) 64.0 66.0G.C.E. (A/L) & higher 65.1
Year
YearSector/ Zone
Current age/ Parity/ Educational level of mother

1. Indicator
Year2001
80.3
2. Definition
United Nations Definition
Definition used
4. Data source, geographical coverage and periodicity
4.1 Data source and geographical coverageData source :Census of Population and Housing 2001
Geographical coverage: Only for completely enumerated districts in Census of Population and Housing 2001
4.2 PeriodicityOnce in 10 years
5. Accuracy and data limitations
Goal 7. Ensure environmental sustainability
Target 9. Integrate the principles of sustainable development into country policies and programmes andreverse the loss of environmental resources
29. Proportion of the population using solid fuels
Proportion of population using solid fuels is the proportion of the population that relies on biomass (wood,charcoal, crop residues and dung) and coal as the primary source of domestic energy for cooking andheating.
Method of computation used The households used firewood, saw dust/paddy husk for cooking arrangements to the total households,expressed as a percentage. The same method apply for the urban, rural and estate breakdown.
Indicator
The census enumeration was able to carry out completely in 18 districts out of 25 districts due to theunsettled conditions in Northern and Eastern provinces. This includes Ampara district in Eastern provinceand the 17 districts not belonging to Northern and Eastern provinces.
The households that using solid fuels of firewood, saw dust/paddy husk for cooking.
Method of computation given by United NationsThe indicator is computed as the ratio of households using one or more unprocessed solid fuels (dung andcrop residues, wood, charcoal, and coal) for cooking and heating, to the total population, expressed as apercentage.
3. Method of computation

6. Level of Disaggregation
Table 1: Proportion of the population using solid fuels
Year2001
Sri Lanka 80.3
SectorUrban 34.6Rural 86.4Estate 95.5
ProvinceWestern 56.5Central 87.8Southern 89.1Northern -Eastern -North Western 93.2North Central 92.9Uva 92.5Sabaragamuwa 94.6
DistrictColombo 34.1Gampaha 66.9Kalutara 80.2Kandy 85.7Matale 92.1Nuwara Eliya 88.8Galle 86.3Matara 89.0Hambantota 94.1Jaffna -Kilinochchi -Mannar -Vavuniya -Mullaitivu -Batticaloa -Ampara 87.4Trincomalee -Kurunegala 95.2Puttalam 88.8Anuradhapura 92.5Polonnaruwa 93.8Badulla 90.9Moneragala 95.5Ratnapura 94.6Kegalle 94.6
Sector/ Province/ District

1. Indicator
Year200182.0
2. Definition
United Nations Definition
Definition used
Method of computation used
4. Data source, geographical coverage and periodicity
Data source :Census of Population and Housing 2001
Geographical coverage: Only for completely enumerated districts in Census of Population and Housing 2001
4.2 PeriodicityOnce in 10 years
3. Method of computation
4.1 Data source and geographical coverage
Method of computation given by United NationsThe indicator is computed as the ratio of the number of people who use piped water, public tap, borehole orpump, protected well, protected spring, or rainwater to the total population, expressed as a percentage. Thesame method applies for the urban and rural breakdown.Access to safe water refers to the percentage of the population with reasonable access to an adequatesupply of safe water in their dwelling or within a convenient distance of their dwelling. The Global WaterSupply and Sanitation Assessment 2000 Report defines reasonable access as "the availability of 20 litresper capita per day at a distance no longer than 1,000 metres". However, access and volume of drinkingwater are difficult to measure, so sources of drinking water that are thought to provide safe water are usedas a proxy.The United Nations Children's Fund (UNICEF) and the World Health Organization (WHO), through the JointMonitoring Programme, assess trends in " access to improved drinking water sources" by drawing aregression line through the available household survey and census data for each country (details areavailable at http://www.childinfo.org). Regional and global estimates are aggregated from the national estimates, using population-weightedaverages.
The number of households use piped water (main line), tube well and protected well to the totalhouseholds, expressed as a percentage. The same method applies for the urban, rural and estate breakdown.
The proportion of the population with sustainable access to an improved water source, urban and rural , isthe percentage of the population who use any of the following types of water supply for drinking: pipedwater, public tap, borehole or pump, protected well, protected spring or rainwater. Improved water sourcesdo not include vendor-provided water, bottled water, tanker trucks or unprotected wells and springs.
The percentage of households use any of the following types of water supply for drinking: piped water, tubewell and protected well.
Goal 7. Ensure environmental sustainability
Target 10. Halve, by 2015, the proportion of people without sustainable access to safe drinking and basic sanitation
Indicator
30. Proportion of population with sustainable access to an improved water source, urban,rural and estate
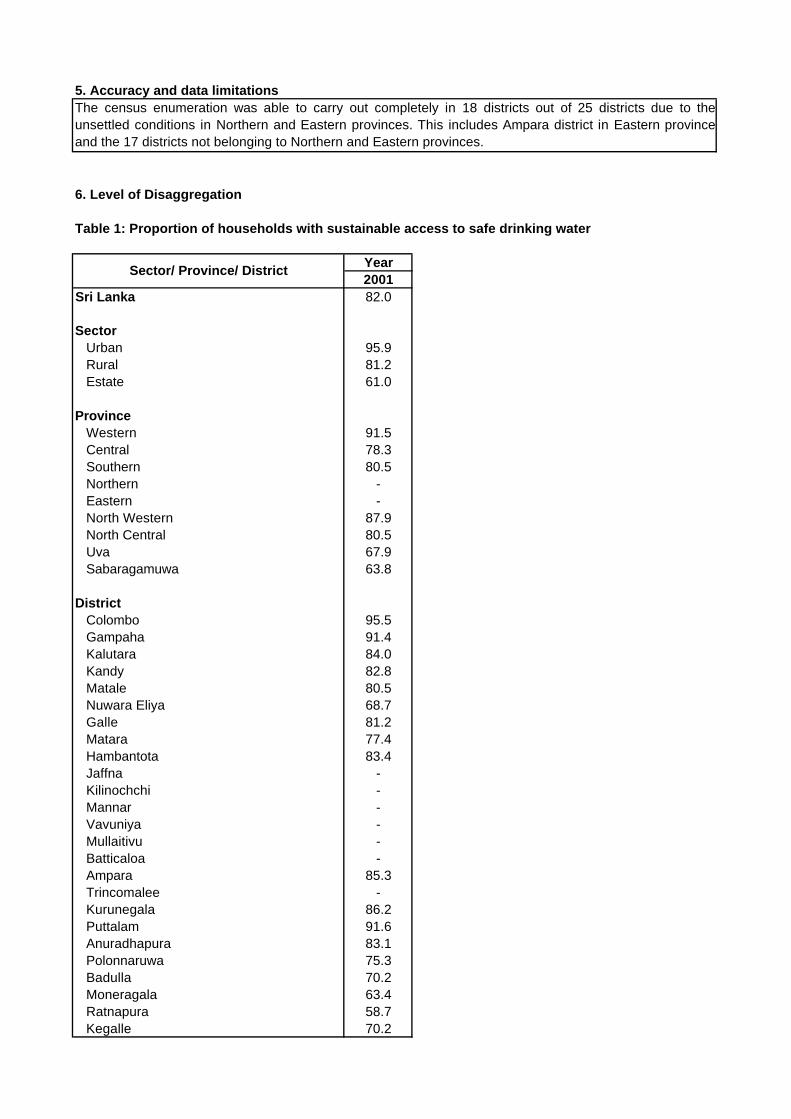
5. Accuracy and data limitations
6. Level of Disaggregation
Table 1: Proportion of households with sustainable access to safe drinking water
Year2001
Sri Lanka 82.0
SectorUrban 95.9Rural 81.2Estate 61.0
ProvinceWestern 91.5Central 78.3Southern 80.5Northern -Eastern -North Western 87.9North Central 80.5Uva 67.9Sabaragamuwa 63.8
DistrictColombo 95.5Gampaha 91.4Kalutara 84.0Kandy 82.8Matale 80.5Nuwara Eliya 68.7Galle 81.2Matara 77.4Hambantota 83.4Jaffna -Kilinochchi -Mannar -Vavuniya -Mullaitivu -Batticaloa -Ampara 85.3Trincomalee -Kurunegala 86.2Puttalam 91.6Anuradhapura 83.1Polonnaruwa 75.3Badulla 70.2Moneragala 63.4Ratnapura 58.7Kegalle 70.2
The census enumeration was able to carry out completely in 18 districts out of 25 districts due to theunsettled conditions in Northern and Eastern provinces. This includes Ampara district in Eastern provinceand the 17 districts not belonging to Northern and Eastern provinces.
Sector/ Province/ District

1. Indicator
Year2001
31. Proportion of population with access to improved sanitation, urban and rural 67.5
2. Definition
United Nations Definition
Definition used
4. Data source, geographical coverage and periodicity
Data source :Census of Population and Housing 2001
Geographical coverage: Only for completed enumerately districts in Census of Population and Housing 2001
4.2 PeriodicityOnce in 10 years
5. Accuracy and data limitations
Goal 7. Ensure environmental sustainability
Target 10. Halve, by 2015, the proportion of people without sustainable access to safe drinking and basicsanitation
The indicator is computed as the ratio of the number of people in urban or rural areas with access toimproved excreta-disposal facilities to the total urban or rural population, expressed as a percentage.
4.1 Data source and geographical coverage
Method of computation given by United Nations
Method of computation used
Indicator
The number of households use water seal toilets to the total households, expressed as a percentage. Thesame method applies for the urban, rural and estate breakdown.
The census enumeration was able to carry out completely in 18 districts out of 25 districts due to theunsettled conditions in Northern and Eastern provinces. This includes Ampara district in Eastern provinceand the 17 districts not belonging to Northern and Eastern provinces.
Proportion of the urban and rural population with access to improved sanitation refers to the percentage ofthe population with access to facilities that hygienically separate human excreta from human, animal andinsect contact. Facilities such as sewers or septic tanks, poor-flush latrines and simple pit or ventilatedimproved pit latrines are assumed to be adequate, provided that they are not public, according to the WorldHealth Organization and United Nations Children's Fund's Global Water Supply and SanitationAssessment 2000 Report . To be effective, facilities must be correctly constructed and properly maintained.
The percentage of the households access to facilities that hygienically separate human excreta fromhuman, animal and insect contact. This includes water seal toilets and exclude pour flush (not water seal),pit and bucket type toilets.
3. Method of computation

6. Level of disaggregation
Table 1: Proportion of households with access to improved sanitation
Year2001
Sri Lanka 67.5
SectorUrban 77.8Rural 67.5Estate 43.2
ProvinceWestern 77.6Central 56.6Southern 72.3Northern -Eastern -North Western 69.6North Central 49.7Uva 50.9Sabaragamuwa 66.1
DistrictColombo 77.3Gampaha 77.7Kalutara 78.1Kandy 67.1Matale 46.8Nuwara Eliya 44.0Galle 74.2Matara 80.2Hambantota 58.0Jaffna -Kilinochchi -Mannar -Vavuniya -Mullaitivu -Batticaloa -Ampara 52.1Trincomalee -Kurunegala 70.5Puttalam 67.7Anuradhapura 47.9Polonnaruwa 53.4Badulla 54.4Moneragala 43.9Ratnapura 67.2Kegalle 64.7
Sector/ Province/ District

Goal 7. Ensure environmental sustainability
1. Indicator
Year200198.1
2. Definition
United Nations Definition
Definition used
3. Method of computation
Method of computation given by United Nations
Method of computation used
4. Data source, geographical coverage and periodicity
Data source :Census of Population and Housing 2001
Geographical coverage: Only for completely enumerated districts in Census of Population and Housing 2001
4.2 PeriodicityOnce in 10 years
The indicator is computed as 1 minus the ratio of the slums and the number of occupied housing units inurban areas. Urban areas comprised all municipal council and urban council areas.
4.1 Data source and geographical coverage
Secure tenure refers to households that own or are purchasing their homes, are renting privately or arein social housing or subtenancy. Households without secure tenure are defined as squatters (whether ornot they pay rent), homeless and households with no formal agreement.
UN-HABITAT defines a slum household as a group of individuals living under the same roof who lackone or more (in some cities, two or more) of the following conditions: security of tenure, structural qualityand durability of dwellings, access to safe water, access to sanitation facilities and sufficient living area.
The indicator is computed as 1 minus the ratio of the number of households in urban areas that lack oneor more of the above mentioned conditions listed under "Definition" to the number of urban households,expressed as a percentage.
The proportion of housing units with access to secure tenure is 1 minus the percentage of the urbanhousing units in the slums .
Target 11. By 2020, to have achieved a significant improvement in the lives of at least 100 million slumdwellers
Indicator
32. Proportion of housing units with access to secure tenure in urban sector
The proportion of households with access to secure tenure is 1 minus the percentage of the urbanpopulation that lives in slums. In the absence of data on number of slum dwellers, the United NationsHuman Settlements Programme (UN-HABITAT) produce estimates based on a definition of slums asagreed by the Expert Group Meeting on Urban Indicators in 2002. Those indicators will be adjusted, andthe definitions of secure tenure and slums will be refined through future consultations with Expert GroupMeeting participants and their related networks of professionals.

5. Accuracy and data limitations
6. Level of disaggregation
Table 1: Proportion of housing units with access to secure tenure in urban sector
Year2001
Sri Lanka 98.1
ProvinceWestern 97.8Central 99.6Southern 98.9Northern -Eastern -North Western 97.7North Central 99.5Uva 99.8Sabaragamuwa 99.9
DistrictColombo 97.4Gampaha 98.9Kalutara 99.7Kandy 99.7Matale 99.4Nuwara Eliya 99.4Galle 98.9Matara 99.1Hambantota 98.4Jaffna -Kilinochchi -Mannar -Vavuniya -Mullaitivu -Batticaloa -Ampara 99.9Trincomalee -Kurunegala 98.8Puttalam 97.2Anuradhapura 99.5Polonnaruwa -Badulla 99.8Moneragala -Ratnapura 99.9Kegalle 99.7
The census enumeration was able to carry out completely in 18 districts out of 25 districts due to theunsettled conditions in Northern and Eastern provinces. This includes Ampara district in Easternprovince and the 17 districts not belonging to Northern and Eastern provinces.
Province/ District

Goal 8. Develop a global partnership for development
1. Indicator
1996 200231.6 27.9
2. Definition
United Nations Definition
Definition used
3. Method of computation
Method of computation given by United Nations
Method of computation used
4. Data source, geographical coverage and periodicity
4.1 Data source and geographical coverage
Data source :Sri Lanka Labour Force Survey
Geographical coverage : All districts other than districts in Northern & Eastern provinces in Sri Lanka
4.2 PeriodicityQuarterly
Indicator
The labour force consists of those who are employed plus those who are unemployed during the relevantreference period. It is the economically active portion of the population. Employment refers to beingengaged in an economic activity during a specified reference period or being temporarily absent from suchan activity, while economic activity refers to the production of goods and services for pay or profit or for useby own household.
Same as the UN definition.
Target 16. In cooperation with developing countries, develop and implement strategies for decent andproductive work for youth
Year
Unemployment rate of young people aged 15–24 years is the number of unemployed people ages 15–24divided by the labour force of the same age group. Unemployed people are all those who are not employedduring a specified reference period but are available for work and have taken concrete steps to seek paidemployment or self-employment. In situations where the conventional means of seeking work are of limitedrelevance, where the labour market is largely unorganized or of limited scope, where labour absorption istemporarily inadequate or where the labour force is largely self-employed, a relaxed definition ofunemployment can be applied, based on only the first two criteria (without work and currently available forwork).
The number of people aged 15 - 24 years who are unemployed is divided by the number of people in thelabour force of the same age group.
Same as the UN method of computation.
45. Unemployment rate of young people aged 15-24 years, each sex and total
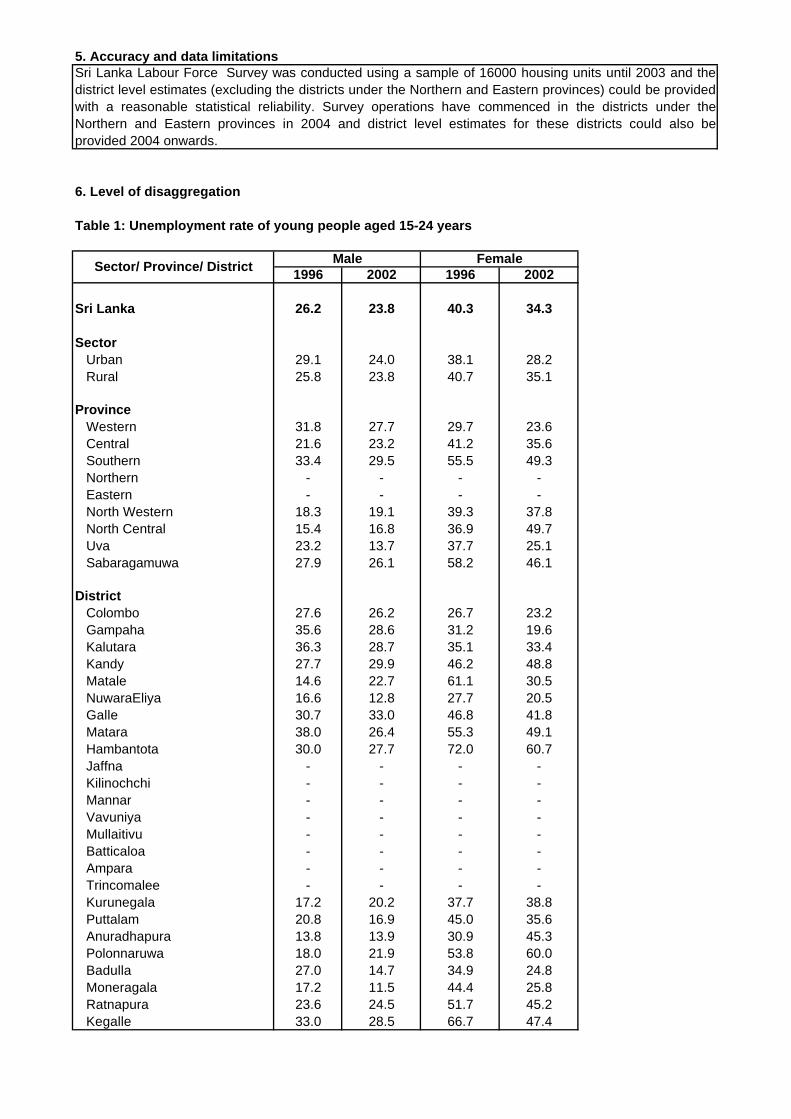
5. Accuracy and data limitations
6. Level of disaggregation
Table 1: Unemployment rate of young people aged 15-24 years
1996 2002 1996 2002
Sri Lanka 26.2 23.8 40.3 34.3
SectorUrban 29.1 24.0 38.1 28.2Rural 25.8 23.8 40.7 35.1
ProvinceWestern 31.8 27.7 29.7 23.6Central 21.6 23.2 41.2 35.6Southern 33.4 29.5 55.5 49.3Northern - - - -Eastern - - - -North Western 18.3 19.1 39.3 37.8North Central 15.4 16.8 36.9 49.7Uva 23.2 13.7 37.7 25.1Sabaragamuwa 27.9 26.1 58.2 46.1
DistrictColombo 27.6 26.2 26.7 23.2Gampaha 35.6 28.6 31.2 19.6Kalutara 36.3 28.7 35.1 33.4Kandy 27.7 29.9 46.2 48.8Matale 14.6 22.7 61.1 30.5NuwaraEliya 16.6 12.8 27.7 20.5Galle 30.7 33.0 46.8 41.8Matara 38.0 26.4 55.3 49.1Hambantota 30.0 27.7 72.0 60.7Jaffna - - - -Kilinochchi - - - -Mannar - - - -Vavuniya - - - -Mullaitivu - - - -Batticaloa - - - -Ampara - - - -Trincomalee - - - -Kurunegala 17.2 20.2 37.7 38.8Puttalam 20.8 16.9 45.0 35.6Anuradhapura 13.8 13.9 30.9 45.3Polonnaruwa 18.0 21.9 53.8 60.0Badulla 27.0 14.7 34.9 24.8Moneragala 17.2 11.5 44.4 25.8Ratnapura 23.6 24.5 51.7 45.2Kegalle 33.0 28.5 66.7 47.4
Male FemaleSector/ Province/ District
Sri Lanka Labour Force Survey was conducted using a sample of 16000 housing units until 2003 and thedistrict level estimates (excluding the districts under the Northern and Eastern provinces) could be providedwith a reasonable statistical reliability. Survey operations have commenced in the districts under theNorthern and Eastern provinces in 2004 and district level estimates for these districts could also beprovided 2004 onwards.

Goal 8. Develop a global partnership for development
1. Indicator
Year20043.8
2. Definition
United Nations Definition
Definition used
3. Method of computation
4. Data source, geographical coverage and periodicity
4.1 Data source and geographical coverage
Data source :A sample survey on computer literacy of Sri Lanka - 2004
Geographical coverage :
4.2 PeriodicityTo be decided
5. Accuracy and data limitations
Same as the UN definition.Note: This survey was designed to estimate personal computers in use per 100 households and not per100 population.
Method of computation given by United NationsThe total number of PCs in a country is divided by the population and multiplied by 100.
Method of computation usedThe total number of households with computers was divided by the number of households enumerated andmultiplied by 100. (To generalize the results, appropriate weights were applied).
Sampling plan was designed to provide estimates within + or - 5% of population values of indicators.
A sample survey on computer literacy of Sri Lanka - 2004 covering all districts other than Mullaitivu andKilinochchi districts.
Personal computers (PCs) are computers designed to be operated by a single user at a time.
Target 18. In cooperation with the private sector, make available the benefits of new technologies,especially information and communications technologies
Indicator
48. Personal computers in use per 100 population

6. Level of disaggregation
Table 1 : Personal computers in use per 100 households
Year2004
Sri Lanka 3.8
SectorUrban 10.5Rural 3.1Estate 0.3
ProvinceWestern 8.4Central 3.3Southern 2.2Northern 1.2Eastern 1.2North Western 3.1North Central 1.4Uva 0.4Sabaragamuwa 2.0
Sector/ Province

Goal 8. Develop a global partnership for development
1. Indicator
Year20042.8
2. Definition
United Nations Definition
Definition used
Definition of Internet user
3. Method of computation
Method of computation given by United Nations
Method of computation used
4. Data source, geographical coverage and periodicity
4.1 Data source and geographical coverageData source :A sample survey on Computer Literacy of Sri Lanka - 2004
Geographical coverage :
4.2 PeriodicityTo be decided
5. Accuracy and data limitations
Indicator
48b. Internet users per 100 population
A sample survey on Computer Literacy of Sri Lanka - 2004 covering all districts other than Mullaitivu andKilinochchi districts.
Same as the UN definition.
The total number of Internet users is divided by the population and multiplied by 100.
The total number of household members (5 - 69 years) who had used internet over the period of threemonths prior to the survey was divided by the total number of household members enumerated (5 - 69 years)and multiplied by 100. (To generalize the results, appropriate weights were applied).
Sampling plan was designed to provide estimates within + or - 5% of population values of indicators.
A person was defined as an internet user if he/ she had used internet during the period of three months priorto the survey.
Target 18. In cooperation with the private sector, make available the benefits of new technologies, especiallyinformation and communications
The Internet is a linked global network of computers in which users at one computer, if they have permission,get information from other computers in the network.

6. Level of disaggregation
Table 1: Internet users per 100 households
Year2004
Sri Lanka 2.8
ProvinceWestern 5.4Central 2.1Southern 2.0Northern 2.1Eastern 1.7North Western 2.2North Central 0.7Uva 0.4Sabaragamuwa 1.1
Province