Embed Size (px)
Citation preview

Canadian Health Measures Survey (CHMS):an introduction and overview
Brent DayHealth Statistics DivisionStatistics Canada
1 Statistics Canada • Statistique Canada

Statistics Canada • Statistique Canada2
CHMS OBJECTIVES
Explore emerging public health issues and new measurement technologies
Establish national baseline data on major health concerns
Determine relationships among risk factors, protection practices and health status
Assess the validity of self- and proxy-reported information
Assemble a nationally representative sample for storage in a biobank

HEALTH SURVEYS PROGRAMCCHS Annual CCHS Rapid
ResponseCCHS Focus Content
CHMS
Content General health surveillance Sample buy-ins
Emerging need - determined by client
Single content in-depth Sample buy-ins
HH information related to physical measures Physical measures in MECLaboratory testsBuy-ins
Sample size 65,000 respondents
11,000 respondents by 2 months collection period
27,000 respondents 5,700 respondents per cycle
Frequency Annual Up to 6 periods by year
Every three years 2 year cycle
Geography Canada, provinces, territories & health regions
Canada & provinces
Canada & provinces Canada only
Age groups 12+ 12+ Varies depending on survey
3 - 79
Statistics Canada • Statistique Canada4
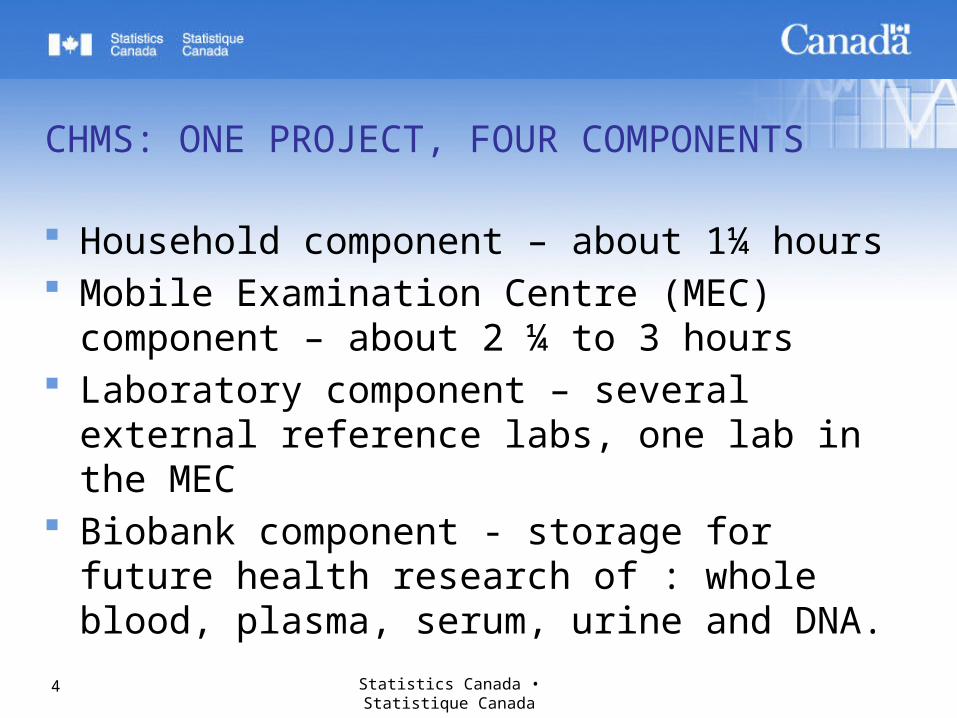
CHMS: ONE PROJECT, FOUR COMPONENTS
Household component – about 1¼ hours Mobile Examination Centre (MEC) component –
about 2 ¼ to 3 hours Laboratory component – several external
reference labs, one lab in the MEC Biobank component - storage for future health
research of : whole blood, plasma, serum, urine and DNA.
Statistics Canada • Statistique Canada5
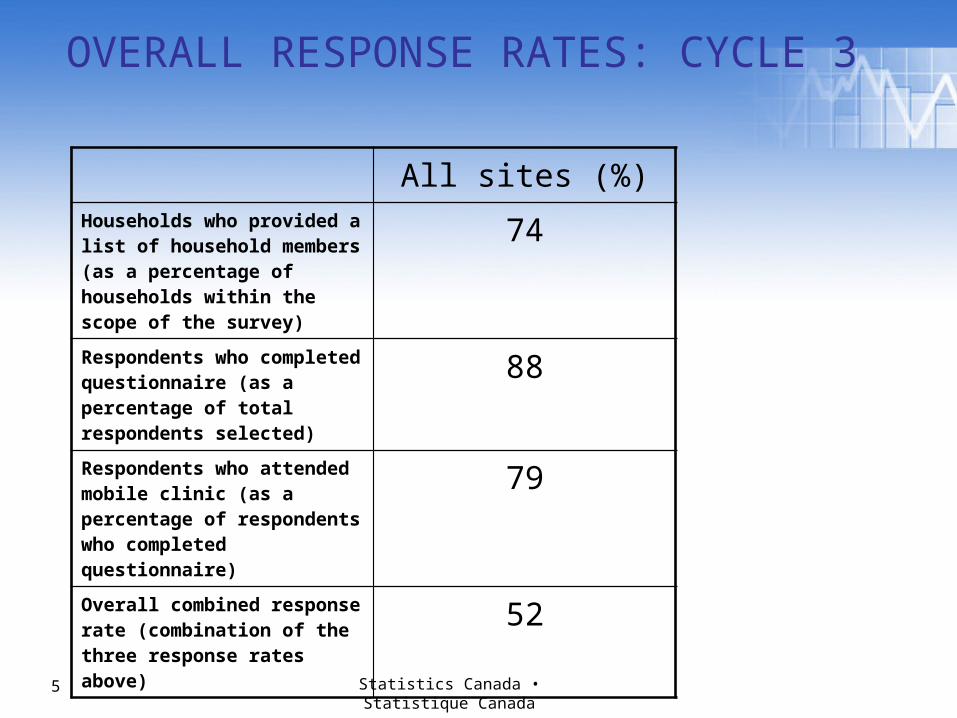
OVERALL RESPONSE RATES: CYCLE 3
All sites (%)Households who provided a list of household members (as a percentage of households within the scope of the survey)
74
Respondents who completed questionnaire (as a percentage of total respondents selected)
88
Respondents who attended mobile clinic (as a percentage of respondents who completed questionnaire)
79
Overall combined response rate (combination of the three response rates above)
52

Statistics Canada • Statistique Canada6
SURVEY PARAMETERS: CYCLES 3 & 4
National estimates: n = 5,700 each cycle Survey population aged 3 to 79 Direct physical measurements completed in
mobile clinic over 2 years Collection:
• cycle 3 from Jan 2012 to Dec 2013• cycle 4 from Jan 2014 to Dec 2015
Statistics Canada • Statistique Canada7
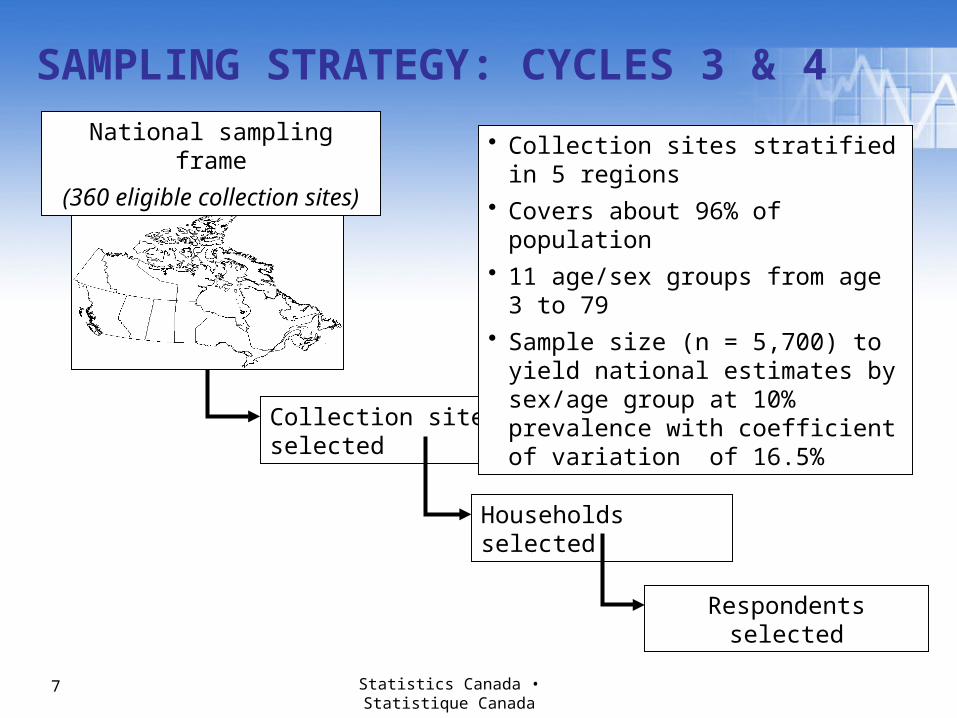
Collection sites selected
Households selected
Respondents selected
National sampling frame
(360 eligible collection sites)
SAMPLING STRATEGY: CYCLES 3 & 4
• Collection sites stratified in 5 regions• Covers about 96% of population• 11 age/sex groups from age 3 to 79• Sample size (n = 5,700) to yield
national estimates by sex/age group at 10% prevalence with coefficient of variation of 16.5%

8
COLLECTION SITES: CYCLE 4
St Hyacinthe
Terrace KitimatEdmonton
Brockville
Laval
Montreal
Toronto (2)
Regina
Shelburne
Kelowna
Hamilton
Kitchener-Waterloo
Thunder Bay
Fredericton
Statistics Canada • Statistique Canada
Saguenay

Statistics Canada • Statistique Canada9
QUESTIONNAIRE CONTENT: CYCLE 3The questionnaire content is to be used only in context with physical measures data and covers the following topics:
Health status
Nutrition and food
Medication use
Health behaviours
Environmental factors
Socio-economic information

Statistics Canada • Statistique Canada10
THE MOBILE CLINIC
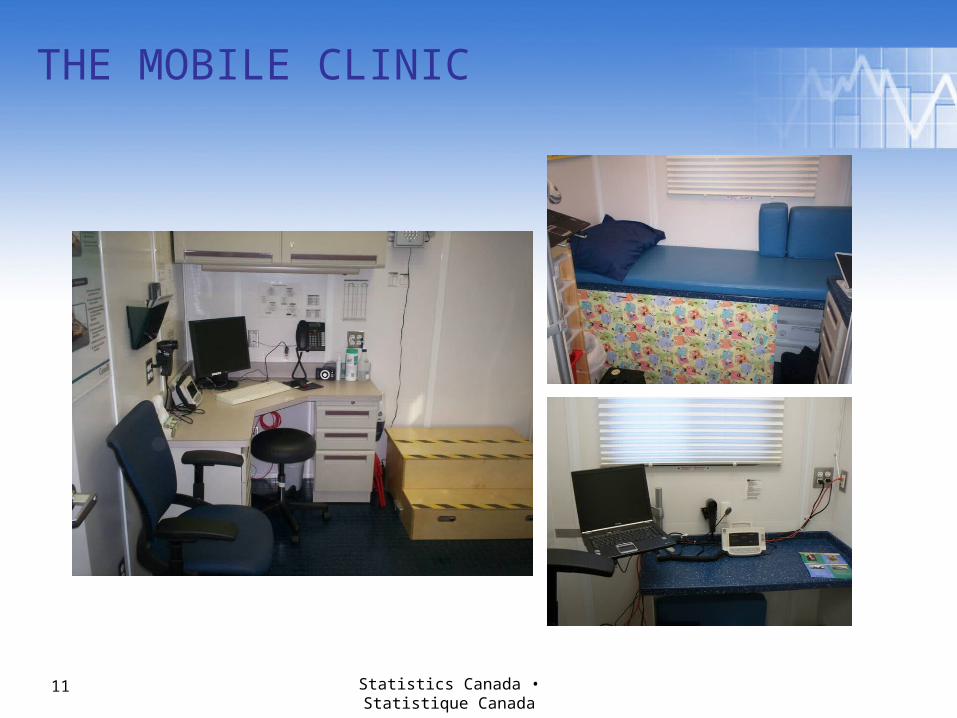
Statistics Canada • Statistique Canada11
THE MOBILE CLINIC

PHYSICAL MEASURES: CYCLE 3 Anthropometry
• Standing height, sitting height, weight
• Waist and hip circumference
Cardiorespiratory fitness
• Resting blood pressure and heart rate
• Spirometry• Fractional exhaled nitric
oxide (FENO)
Muscular strength• Hand grip strength
Hearing assessment
Skin pigmentation
Physical activity• Accelerometer
Indoor air sampler
Tap water samples (taken from some randomly selected households)
Statistics Canada • Statistique Canada12

Statistics Canada • Statistique Canada13
BLOOD AND URINE TESTS: CYCLE 3Blood General: Complete blood count
(CBC), blood chemistry panel Allergies Cardiovascular health: C-
reactive protein (high sensitivity), HDL, LDL, total cholesterol and triglycerides and fatty acids
Diabetes: Fasting, non-fasting and random glucose, fasting insulin and HbA1c
Environmental exposure: Metals (cadmium, lead and mercury (total and methyl)), acrylamide and volatile organic compounds (VOCs)
Infectious diseases: Hepatitis B and C
Nutritional status: Ferritin, red blood cell folate, vitamin B12,
vitamin C and vitamin D Reproductive hormones
Thyroid status
Urine Environmental exposure:
Metals (arsenic (speciated), fluoride and inorganic mercury), benzene
metabolites, bisphenol A, organophosphate insecticides,
polyaromatic hydrocarbons (PAHs), parabens, tobacco and triclosan
Kidney function: Creatinine and microalbumin
Nutritional status: Iodine

MICRODATA FILES (CYCLE 1)
Household questionnaire,
clinic and laboratory measures done on all
respondents
5604 obs.
Ages 6 to 79
MedicationFile
5604 obs.
Ages 6 to 79
Full sample file Medication fileSubsample files
Fasting measures 2,634 6 to 79
Inorganic mercury 1,123 6 to 79
PBDE / PCB 1,696 20 to 79
PFCs 2,880 20 to 79
Activity monitor 4,441 6 to 79
Phthalates 3,237 6 to 49
Nicotine 2,483 12 to 79
Content # obs. Age covered
Statistics Canada • Statistique Canada14
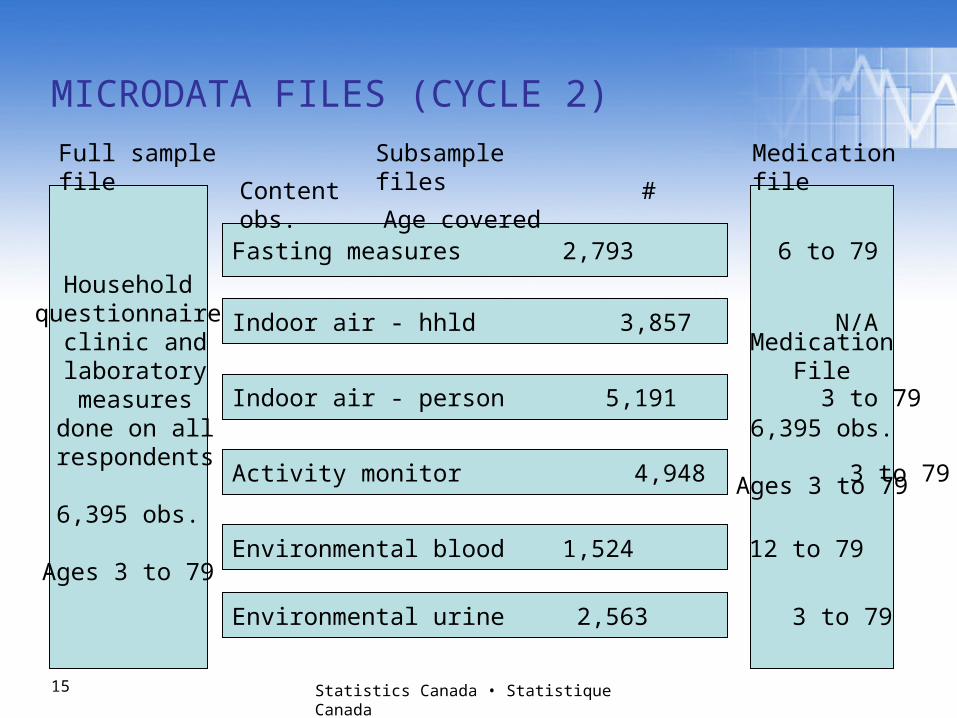
MICRODATA FILES (CYCLE 2)
Household questionnaire,
clinic and laboratory measures done on all
respondents
6,395 obs.
Ages 3 to 79
MedicationFile
6,395 obs.
Ages 3 to 79
Full sample file Medication fileSubsample files
Fasting measures 2,793 6 to 79
Indoor air - hhld 3,857 N/A
Indoor air - person 5,191 3 to 79
Activity monitor 4,948 3 to 79
Environmental blood 1,524 12 to 79
Environmental urine 2,563 3 to 79
Content # obs. Age covered
Statistics Canada • Statistique Canada15

MICRODATA FILES (CYCLE 3) - Released
Household questionnaire,
clinic and laboratory measures done on all
respondents
5,785 obs.
Ages 3 to 79
MedicationFile
5,785 obs.
Ages 3 to 79
Full sample file Medication fileSubsample files
Fasting measures 2,571 6 to 79
Activity monitor 4,271 3 to 79
RBC fatty acids 1,984 20 to 79
Fluoride - hhld 2,188 12 to 79
Fluoride - person 2,671 12 to 79
VOCs - hhld 2,650 12 to 79
Content # obs. Age covered
Statistics Canada • Statistique Canada16
VOCs - person 2,527 12 to 79
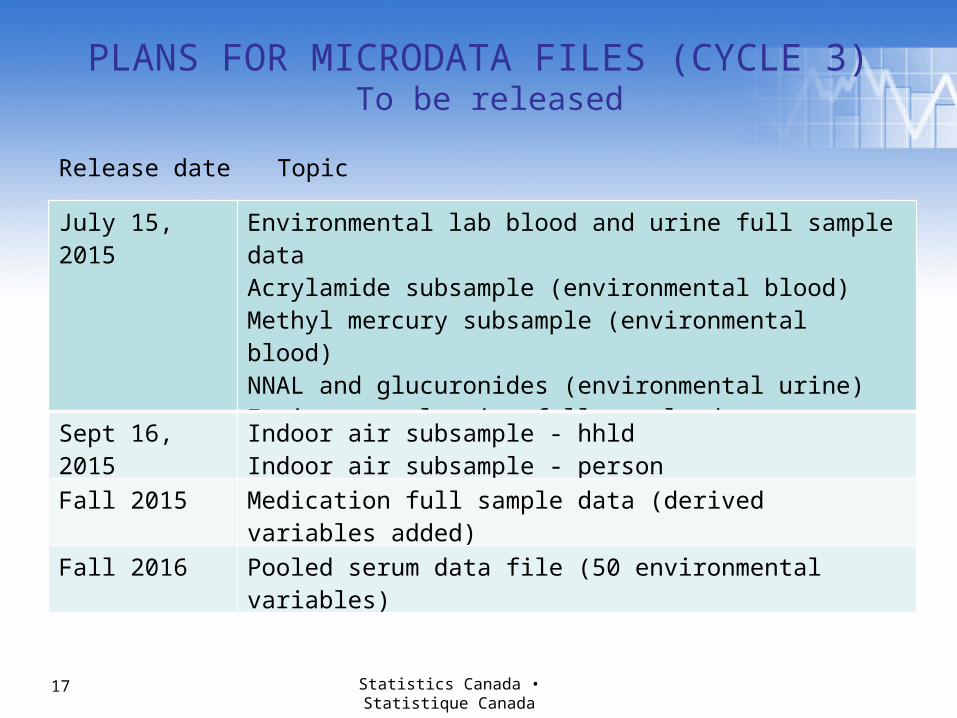
PLANS FOR MICRODATA FILES (CYCLE 3) To be released
Statistics Canada • Statistique Canada17
Release date Topic
July 15, 2015 Environmental lab blood and urine full sample dataAcrylamide subsample (environmental blood)Methyl mercury subsample (environmental blood)NNAL and glucuronides (environmental urine)Environmental urine full sample data
Sept 16, 2015 Indoor air subsample - hhldIndoor air subsample - person
Fall 2015 Medication full sample data (derived variables added)
Fall 2016 Pooled serum data file (50 environmental variables)

Statistics Canada • Statistique Canada18
CHMS DOCUMENTATION User guide
• Survey content, procedures• Data quality, weighting
Data dictionaries• Information for all variables on the full sample and
subsample files Name, length, data type (character / numeric) Location on the file, applicable values Coverage statements Univariate counts (weighted and unweighted; at RDC only)
Derived variables documentation Sampling documentation
Statistics Canada • Statistique Canada19
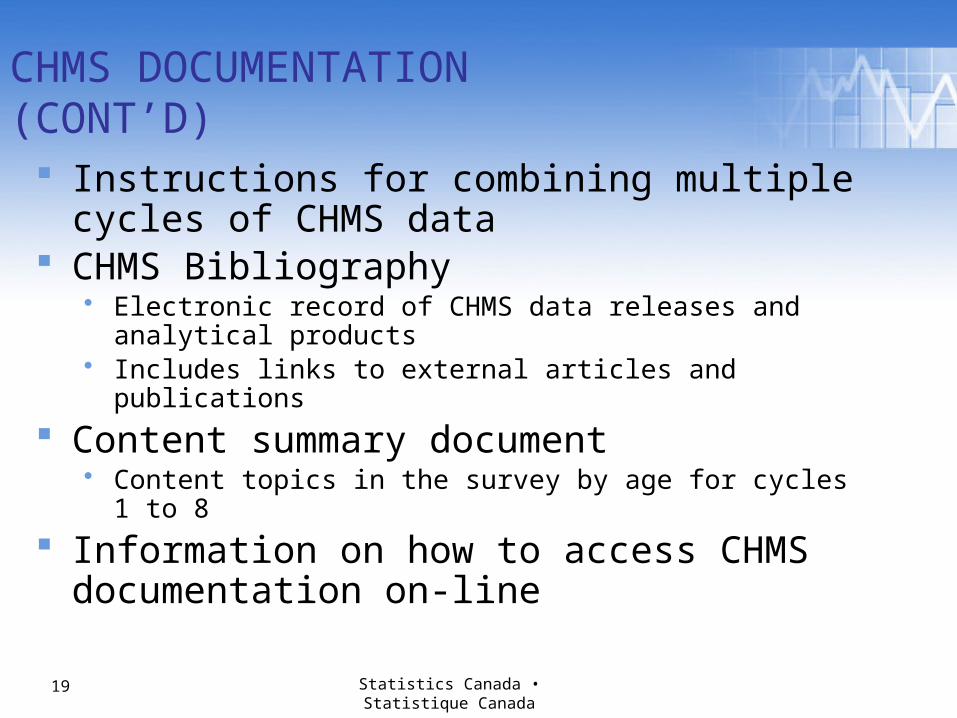
CHMS DOCUMENTATION(CONT’D) Instructions for combining multiple cycles of
CHMS data CHMS Bibliography
• Electronic record of CHMS data releases and analytical products• Includes links to external articles and publications
Content summary document• Content topics in the survey by age for cycles 1 to 8
Information on how to access CHMS documentation on-line
Statistics Canada • Statistique Canada20
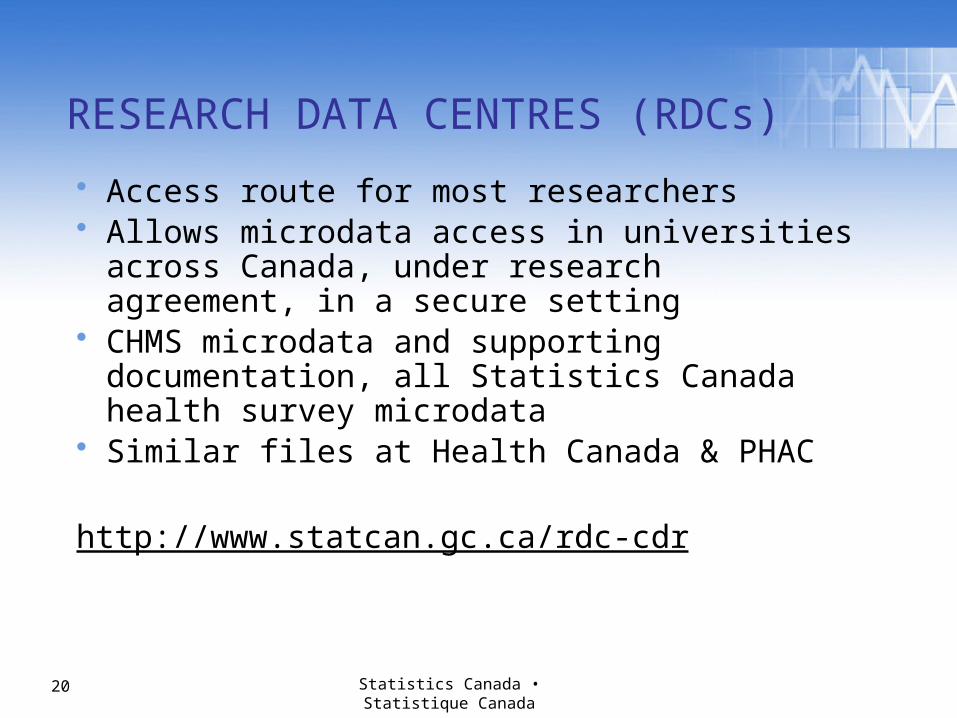
RESEARCH DATA CENTRES (RDCs)
• Access route for most researchers• Allows microdata access in universities across
Canada, under research agreement, in a secure setting
• CHMS microdata and supporting documentation, all Statistics Canada health survey microdata
• Similar files at Health Canada & PHAC
http://www.statcan.gc.ca/rdc-cdr
Statistics Canada • Statistique Canada21
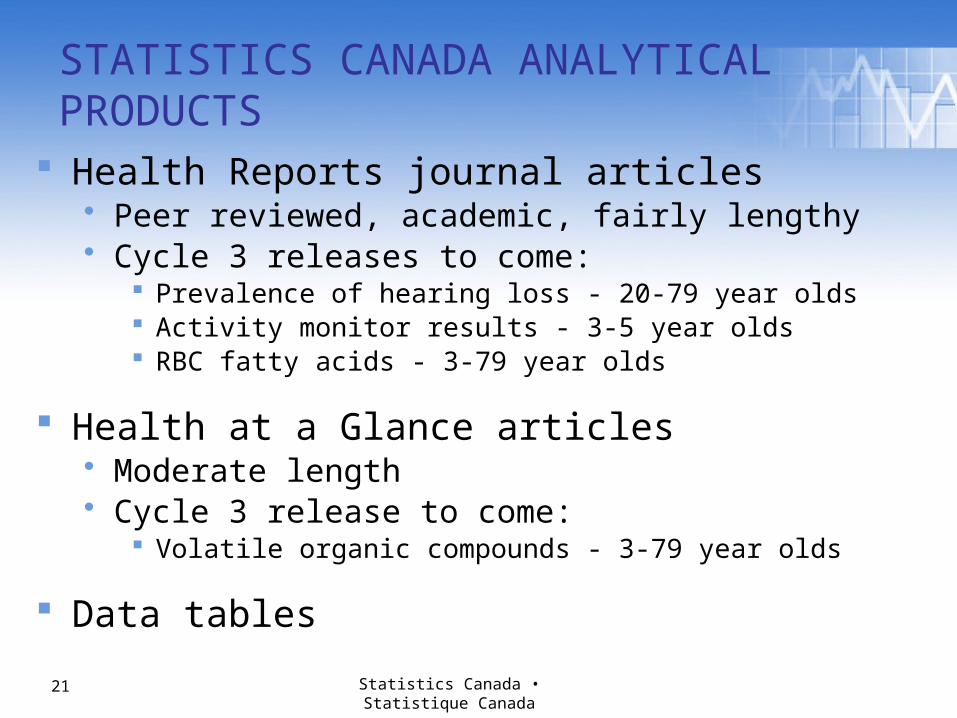
STATISTICS CANADA ANALYTICAL PRODUCTS
Health Reports journal articles• Peer reviewed, academic, fairly lengthy• Cycle 3 releases to come:
Prevalence of hearing loss - 20-79 year olds Activity monitor results - 3-5 year olds RBC fatty acids - 3-79 year olds
Health at a Glance articles• Moderate length• Cycle 3 release to come:
Volatile organic compounds - 3-79 year olds
Data tables

Statistics Canada • Statistique Canada22
STATCAN ANALYTICAL PRODUCTS (CONT’D)
Fact sheets• Plain language, basic descriptive analysis• Cycle 3 already released:
Blood pressure: 1. adults, 2. children and youth Body composition/BMI: 1. adults, 2. children and youth Chronic obstructive pulmonary disease Metabolic syndrome Cholesterol levels Vitamins: 1. C, 2. D Physical activity: 1. adults, 2. children and youth Hearing loss
• Cycle 3 releases to come: 1. Bisphenol A, 2. Tobacco use, 3. Lead, mercury and
cadmium, 4. RBC fatty acids
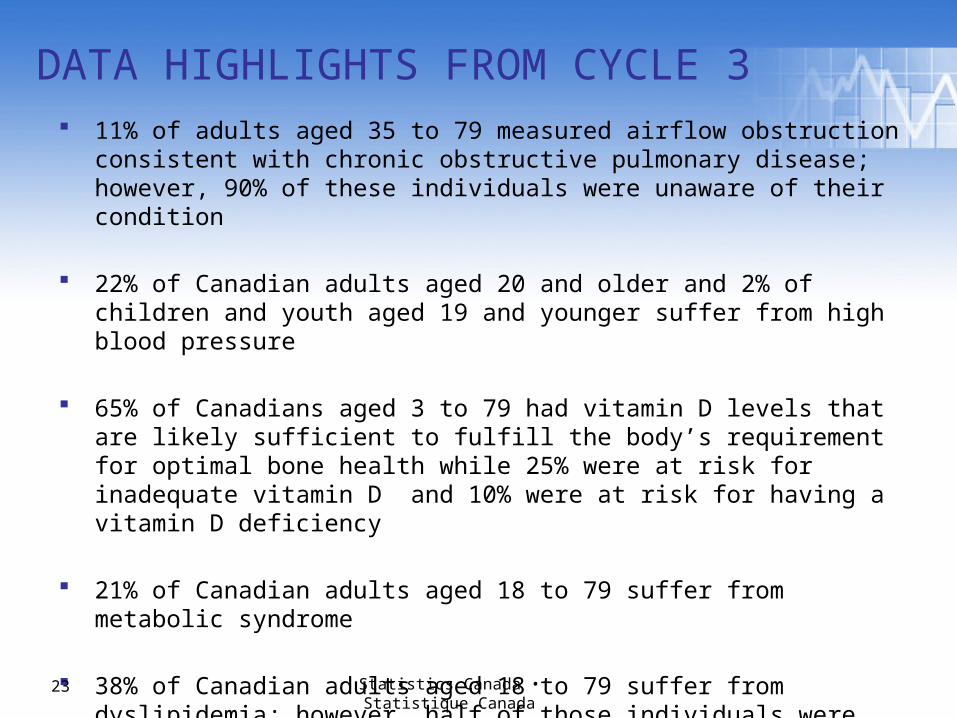
DATA HIGHLIGHTS FROM CYCLE 3 11% of adults aged 35 to 79 measured airflow obstruction consistent with
chronic obstructive pulmonary disease; however, 90% of these individuals were unaware of their condition
22% of Canadian adults aged 20 and older and 2% of children and youth aged 19 and younger suffer from high blood pressure
65% of Canadians aged 3 to 79 had vitamin D levels that are likely sufficient to fulfill the body’s requirement for optimal bone health while 25% were at risk for inadequate vitamin D and 10% were at risk for having a vitamin D deficiency
21% of Canadian adults aged 18 to 79 suffer from metabolic syndrome
38% of Canadian adults aged 18 to 79 suffer from dyslipidemia; however, half of those individuals were unaware of their condition
Statistics Canada • Statistique Canada23

Statistics Canada • Statistique Canada24
Adult total Males Females Children and youth total
Boys Girls0
10
20
30
40
50
60
70
80
EF
EF E F
E
Distribution of adults aged 18 to 79 and children and youth aged 5 to 17, by body mass index (BMI)1 and gender, household population, Canada, 2012 to 2013
Underweight / thinness Normal weight Overweight Obese
percent
E use with caution (data with a coefficient of variation (CV) from 16.6% to 33.3%)
F too unreliable to be published (data with a coefficient of variation (CV) greater than 33.3%; suppressed due to extreme sampling variability)
1. The body mass index (BMI) classification for adults is based on the Canadian guidelines for body weight classification in adults (Health Canada, 2003) and de Onis, et al. (2007) for children and youth.
Source: Canadian Health Measures Survey, 2012 to 2013
25 Statistics Canada • Statistique Canada
Adult total Children and youth total
5 to 11 years 12 to 17 years 18 to 39 years 40 to 59 years 60 to 79 years0
5
10
15
20
25
30
35
40
E
E
E
E
E
F
E
E
E
E
E
E
E
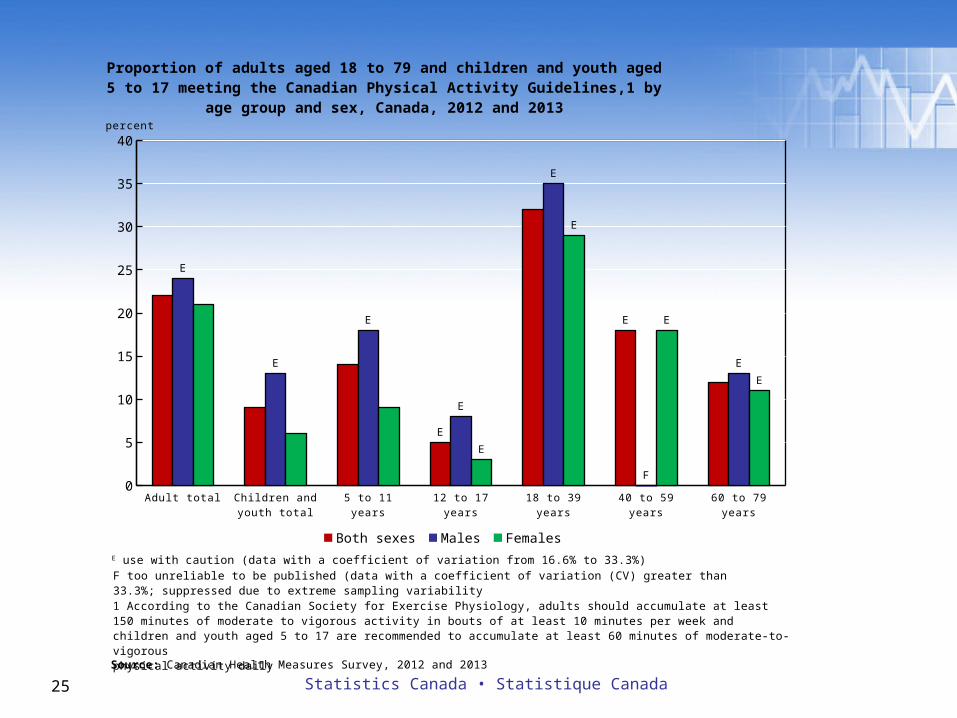
Proportion of adults aged 18 to 79 and children and youth aged 5 to 17 meeting the Canadian Physical Activity Guidelines,1 by age group and sex, Canada, 2012
and 2013
Both sexes Males Females
percent
E use with caution (data with a coefficient of variation from 16.6% to 33.3%)F too unreliable to be published (data with a coefficient of variation (CV) greater than 33.3%; suppressed due to extreme sampling variability
Source: Canadian Health Measures Survey, 2012 and 2013
1 According to the Canadian Society for Exercise Physiology, adults should accumulate at least 150 minutes of moderate to vigorous activity in bouts of at least 10 minutes per week and children and youth aged 5 to 17 are recommended to accumulate at least 60 minutes of moder-ate-to-vigorous physical activity daily

26Source: Canadian Health Measures Survey, 2007-2009. Statistics Canada
Physical Activity Guidelines
19 to 79 years 19 to 39 years 40 to 59 years 60 to 79 years Males FemalesBoth sexes All ages
0
5
10
15
20
25
30
35
40
45
50
E
Chart 1 Hearing loss1 among adults aged 19 to 79, by sex and age group,
Canada, 2012 and 2013
Age group
percent
1. Hearing loss is defined as a speech-frequency pure-tone average consistent with at least mild hearing loss (> 25 decibels in adults aged 19 to 79 or > 20 decibels in children and youth aged 6 to 18) in at least one ear.
Source: Canadian Health Measures Survey, 2012 and 2013.
E use with caution (data with a coefficient of variation from 16.6% to 33.3%)

Statistics Canada • Statistique Canada27
FUTURE CONTENT CYCLES 5-8
Cycles 5 & 6• Neighbourhood environment• Sleep apnea• Hair (metals)• Saliva (DNA)• Vision• pQCT and mechanography
Cycles 7 & 8• Dual-energy x-ray absorptiometry (DXA)

Statistics Canada • Statistique Canada28
ADDITIONAL INFORMATION
For more information on the CHMS:
• toll-free number: 1-888-253-1087• e-mail: [email protected]• Web site: www.statcan.gc.ca/chms

Statistics Canada • Statistique Canada29
QUESTIONS?