Embed Size (px)
Citation preview
SELECTING AMONG WEIBULL» LOGNORMAL AND GAMMA DISTRIBUTIONS
USING COMPLETE AND CENSORED SAMPLES
Siswadi and C. P. Quesenberry
North Carolina State UniversityRaleigh» NC 27650-5457
Institute of Statistics Mimeograph Series 11609
-"
ABSTRACT
In a recent paper, Kent and Quesenberry [19] considered using
certain optimal invariant statistics to select the best fitting member
of a collection of probability distributions using complete samples
of life data. In the present work, extension of this approach in two
directions are given. First, selection for complete samples based on
scale and shape invariant statistics is considered. Next, the selection
problem for type I censored samples is considered, and both scale
invariant and maximum likelihood selection procedures are studied. The
two-parameter (scale and shape) Weibull, lognormal, and gamma
distributions are considered and applications to real data are given.
Results from a (small) comparative simulation study are presented.
1. INTRODUCTION
The two-parameter (scale and shape) Weibull, lognormal and
gamma distributions are all commonly used in reliability and life
testing problems. The problem of selecting one of these three
distributions for a particular sample, either complete or censored,
is a difficult one. In this work we consider basing the selection
on the values of certain selection statistics computed from the
sample. Although we consider selection based only on sample
information, it should be noted that in some practical problems
further inrormat1on may De ava1~aD~e wn~cn snoui~ aiso De weighed
in the final selection of a distribution. Such information could be
derived, for example, from known physical characteristics or a
failure mechanism and its failure rate.
Also, it should be mentioned that throughout this paper we
treat the selection of one of the distributions as a forced selection
problem. That is, we formally select exactly one of the competing
distributions. In practice, we may sometimes wish to use a partial
selection procedure which does not necessarily always select one
distribution over the others when they are close together, as
indicated by selection statistics that are nearly equal. The
selection statistics posed here may be readily used in partial
selection schemes, however, we do not explicitly consider these
applications in the present paper.
Kent and Quesenberry [19], KQ, proposed a forced selection
procedure based upon statistics that are invariant under

2
scale transformations. Other relevant literature includes a paper
by Dumonceaux, Antle and Haas [11] who examined maximum likelihood
ratio (MLR) tests for discriminating between two models with unknown
location and scale parameters, and compared empirically the power of
~aR tests with that of uniformly most powerful invariant (liMPI) tests
for discriminating between normal and Cauchy distributions. They
actually recommend the MLR test over the liMPI test on the basis of
relatively good power and ease of computation. Dumonceaux and Antle
[10] gave an MLR procedure for discriminating between Weibull and
lognormal distributions that is based on the fact that the lo~a
rithms of both Weibull and lognormal random variables have location
scale parameter distributions. In a recent paper, Bain and
Engelhardt [2] considered a likelihood ratio selection statistic
for selecting between gamma and Weibull distributions.
Some graphical procedures for the selection problem have been
given by Nelson ~21}, and by Barlow and Campo [3]. Other papers
that are related to the present work include Hogg, Uthoff, Randles
and Davenport [18], who discuss a number of selection procedures,
including one based on location-scale invariant statistics; ljyer
([12], [13]) who considers a number of selection procedures for
discriminating between pairs of classes of location-scale distri
butions; and Uthoff ([24], [25]) who considers some particular
invariant statistics. As general reierences for invariant tests
see Hajek and Sidak [15] and Lehmann [20], and for MLR tests see
Cox [8]. Volodin [26] considers a generalized three-parameter
3
gamma distribution and discriminates between two-parameter gamma and
Weibull distributions by making scale invariant tests on the other
parameters.
As mentioned above, KQ considered selecting among the gamma,
lognormal and Weibull families for the complete sample problem.
The selection statistic posed was formed by first deriving
a scale invariant statistic that is optimal in the sense
that it minimizes the sum of the two probabilities of
selecting the incorrec~ dis~ribution for ~wo conformable
(cf.Quesenberry and Starbuck(221) distrjbutions~ and
then repla~ing the shape parameter by its ~~ estimator.
Such procedures were
called subOPtimal, and the selection statistics for the three families
were set out in simple closed form formulas in that paper.
In the present work we consider two major changes in the approach
and problem considered in KQ. First, for the lognormal and Weibull
families we use optimal scale and shane invariant selection statistics.
Also, we consider the selection problem for type I censored samples
as well as for complete samples. For these cases the selection
statistics are generally expressed as definite integrals whose evalu
ation requires numerical integration. Thus,a substantial part of
this work has necessarily been concerned with the development of
computer algorithms to evaluate these integrals.
'.
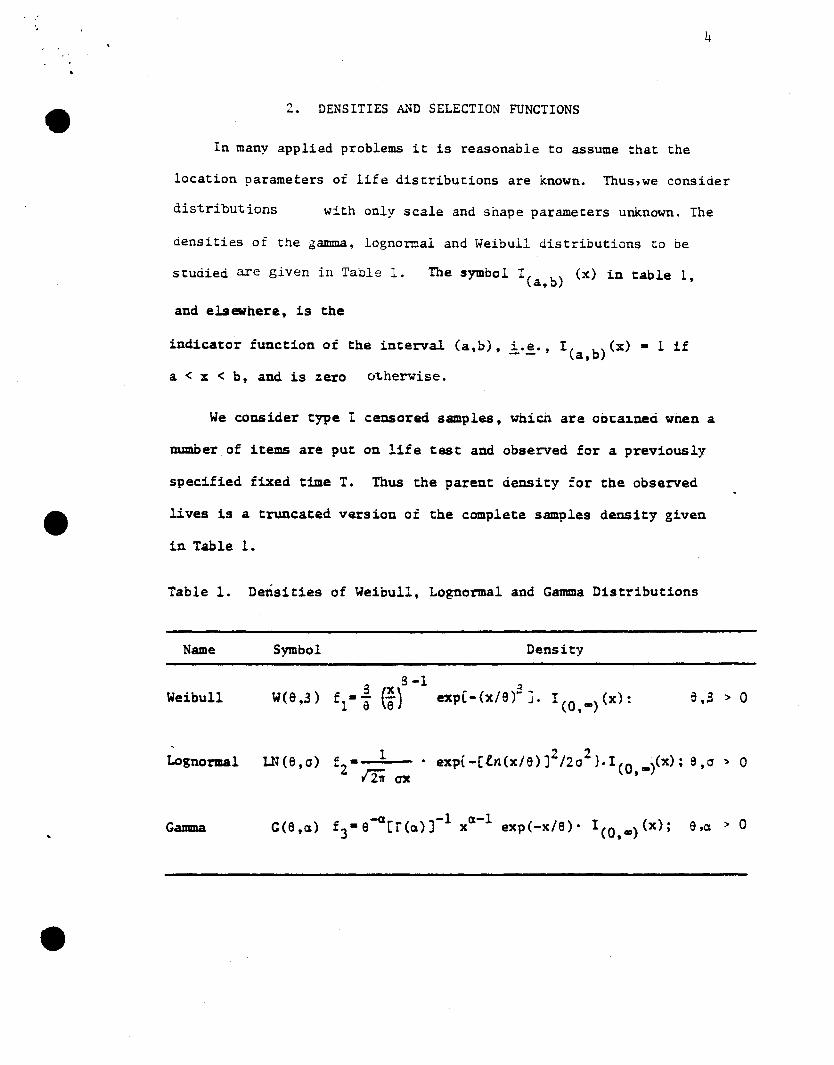
"l... DENSITIES ~~D SELECTION FUNCTIONS
4
In many applied problems it is reasonable to assume that the
location parameters of life distributions are known. Thus,we consider
distributions with only scale and snape parameters unknown. The
aensities of the gamma, lognormal and Weibull distributions to be
studied are given in Table 1.
and elsewhere, 1s the
The symbol I(a.b) (x) in table 1,
indicator function of the interval (a,b), i.~., I(a,b)(x) - 1 if
a < x < b, and is zero ol.herwise.
We consider type ! censored samples, whici1 are ootaJ.neci wnen a
number of items are put on life test and observed for a previously
specified fixed time T. Thus the parent density for the observed
lives is a truncated version of the complete samples density given
in Table 1.
Table 1. Densities of Weibull, Lognormal and Gamma Distributions
Name Symbol Density
Sg -1
~
Weibu11 W( e,3 ) f-- (i) exp[-{x/6)'" j. I(O,CD)(X); e,3 > 01 a
Lognormal UH6,a)4: _ 1
• exp{ -(In{xle) J2 1202
}- I (0, CD)(X) ; e,c > 0"2 Iiif ax
Gamma. G(6,a) f - e-Q[r{Q) ]-1 a-1 exp(-x/6)- I(O,CD) (x); e,a ~ 03 x
4a
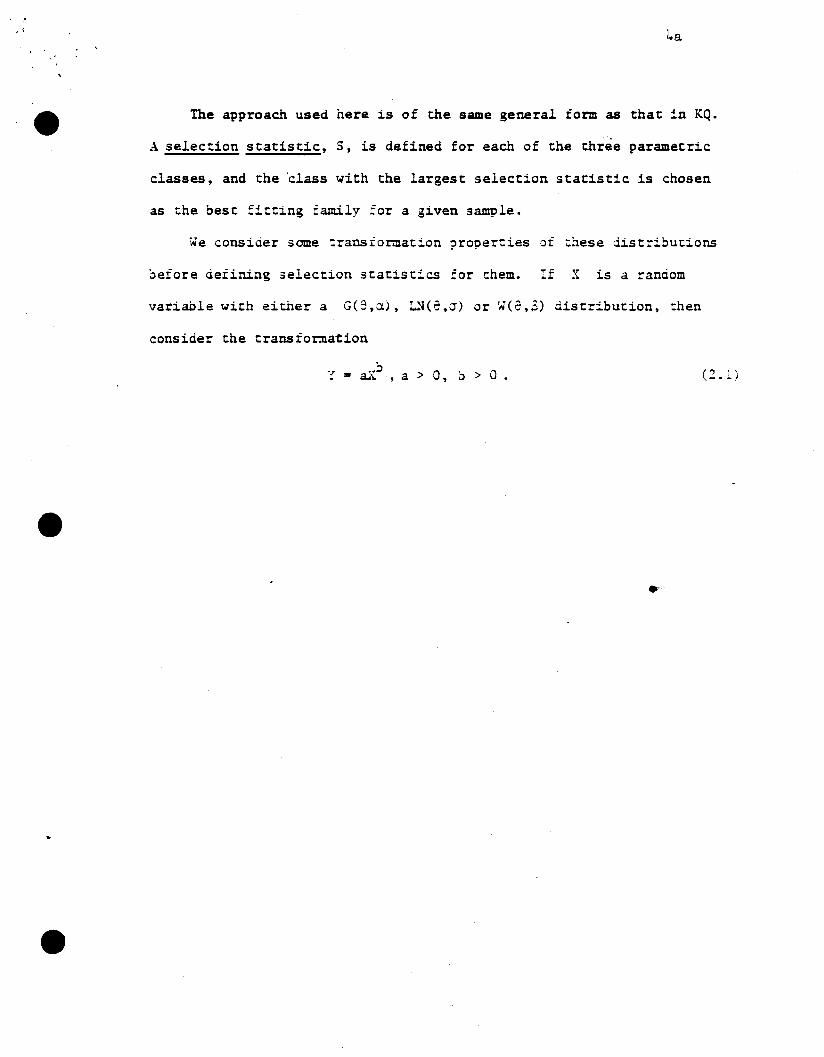
The approach used here is of the same general torm as that in KQ.
A selection statistic, S, is defined for each of the three parametric
classes, and the 'class with the largest selection statistic is chosen
as the best fitting family for a given sample.
We consider some transiormation ?roperties of :hese dist=ibucions
~efore defining selection statistics for them. If X is a random
variable with either a G(9,a), ~~(a,J) or W(e,~) distribution, then
consider the transfor.na~ion
7. = .•::> > 0a.\. • a , b > a . (2.1.)

, ,-
If x isa W(S,S) random variable, then y isa bW(a6 , 3/b)
5
random variable; and if X is a LN(6,a) random variable, then
y b .is a UHa6 I ba) random variable. Thus Weibull random variables are
transformed to Weibull random variables by (2.1), and lognormal random
variables are transformed to lognormal random variables by this trans-
formation. Unfortunately, for present purposes at least, the gamma
distributions do not share this property since a gamma random variable
is not always transformed to another gamma random variable by (2.1).
That is to say, the G(e,~) class is not a scale-shape class that is
~n.~fn~ah~~ uith th~ log~~~al a~d Weibull classes as d~f1ned by
Quesenberry and Starbuck (22]. Nevertheless, we use here a selection
statistic for the complete samples problem which is essentially
the value of the density function of a maximal invariant when each of
the three parents is assumed.
For x1' ••• 'Xn an observed sample, we define the selection
statistic for a density ~nction f t " (1-1.2,) by
....S1 • f J
o 0
A A n-lAn- 2 'A.fi(Yx1 , ... ,yx )Y (x, .•• x ) dYdA
n .. n (2.2)
Due to the proper~ of the G(e,~) distribution discussed above,
the selection statistic S~ of (2.2) is a function of the parameteroJ
~. We obtain a selection statistic by replacing ~ by its maximum
likelihood estimator, ~. in this function. The selection statistics
used in this work are given in Table 2.
6
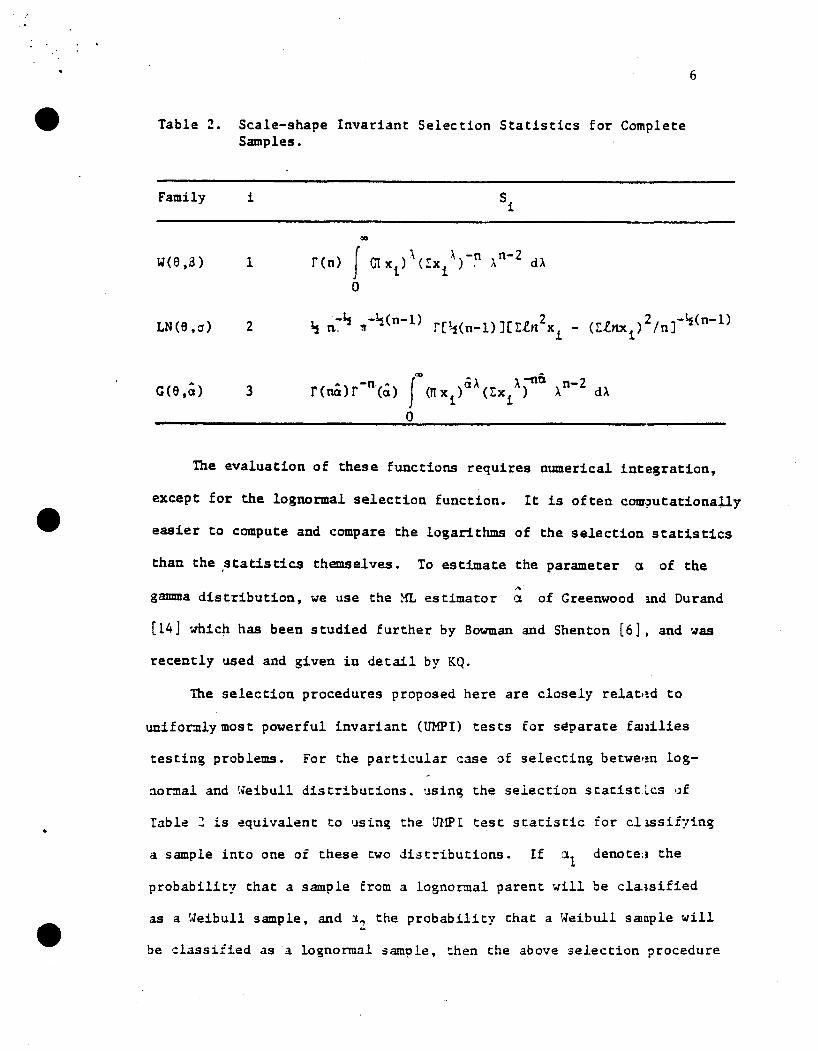
Table 2. Scale-shape Invariant Selection Statistics for CompleteSamples.
Family
W(6 ,8)
LN(6,a)
G(6,a)
i
1
2
3
aD
r(na)r-n(a) r(JT xi)O\rx/'>& ). n-2 d)'
o
..
The evaluation of these functions requires numerical integration,
except for the lognormal selection function. It is often com.?utationally
easier to compute and compare the logarithms of the selection statistics
than the ,statistics themselves. To estimate the parameter a of the
gamma distribution, we use the ~ estimator a of Greenwood Uld Durand
[14J which has been studied further by Bowman and Shenton [6]. and was
recently used and given in detail by KQ.
The selection procedures proposed here are closely relatf!d to
uniformly most powerful invariant (UMPI) tests for st!parate fal1ilies
testin~ problems. For the particular case of selectin'J betwe·m log-
normal and \';eibull distributions. usin'J the selection statist~cs ()f
rabl~ 2 is t!quival~nt to ',Jsin'J the mfPI test statistic for cllSsif:rin'J
a sample into one of these two distributions. If deno te;J the
probability that a sample from a lognormal parent will be cla;Jsified
as a Weibull sample, and ~Z the probability that a Weibull smnple will
be classiiied as a lo~normal ~ample, then the above selection procedure
7
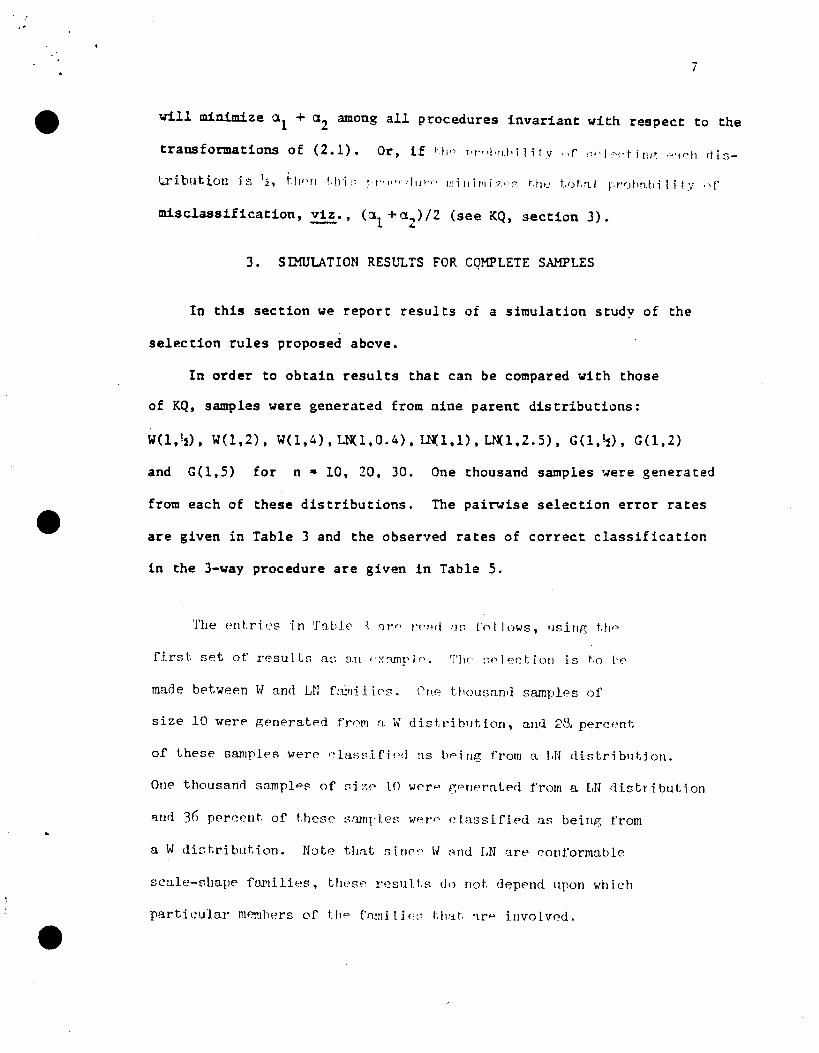
will minimize a 1 + a2 among all procedures invariant with respect to the
transformations of (2.1). Or, if 1.1;" T'r'''l'abi]it.v >If ,"'Ieodirw .c"wh dis
tribut.ion is Ii, tllPII Ud ~~ r t'r,,·,rI,P'" lIli II if" i ';"S Uh-, t.f)t.aJ p'r)hn.hi I i tv "f
misclassification, viz., (at +(12)/2 (see KQ, section J).
3. SIMULATION RESULTS FOR CqMPLETE SAMPLES
In this section we report results of a simulation study of the
selection rules proposed above.
In order to obtain results that can be compared with those
of KQ, samples were generated from nine parent distributions:
W(1. !~), W(l , 2), W(1.4) , LN( 1. O. 4), we 1,1) •~ I, 2 . 5), G(1, ~). G(l , 2 )
and G(1.5) for n· 10. 20. 30. One thousand samples were generated
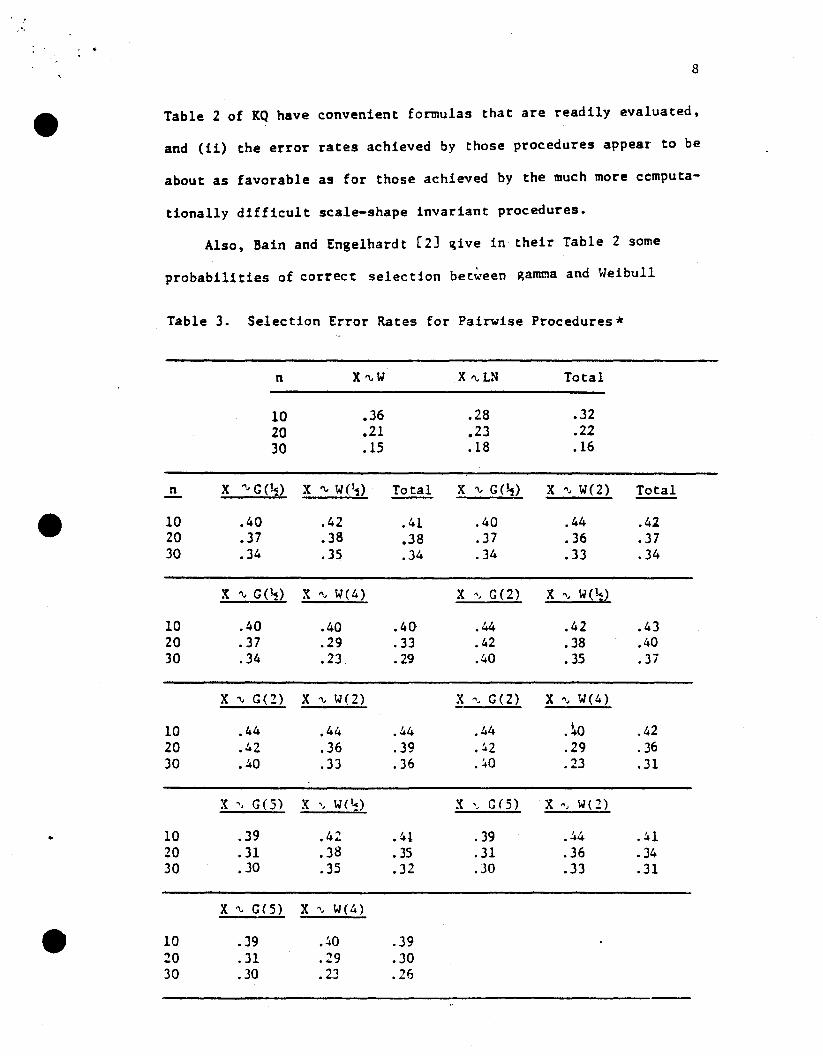
from each of these distributions. The pairwise selection error rates
are given in Table 3 and the observed rates of correct classification
1n the 3-way procedure are given in Table 5.
'l'be ent;ri'=sin TablE' ~ at''' l'f'.'ld '1::; t'oIJows, IJsitlf.', U1P
first. set of result.s as an /·xnmrl.('. 'I'll" ::;ple~t.iotl is t.o t,E'
made between v[ and LN fain; 1 ios. ('liP thousand samples of
size 10 were generatpd frnpl n. iol distl'iblltion, and 28. percpnt.
of these samples were '_'lasrdfipd as bpinl!, from a UI distriblltion.
Olle t hous8wi samples of s j Z~~ 10 wpr p r:Plleratpd from a LH rlistr i bution
and 36 peref:'lIt. of t.hese srunI'l.es Wp r·" c l.assifipd as beinp.: from
a W di~ f,ri but ion. Note that s.i tlC~\ \V ~~ nd LN are conformable
scale-shape fUl'li lies, tlH:'Sf' resu U.s dn tlot depend upon wtl i ch
partieular mPmb(~rs of tho rl)lnili(~' Lh~it, nr'-' i.llvolved.
, ,
This procedure has total error probabilities for the case of a
lognormal vs a Weibull that are the smallest possible for a sca.l.,.-Ehar'" invariant
procedure. Comparison of the results for this case given in '~able 3
and those in Table 4 of KQ shows that the present optimal pro(:edure
has very little advantage over the suboptimal procedure of KQ For the
•
other t"Jo-'Jay selection problems, iSamma ~ lo~normal and '~amma '15
'..Jeibull, the comparisons of the proc edures of this paper '.011 th those ,J f
"
KQ are not clearcut. This is because the gamma distribution does :lot
admit a l~! statistic 'Wit~ respect to t~e transfomations of (2.1).
In view of these observations 'We recommend the selection procedures
set out in KQ on the grounds that (i) the selection statistic:; in
8
Table 2 of KQ have convenient formulas that are readily evaluated,
and (ii) the error rates achieved by those procedures appear" to be
about as favorable as for those achieved by the much more ccmputa-
t10nally difficult scale-shape invariant procedures.
Also, Bain and Engelhardt [2J give in their Table 2 some
probabilities of correct selection bet~een ~amr.ta and Weibull
Table 3. Selection Error Rates for Pairwise Procedures*
n X",W X '" LN Total
10 .36 .28 .3220 .21 .23 .2230 .15 .18 .16
n X "'G(~) X '" W(~) Total X '" G(~) X '\, W(2) Total
10 .40 .42 .41 .40 .44 .4220 .37 .38 .38 .37 .36 .3730 .34 .35 .34 .34 .33 .34
X '" G(~) X '" W(4) X ", G(2) X ". W(~)
10 .40 .40 .40" .44 .42 .4320 .37 .29 .33 .42 .38 .4030 .34 .23 .29 .40 .35 .37
X '\, G(2) X '\, W( 2) X ". G(2) X ". W(4)
10 .44 .44 .44 .44 .~O .4220 .42 .36 .39 .42 .29 .3630 .40 .33 .36 . ~o .23 .31
:< " G(5) X " W(~) X '_ G(5) X ", wen
• 10 .39 .42 .41 . 39 .~4 .U20 .31 .38 .35 .31 .36 .3430 .30 .35 .32 .30 .33 .31
~(5) X ". W(4)
10 .39 .40 .3920 .31 .29 .3030 .30 .23 .26
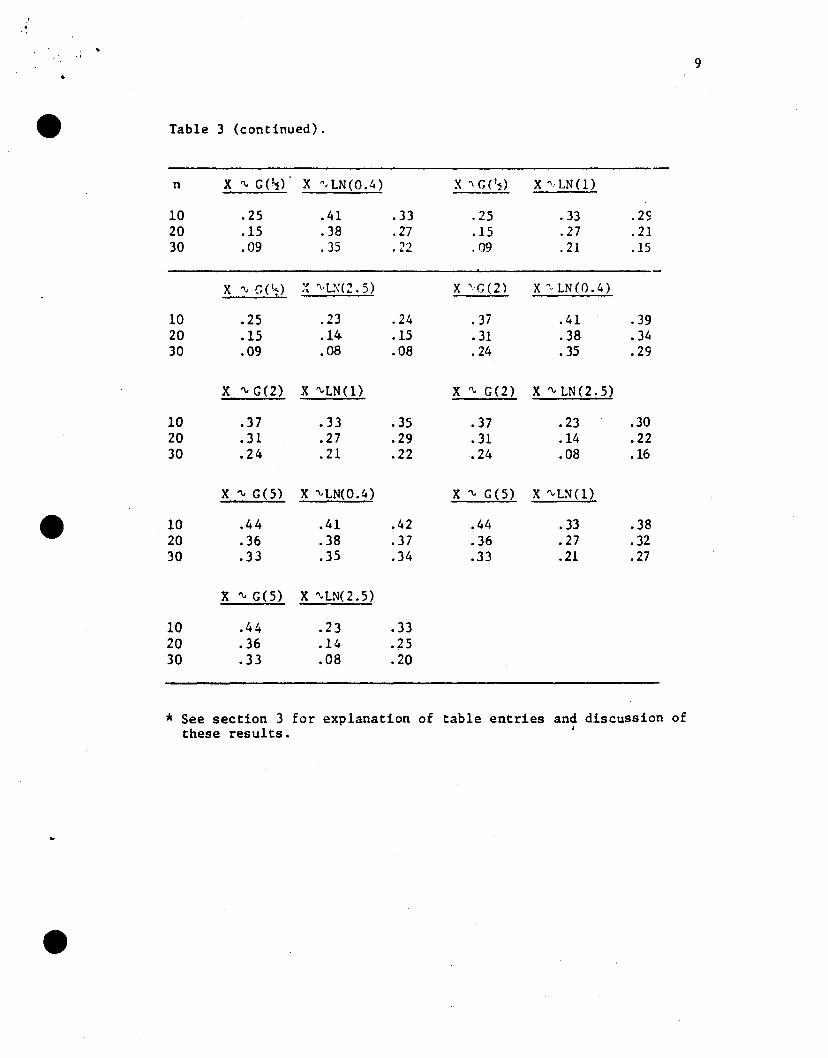
Table 3 (continued).
n X '" G(1) X "- LN(0.4) X 'I G('"1) X" LN(l)
10 .25 .41 .33 .25 .33 .2S20 .15 .38 .27 .15 .27 .2130 .09 .35 .22 .09 .21 .15
X ", G(~) ~ "-L:\(2. 5) X "-G(2) X "- LN (0.4)
10 .25 .23 .24 .37 .41 .3920 .15 .14- .15 .31 .38 .3430 .09 .08 .08 .24 .35 .29
X '" G(2) X "'LN(l) X '" G(2) X '" LN (2.5)
10 .37 .33 .35 .37 .23 .3020 .31 .27 .29 .31 .14 .2230 .24 .21 .22 .24 .08 .16
X '" G(5) X "'LN(0.4) X '" G(5) X "'LN(l)
10 .44 .41 .42 .44 .33 .3820 .36 .38 .37 .36 .27 •3230 .33 .35 .34 .33 .21 .27
X '" G(5) X "'LN( 2.5)
10 .44 . 23 .3320 .36 .14 .2530 .33 .08 .20
* See section 3 for explanation of table entries and discussion ofthese results. •
9
10
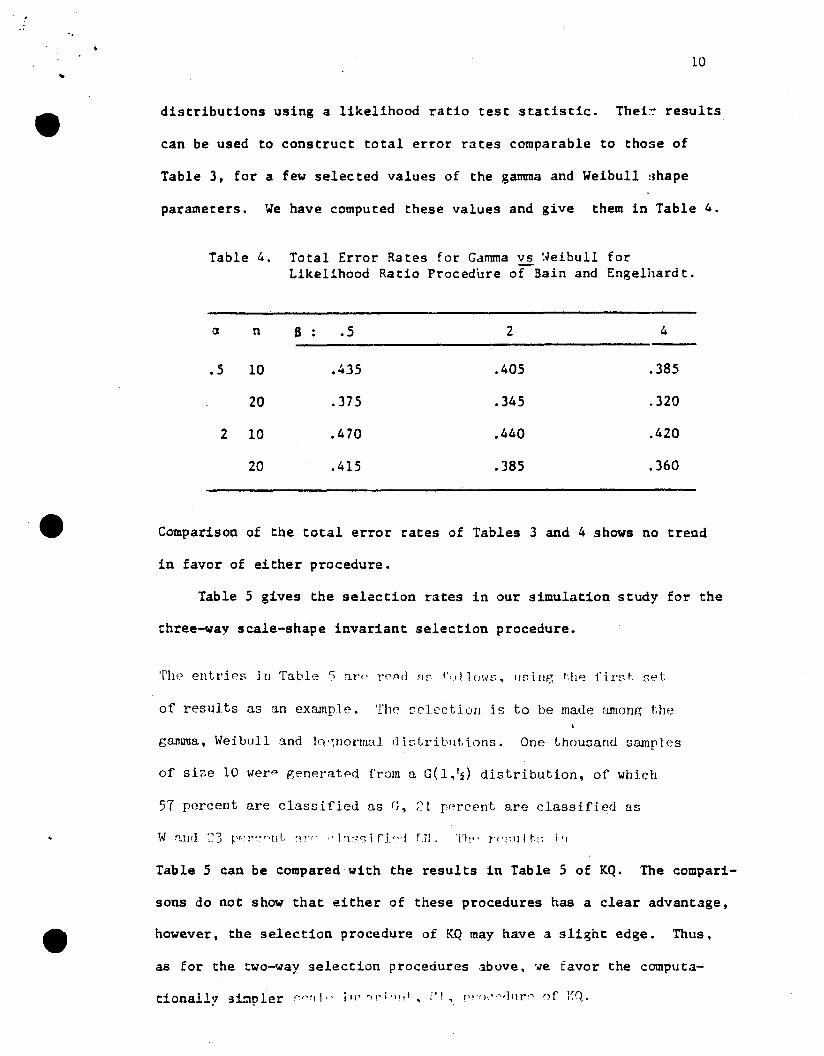
distributions using a likelihood ratio test statistic. Thei~ results
can be used to construct total error rates comparable to those of
Table 3, for a few selec ted values of the gamma and Weibull :Jhape
parameters. We have computed these values and give them in Table 4.
Table 4. Total Error Rates for Gamma vs ~.]eibull forLikelihood Ratio Procedbre of Bain and EngeDlardt.
a
.5
n
10
20
B .5
.435
.375
2
.405
.345
4
.385
.320
2 10
20
.470
.415
.440
.385
.420
.360
Comparison of the total error rates of Tables 3 and 4 shows no trend
in favor of either procedure.
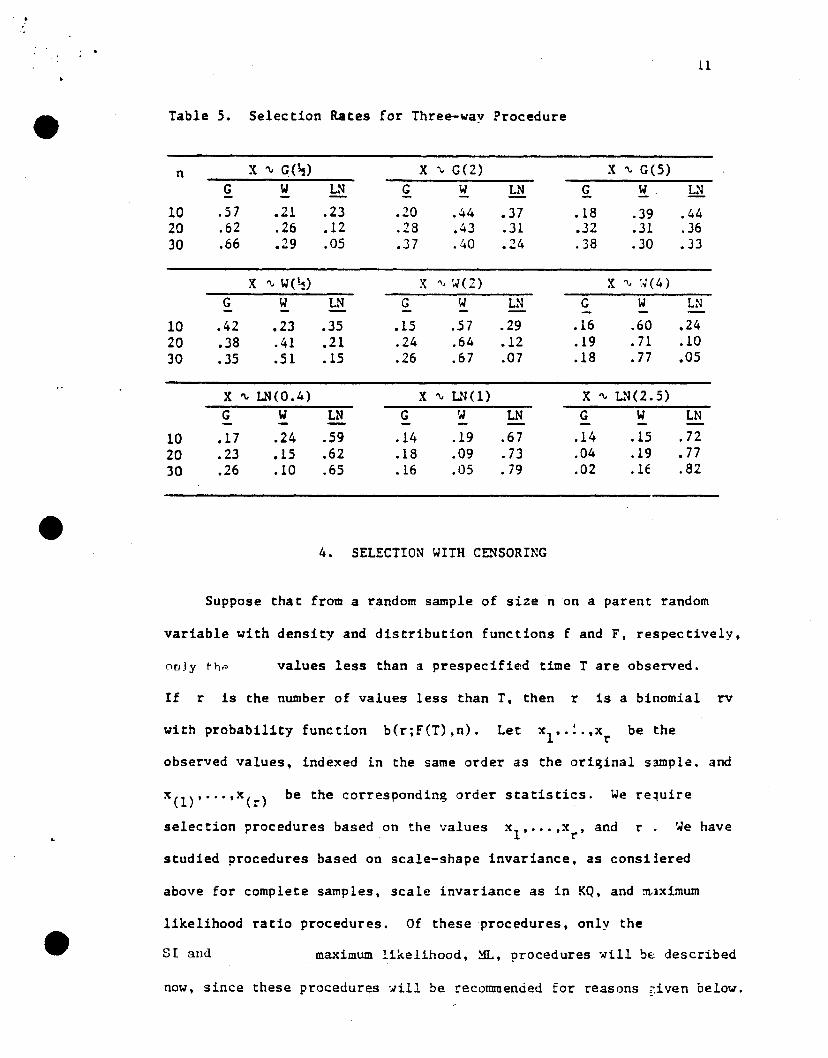
Table 5 gives the selection rates in our simulation study for the
three-way scale-shape invariant selection procedure.
'fIle entrips jn Table '5 arl' n'fld flr: f'oll()\·n~, llsing I:h~ first-. set
of results as an example. The s('lcction is to be made mnong the
gamma, Weibull and }.','~nonnaJ di::;Lribllt.:ions. One thousand samples
of size 10 wer p generated from a 0(1,12) distribution, of .which
57 percent are classified as G, ?l percent are classified as
Table 5 can be compared with the results in Table 5 of KQ. The compari-
sons do not show that either of these procedures has a clear advantage,
however, the selection procedure of KQ may have a slight edge. Thus.
as for the two-way selection procedures above, ~e favor the computa-
t:ionall~, gimpIer "".'11,' ill' e'I'i.,,,,, ;'1, r'I'fl\,·,.jI!r'f' of J\0..
·..
11
Table 5. Selection Rates for Three-way Procedure
n X '" ~(~) X '" G(2) X '" G(5)G W LN G W LN Q. !i. L~
10 .57 .21 .23 .20 .44 .37 .18 .39 .4420 .62 .26 .12 .28 .43 .31 .32 .31 .3630 .66 .29 .05 .37 .40 .24 .38 .30 .33
X '" W(~) X ", W( 2) X '" io/( 4)G W LN G W L:-l G W L"..-
10 .42 .23 .35 .15 .57 .29 .16 .60 .2420 .38 .41 .21 .24 .64 .12 .19 .71 .1030 .35 .51 .15 .26 .67 .07 .18 .77 .05
X '" LN(0.4) X '" UHl) X '" LN(2.5)G W LN G W LN G W LN- - - - - -
10 .17 .24 .59 .14 .19 .67 .14 .15 .7220 .23 .15 .62 .18 .09 .73 .04 .19 .7730 .26 .10 .65 .16 .05 .79 .02 .LE .82
4. SELECTION WITH CENSORING
Suppose that from a random sample of size n on a parent random
variable with density and distribution functions f and F. respectively,
values less than a prespecifie:d time T are observed.
If r Is the number of values less than T, then r is a binomial rv
with probability function b(r;F(T).n). Let be the
observed values, indexed in the same order as the ori~inal sample. and
x(l) •..•• x(r) be the corresponding order statistics. We re~uire
selection procedures based on the values x1 •••.•xr • and r. We have
studied procedures based on scale-shape invariance. as consiiered
above for complete samples. scale invariance as in KQ. and m.iximum
likelihood ratio procedures. Of these procedures, only the
SI and ma~imum likelihood, ML, procedures Nill ~e described
now, since these procedures Nill be recommended for reasons ~iven below.
12
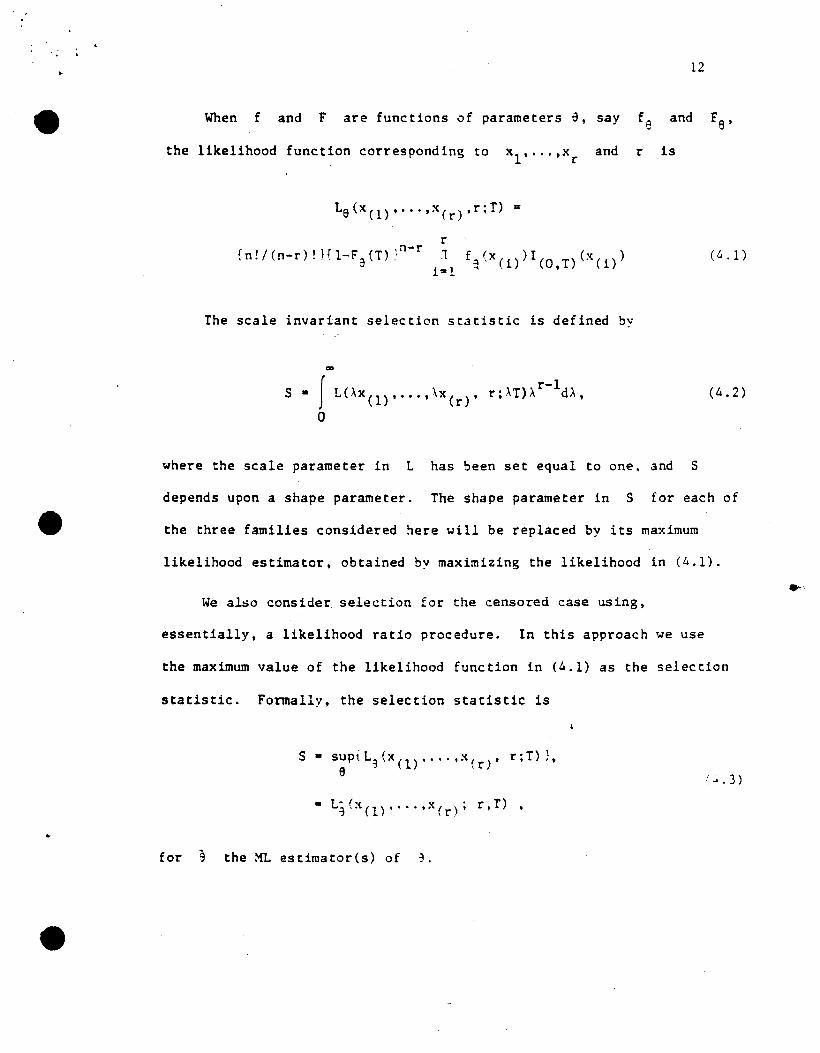
When f and F are functions of parameters e, say f e and Fe'
the likelihood function corresponding to xl •...• x r and r is
rn-rf n ! / (n-r) ! }{ 1-Fa (T) \ (to. 1)
The scale invariant selection statistic is defined by
<II
where the scale parameter in L has been set equal to one. and S
(4.2)
depends upon a shape parameter. The shape parameter in S for each of
the three families considered here will be replaced by its maximum
likelihood estimator, obtained by maximizing the likelihood in (4.1).
We also consider selection for the censored case using.
essentially. a likelihood ratio procedure. In this approach we use
the maximum value of the likelihood function in (4.1) as the selection
statistic. Formally, the selection statistic is
for e the ~L estimator(s) of 3.
i..:. • 3 )
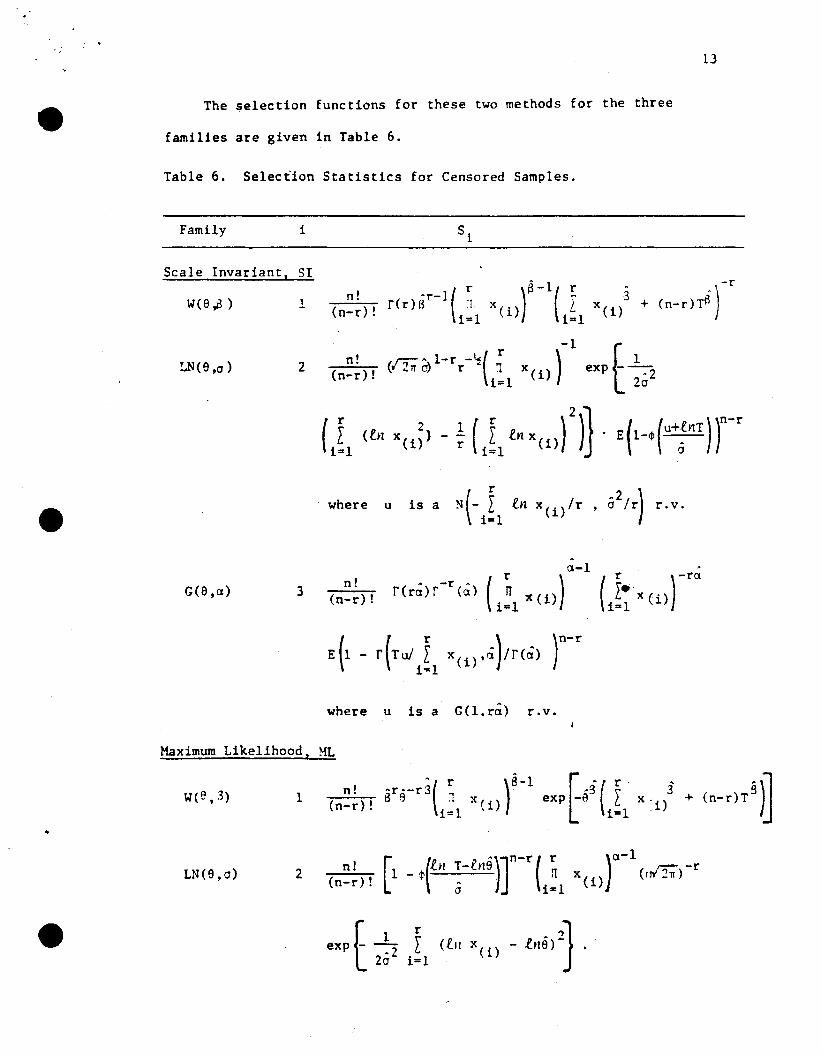
The selection functions for these two methods for the three
families are given in Table 6.
Table 6. Selection Statistics for Censored Samples.
13
Scale Invariant, SI
Family
w(e,i3 )
!.oN(e,o )
i
1
2 n!(n-r) !
-1 fr~ 1-r -~ 1
(/21T a) r (~ X(i») exp---=21=1 20
G(e,CI) 3n!
(n-r)!
.
(r ) -raL·~·x (i)
1"1
where u is a G(l.ra) r.v.
Maximum Likelihood, ML
1n! ~r.-r3( r )8-1
(n-r)! B e :1 x(1)1=1 t ~(r ~~g 3
exp -11 LX. i)1=1 .
LN(9,0) 2 n!(n-r)! [ (
~)Jn-r ( r )a-11 - i' in ~-tn9 1~l x(1) (IlV"S")-r
exPf -L~220
14
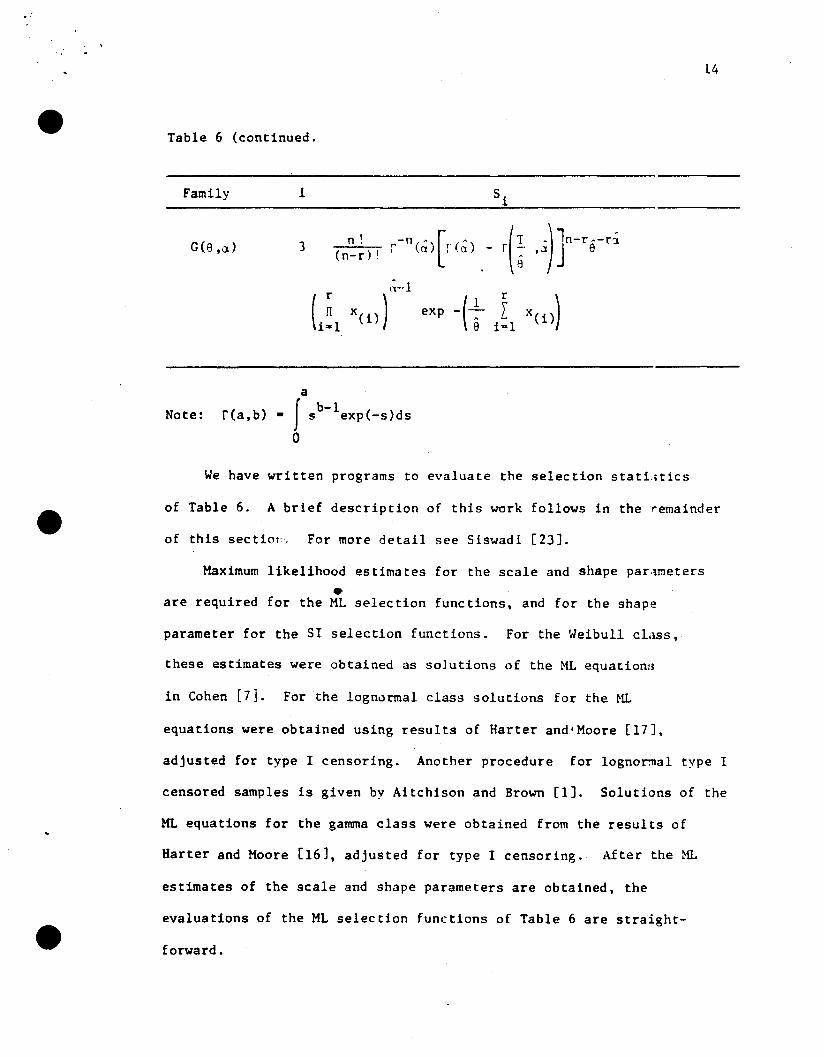
Table 6 (continued.
Family 1 S1
G(e ,cd 3 n! r-n(~)[r(~) - ( T _)In-r --r;(n-r) ! f:',-l e
8
\;--1
L~l x( i) ) -( ~r
xCi »)exp Li"l
a
Note: r(a,b)· f sb-1exp (-s)ds
o
We have written programs to evaluate the selection statL;tics
of Table 6. A brief description of this work follows in the 'remainder
of this sectiol'. For more detail 5ee Siswadi [2J].
Maximum likelihood estimates for the scale and shape par,meters
•are required for the ML selection functions, and for the shape
parameter for the 81 selection functions. For the Weibull CL1SS,
these estimates were obtained as solutions of the ML equation:;
in Cohen [7). For the lognormal class solutions for the ~~
equations were obtained using results of Harter and' Moore [17J.
adjusted for type I censoring. Another procedure for logno~a1 type I
censored samples is given by Aitchison and Brown [1]. Solutions of the
ML equations for the gamma class were obtained from the results of
Harter and Moore [16J, adjusted for type I censoring. After the XL
estimates of the scale and shape parameters are obtained, the
evaluations of the ML selection functions of Table 6 are straight-
forward.
15
'"After the ML estimate B of the shape parameter of the WI!ibull
distribution is obtained, the 51 selection function is readi.~y
evaluated. However, the selection functions for both the lognormal
and gamma scale invariant procedures are difficult to evalua':e, and
we have used Monte Carlo .:md importance sampling from the no':mal
distribution and gamma dis tribution. respectively, (see Dav:.s and
Rabinowitz, (9]) to evaluate them.
16
5. 5IMULATION RESULTS FOR CENSORED SANPLES
We have cqnducted a small Monte Carlo simulation study of the
two selection methods discussed above for censored samples to provide
some information on the error rates for these procedures. TIlese
empirical error rates allow comparisons of the two procedure~; with
each other as well as with complete sample rates given in sec:tion 3
and in KQ. Comparlso~ with complete sample rates gives a mellsure of
the loss of information due to censoring.
The families of distributions considered were W(~), W(4;, G(~),
G(2), LN(0.4), and LN(2.5); and the sample size was n ,. 30 irl all
cases. The truncation point T was chosen so that the df F(T) = 0.90,
i.~., for a mean rate of 10% censoring. One hundred samples were
generated for each of the above distributions except ~oJ(4), fc·r which
16 samples were generated. The running time for some cases ~as very
long and this limited the number of samples that could be ger.erated.
The misclassification rates for pairwise selection are Eiven in
Table 7, which is comparable to Table 3 for the complete sam~les case.
Note in Table 7 that the ~ and 51 procedures give similar error rates
for W~ LN and, in fact, both give the same total error rate of 0.29.
Comparison of these results with those of the 51 procedure for complete
samples (see Table 4 of KQ) shows that there is a rather large loss of
information due to censoring since the W, LN and total error rates are
0.19,0.15. and 0.17, respectively.
For the two-way selection error rates in Table 7 that involve a
gamma distribution, neither the ~n.. nor the 51 procedure appe~rs to
have an overall advantage. ,Uso, by comparing these cases with the
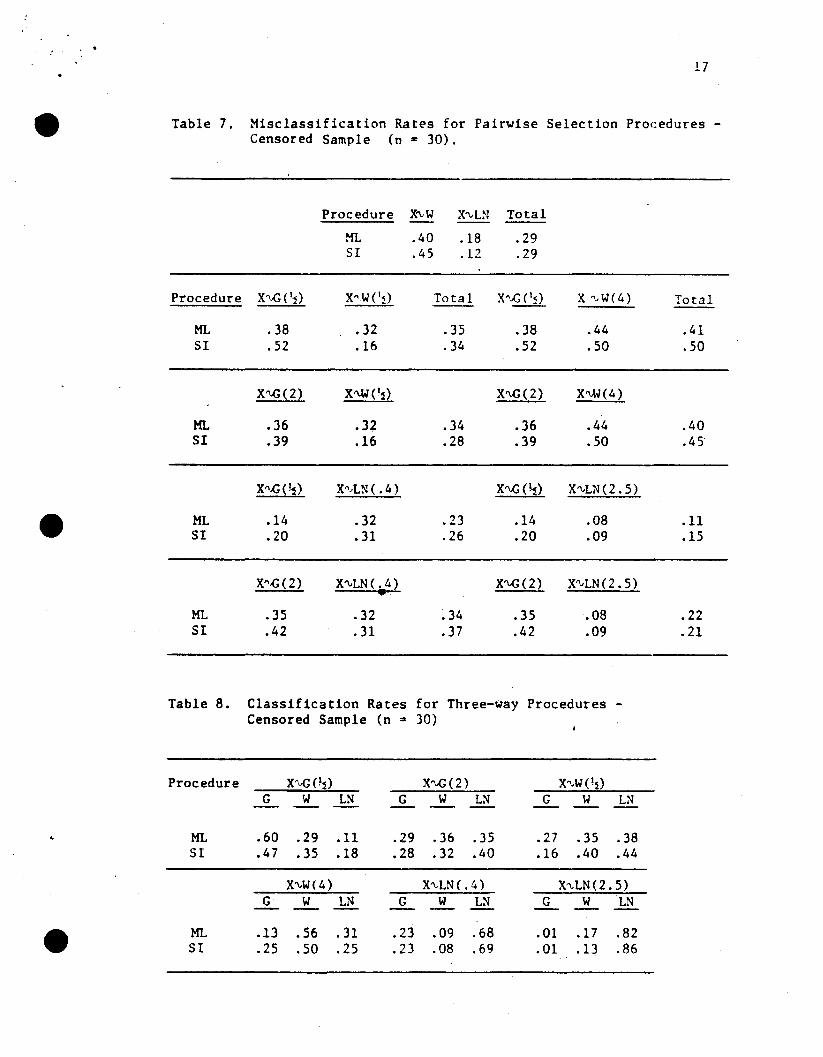
17
Table 7. Misclassification Rates for Pairwise Selection Procedures Censored Sample (n· 30),
Procedure X"'W X"'LN Total
ML .40 .18 .2951 .45 .12 .29
Procedure X"'-'G (I~) X"We~) Total X"'-'G e~) X ,,-,W(4) Total
ML .38 .32 .35 .38 .44 .4151 .52 .16 .34 .52 .50 .50
X'\.G(2) X'\.W (!~) X'\.C(2) X"-t.J( 4)
ML .36 .32 .34 .36 .44 .40SI .39 .16 .28 .39 .50 .45
X".c(~) X"JL~ ( . 4) X'\.C (~) X"-'LN(2.5)
ML .14 .32 .23 .14 .08 .n51 .20 .31 .26 .20 .09 .15
X".c(2) X"-'LN ( . 4) X"'G (2) X"-'LN(2.5)•ML •35 .32 .34 .35 .08 .2251 .42 .31 .37 .42 .09 .21
Table 8. Classification Rates for Three-way Procedures Censored Sample (n = 30)
Procedure X"·..cOj) X"..c(2) X,,-,W(!~)
G W LN G W L~ G W LN
ML .60 .29 .11 .29 .36 .35 .27 .35 .3851 .47 .35 .18 .28 .32 .40 .16 .40 .44
X,,-,W(4) X'\.LN(. 4) X'\.LN(2.5)G W LN G W LN G W LN
ML .13 .56 .31 .23 .09 .68 .01 .17 .8251 .25 .50 .25 .23 .08 .69 .01 .13 .86
18
same cases in Table 4 of KQ, we feel that the loss of information due
to censoring is not so large as Eor the W vs LN case connnented on
above.
The classification rates for three-way selection procedures are
given in Table 8. Again, neither the :rr.. nor the SI procedure appear
to have any overall advantage ,:lnd both perform qui te well. :\lso. by
comparison with Table 5 of KQ it appears that ten percent censoring
has little effect on the probability of correctly classifying a
lognormal sample, but the probabilities of correctly classifying
either Weibull or gamma samples are reduced somewhat.
•
•19
6. A USER PROGRAH A."JD E.x.\NPLES FOR CENSORED SAHPLES
The selection procedures for the three families of distributions
have been progrannned in FORTRAN. ,\ lis ting of this program can be
obtaine.d from the authors. The pro~ram computes the selectiJn
statistics for complete and censored snmples according to the formulas
given in Tables 2 and 6, respectively.
For the scale invariant procedure, the selection statistics are
computed by the Monte Carlo method given in Davis and Rabinor..ritz [9].
The program was tested on several a~amples and on many samples
produced through simulation. In general, the selection statistics
estimated did not appear reliable for heavily censored sampl~s.
Therefore, in the user program for the scale invariant procejure,
the selection results are not printed if the coefficient of ~aria-
tion of the replicated values in the Monte Carlo method is larger
than 35%
Example 1.
Birnbaum and Saunders [5] considered a set of data of lifetimes,
in thousands of cycles, of aluminum sheeting under periodic loading,
to illustrate the gamma family. If we assume that the experiment
•was terminated at a prespecified time, say T = 1900, then the censored
observations and the results of the selection procedure are presented
in Table 9. For these data. the (';eibull family is selected by both
the ~a and SI procedures. however, the selection statistics EoI' the
gamma family are only slightly smaller. It is also to be noted,
although the details .:Ire not given here, for the complete sample
the selection procedure based on the selection statistics given in
Table 2 yields the same resul ts.
20
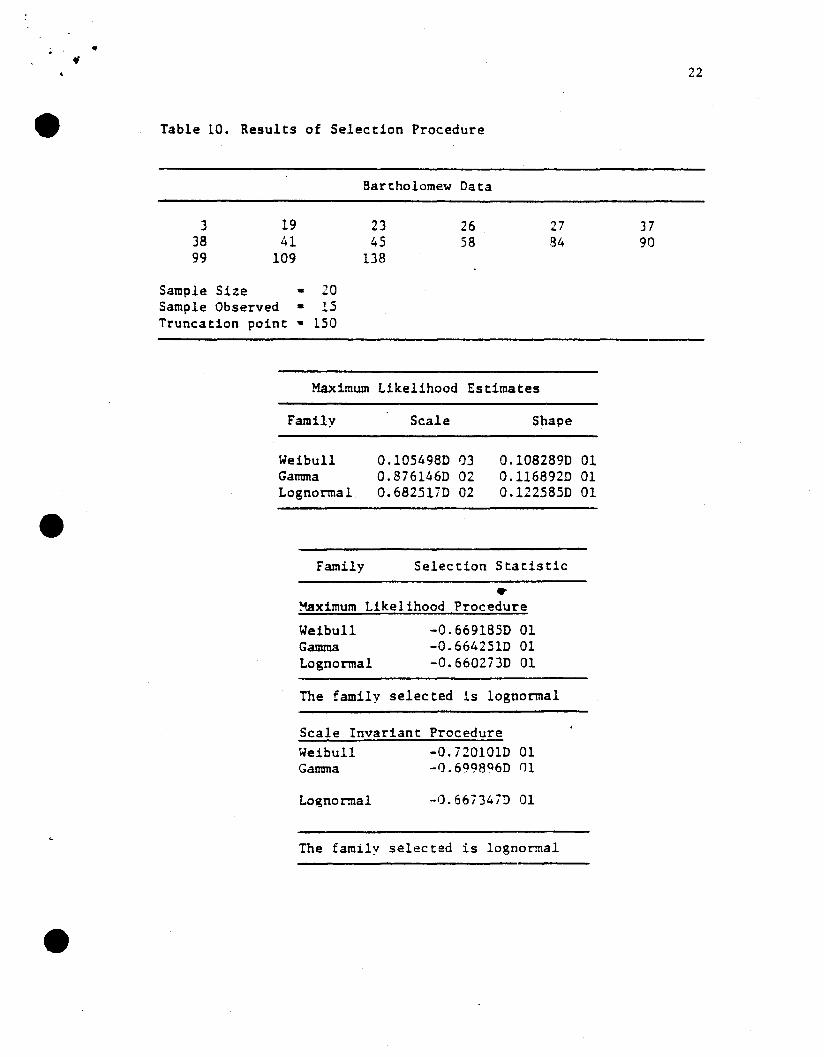
Example 2.
Bartholomew [4]. p. 370 gave the failure times of 15 items that
failed durin~ a specified period of testing from an original sample
of size n = 20. He states that the items have an exponential life
distribution. Gnd uses the exponential distribution to perform
Clnalyses of the data. :.Je h::lve used these data in the selection
program,and the results are given in Table 10. Both the maximum
likelihood and scale invariant procedures prefer the lognormal
distributions. which casts some doubt on the assumption of an
exponential parent distribution.
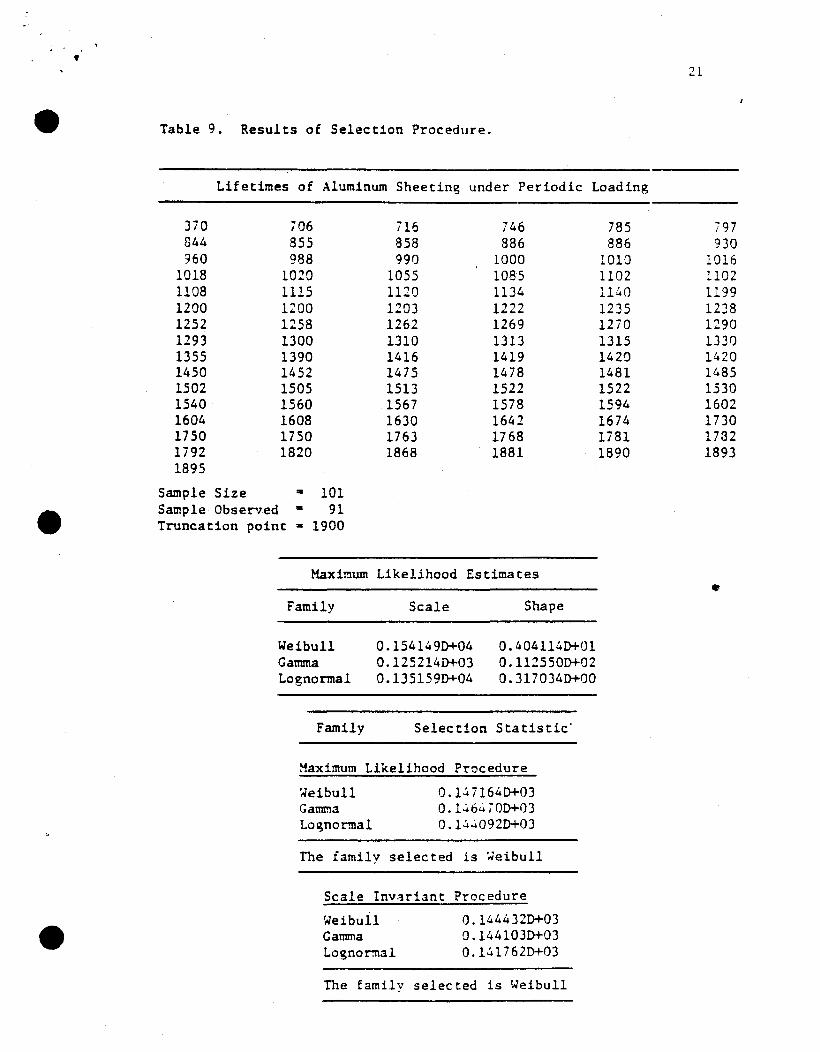
Table 9. Results of Selection Procedure.
21
Lifetimes of Aluminum Sheeting under Periodic Loading
370 706 716 746 785 i97844 855 858 886 886 930960 988 990 1000 1010 1016
1018 1020 1055 1085 1102 11021108 1115 11:0 1134 1140 11991200 1200 1203 1222 1235 12381252 1258 1262 1269 1270 12901293 1300 1310 1313 1315 13301355 1390 1416 1419 1420 14201450 1452 1475 1478 1481 14851502 1505 1513 1522 1522 15301540 1560 1567 1578 1594 16021604 1608 1630 1642 1674 17301750 1750 1763 1768 1781 17321792 1820 1868 1881 1890 18931895
Sample Size • 101Sample Observed • 91Truncation point • 1900
Maximum Likelihood Estimates•
Family
Weibu11GammaLognormal
Scale
0.1541490+040.1252140+030.1351590+04
Shape
0.4041140+010.1125500+020.3170340+00
Family Selection Statistic'
~aximum Likelihood Procedure
WeibullGaITll!laLognormal
o.1~ il64D+030.1~64iOD+03
O.1~':'092D+03
The family selected is Weibul1
Scale Invariant Procedure
WeibullGammaLognor.nal
0.144432D+030.144103D+030.141762D+03
The family selected is Weibull
•
Table 10. Results of Selection Procedure
Bartholomew Data
22
33899
1941
109
2345
138
2658
2784
3790
Sample Size • 20Sample Observed • 15Truncation point ~ 150
Maximum Likelihood Estimates
Family Scale Shape
Weibull 0.1054980 03 0.1082890 01Gamma 0.8761460 02 0.1168920 01Lognormal 0.682517D 02 0.1225850 01
Family Selection Statistic
•~ximum Likelihood Procedure
Weibul1GammaLognormal
-0.6691850 01-0.6642510 01-0.660273D 01
The family selected is lognormal
Scale Invariant ProcedureWeibull -0.7201010 01Gamma -0.6998Q60 n1
Lognormal -0.667347D 01
The family selected is lognormal
.. •23
REFERENCES
[1] Aitchison, J. and J. A. C. Brown. The Lognormal Distribu:ion,Cambridge University Press. London (1957).
[2] Bain, L. J. and M. Engelhardt, "Probability of Correct Selectionof Weibull versus Gamma based on Likelihood Ratio,"Communications in Statistics A9:37S~381(l980).
[3] Barlow, R. E. and R. Campo, "Total Time on Test Processes andApplications to Failure Data Analysis." in Reliabil!"!yand Fault Tree Analvsis: Theoretical and Apolied Aspectsof System Reliabilitv and Safety Assessment: 451-431, SIAr-t.Philadelphia (1975).
[4] Bartholomew, D. J., "The Sampling Distribution of an EstimateArising in Life Testing," Technometrics 5:361-374 (1963).
[5] Birnbaum, 7.. W. and S. C. Saunders, "A Statistical Model forLife-length of Materials," Journal of the American StatisticalAssociation 53:151-160 (1958).
[6] Bowman, K. O. and L. R. Shenton, Properties of Estimator for theGamma Distribution, Report CTC-l, Oak Ridge, Union CarbideCorporation, Nuclear Division, TN (1968).
[7] Cohen, A. C., "Maximum Likelihood Estimation in the WeibullDistribution Based on Complete and on Censored Samples,"Technometrics 7:579-588 (1965) ..,
[8] Cox, D. R., "Tests of Separate Families of Hypotheses," inProceedings of the Fourth Berkeley Sumposium 1: 105-123,University of California Press, Berkeley (1961).
[9] Davis, P. J. and P. Rabinowitz, Methods of Numerical Integration,Academic Press, New York (1975).
[10] Dumonceaux, R. and C. E. Antle, "Discriminatio~ between the Lognormal and the Weibull Distributions," Technometrics 15:923-926 (1973).
[11] Dumonceaux, R., C. E. Antle and G. Haas, "Likelihood Ratio Testfor Discrimination between Two Models with Unknown Locationand Scale Parameters," Technometrics 15:19-27 (1973).
[12] Dyer, A. R., "Discrimination Procedures for Separate Families ofHypotheses," Journal of the American Statistical Association68:970-974 (1973).
.,24
[13J Dyer, A. R.• "Hypotheses Testing Procedures for Separat~ Familiesof Hypotheses," Journal of the American StatisticalAssociation 69:140-145 (1974).
[14J Greenwood, J. A. and D. Durand. "Aids for Fitting the GammaDistribution by Maximum Likelihood." Technometrics 2:55-65(1960).
[15] Hajek, J. and Z. Sidak, Theory of Rank Tests. Academic Press,New York (1967).
[161 Harter, H. L. and A. H. Moore, "'1aximum Likelihood Estimation ofthe Parameters of Gamma and Weibull Populations from Completeand from Censored Samples," Technometrics 7 :639-643 (1965).
[I7J Harter. H. L. and A. H. Moore, "Local-maximum-likelihood Estimationof the Parameters of Three-parameter Lognormal Populationsfrom Complete and Censored Samples," Journal of the AmericanStatistical Association 61:841-842 (1966).
[18] Hogg, R. V.• V. A. Uthoff, R. H. Randles and A. S. Davenport,"On the Selec tion of the Underlying Distribution andAdaptive Estimation," Journal of the American StatisticalAssociation 67:597-600 (1972).
[I9J Kent. J. and C. P. Quesenberry. "Selecting Among ProbabilityDistributions Used in Reliability," Technometrics, 24. 59-65.
[20J Lehmann. E. L•• Testing Statistical Hypotheses, Wiley. New York(1959) •
[2lJ Nelson, W., "Theory and Applications of Hazard Plotting forCensored Failure Data." Technometrics 14:945-966 (1972).
[22J Quesenberry, C. P. and R. R. Starbuck. "On Optimal Tests forSeparate Hypotheses and Conditional Probability IntegralTransformations. Of Communications in Statistics: Theory andMethods. Part A, 5:507-524 (1976).
[23J Siswadi, "Selecting Among Weibull, Lognormal and Gamma Distributionsfor Complete and Censored Samples." Unpublished North CarolinaState University thesis (1981).
[24] Uthoff, V. A•• "An Optimum Test Property of Two Well-knownStatistics,", Journal of the American Statistical Association65:1597-1600 (1970).
[25] Uthoff, V. A.• "The Most Powerful Scale and Location In"ariantTest of the Normal versus the Double Exponential." Annalsof Statistics 1:170-174 (1973).
[26J Volod!n, 1. N., "On the Discrimination of Gamma and WeihullDistributions," Theory of Probability and its Appl.catiC'ns19:383-393 (1974).