Embed Size (px)
Citation preview

Selection of Indicators of River Health for Effluent-Dependent Streams
in the Arid West: The Living River Project on the Lower Santa Cruz
River, Pima County, Arizona
Prepared by Sonoran Institute for Pima County
in partial fulfillment of EPA grant 00T83301
March 31, 2014
Sonoran Institute | 44 E. Broadway, Suite 350 | Tucson, AZ 85701 www.SonoranInstitute.org

About Sonoran Institute
Mission
The Sonoran Institute inspires and enables community decisions and public policies that respect the land and people of western North America.
Vision
The Sonoran Institute contributes to a vision of a West with:
Healthy landscapes—including native plants and wildlife, diverse habitats, open spaces, clean air and water—from northern Mexico to western Canada.
Vibrant communities where people embrace conservation to protect quality of life today and in the future.
Resilient economies that support prosperous communities, diverse opportunities for residents, productive working landscapes, and stewardship of the natural world.
A Collaborative, Community-Based Approach
The nonprofit Sonoran Institute, founded in 1990, works across the rapidly changing West to conserve and restore natural and cultural assets and to promote better management of growth and change. The Institute’s community-based approach emphasizes collaboration, civil dialogue, sound information, local knowledge, practical solutions, and big-picture thinking.
Sonoran Institute Offices
Main Office 44 E. Broadway Blvd., Suite 350 Tucson, Arizona 85701 520.290.0828 Phoenix Office 11010 N. Tatum Blvd., Suite D101 Phoenix, Arizona 85028 602.393.4310 Northern Rockies Office 201 S. Wallace Ave., Suite B3C Bozeman, Montana 59715 406.587.7331
Western Colorado Office 817 Colorado Ave., Suite 201 Glenwood Springs, Colorado 81601 970.384.4364 Mexico Office Magisterio #627 Col. Profesores Federales Mexicali, Baja California C.P. 21370 Mexico 011.52.686.582.54.31

Table of Contents
Executive Summary ..................................................................................................................................... 1
Introduction ................................................................................................................................................ 2
Selecting the Living River Indicators ........................................................................................................... 3
Selection Process Overview .................................................................................................................... 3
Forming a Technical Committee ............................................................................................................. 4
Goal and purpose of the Technical Committee (TC) .......................................................................... 4
Technical Committee list .................................................................................................................... 6
River Health Indicator Brainstorm .......................................................................................................... 7
Initial list of indicators ......................................................................................................................... 7
Initial Survey to Begin Highlighting Technical Committee Priorities ...................................................... 9
Category/Subcategory Grouping and Evaluation ................................................................................... 9
January – wetland vegetation ............................................................................................................. 9
February – human/social, physical & water conditions ..................................................................... 9
March – wetland animals, water quality ............................................................................................ 9
Draft list of indicators ............................................................................................................................. 9
Fine Tune Indicators .............................................................................................................................. 11
Final Indicators for Lower Santa Cruz Living River Reports .............................................................. 13
Moving Forward ........................................................................................................................................ 14
Acknowledgements ................................................................................................................................... 14
References and Prior Work ....................................................................................................................... 14

1 | P a g e
Executive Summary
The Santa Cruz River watershed provides drinking water for over one million people in both the U.S. and Mexico, including the city of Tucson though it is not its sole contribution to Arizona. Although there are many dry stretches of the river, the remaining free flowing reaches of the Santa Cruz preserve the natural and cultural heritage of the region. Local and national entities are committed to improving the wetland conditions along the Santa Cruz.
With generous support from the U.S. Environmental Protection Agency, the Sonoran Institute and Pima County have partnered to report on wetland conditions along the Santa Cruz River as it flows through Tucson. A report series on the Upper Santa Cruz River, the Living River, sought to evaluate indicators of river health and communicate any changes to river managers and residents along the river. This successful series captured significant water quality improvements that resulted from upgrades to the Nogales International Wastewater Treatment Plant, the primary source of surface water in this stretch of river. Pima County’s Regional Optimization Master Plan (ROMP) includes wastewater treatment plant upgrades along the Lower Santa Cruz River, just north of Tucson that will affect the longest effluent-dependent stretch of river in Arizona by improving the quality of effluent released into the river. Using the Living River series as a model, Sonoran Institute and Pima County will use indicators to determine the impact of the improvements on wetland conditions.
The environment through which the Lower Santa Cruz River flows differs greatly from that along the Upper Santa Cruz. Therefore, measuring the same indicators of river health would not provide an accurate picture. New indicators for the Lower Santa Cruz were needed, so individuals with diverse technical expertise were recruited to form a Technical Committee and take part in the indicator selection process. After 10 meetings over the course of 15 months, the Technical Committee selected 16 wetland indicators pertaining to wetland vegetation, water quantity and quality, wildlife, human/social factors, and sediment transport. This report seeks to summarize the process used to facilitate the selection of the indicators. Detailed notes, handouts, and presentations from the Technical Committee meetings are available as an Appendix.

2 | P a g e
Introduction
The Lower Santa Cruz River (LSCR) in northeastern Pima County is Arizona’s longest effluent-dependent river, whose flows mainly result from treated municipal wastewater discharged into the river. This stretch of river provides Pima County’s principal wetland habitat that supports important bird and wildlife species.
Nearly a decade ago, Pima County embarked upon a complex public works program, the Regional Optimization Master Plan (ROMP), to improve the quality of effluent released from their wastewater facilities. The County constructed a new 32-million-gallon-per-day waste treatment facility, the Agua Nueva Water Reclamation Facility, at Roger Road to replace the existing facility. The Ina Road facility was also upgraded and renamed Tres Rios Water Reclamation Facility. By January 2015 both facilities will meet state water quality standards and improve the ecological functions of the effluent-dependent stretch.
Figure 1: Map of Study Area along the Santa Cruz River in northwest Tucson.

3 | P a g e
Pima County and Sonoran Institute are collaborating in order to study and report the changing conditions along the LSCR. Previously, the U.S. Environmental Protection Agency (EPA) funded Sonoran Institute’s Living River report, a successful annual series that used ten indicators of river health to chart the changing conditions of the effluent-dependent stretch of the Upper Santa Cruz River in Santa Cruz County. Pima County is working with Sonoran Institute on the Lower Santa Cruz River to develop a similar report series that, over time, charts the changes to riparian conditions and aquatic life. This second Living River initiative is generously funded by an EPA Wetlands grant and matching Pima County funds. It will be modeled after the first Living River project and carry the same title. Keeping the same name for this project permits the concept to be used throughout the watershed and gives consistent recognition and messaging. This second report series focuses specifically on the effects Pima County’s ROMP on the quality of the effluent, which in turn affects vegetation, wetland conditions, and aquatic animals.
As a precursor to the first LSCR Living River report, this Selection Process Report exemplifies how diverse technical expertise from multiple organizations arrived at consensus to identify the indicators that would be analyzed throughout this four-year project. We hope others find the process instructive when undertaking similar endeavors.
Selecting the Living River Indicators
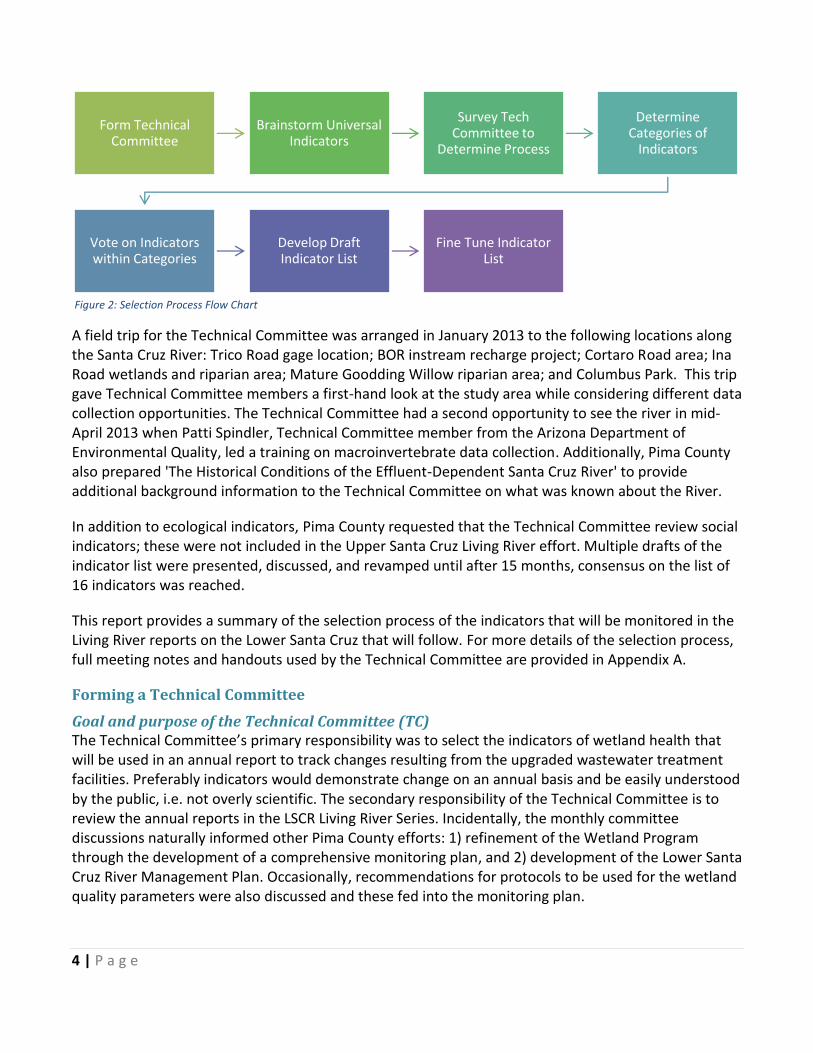
Selection Process Overview The Upper and Lower Santa Cruz River differ in hydrology and land use, among other factors. Therefore, the ten indicators from the original series were considered inadequate to evaluate river and wetland health of the new stretch. The process to select appropriate indicators for the LSCR began in September 2012 with the establishment of a Technical Committee. Technical Committee meetings provided background information, facilitated discussion of issues, updates on available monitoring data, and a voting system to help members determine the most relevant indicators to communicate wetland health to the public. The flow chart below illustrates the overall process, which is then detailed in separate sections below.
Additional means of informing the process were also utilized. Subcommittees were formed on an as needed basis to discuss detailed methodology and possible monitoring parameters within specific data types to inform indicator selection for the annual report. Subcommittees included: Macro Invertebrates and Wetland Vegetation. These subcommittees, formed due to revelations regarding additional data needs, helped develop short lists of possible indicators. Data gaps, when encountered, were treated in three ways: alternative data sources were identified; data collection was funded by the project; or if those options were not possible, data gaps served as a determinant for filtering out an indicator. Data shortfalls are shown in Appendix A - April meeting handouts in the “existing data” column.
4 | P a g e
A field trip for the Technical Committee was arranged in January 2013 to the following locations along the Santa Cruz River: Trico Road gage location; BOR instream recharge project; Cortaro Road area; Ina Road wetlands and riparian area; Mature Goodding Willow riparian area; and Columbus Park. This trip gave Technical Committee members a first-hand look at the study area while considering different data collection opportunities. The Technical Committee had a second opportunity to see the river in mid-April 2013 when Patti Spindler, Technical Committee member from the Arizona Department of Environmental Quality, led a training on macroinvertebrate data collection. Additionally, Pima County also prepared 'The Historical Conditions of the Effluent-Dependent Santa Cruz River' to provide additional background information to the Technical Committee on what was known about the River.
In addition to ecological indicators, Pima County requested that the Technical Committee review social indicators; these were not included in the Upper Santa Cruz Living River effort. Multiple drafts of the indicator list were presented, discussed, and revamped until after 15 months, consensus on the list of 16 indicators was reached.
This report provides a summary of the selection process of the indicators that will be monitored in the Living River reports on the Lower Santa Cruz that will follow. For more details of the selection process, full meeting notes and handouts used by the Technical Committee are provided in Appendix A.
Forming a Technical Committee
Goal and purpose of the Technical Committee (TC) The Technical Committee’s primary responsibility was to select the indicators of wetland health that will be used in an annual report to track changes resulting from the upgraded wastewater treatment facilities. Preferably indicators would demonstrate change on an annual basis and be easily understood by the public, i.e. not overly scientific. The secondary responsibility of the Technical Committee is to review the annual reports in the LSCR Living River Series. Incidentally, the monthly committee discussions naturally informed other Pima County efforts: 1) refinement of the Wetland Program through the development of a comprehensive monitoring plan, and 2) development of the Lower Santa Cruz River Management Plan. Occasionally, recommendations for protocols to be used for the wetland quality parameters were also discussed and these fed into the monitoring plan.
Form Technical Committee
Brainstorm Universal Indicators
Survey Tech Committee to
Determine Process
Determine Categories of
Indicators
Vote on Indicators within Categories
Develop Draft Indicator List
Fine Tune Indicator List
Figure 2: Selection Process Flow Chart

5 | P a g e
Fig
ure
3: L
ow
er S
an
ta C
ruz
Riv
er R
each
es a
nd
Mo
nit
ori
ng
Sit
es

6 | P a g e
Another important component of the Technical Committee was to assist in the development of monitoring strategies. The TC helped to formulate the determination of river reaches, sampling locations and the frequency of monitoring. As shown in Figure 3 this river segment was divided into three reaches which had logical boundaries as determined by river dynamics and the surrounding environment. The monitoring plan and indicator evaluation strategy was based upon this division of the river segment.
Figure 4: Role of the Technical Committee
Technical Committee list Complete biography of each Technical Committee member can be found in Appendix B.
Technical Committee Members (*= alternates) Placido Dos Santos Water Resources consultant WestLand Resources, INC. Jennifer G. Duan, Ph.D., P.E. Associate Professor Dept. of Civil Engineering and Engineering Mechanics University of Arizona James (Jim) DuBois, R. G. Principal Hydrologist Pima County Regional Wastewater Reclamation Dept. Nathan Lehman Civil Engineer Bureau of Reclamation *Eve Halper, Ph.D. Natural Resources Specialist Bureau of Reclamation
Akitsu Kimoto, Ph.D., CFM Planning and Development Pima County Regional Flood Control District John Kmiec Utilities Director Town of Marana Kendall Kroesen Habitats Program Manager Tucson Audubon Society Michael F. Liberti Groundwater Hydrologist City of Tucson, Water Department Jean (Jeannie) McLain, Ph. D. Associate Director, Water Resources Research Center Associate Research Scientist, Soil, Water and Environmental Sciences, University of Arizona
Technical Committee
Propose intial indicators
Select indicators for annual report
Assess utility of indicators and
suggest changes if necessary
Identify river reaches and monitoring
strategy

7 | P a g e
Brian Powell Program Manager Pima County Office of Sustainability and Conservation E. Linwood Smith, PhD Consulting Ecologist *Jason D. Jones Supervisor, Monitoring Unit Arizona Department of Environmental Quality Dr. Julie Stromberg School of Life Sciences Arizona State University
Robert Webb University of Arizona Claire Zucker Director, Sustainable Environment Program Pima Association of Government Patrice (Patti) Spindler Aquatic Ecologist Standards & Assessments Unit Arizona Department of Environmental Quality
Project Staff
Evan Canfield PhD PE CFM Pima County Regional Flood Control District Ed Curley Pima County Regional Wastewater Reclamation Department
Julia Fonseca Pima County Office of Sustainability and Conservation Claire A. Zugmeyer Sonoran Institute Emily Brott Sonoran Institute
River Health Indicator Brainstorm The brainstorming of possible river health indicators began at the second meeting of the Technical Committee in October 2012. All ideas were recorded regardless of data gaps or costs of obtaining or monitoring the data. The indicators were arranged into categories and subcategories. These categories evolved over the course of the process.
Initial list of indicators
High Level Categories Brainstormed Indicators
Groundwater Depth to water in 100yr floodplain Variability of depth to water over time
Surface/Groundwater Interactions
Streambed infiltration Source composition of surface/groundwater Unsaturated at depth Schmutzdecke presence + infiltration

8 | P a g e
High Level Categories Brainstormed Indicators
Surface Water Quantity
7 day minimum flow Presence/Absence of water Distance of flow Base flow Peak flows
Water Quality
Ammonia Macro invertebrates E. coli Polychlorinated hydrocarbons Dissolved oxygen Water temperature Heavy metals Other water quality toxins
Algal productivity C-N-P
Physical Factors Ratio of width to depth in channel
Terrestrial Plants
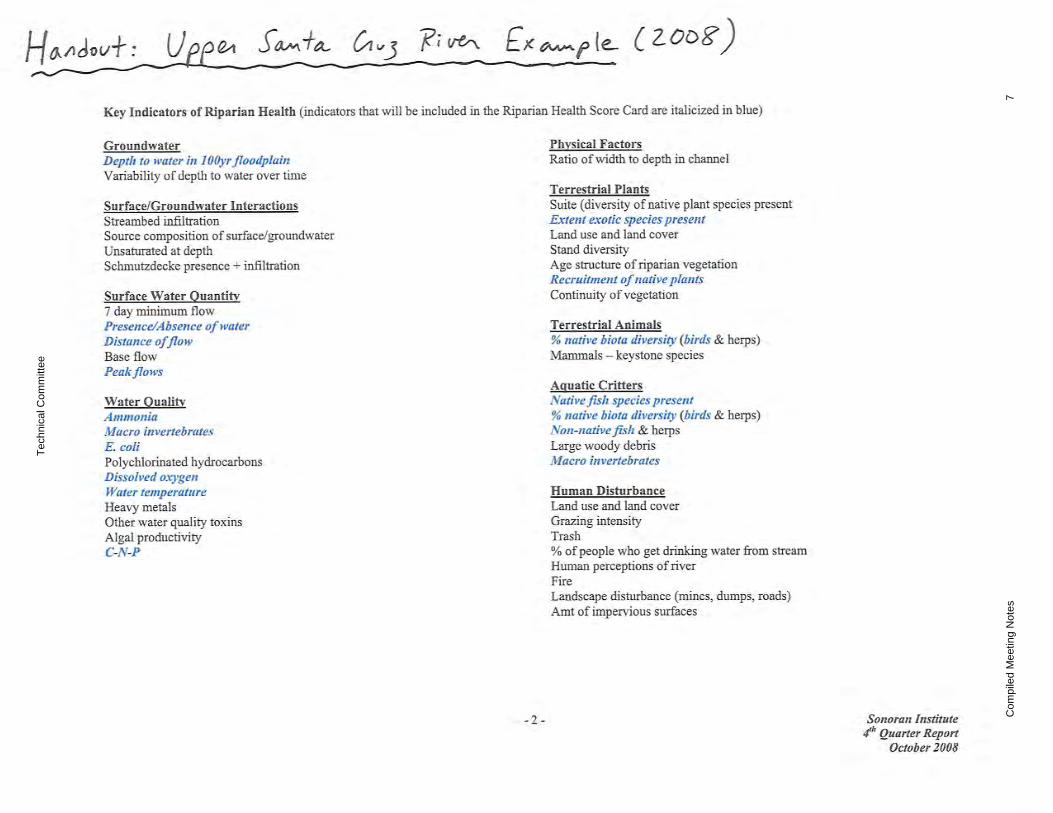
Suite (diversity of native plant species present Extent exotic species present Land use and land cover Stand diversity Age structure of riparian vegetation Recruitment of native plants Continuity of vegetation
Terrestrial Animals % native biota diversity (birds & herps) Mammals – keystone species
Aquatic Critters
Native fish species present % native biota diversity (birds & herps) Non-native fish & herps Large woody debris Macro invertebrates
Human Disturbance
Land use and land cover Grazing intensity Trash % of people who get drinking water from stream Human perceptions of river Fire Landscape disturbance (mines, dumps, roads) Amt of impervious surfaces
Figure 5: Table of Brainstormed Indicators Arranged into Categories

9 | P a g e
Initial Survey to Begin Highlighting Technical Committee Priorities Once arranged into categories and subcategories as shown in Figure 5, the indicators were compiled into a survey and sent to the Technical Committee before the December 2012 meeting. Members were directed to vote for 10 ideas they felt were most critical indicators of river health. The number 10 was arbitrary: the purpose was merely to identify some clear categories that Technical Committee members agreed were important. Concern about category grouping, missing data, and greater weight given to categories with more subcategories lead the Technical Committee to alter the process by analyzing higher level categories. The process of determining the categories evolved over a number of months; categories were consolidated and later expanded based on committee members input and data available for monitoring.
Category/Subcategory Grouping and Evaluation Five high level categories (wetland vegetation, wetland animals, water quality, and human social and physical/water conditions) emerged from the survey. These were discussed two or three at a time at the January, February, and March 2013 meetings. Voting on these higher level categories was performed at the February and March meetings by Technical Committee members present to arrive at a draft list of indicators. That list was evaluated at the April meeting, reviewed again in May, and the Technical Committee agreed upon a final list of indicators at the December meeting.
January – wetland vegetation Wetland Vegetation was the indicator category under discussion at the January 2013 meeting. The subcommittee reviewed the draft ideas using “strawman” handouts to show potential indicators, data collection information, and the impact by ROMP. Equipped with that information, the Technical Committee members made informed decisions and arrived at consensus on the most important indicators for this category.
February – human/social, physical & water conditions A voting process was utilized at the February meeting to narrow down the 20+ indicators within the categories of human/social and physical and water conditions. Indicators with flexibility over time appealed to Technical Committee members because University of Arizona studies could suggest new findings or different indicators.
March – wetland animals, water quality Wetland animal and water quality indicators were slated for review at the March meeting. The Technical Committee had already chosen macroinvertebrates as an indicator at a previous meeting, so it was not subject to vote. However three other subcategories under wetland animals and six subcategories under water quality were voted upon. In addition to macroinvertebrates, the group agreed to move several ideas forward for consideration. At this time it was unclear whether data from additional wetland animals would be a formal indicator or simply anecdotal data shared in the report.
Draft list of indicators The next step of the indicator selection process involved reviewing all the indicators selected by the Technical Committee at previous meetings, including those that rose to the top in the voting and others that were reintroduced. To assist members in the process, information was provided regarding identified gaps in data, recommendations for what should be considered an indicator as opposed to

10 | P a g e
supplemental “sidebar” information, annual variance of data, and possibility of ROMP impact. The following table shows the draft list of indicators the Technical Committee selected.
Category Possible indicator
Wetland Vegetation Wetland indicator status Hydroriparian tree cover Nitrogen affinity score
Human Social Odor Public use/trip counts on river parks
Water Budget Diagram of infiltration and surface flow Flow extent
Sediment Transport Suspended sediment content Total suspended solids Turbidity
Aquatic Habitat % riffle/run/pool and/or embededness – Macro Sites only % riffle/run/pool and/or embededness – full study reach
Channel Character Overall channel location and/or elevation change Pfankuch Channel Stability Index at Macro cites BLM Proper Functioning Condition Index at Macro sites
Wildlife
Macroinvertebrates Fish Birds Amphibians
Water Quality
Dissolved oxygen Biological oxygen demand Total dissolved solids Metals (combined score for copper, lead, zinc, mercury, selenium, arsenic, cadmium, chromium) ammonia
Figure 6: Draft table of River Health Indicators for Final Review
Supplemental data to help tell the river’s story was identified be used as sidebars in the reports, rather than included as formal indicators. This includes:
1. birds 2. amphibians/turtles (if data available) 3. peak flow 4. stream flow 5. precipitation 6. storm event flows 7. diurnal flow patterns 8. water budget (estimated recharge and surface flow) – the graphic or figure that would visually
represent the volumes of water flowing in the river, recharging etc. 9. public use of the river (using trip counts and other data available from Pima Association of
Governments and Pima County)
11 | P a g e
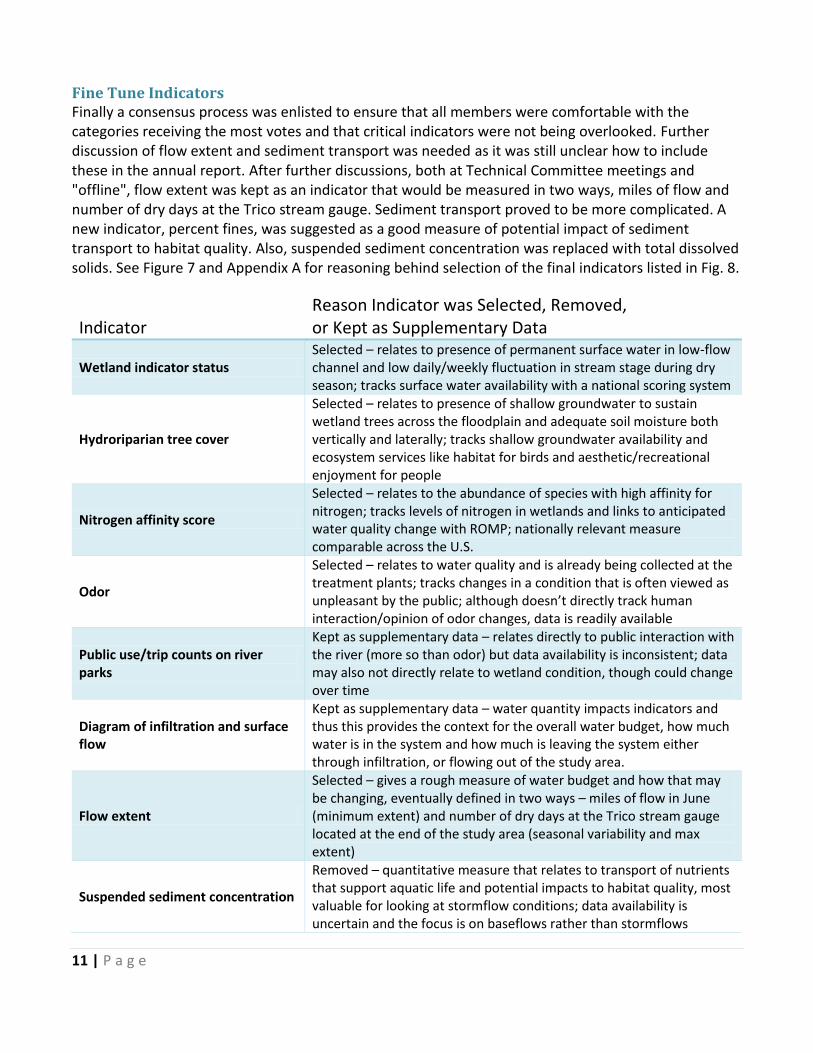
Fine Tune Indicators Finally a consensus process was enlisted to ensure that all members were comfortable with the categories receiving the most votes and that critical indicators were not being overlooked. Further discussion of flow extent and sediment transport was needed as it was still unclear how to include these in the annual report. After further discussions, both at Technical Committee meetings and "offline", flow extent was kept as an indicator that would be measured in two ways, miles of flow and number of dry days at the Trico stream gauge. Sediment transport proved to be more complicated. A new indicator, percent fines, was suggested as a good measure of potential impact of sediment transport to habitat quality. Also, suspended sediment concentration was replaced with total dissolved solids. See Figure 7 and Appendix A for reasoning behind selection of the final indicators listed in Fig. 8.
Indicator Reason Indicator was Selected, Removed, or Kept as Supplementary Data
Wetland indicator status Selected – relates to presence of permanent surface water in low-flow channel and low daily/weekly fluctuation in stream stage during dry season; tracks surface water availability with a national scoring system
Hydroriparian tree cover
Selected – relates to presence of shallow groundwater to sustain wetland trees across the floodplain and adequate soil moisture both vertically and laterally; tracks shallow groundwater availability and ecosystem services like habitat for birds and aesthetic/recreational enjoyment for people
Nitrogen affinity score
Selected – relates to the abundance of species with high affinity for nitrogen; tracks levels of nitrogen in wetlands and links to anticipated water quality change with ROMP; nationally relevant measure comparable across the U.S.
Odor
Selected – relates to water quality and is already being collected at the treatment plants; tracks changes in a condition that is often viewed as unpleasant by the public; although doesn’t directly track human interaction/opinion of odor changes, data is readily available
Public use/trip counts on river parks
Kept as supplementary data – relates directly to public interaction with the river (more so than odor) but data availability is inconsistent; data may also not directly relate to wetland condition, though could change over time
Diagram of infiltration and surface flow
Kept as supplementary data – water quantity impacts indicators and thus this provides the context for the overall water budget, how much water is in the system and how much is leaving the system either through infiltration, or flowing out of the study area.
Flow extent
Selected – gives a rough measure of water budget and how that may be changing, eventually defined in two ways – miles of flow in June (minimum extent) and number of dry days at the Trico stream gauge located at the end of the study area (seasonal variability and max extent)
Suspended sediment concentration
Removed – quantitative measure that relates to transport of nutrients that support aquatic life and potential impacts to habitat quality, most valuable for looking at stormflow conditions; data availability is uncertain and the focus is on baseflows rather than stormflows

12 | P a g e
Indicator Reason Indicator was Selected, Removed, or Kept as Supplementary Data
Total suspended solids
Selected – quantitative measure relates to transport of nutrients that support aquatic life and potential impacts to habitat quality, tracks with suspended sediment concentration of baseflow conditions; data is available and being collected
Turbidity
Selected – qualitative measure that relates to transport of nutrients that support aquatic life and potential impacts to habitat quality; more intuitive measure for the public to understand and complements total suspended solids
Percent fines (added at last meeting)
Selected – qualitative measure that relates to transport of nutrients that support aquatic life and potential impacts to habitat quality; measures the “smothering” of aquatic habitat by fine sediments that have settled on the river bed; has a standard set by Arizona Department of Environmental Quality and complements both turbidity and total suspended solids
% riffle/run/pool and/or embededness – Macro Sites only
Removed – relates to available habitat for aquatic wildlife; data is available, but likely too subjective and would be most useful to have this measure for the entire study reach
% riffle/run/pool and/or embededness – full study reach
Removed – relates to available habitat for aquatic wildlife; data is unavailable likely too subjective and there is no funding to collect this new data
Overall channel location and/or elevation change
Removed – relates to changes in geomorphology and shifts in channel location after flooding; while interesting, the public likely won’t notice this change because the channel is viewed as the entire area between bank protections rather than just the active channel where water is flowing.
Pfankuch Channel Stability Index at Macro cites
Removed - relates to changes in geomorphology resulting from erosion, flooding, or other disturbances; measure is too coarse
BLM Proper Functioning Condition Index at Macro sites
Removed - relates to changes in geomorphology resulting from erosion, flooding, or other disturbances; measure is too coarse
Macroinvertebrates Selected – measure of wildlife that relates to water quality
Fish Selected – measure of wildlife that relates both to quality of water and habitat
Birds Kept as supplementary data – birds impacted by many factors, many beyond the scale of the study area; however important to summarize as birding is a popular recreational activity in the area
Amphibians
Kept as supplementary data – data availability is uncertain; could summarize like birds to help public understand the different kinds of wildlife found in the study area, no funding for targeted amphibian surveys
Dissolved oxygen Selected – direct measure of water quality that supports aquatic life, standard set by Arizona Department of Environmental Quality
Biological oxygen demand
Selected – direct measure of water quality that relates to dissolved oxygen and is a standard measure used by wastewater facilities; could be discussed/packaged with dissolved oxygen

13 | P a g e
Indicator Reason Indicator was Selected, Removed, or Kept as Supplementary Data
Total dissolved solids
Selected – direct measure of water quality that relates to salinity and water chemistry, important when considering the source of water (Central Arizona Project); CAP water has higher TDS and levels could increase if effluent is comprised of increasing percentage of CAP
Metals (combined score for copper, lead, zinc, mercury, selenium, arsenic, cadmium, chromium)
Selected – direct measure of water quality, high levels impact aquatic life
Ammonia Selected – direct measure of water quality, high levels impact aquatic life, expected to decrease with treatment plant upgrades
Figure 7: Justification for Final Indicator Selection
Final Indicators for Lower Santa Cruz Living River Reports After review and discussion, the Technical Committee finalized the selection of 16 indicators. These will be feature in the first Living River report and be reviewed in the future.
Category Indicator Sampling Locations
Monitoring Frequency
Wetland Vegetation
Wetland indicator status 8 Annual Hydroriparian tree cover 8 Every 3 years Nitrogen affinity score 8 Annual
Human/Social Odor at treatment plant1 2 Daily
Flow Extent Miles of flow at start of monsoon (June 14)2 3 Annual Number of dry days at Trico stream gauge 1 Daily
Sediment Transport Total suspended solids 4 Quarterly Percent fines 4 Annual Turbidity 4 Quarterly
Wildlife Macroinvertebrates 4 Annual Fish 4 Annual
Water Quality
Dissolved oxygen 4 Quarterly Biological oxygen demand 4 Quarterly Total dissolved solids 4 Quarterly Metals (combined score for copper, lead, zinc, mercury, selenium, arsenic, cadmium, chromium)
4 Quarterly
Ammonia 4 Quarterly 1 Data observed at treatment plants used to create a map of worst possible odor effects
2 Report Miles of Flow in Each of the three “Reporting Reaches” Figure 8: Final List of River Health Indicators
14 | P a g e
Moving Forward
The Technical Committee will review the draft annual reports according to the following schedule:
● Living River Report #1 – Summer 2014 ● Living River Report #2 – Spring 2015 ● Living River Report #3 – Spring 2016
The final annual reports will be released the summer following the Technical Committee’s spring review.
According to the December 2013 meeting notes, the Technical Committee will convene at regular intervals. Although, neither frequency nor the first date has been determined, the next meeting was tentatively scheduled for spring 2014.
Acknowledgements
Sonoran Institute thanks EPA for their generous funding and continued support of efforts along the Santa Cruz River. We are proud to work alongside Pima County in the pursuit of a healthy and thriving Santa Cruz capable of providing quality water throughout the watershed. Without the dedication of the Technical Committee the selection of indicators and subsequent Living River reports would not be possible. Their time and commitment is most appreciated.
This report was funded by a Wetland Grant from EPA Region IX, Charting the Wetland Health of the Lower Santa Cruz River (EPA Grant 00T83301). We are grateful to the EPA, and their Project Officer Elizabeth Goldmann, for their support of our efforts to monitor wetland conditions on the Lower Santa Cruz River.
References and Prior Work
Historical Conditions of the Effluent-Dependent Lower Santa Cruz River (March 2013): A report detailing the historical Conditions of the Lower Santa Cruz River which is available at the Sonoran Institute website. This comprehensive analysis serves to provide the framework to which the ecological functions of the river can be measured against.
View or download the report: http://www.sonoraninstitute.org/images/stories/pdfs/Other/SantaCruzRiver/SCR_HistoricalConditionsReport.pdf
EPA Approved Quality Assurance Project Plan (March 2013): An approved Quality Assurance Project Plan (QAPP) for this project is in place. This document provides a framework for specific processes and project approaches to ensure consistency and reliable outcomes for this work. The QAPP is available for viewing by contacting Pima County Flood Control.

Appendix A - Meeting Notes and Handouts

Appendix A – Meeting Notes and Handouts
Table of Contents September 18, 2012
Agenda: Tuesday September 18, 2012 Page 1 Map: Lower Santa Cruz Wetland Study Area Page 2 Summary: EPA-funded “Reviving River” project Page 3 Project Schedule Page 5 Table of Contents Historical Conditions Report Page 6 Handout Upper Santa Cruz River Indicators Page 7 Upper Santa Cruz River Scorecard Page 8 Indicators Used in On-Going Santa Cruz Research and Monitoring Page 9 Proposed Monitoring for Quality Assurance Plan (QAPP) Page 10 Monitoring Changes in Dominant Vegetation Structure: LiDAR Page 11 Aquatic Macroinvertebrate Monitoring Page 13 Notes, 1st Reviving River Technical Committee Meeting (9/18/2012) Page 15
October 22, 2012 Agenda: Monday October 22, 2012 Page 25 Reviving River Project – Bios Page 26 Reviving River Project – Contact Information Page 29 Key Indicators of Riparian Health Page 30 Upper Santa Cruz River Riparian Health Score Card Page 31 Indicators Used in On-Going Santa Cruz Research and Monitoring Page 32 Riparian Health Scorecards; An Annotated Bibliography Page 33 Notes, 2nd Reviving River Technical Committee Meeting (10/22/2012) Page 43
November 28, 2012 Notes, 3rd Reviving River Technical Committee Meeting (11/28/2012) Page 48 Agenda: Wednesday November 28, 2012 Page 53 EPA Wetlands Definitions Page 54 Standard Water Chemistry Measures Page 55 Indicators Page 56 Project Timeline for 2013 Water Year Page 57
December 13, 2012 Agenda: Thursday December 13, 2012 Page 58 Category Survey List Page 59 Ranked Category Survey Results Page 61 Notes, 4th Reviving River Technical Committee Meeting (12/13/2012) Page 69
January 30, 2013 Note on Macro invertebrate and habitat assessment data Page 74 Chart: Potential Indicators on Water Quality Page 75 Notes, 4th Reviving River Technical Committee Meeting (1/30/2013) Page 77 Presentation: Historical Conditions Report on Lower Santa Cruz River Page 82 Presentation: What is an Indicator Page 90 Table: Plant-based Indicators Evaluated for Assessment of Wetland Condition Page 92

Santa Cruz River Field Trip Schedule (1/29/2013) Page 93 Map: Water and Energy Sustainability Center Page 94 Map: Lower Santa Cruz River Field Trip Page 95
February 26, 2013 Agenda: Tuesday February 26, 2013 Page 96 Key for “strawman” Tables Page 97 Table: Indicator Discussion “Strawmen” Page 98 Notes, Living River Technical Committee Meeting (2/26/2013) Page 101
March 25, 2013 Agenda: Monday March 25, 2013 Page 106 Key for “strawman” Tables Page 107 Table: Indicator Discussion “Strawmen” Page 108 Notes, Living River Technical Committee Meeting (3/25/2013) Page 111
April 29, 2013 Agenda: Monday April 29, 2013 Page 117 Table: 24 Possible Annual Report Indicators Page 118 Table: Key for Tables Listing Possible Indicators Page 119 Table: Indicator Discussion “Strawmen” Page 120 Notes, Living River Technical Committee Meeting (4/29/2013) Page 123
September 4, 2013 Agenda: Wednesday September 4, 2013 Page 127 Table: Draft Living River Indicators Page 128 Outline Page 130 Notes, Living River Technical Committee Meeting (9/4/2013) Page 131
December 12, 2013 Notes, Living River Technical Committee Meeting (12/12/2013) Page 137 Presentation: 2013 Fish Survey Results Page 141 Presentation: Spatial Analysis of Water Quality and Vegetation Data Along the SCR Page 150 Agenda: Thursday December 12, 2013 Page 156 Timeline: Living River Page 157 Map: Lower Santa Cruz River Sampling Sites Page 158 Chart: Sediment Transport Page 159 Chart: Flow Extent Page 161

Agenda-Reviving River Technical Committee Meeting Tuesday September 18th 2012
Sonoran Institute, 44 East Broadway Boulevard, Suite 350 9 am – 11:30 am
1. Welcome & Introductions—Emily Brott, Sonoran Institute
2. Goals and Purpose—Ed Curley and Jim DuBois, PCRWWD
3. Products and Timeline—Akitsu Kimoto and Evan Canfield, PCRFCD
4. Upper Santa Cruz example—Emily Brott Break (15 min)
5. Quality Assurance Project Plan elements—Discussion and Decisions
a. Water Quality—Jim DuBois
b. Sediment—Akitsu Kimoto
c. Vegetation—Brian Powell, Pima County Office of Sustainability & Conservation
d. Macroinvertebrates—Brian Powell
6. Next Agenda/Date—Emily Brott
Technical Committee
Compiled Meeting Notes 1

Upstream Stormwater Sample Site
USGS Stream Gauging at Trico
USGS Stream Gauging at Cortaro
SC-11
SC-10SC-09
SC-08SC-07
SC-05SC-04
SC-02
SC-12
SC-06
SC-03
SC-01
E I10W I10
W INA RD
N OR
ACLE
RD
W TANGERINE RD
N TR
ICO
RD
N SA
NDAR
IO R
D
N LA
CHO
LLA B
L
N SILVERBELL RD
N LA
CAN
ADA D
R
W AVRA VALLEY RD
N AN
WAY R
D
N TH
ORNY
DALE
RD
W MOORE RD
W RIVER RD
W I10 FRONTAGE RD
W MANVILLE RD
N SA
NDER
S RD
W LAMBERT LN
W EL TIRO RD
W PICTURE ROCKS RD
W SILVERBELL RD
N CA
MINO
DE
OEST
E
W MARANA RD
W TWIN PEAKS RD
N SH
ANNO
N RD
W GOLDEN GATE RD
W NARANJA DR
N ST
ONE A
V
W ORANGE GROVE RD
W OVERTON RD
W LINDA VISTA BL
W SUNSET RD
W PRINCE RD
W MAGEE RD
N WA
DE R
D
N DO
VE M
OUNT
AIN
BL
W CORTARO FARMS RD
N TANGERINE FARMS RD
E I10 FRONTAGE RD
W EL CAMINO DEL CERRO
N RE
SERV
ATIO
N RD
N CASA GRANDE HY
N FL
OWIN
G W
ELLS
RD
W WETMORE RD
N HA
RTMA
N LN
W RUTHRAUFF RD
W CAMI
NO DE
MAN
ANA
N KINNEY RD W MIRACLE MILE
N FREEWAY
W HARDY RD
N BUSINESS CENTER DR
N LO
N AD
AMS R
D
N I10 EB FRONTAGE RDW AVRA VALLEY RD
N SA
NDAR
IO R
D
W MAGEE RD
W TWIN PEAKS RD
N AN
WAY R
D
N CASA GRANDE HY
W MOORE RD
W SILVERBELL RD
W I10 FRONTAGE RD
N SH
ANNO
N RD
N CASA GRANDE HY
Lower Santa Cruz Wetland StudyArea
LegendRWRD Current
ADEQ Monitoring SiteStormwater Sample Site
USGS-Gauging
WRF TreatmentsRecharge Project
PIMA COUNTYRegional Wastewater Reclamation Department
Tucson, Arizona
ROGER ROAD WRF
INA ROADWRF
RILLITO VISTAWRF
I-10
I-10
9/13/2012C:\Data\D Drive Backup 8_30_2011\Local Disk (D)\Data\ARCinfo\Data\Project\WELLS\Wells_Roger_North
MARANA WRF
RWRD Current Sampling SitesADEQMonitoring SiteUpstream Stormwater Sample SiteUSGS-Gauging
Study Reach/Managed RechargeProject
Technical Committee
Compiled Meeting Notes 2
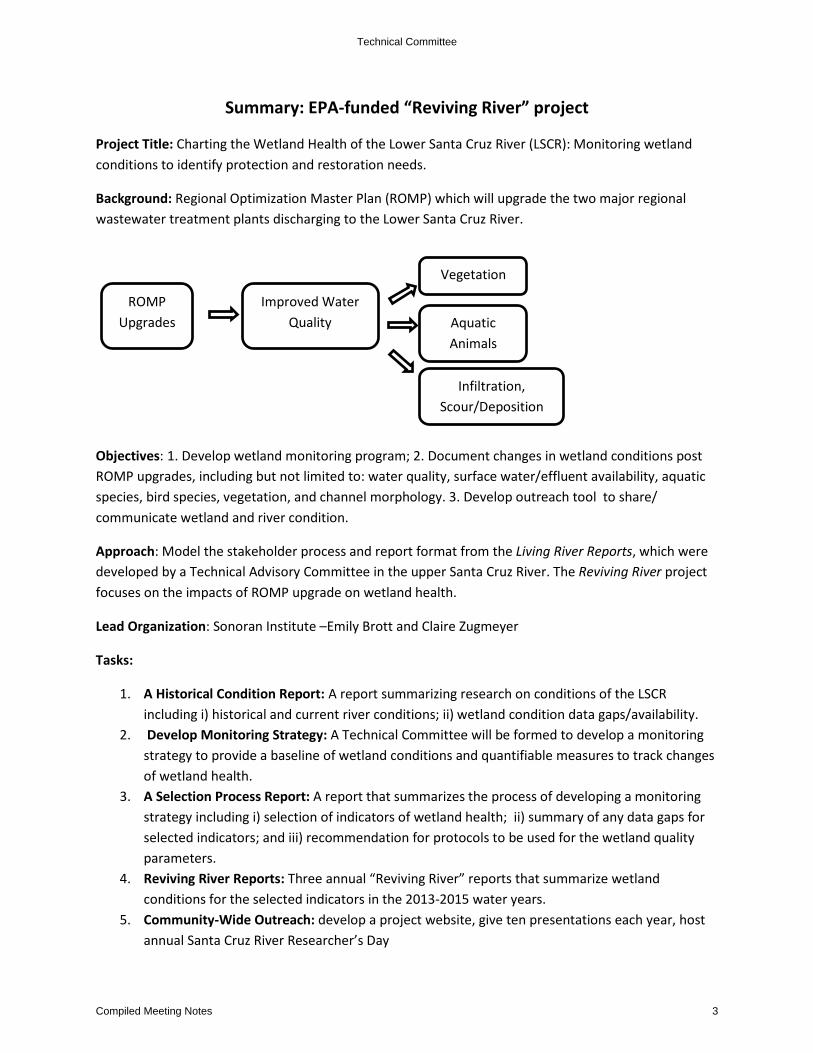
Summary: EPA-funded “Reviving River” project
Project Title: Charting the Wetland Health of the Lower Santa Cruz River (LSCR): Monitoring wetland conditions to identify protection and restoration needs.
Background: Regional Optimization Master Plan (ROMP) which will upgrade the two major regional wastewater treatment plants discharging to the Lower Santa Cruz River.
Objectives: 1. Develop wetland monitoring program; 2. Document changes in wetland conditions post ROMP upgrades, including but not limited to: water quality, surface water/effluent availability, aquatic species, bird species, vegetation, and channel morphology. 3. Develop outreach tool to share/ communicate wetland and river condition.
Approach: Model the stakeholder process and report format from the Living River Reports, which were developed by a Technical Advisory Committee in the upper Santa Cruz River. The Reviving River project focuses on the impacts of ROMP upgrade on wetland health.
Lead Organization: Sonoran Institute –Emily Brott and Claire Zugmeyer
Tasks:
1. A Historical Condition Report: A report summarizing research on conditions of the LSCR including i) historical and current river conditions; ii) wetland condition data gaps/availability.
2. Develop Monitoring Strategy: A Technical Committee will be formed to develop a monitoring strategy to provide a baseline of wetland conditions and quantifiable measures to track changes of wetland health.
3. A Selection Process Report: A report that summarizes the process of developing a monitoring strategy including i) selection of indicators of wetland health; ii) summary of any data gaps for selected indicators; and iii) recommendation for protocols to be used for the wetland quality parameters.
4. Reviving River Reports: Three annual “Reviving River” reports that summarize wetland conditions for the selected indicators in the 2013-2015 water years.
5. Community-Wide Outreach: develop a project website, give ten presentations each year, host annual Santa Cruz River Researcher’s Day
ROMP Upgrades
Improved Water Quality
Vegetation
Aquatic Animals
Infiltration, Scour/Deposition
Technical Committee
Compiled Meeting Notes 3

Technical Committee (Partners):
1.) Patti Spindler – Arizona Department of Environmental Quality 2.) Robert Webb – US Geological Survey 3.) Jennifer Duan – University Of Arizona 4.) Juliet Stromberg – Arizona State University 5.) Kendall Kroesen – Tucson Audubon Society 6.) Akitsu Kimoto – Pima County Regional Flood Control District 7.) James Dubois – Pima County Regional Wastewater Reclamation Department 8.) Brian Powell – Pima County Office of Conservation Science
Mentioned as ‘Reach Out To’ in the proposal:
1.) Pima Association of Governments 2.) City of Tucson – Office of Conservation and Sustainable Development 3.) Bureau of Reclamation 4.) University of Arizona Water Resources Research Center 5.) US EPA, Matthew Webber
Roles of Technical Committee:
1. Attend monthly Technical Committee meetings September – December 2012 a. Starting 2013 reduce frequency to bimonthly or quarterly
2. Review initial, proposed indicators to assess “wetland health” 3. Assist in developing a monitoring strategy 4. Assess utility of indicators and suggest changes if necessary
Technical Committee
Compiled Meeting Notes 4

ROMP
Ina Rd WRF
Completion (10/18/13)
Ina Rd WRF
Compliance (1/30/14)
Roger Rd WRF
Completion (8/14/14)
Roger Rd WRF
Compliance (1/30/15)
Jul-Sep Oct-Dec Jan-Mar Apr-Jun Jul-Sep Oct-Dec Jan-Mar Apr-Jun Jul-Sep Oct-Dec Jan-Mar Apr-Jun Jul-Sep Oct-Dec Jan-Mar Apr-JunIndicator Monitoring *Effluent at 2 WRFsSurface Water at 4 sitesStormwater near Roger Rd.Macro Invertebrate Wetland Vegetation
Other Data Collection *Sediment Particle SizeVegetation for LiDAR analysisLiDAR acquisition
ReportJul-Sep Oct-Dec Jan-Mar Apr-Jun Jul-Sep Oct-Dec Jan-Mar Apr-Jun Jul-Sep Oct-Dec Jan-Mar Apr-Jun Jul-Sep Oct-Dec Jan-Mar Apr-Jun
Complete and
Publish Historical Condition
Report
Complete and
Publish Selection Process Report
Complete and
Publish Reviving
River Report#1
Complete and
Publish Reviving
River Report#2
Complete and
Publish Reviving
River Report#3
Community OutreachSCR Resercher's Day
* Proposed Monitoring Strategy subject to approval by Technical Committee
FY12/13 FY13/14 FY14/15 FY15/16
FY12/13 FY13/14 FY14/15 FY15/16
Water Year 1 Water Year 2 Water Year 3
Technical Committee
Compiled Meeting Notes 5

Table of Contents – Historical Conditions Report
Executive Summary
Chapter 1 – Introduction
Chapter 2 Historical Changes of Low Flow Channels
2.1 Historical Changes in Water Quality
2.2 Historical Changes in Infiltration
2.3 Historical Changes in Low-flow Channel Morphology
2.4 Historical Changes in Vegetation
2.5 Historical Condition in Macro Invertebrate
Chapter 3 Modeling Existing Conditions of Low Flow Channels
3.1 Modeling Infiltration in Low Flow Channels
3.2 Modeling Sediment Transport and Scour in Low Flow Channels
Chapter 4 Anticipated Changes due to the ROMP upgrade
4.1 ROMP Upgrade 4.2 Anticipated Changes in Effluent Discharges
4.3 Anticipated Changes in Effluent Water Quality
Technical Committee
Compiled Meeting Notes 6
Technic
al C
om
mitte
e
Com
pile
d M
eeting N
ote
s7

Technic
al C
om
mitte
e
Com
pile
d M
eeting N
ote
s8

Technic
al C
om
mitte
e
Com
pile
d M
eeting N
ote
s9
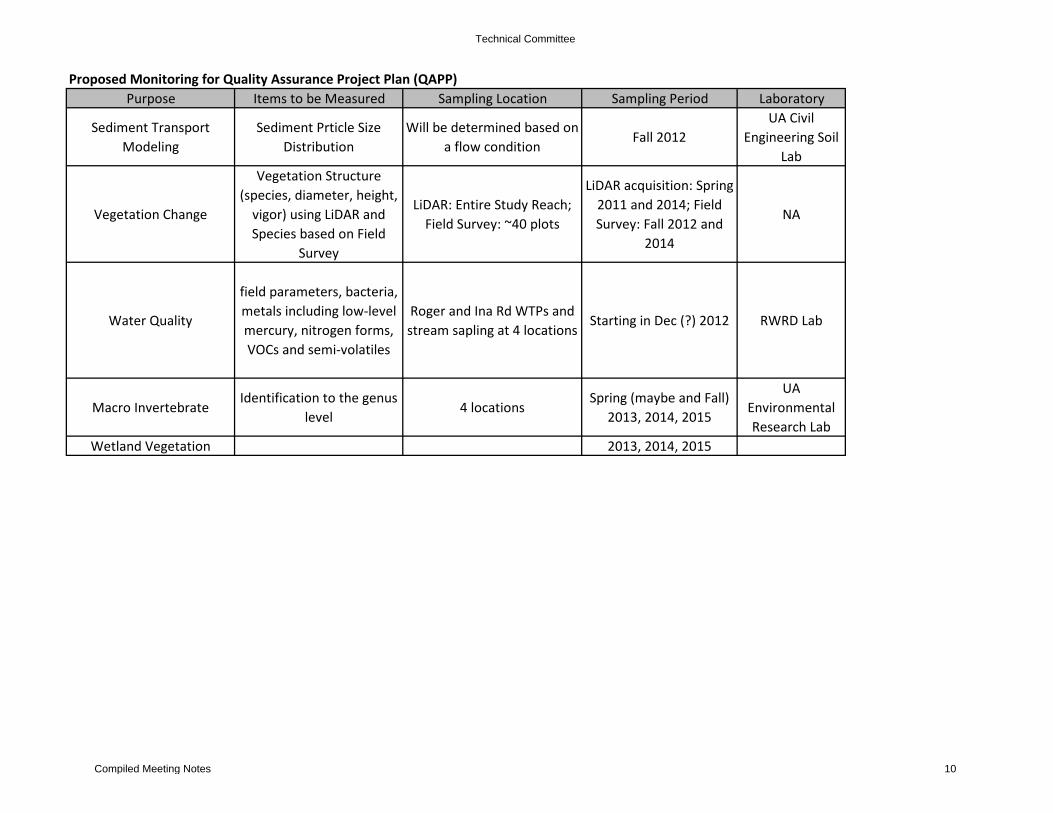
Proposed Monitoring for Quality Assurance Project Plan (QAPP)Purpose Items to be Measured Sampling Location Sampling Period Laboratory
Sediment Transport Modeling
Sediment Prticle Size Distribution
Will be determined based on a flow condition
Fall 2012UA Civil
Engineering Soil Lab
Vegetation Change
Vegetation Structure (species, diameter, height,
vigor) using LiDAR and Species based on Field
Survey
LiDAR: Entire Study Reach; Field Survey: ~40 plots
LiDAR acquisition: Spring 2011 and 2014; Field Survey: Fall 2012 and
2014
NA
Water Quality
field parameters, bacteria, metals including low-level mercury, nitrogen forms, VOCs and semi-volatiles
Roger and Ina Rd WTPs and stream sapling at 4 locations
Starting in Dec (?) 2012 RWRD Lab
Macro InvertebrateIdentification to the genus
level4 locations
Spring (maybe and Fall) 2013, 2014, 2015
UA Environmental Research Lab
Wetland Vegetation 2013, 2014, 2015
Technical Committee
Compiled Meeting Notes 10

Monitoring Changes in Dominant Vegetation Structure: LiDAR A Reviving River Technical Note for the Technical Advisory Committee
Objective: Determine baseline conditions and detect trends in the structure and abundance of key dominant species throughout the active floodplain.
Justification: Large trees and shrubs plan an important role in aquatic systems by providing shade, controlling sediment movement, and providing habitat for many species. Alternatively, ecologically meaningful changes in tree and shrub parameters (canopy cover, biomass, etc) can respond slowly to changes or can be quickly altered by flood. (Note, we are planning on monitoring wetland forbs as the other component of riparian vegetation monitoring).
Approach: After comparing more traditional survey methods such as point intercept or plot-based methods, it has been decided to use LiDAR (Light Detection and Ranging) and associated multi-spectral data was most appropriate. LiDAR is an optical remote sensing technology that uses an 'active' sensor - a rapid pulse laser beam, to measure the distances between the sensor and an object. LiDAR data are spatially extensive and intensive, mapping nearly every plant that has direct overhead exposure to the sensor. At fine scales (landscape to tree-stand) LiDAR has shown forest managers its exceptional accuracy and precision (<13m resolution) in regards to estimating total above-ground biomass, canopy height (tree tops), canopy base height (lowest living foliage) and percent canopy cover.
The project sampling will follow standard LiDAR vegetation protocols with a field-validation component, which will involve:
• Collection of >40 sample plots with 0.1ha radial plot footprints. • Plots will be selected with random locations, with an equal distribution amongst cover
types. • Individual plants will be documented and measured for their physical characteristics
(species, diameter, height, vigor) • Physical location of individuals will be recorded with distance and bearing from geo-
referenced plot center.
Data Acquisition and Analysis. Medium-density LiDAR data were collected in the spring of 2011 and covered only a portion of the study area (Figure 1). The entire site received low-density LiDAR coverage in 2008. The higher the density the better, but these two datasets are still quite useful. It is hoped that higher-density LiDAR can be collected during the next acquisition period (2014). The analysis of the 2011 data will be consider a “proof-of-concept” and part of the work will involve using high-density LiDAR that was collected at the County’s Cienega Creek Preserve. Part of the product for this work will be a step-by-step protocol that can be followed for the 2014 data.
Technical Committee
Compiled Meeting Notes 11

Contractor: Tyson Swetnam (UA, School of Natural Resources and the Environment) has been hired to complete the data analysis and summary of LiDAR data. Tyson is near completion of his Ph.D. from the UA with a special focus on remote sensing applications of aerial LiDAR for vegetation mapping.
Figure A. Extent of the 2011 LiDAR data acquisition.
Technical Committee
Compiled Meeting Notes 12

Aquatic Macroinvertebrate Monitoring A Reviving River Technical Note for the Technical Advisory Committee
Objective: Document changes in species richness and community composition (including Index of Biological Integrity) of aquatic macroinvertebrate in the Santa Cruz River, both before and after plant upgrades.
Justification: Aquatic macroinvertebrate have been shown to have predictable relationships to water quality and substrate parameters and are considered to be good indicators of biological condition of a site. In Arizona, indices and standards have been developed and tested for perennial water bodies (both cold and warm water systems) by the Arizona Department of Environmental Quality. ADEQ has made substantial progress on protocol development, data analysis, interpretation and management, resulting in a state-wide reference site network.
Approach and Data Acquisition: We propose to conduct aquatic macroinvertebrate sampling at 4 locations, one site just downstream of each of the wastewater outfalls and one each downstream of the Ina Rd facility, more likely at the Avra Valley and Trico/Marana roads, respectively. Sampling will use the same field collection protocol as is used by the ADEQ. Animals will be identified to the Genus level, if possible and the results converted to an Index of Biological Integrity. Sampling will take place once per year (April or May), but twice per year may be possible. Sampling in the winter would be ideal as it would give us intra-annual variability and a somewhat different assemblage of species, but would be more expensive. In addition to macroinvertebrate sampling we also will perform habitat assessments, which provides ecological information needed to interpret macroinvertebrate bioassessments. Habitat assessments are conducted by analyzing substrate, channel, riparian and other measures. The first sampling event will be in April 2013.
Contractor: A decision has not been made regarding who to hire for this work, but we believe that Dr. David Walker (UA; Soils, Water and Environmental Sciences and the Environmental Research Lab) is ideally suited to the task given his subject-matter knowledge, identification expertise, and even his familiarity with the site.
Technical Committee
Compiled Meeting Notes 13
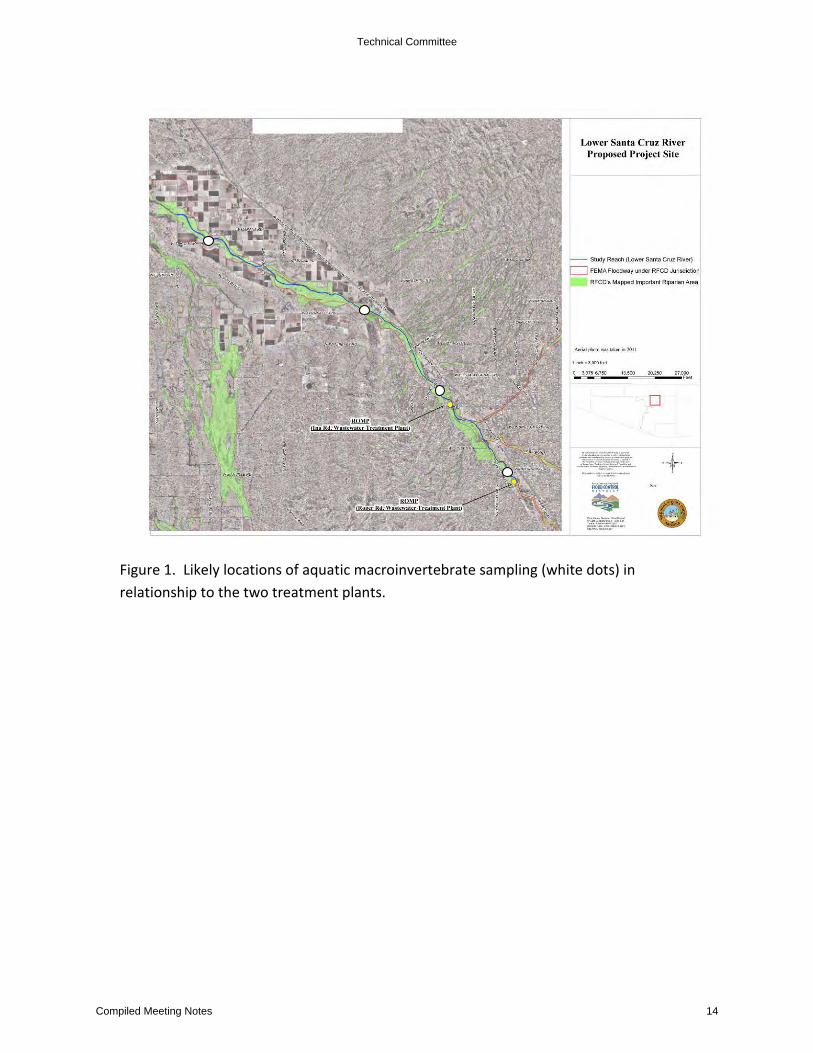
Figure 1. Likely locations of aquatic macroinvertebrate sampling (white dots) in relationship to the two treatment plants.
Technical Committee
Compiled Meeting Notes 14

Notes, 1st Reviving River Technical Committee Meeting Sonoran Institute, 44 E. Broadway Blvd., Tucson 85701 September 18th, 2012 9 - 11:30 am 1. Welcome & Introductions—Emily Brott, Sonoran Institute welcomed participants.
She explained that this is the first meeting of the Lower Santa Cruz River (LSCR) “Technical Committee” chosen by Pima County for input and assistance in developing a LSCR wetlands health assessment. Funding for the project comes from an EPA Wetlands Grant and matching funds from Pima County. Where possible, Technical Committee participation will be counted as in-kind match for the grant. The health assessment is tentatively titled “Reviving River” and is modeled on the “Living River” riparian health assessment for the Upper Santa Cruz River. Sonoran Institute will facilitate the Technical Committee and assist with report development and outreach.
• Technical Committee Members Attending: Patti Spindler (via telephone) –
Arizona Department of Environmental Quality (ADEQ); Robert Webb – US Geological Survey (USGS); Jennifer Duan – University Of Arizona (UA); Juliet Stromberg (via teleconference)– Arizona State University (ASU); Kendall Kroesen – Tucson Audubon Society (TAS); Akitsu Kimoto – Pima County Regional Flood Control District (PCRFCD); James Dubois – Pima County Regional Wastewater Reclamation Department (PCRWRD); Brian Powell – Pima County Office of Conservation Science (PCOCS)
• Others Attending: Jason Jones (via telephone), ADEQ; Ed Curley, PCRWRD; Evan Canfield, PCRFCD; Julia Fonseca, PCOCS; Rachel Pergamit, Sonoran Institute.
2. Goals & Purpose—Ed Curley and Jim DuBois, PCRWRD handed out a map and
gave a presentation about how the Regional Optimization Master Plan (ROMP) will substantially improve water quality in the next several years. The Reviving River wetland health assessment will demonstrate the changes that result from these water quality improvements. Pima County needs feedback from the Technical Committee about which of these changes are most relevant to include in communicating wetland health to the public. Pima County is also interested in exploring social indicators with the Technical Committee; social indicators were not included in the Upper Santa Cruz River health assessment.
• Handout: Project Map • Presentation: ROMP and Water Quality Improvements 2005 ADEQ agreement to reduce nitrogen in effluent at both Roger and
Ina wastewater treatment facilities. Decided to build a new plant from scratch and demolish the Roger Road
facility.
Technical Committee
Compiled Meeting Notes 15

Question: how do we manage the existing flow of effluent to the treatment facility and make it last for 50 years? (See flow patterns, slides 3&4).
Centralize flows at Ina; centralize biosolids; centralize biogas. Expand Ina to 50 million gallons/day (mgd); an additional 12.5 mgd. At Roger Road, build new Water Reclamation Campus, with a new
compliance lab. Plants interconnect with 5 miles of piping paralleling the freeway. Stimulus money helped fund this. Includes a 5 mile bike path, part of the Santa Cruz River loop. 50% complete at this time.
Water Quality Impacts
A critical piece that has been replaced is the biological process. We have a new five stage process known as “Bardenpho.” Clarification and recycling of waste sludge; more oxygenation. Increased settling of solids: clearer, lower nitrogen, lower total dissolved
solids (TDS), lower biological oxygen demand (BOD). Question: how is the odor?
o Comprehensive odor control: this is a contained system, we will be able to capture all gases.
Achievements in reducing turbidity, Avra Valley shows potential success and improvement.
Metals at Ina Road: exceedances primarily from stormwater upstream o Copper, lead, zinc o Chlorine: with new systems, lower dosing possible
Emerging Contaminants: expect high removal of exotic compounds, other denitrifying plants have very high removal rates
Effects beyond water quality: o High quality effluent – better infiltration rates, but also allows off-
channel uses o Better reclaimed water (A+ classification, more potential reuse) o 100% credit for aquifer recharge in off-channel basins o improved odor o improve adjacent land use along the channels
ROMP is good investment for water quality o Discharge/recharge o Ecosystem restoration o Urban uses
• Conclusion: The Regional Optimization Master Plan is a sizable investment. Improved water quality is the driver for this process. The EPA wetland grant is an avenue for us to do more study. One purpose will be to communicate to the public regarding what they are
getting for their investment. We have 50 years of pre-existing data [on effluent water quality].
Technical Committee
Compiled Meeting Notes 16

We want to answer the question: what will the change be in riparian and wetland health?
• Questions: Bob: How does the city of Marana play into this?
o Jim: The County wants to improve infiltration rates and decrease the extent of flow beyond Trico Rd.
Bob: Isn't Marana in charge of the wastewater treatment plant in question? o Jim: No, they are in charge of a small treatment plant further
downstream at the north end of the study area.
3. Products and Timeline—Akitsu Kimoto and Evan Canfield, PCRFCD shared a one-page project summary and timeline, as well as an outline for the Historical Conditions report. Evan stated that this project is a priority for Pima County and may have been possible even without the grant.
• Three Handouts: Project Summary & Participant List; Timeline; Historical Conditions Report Table of Contents
• Questions: Julie: will we try to compare our results with results from the Upper Santa
Cruz River? o Evan: we won't be able to compare everything, for example infiltration
will be different because the LSCR is so dependent on scouring flows. But we will try.
Jennifer: will the Technical Committee consider adding more to the reach beyond the current study reach depicted in the map? [The Simpson Farm, an Audubon restoration site, is just beyond the study reach, for example]. o Evan: The project reach is based on the managed recharge project
reach, which is what we told the EPA. However, the Technical Committee can add to this. The study reach is the minimum.
Julie: I see we will review the Historical Conditions report in January. Do you need input now? o Evan: Not at this time. [Julia contacted Julie to get input on her
section]. [Evan explained the Selection Process Report: This report will summarize
the process of developing the monitoring strategy, including 1. Selection of indicators wetland health; 2. Summary of any data gaps for selected indicators, and; 3. Recommendations for protocols to be used for the wetland quality parameters. The Selection Process Report will include all the data collected as appendices.]
Julie: how are we dealing with agricultural runoff? Are we treating effluent as only a component in all the river issues? o Evan: Good question, we had not thought about that. I suppose we can
think about it in terms of water quality monitoring and our sampling locations.
o [Flag this item for future discussion.]
Technical Committee
Compiled Meeting Notes 17

4. Upper Santa Cruz example—Emily Brott was to present on the process used for the Living River Report in the Upper Santa Cruz. To make up time [20 min. behind schedule], she asked if the group would feel comfortable with this presentation being postponed until the next meeting. [The group agreed]. Her reasoning was that this first meeting, Pima County would like to focus the discussion on monitoring that will be included in EPA's Quality Assurance Project Plan (QAPP). The QAPP is due in September 2012, and Pima County would like feedback from the Technical Committee prior to submission. In the Upper Santa Cruz example, a Science Advisory Committee started by brainstorming the “whole world” of potential indicators that could be important; and then narrowed them down according to certain constraints. We will begin this broader brainstorm of potential indicators at our 2nd Technical Committee meeting, and will hear the Upper Santa Cruz presentation at that time. [Break]
5. Quality Assurance Project Plan elements—Discussion and Decisions. Emily opened up the session by reiterating that today we are discussing monitoring components for the QAPP only; there is urgency because Pima County needs to begin monitoring in November in order to have baseline data for the first Reviving River report (2012 Water Year). The EPA requires the QAPP for these the data; to meet this tight deadline, the QAPP must be submitted for EPA review this month. Emily apologized for the need to make quick decisions in our first meeting.
• Water Quality—Jim DuBois Handout: Copy of Presentation Sampling Sites (see map handout)
o SC-01: just after Roger Road WRF o SC-03: just after Ina Road, before converges with Roger o SC-06: represents mix of both plants o SC-12: farthest downstream o Stormwater site is just upstream of Roger Rd outfall
Pima County proposes monitoring the following: o Field Parameters: Temperature, dissolved oxygen, conductivity,
pH o Treatment Performance: BOD, Total Suspended Solids (TSS) o Microbiology: E. coli o Nutrients: ammonia, total kjehdahl nitrogen, nitrate & nitrite,
phosphorus o Metals: arsenic, cadmium, chromium, copper, lead, mercury,
selenium, zinc Questions:
o Jim: is there anything else we should include? Organic compounds? Other tests? Jason: what about turbidity? This is usually measured in the
field.
Technical Committee
Compiled Meeting Notes 18

Patti: also, monitoring TDS correlates with macro invertebrates
o Jennifer: are you sampling frequently? Quarterly? Jim: yes, except for storm water.
o Jennifer: it is possible to measure TSS with sensors in the River; they send signals to a data collector. You will see sands transported in peak flows. The idea is to get data from monsoons and winter storms. This is what they're doing in Las Vegas. You can see aromatics, basic water quality indicators; it's not very expensive. Very important for measuring morphological change.
o Julie: are you sampling well water too? Jim: yes, at our monitoring wells. We did not add
groundwater as a component of our study, as the focus is riparian and wetland health. The groundwater is not shallow there; it is generally 150 feet deep or greater at most sites.
o Julie: are there any perched aquifers? Jim: none of the county wells are in a shallow zone, but we
could look for other wells that might be shallow if the committee felt it was important to explore this.
[Mark this item for future investigation and discussion.] Julia: there is evidence of perched layers near the Central
Arizona Project (CAP) canal, but not at depths connected to the riparian area. The perched layers are not contributing discharge.
o Patti: what about automated sensors for TSS? Jennifer: this can be done, and can measure turbidity also.
o Jason: are you planning to look at flow? Jim: Yes, but measuring flow with sampling is not likely to
give meaningful data about infiltration. For the managed recharge segments of the stream, the infiltration is measured using the gaging data from USGS gages at Cortaro and Trico Rd.
o Jim: at our next meeting, we will need to have a deeper discussion about what an “indicator” is for the purposes of this study. Although we will be measuring many things, this group will discuss what is most meaningful in terms of reporting back to the public about the health of the River. It is likely that we will report a simpler set of water quality parameters than we are testing for in our comprehensive tests.
o Jason: for communication to the public, will we show how flow regimes change throughout the study reach? Julia: we certainly could report on the length of the
discharge. Jim: we are trying to use stream gage data. We have used
this in recharge projects. We are trying to get some sense of
Technical Committee
Compiled Meeting Notes 19

how long a stretch of channel performs regarding infiltration rates.
Julie: measuring the length of the flowing surface water in the stream on a monthly basis would be very useful for monitoring wetland vegetation.
[Flag this for future discussion.] o Jim: does this group have any thoughts on organic constituents?
Should we include these? Are there good indicators among these? Julie: I have no experience with this. Have you picked up
any herbicides or pesticides in your water quality testing? How about volatile or semi-volatile safe drinking water constituents?
Julia: could we include some tests for agricultural runoff e.g. Herbicides and pesticides?
Julie: you could find out what kinds of compounds they are using, for example to treat cotton.
Jennifer: you could ask the University of Arizona agricultural department, and see what kinds of indicators they are using.
Jason: I'm not familiar with your Arizona Pollutant Discharge Elimination System (AZPDES) permit. What do you monitor for in terms of organics? What have you seen in terms of “detects”? That might be a place to start.
Patti: what is your pretreatment program for storm water? This may not be a part of regular monitoring.
Jim: we could look at County/City storm water data on herbicides and pesticides, at least to get a baseline level.
Julia: there is also data from USGS’s National Water Quality Assessment Program (NAWQA) for Arizona.
Patti: There is a NAWQA webpage on pesticides. [Jim will look into these ideas on organic constituents, TSS,
and turbidity and report back to the group.]
• Sediment—Akitsu Kimoto talked the group through handout and stated that Pima County will describe the existing condition for sediments in the Historical Conditions Report; the item proposed for monitoring will be sediment particle size distribution, measured through Sediment Transport Modeling. Handout: Proposed Monitoring for Quality Assurance Project Plan
(QAPP) Questions:
o Bob: Why is your data showing degradation of the channel (which makes sense) as well as the floodplain (this does not make sense). We will need to do a proper cross-section, not just use LIDAR data. [This question will be discussed at a small-group LIDAR meeting with Tyson Swetnam, scheduled
Technical Committee
Compiled Meeting Notes 20

for November 8th, 10-11:30am; contact Akitsu if you would like to join that discussion.]
o Jennifer: When do you expect to have the Historical Condition report ready for review? Akitsu: End of December at the earliest.
o Jennifer: We will need to be able to show morphological change in sands and gravel. Also, fine particles in urban runoff /stormwater—less than 64 µ (silt and clay). This is particularly important because runoff events carry lots of contaminants. For morphological change it is not as important to measure these but for water quality, it is very important. These fine particles aggregate/flocculate and then settle, releasing chemicals that are adsorbed to them. [According to the EPA, fine sediments are major contaminants]. Akitsu: So how do we measure for these? Jennifer: You measure the TSS. The first layer of
material is mud. You use chemical agents to remove the organic material from the flocculants.
Julia: There used to be a materials lab on Mission Road. Jason: there is a lower tech option that is standard. You
do a pebble count for the stream; there is a good and easy protocol for this. Percent fines is one of the important things measured through this method.
Bob: pump samplers can also measure TSS. They can help with understanding the hydrograph; account for daily fluctuations. Manual sampling is difficult for TSS.
• Vegetation—Brian Powell, Pima County Office of Sustainability &
Conservation began the discussion by giving a brief overview of what Light Detection and Ranging (LIDAR) is, and what it can be used for. In this context, LIDAR can help us understand the dominant vegetation structure. LIDAR data is created by beaming light on an object and measuring the objects’ properties by the reflected light [i.e., an optical remote sensing technology]. The LIDAR equipment is mounted on the same cameras that are used to take orthophotos. When the light bounces back from the riparian vegetation, it will tell us something about the vegetation structure. In 2011, Pima County collected an incomplete set of high-density LIDAR data. In 2008, the County collected a complete set of low-density LIDAR data. Pima County proposes contracting with Tyson Swetnam to analyze the data. Mr. Swetnam will have three principal tasks:
1. Characterize the baseline vegetation structure—determine how to handle the high density versus low-density and complete versus incomplete data.
Technical Committee
Compiled Meeting Notes 21

2. Analyze on-the-ground sample plots—to verify the structure and dominant species (large trees and shrubs).
3. Develop a protocol for 2014 LIDAR data collection. [NB: Mr. Swetnam will also be analyzing Cienega Creek LIDAR data, for a different project]
This is our general approach, though, in addition to the LIDAR data, we will use multi spectral data. LIDAR can also be used for stream channel morphology and can detect small changes in degradation and aggregation. Handout: LIDAR Presentation Outline Questions:
o Bob: how are you dealing with the need to find bare earth? Emily: What do you mean by your question about bare
earth? Bob: You need an algorithm to remove vegetation if the
sensor can't find bare earth to bounce off; this is an issue in dense areas.
Julia: can test plot data be used as a check to make sure the bare earth calculation is correct?
Bob: you need to survey cross-sections to bare ground so you know inferences regarding the data are correct.
o Julie: though this data can tell us something about what is changing, we will need more frequent data in order to say something about the causes of change. Is every three years adequate for our purposes? Brian: we would probably have flood events within the
three-year interval, but it takes time for trees to grow. We are looking at gross changes in over story, and the structure of three-year intervals has already been established. We are proposing this as a compromise based on budget, available data, and resolution of data.
o Bob: don't get me wrong, I think this is a good approach, but it is imperative to measure stream channel morphology with on the ground cross-sections. We need to determine if inferences about channels and floodplains are correct and to verify the LIDAR data . Brian: since we are pressed for time, I recommend that I
take this discussion off-line with you to dig deeper into the channel morphology issue and what it will take to get what we need.
Bob: I also suggest that we invite Tyson to a future meeting to give a presentation on his plans.
Brian: My understanding from Tyson is that the LIDAR data can show vegetation changes for shrubs and trees, and for that purpose reaching bare ground is not critical.
Technical Committee
Compiled Meeting Notes 22

[Further discussion needed on the channel morphology and data cleanup/vegetation removal process]
o Julie: I just have a question about what the purpose of the Technical Committee is if you have already decided on your methods. Is this a good use of my time? Emily: this first Technical Committee meeting is focused
on monitoring that Pima County would like to begin immediately, and which they consider to be “no-brainers.” Our next meeting will get into more open ended discussions about indicators, and particularly those which seem trickier.
[Emily added this further point on the subject at the end of the call: Pima County had to include some ideas for monitoring in the proposal to the EPA last spring. These are the ideas we are discussing today. However, although Pima County will be monitoring these items, that does not mean they will be included as formal indicators in the Reviving River report. The Technical Committee will determine what warrants inclusion.]
o Patti: I'm afraid we need to log off now, as it is nearly 11:30 am. Brian: can you please stay for an additional 5 min. because
we need your input on macro invertebrates. [ADEQ agreed].
• Macroinvertebrates—Brian Powell quickly summarized the questions he had and referenced the handout. Handout: Macroinvertebrates Presentation Outline Questions:
o Brian: as you will see in this document, we propose following the ADEQ sampling strategy and sampling once per year at four sampling locations. Do you think that is enough? Patti: yes, annually should be sufficient and I recommend
sampling in the spring. However, more intensive monitoring is always better, because there are seasonal changes and certain taxa are not around in certain seasons. For example, midges, worms, and beetles have multiple lifecycles per year. It will cost $450 per sample to get genus level sampling identified at the lab. Biannual sampling would be great, but at least get an annual spring sample. That will show impacts to invertebrates as there are major improvements in water quality. Habitat measurements are also critical (i.e., pebble counts). Other ideas include substrate measurement for bugs.
Brian: we have a suite of habitat measurements I'd like to get feedback on off-line. [Patti agreed to this]
o Julia: what about the distribution of monitoring sites along the length of the channel?
Technical Committee
Compiled Meeting Notes 23
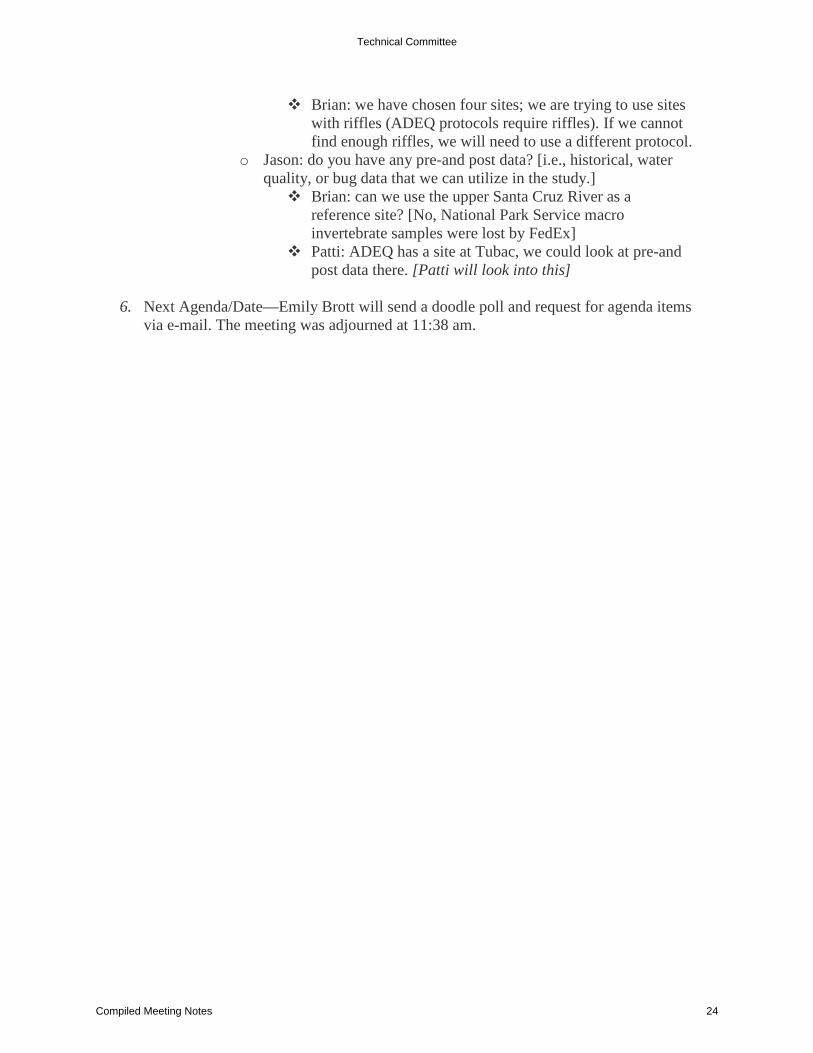
Brian: we have chosen four sites; we are trying to use sites with riffles (ADEQ protocols require riffles). If we cannot find enough riffles, we will need to use a different protocol.
o Jason: do you have any pre-and post data? [i.e., historical, water quality, or bug data that we can utilize in the study.] Brian: can we use the upper Santa Cruz River as a
reference site? [No, National Park Service macro invertebrate samples were lost by FedEx]
Patti: ADEQ has a site at Tubac, we could look at pre-and post data there. [Patti will look into this]
6. Next Agenda/Date—Emily Brott will send a doodle poll and request for agenda items
via e-mail. The meeting was adjourned at 11:38 am.
Technical Committee
Compiled Meeting Notes 24

Agenda-Reviving River Technical Committee Meeting Monday, October 22nd 2012
Sonoran Institute, 44 East Broadway Boulevard, Suite 350 9:30-10 am light breakfast; 10 am – 12 pm meeting
1. Welcome, Introductions, Approval of Minutes—Emily Brott, Sonoran Institute,
Facilitator (10– 10:15 am)
2. Upper Santa Cruz River Example—Claire Zugmeyer, Sonoran Institute (10:15– 10:35)
1. Adapting to the Lower Santa Cruz Context—Evan Canfield, Pima County Regional Flood Control District (10:35 – 10:50 am)
2. Discussion: Role(s) of the Technical Committee (10:50-11 am)
Break (15 min)
3. Brainstorm: Universe of Indicators (11:15 – 11:35 am)
4. Discussion: Who Is Missing? (11:35 – 11:50 am)
5. Next Agenda items & Date: Wednesday, November 28th 10 am – noon Adjourn at 12 pm
Technical Committee
Compiled Meeting Notes 25

Reviving River Project - Bios Technical Committee *Alternate James (Jim) DuBois, R. G. Principal Hydrologist for Pima County Regional Wastewater Reclamation Department. He is an experienced Hydrologist, Environmental Manager, and Registered Professional Geologist in the state of Arizona. He participated in writing & technical review of Arizona Guidance Manual for Constructed Wetlands for Water Quality Improvement and worked with a stakeholder group to develop general permits for certain types of constructed wetland facilities. Jennifer G. Duan, Ph.D., P.E. Akitsu Kimoto, Ph.D., CFM Principal Hydrologist at Pima County Regional Flood Control District. She completed a Ph.D. in Agricultural Science in Kyoto University in 2003, a M.S. in Agricultural Science at Kyoto University, and a B.S. in Environmental Science at Hiroshima University. She has over 14 years of experience in watershed management, hydrology, sediment transport, and soil conservation. Kendall Kroesen Staff member of Tucson Audubon (TA) since February 2002. During his first eight years he worked with the habitat restoration program and helped improve communications, especially via the website and newsletter. In 2010 he became the Habitats Program Manager and is helping TA create an urban-focused sustainability program. TA is working with businesses, homeowners, and landscape designers to better define the characteristics of urban landscapes that make them ecological sustainable and useful for declining populations of birds, as well as being productive for people. He also continues to direct riparian habitat restoration projects in the Tucson metro area. He has a BA in anthropology from the University of California, Riverside, and a Ph.D. in cultural anthropology from University of California, San Diego. Jason Jones* Supervisor for Arizona Department of Environmental Quality Monitoring Unit, which is responsible for monitoring Arizona’s lakes, streams, wetland and groundwater. He’s been with ADEQ for 11 years and is currently the EPA Region IX representative for the National Water Quality Monitoring Council. Recently, he has completed a wetland mapping project as part of a 104(b) EPA grant and has coauthored a paper summarizing groundwater quality data for over 1,500 wells. Jason has a Master’s degree in biology from Clarion University. Brian Powell Program Manager for Pima County Office of Sustainability and Conservation. He is the lead biologist responsible for developing a long-term ecological monitoring program for Pima County’s award-winning Sonoran Desert Conservation Plan. He has expertise in evaluating potential monitoring parameters and designing monitoring programs. Patrice (Patti) Spindler Employed by the Arizona Department of Environmental Quality for the past 22 years. She is a stream ecologist/water quality scientist who conducts stream water quality and macroinvertebrate monitoring,
Technical Committee
Compiled Meeting Notes 26

research and standards development. She developed biocriteria and bottom deposits criteria for the surface water quality standards and has participated in various studies on intermittent stream biocriteria, nutrient standards, physical integrity of stream channels, and probabilistic survey designs, as well as monitoring of the states waterbodies including EDWs. She is a graduate of Arizona State University, with a masters degree in biology. Dr. Julie Stromberg Plant ecologist in the School of Life Sciences at Arizona State University. She and her students have been studying desert rivers for over two decades, to understand how changes in stream flow regime influence riparian plant communities, and to provide managers with information that can inform conservation and restoration efforts. She is co-editor of “Ecology and Conservation of the San Pedro River” (UA Press), and teaches courses in restoration ecology and conservation biology. Robert Webb Robert has worked on long-term changes in natural ecosystems of the southwestern United States since 1976. He has degrees in engineering (B.S., University of Redlands, 1978), environmental earth sciences (M.S., Stanford University, 1980), and geosciences (Ph.D, University of Arizona, 1985). His dissertation concerned late Holocene and historical flooding of the Escalante River within Grand Staircase – Escalante National Monument and the relation of that flooding with arroyo downcutting. Since 1985, he has been a research hydrologist with the U.S. Geological Survey in Tucson and an adjunct faculty member of the Departments of Geosciences and Hydrology and Water Resources at the University of Arizona. Webb does interdisciplinary work merging history, climate change, desert vegetation ecology, hydrology, geomorphology, and Quaternary geology to attempt to understand long-term change in the desert regions of the United States and Mexico. Webb as authored or edited 14 books, including Environmental Effects of Off-Road Vehicles (with Howard Wilshire); Grand Canyon, A Century of Change; Floods, Droughts, and Changing Climates (with Michael Collier); The Changing Mile Revisited (with Raymond Turner); Cataract Canyon: A Human and Environmental History of the Rivers in Canyonlands (with Jayne Belnap and John Weisheit); The Ribbon of Green (with Stanley A. Leake and Turner), and most recently, the Mojave Desert: Ecosystem Processes and Sustainability (with 5 other editors). His most recent book is The Santa Cruz River through Tucson: Historic Change in an Arid Region River (with three co-authors, in press). Project Staff
Evan Canfield Chief Hydrologist at Pima County Regional Flood Control District. He is registered P.E. in Civil Engineering with over 20 years of experience in hydrology and water resources. He holds a Ph.D. in Agricultural Engineering from the University of Arizona, with B.S. and M.S. in Geology. Ed Curley Ed has over 30 years of experience and currently assists the Pima County Regional Wastewater Reclamation Department (RWRD) on a part-time basis working with the jurisdictions and tribal entities that RWRD serves and with special projects for the Director’s Office. He is involved in analysis of state and national legislative activity and coordination with regional water quality planning and a co-editor of Relevance of Ambient Water Quality Criteria for Ephemeral and Effluent-Dependent Watercourses of the Arid Western United States (SETAC, 2008).
Technical Committee
Compiled Meeting Notes 27

Julia Fonseca Environmental Planning Manager for Pima County Office of Sustainability and Conservation. She developed the riparian element of the Sonoran Desert Conservation Plan, which included comprehensive water resource inventory and riparian vegetation mapping. In her 21 years at Pima County Regional Flood Control District, she led and assisted in many studies and projects along the effluent-dependent Santa Cruz River. Emily Brott Southern Arizona Project Manager for Sonoran Institute's Sun Corridor Legacy Program. She leads the Institute's engagement in innovative water harvesting, river restoration, and water policy initiatives in the binational Santa Cruz Watershed. She has nine years of experience in international community development and watershed restoration. Brott received a Masters in Environmental Sciences from Lund University, in Sweden, specialized in US EPA drinking water policy at the Cadmus Group, Inc., and completed a B.S. in Biology at Harvard University. Claire Zugmeyer Ecologist for the Sonoran Institute. She has worked on the Institute’s Santa Cruz River Initiative for 5 years and has led the production of recent Living River reports (2009 and 2010 water years). She completed a Masters in Wildlife and Fisheries Biology at the University of Arizona in 2007, a B.S. in Ecology, Behavior, and Evolution at the University of California, Los Angeles, and has worked on a variety of research and management projects focusing on birds, mammals, fish and amphibians.
Technical Committee
Compiled Meeting Notes 28

Reviving River Project – Contact Information
Technical Committee Members *Alternates
James (Jim) DuBois, R. G. Principal Hydrologist Pima County Regional Wastewater Reclamation Dept. [email protected] (520) 724-6009 Jennifer G. Duan, Ph.D., P.E. Associate Professor Dept. of Civil Engineering and Engineering Mechanics University of Arizona [email protected] (520) 626-5946 Jason D. Jones* Supervisor, Monitoring Unit Arizona Department of Environmental Quality [email protected] (602) 771-2235 Akitsu Kimoto, Ph.D., CFM Planning and Development Pima County Regional Flood Control District [email protected] (520) 243-1800 Kendall Kroesen Habitats Program Manager Tucson Audubon Society [email protected] (520) 629-0510 x7006 office (520) 971-2385 cell
Brian Powell Program Manager Pima County Office of Sustainability and Conservation [email protected] (520) 740-6440 Patrice (Patti) Spindler Aquatic Ecologist Standards & Assessments Unit Arizona Department of Environmental Quality [email protected] (602) 771-4543 Dr. Julie Stromberg School of Life Sciences Arizona State University [email protected] (480) 965-0864 Robert Webb US Geological Survey [email protected] (520) 670-6671 x238
Project Staff Evan Canfield PhD PE CFM Pima County Regional Flood Control District [email protected] (520) 243-1800 Ed Curley Pima County Regional Wastewater Reclamation Dept. [email protected] (520) 740-6638 Julia Fonseca Pima County Office of Sustainability and Conservation [email protected] (520) 740-6460
Emily Martin Brott Sonoran Institute [email protected] (520) 290-0828 x1144 Claire A. Zugmeyer Sonoran Institute [email protected] (520) 290-0828 x1143
Technical Committee
Compiled Meeting Notes 29

Sonoran Institute
4th
Quarter Report
October 2008
- 2 -
Key Indicators of Riparian Health (indicators that will be included in the Riparian Health Score Card are italicized in blue)
Groundwater
Depth to water in 100yr floodplain
Variability of depth to water over time
Surface/Groundwater Interactions
Streambed infiltration
Source composition of surface/groundwater
Unsaturated at depth
Schmutzdecke presence + infiltration
Surface Water Quantity
7 day minimum flow
Presence/Absence of water
Distance of flow
Base flow
Peak flows
Water Quality
Ammonia
Macro invertebrates
E. coli
Polychlorinated hydrocarbons
Dissolved oxygen
Water temperature
Heavy metals
Other water quality toxins
Algal productivity
C-N-P
Physical Factors
Ratio of width to depth in channel
Terrestrial Plants
Suite (diversity of native plant species present
Extent exotic species present
Land use and land cover
Stand diversity
Age structure of riparian vegetation
Recruitment of native plants
Continuity of vegetation
Terrestrial Animals
% native biota diversity (birds & herps)
Mammals – keystone species
Aquatic Critters
Native fish species present
% native biota diversity (birds & herps)
Non-native fish & herps
Large woody debris
Macro invertebrates
Human Disturbance
Land use and land cover
Grazing intensity
Trash
% of people who get drinking water from stream
Human perceptions of river
Fire
Landscape disturbance (mines, dumps, roads)
Amt of impervious surfaces
Technical Committee
Compiled Meeting Notes 30

Sonoran Institute
4th
Quarter Report
October 2008
- 4 - Sonoran Inst
4th
Quarter Re
- 4 -
Technical Committee
Compiled Meeting Notes 31
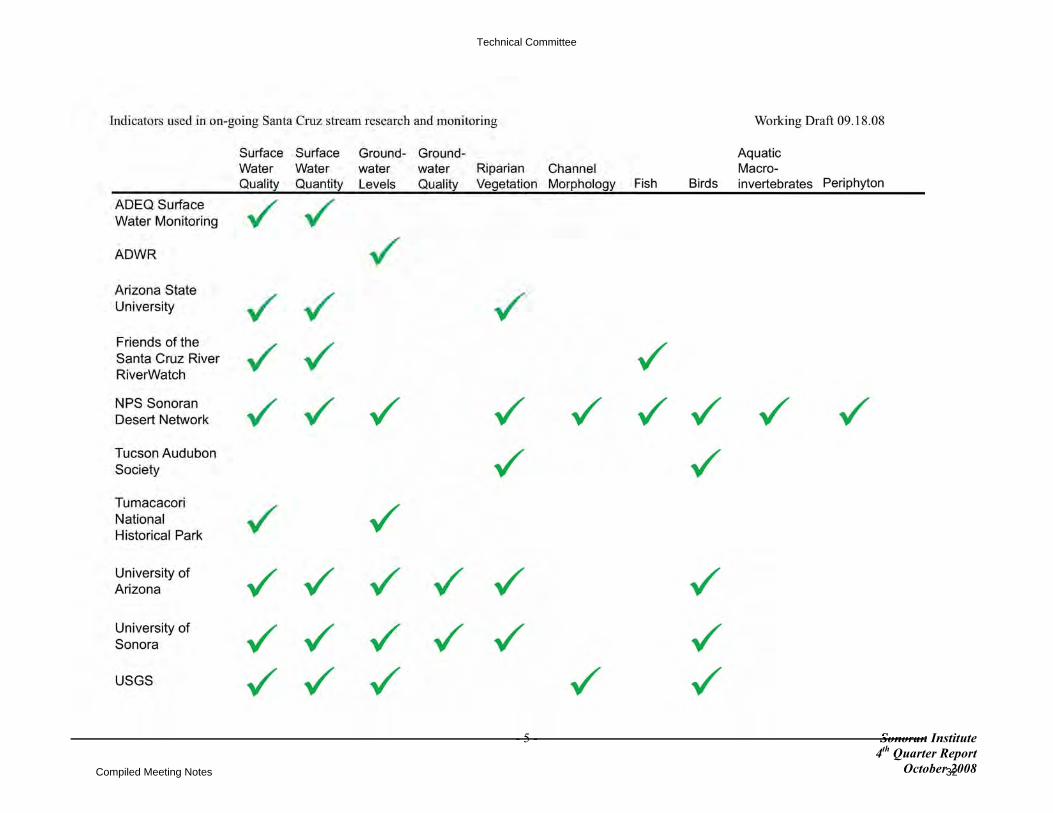
Sonoran Institute
4th
Quarter Report
October 2008
- 5 - Sonoran5
Technical Committee
Compiled Meeting Notes 32
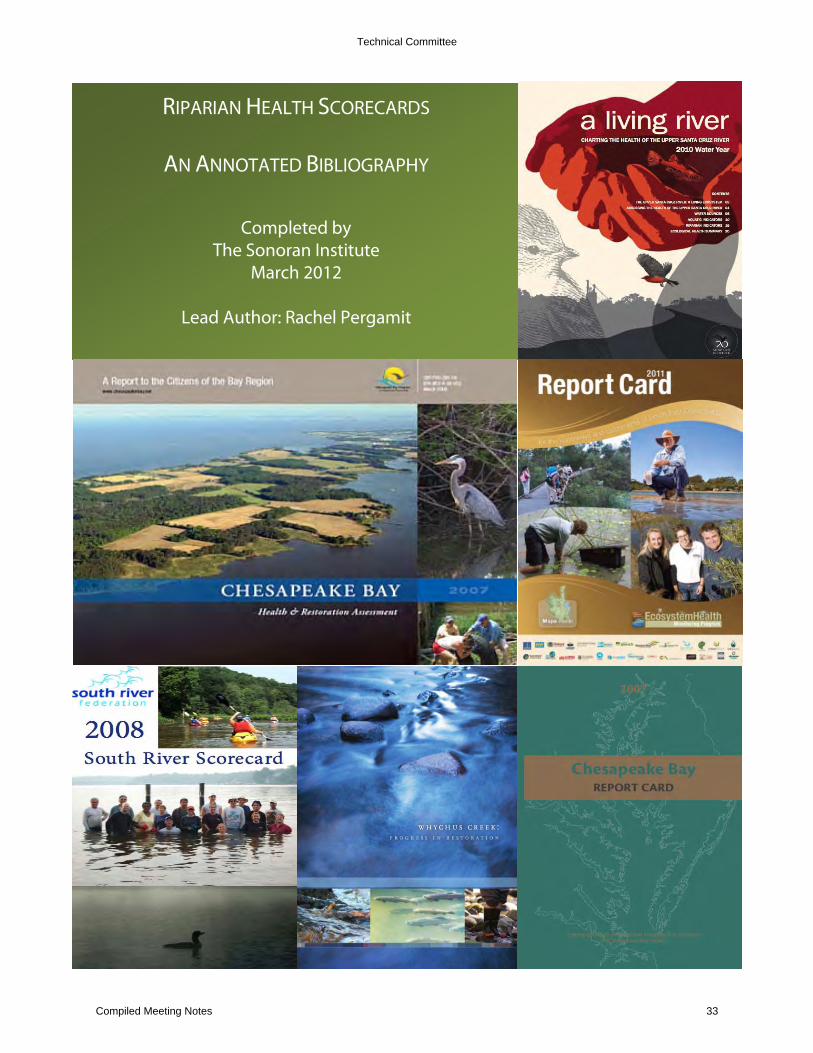
RIPARIAN HEALTH SCORECARDS
AN ANNOTATED BIBLIOGRAPHY
Completed by The Sonoran Institute
March 2012
Lead Author: Rachel Pergamit
Technical Committee
Compiled Meeting Notes 33

Table of Contents
Executive Summary: ................................................................................................... 3
SEQ Healthy Waterways Partnership. (2008). Ecosystem Health Report Card 2008: for the waterways and catchments of South East Queensland ...................................................... 4
Upper Deschutes Watershed Council, Deschutes River Conservancy. (2009). Whychus Creek: Progress in Restoration. ........................................................................................................... 4
EcoCheck, Integration and Application Network, University of Maryland Center for Environmental Science. (2007). 2006 Chesapeake Bay Report Card. .................................... 5
University of Maryland Center for Environmental Science. (2008). 2007 Patuxent River Report Card. .................................................................................................................................... 5
Sonoran Institute. (2008, 2009, 2010). A Living River: Charting the Health of the Upper Santa Cruz River. ........................................................................................................................ 6
South River Federation. (2008). South River Scorecard. ........................................................... 6
Chesapeake Bay Program. (2007). Land Use and The Chesapeake Bay Report Card. .... 7
Chesapeake Bay Program. (2006). Chesapeake Bay 2006 Health and Restoration Assessment ................................................................................................................................................ 8
Chesapeake Bay Program. (2006, 2007, 2008). Chesapeake Bay Health and Restoration Assessment........................................................................................................................ 8
Ecosystem Health Monitoring Program. (2011). 2011 Report Card for the waterways and catchments of South East Queensland. .................................................................................... 9
Carruthers, T., S. Carter, L. Florkowski, J. Runde, and W. Dennison. 2009. Rock Creek Park natural resource condition assessment, National Capital Region Network. Natural Resource Report NPS/NCRN/NRR—2009/109. National Park Service, Fort Collins, Colorado. ..................................................................................................................................... 9
Chester River Association. (2008). 2007 Chester River Report Card. ................................. 10
Technical Committee
Compiled Meeting Notes 34

Executive Summary: In the process of developing the “Living River” report series for the Upper Santa Cruz River, the Sonoran Institute came across many other riparian health report cards that influenced our design and content. Reviewing various examples helped focus the objectives we wanted to achieve in publishing our report. Along with the Living River, we have compiled here an array of riparian health scorecards that offer various methods, formats, and designs, demonstrating the range of forms that an environmental health report card can take. The main purpose of a scorecard is to make data on an ecosystem accessible to the non-scientific community. This transforms scientific data and guidelines into a narrative that can be used to advance socio-economic objectives. Each scorecard was reviewed for a number of criteria: method of scoring, use of visual graphics, use of maps, publication format, methodology explanation, and inclusion of non-score related data or information. The scorecards were also analyzed as a whole for important or exceptional features. There are many aspects that these report cards have in common. The report cards assessing the Chesapeake Bay vary in format and design, but use similar indicators and scoring methodology. Most of the report cards use maps either to provide context of the riparian area examined, or to denote the specific results for regions of the area. All of the report cards included data or information that did not influence the scores. This information was often further explanation of salient details of scores, special water events and their effects, or the importance of measuring the chosen indicators. These report cards tend to provide an overview of the health of the riparian area for a layperson audience. Extensive methodology and technical explanations are often online, with summaries and general statements included in the publication. They also tend to focus on improvements or degradations since a specified time, often in the year since the last published report. The most salient differences between the report cards lay in the perceived audience, which clearly affected the design and format choices. Formats ranged from a few pages, to longer newsletters, to extensive book-length reports. This was clearly highly dependent on the presumed audience, frequency of publication, and the objective of the publication.
Technical Committee
Compiled Meeting Notes 35

SEQ Healthy Waterways Partnership. (2008). Ecosystem Health Report Card 2008: for the waterways and catchments of South East Queensland. The Ecosystem Health Monitoring Program has an extensive history of report cards and riparian assessments, which is demonstrated by this clear, and short yet informative report. The feature article on “Linking management investments to trends in ecosystem health” is one of the best examples of using data in a visual way to tell a better story. Linking charts, maps, and photographs, the report examines the disconnect between a significant reduction in nitrogen loads and an unchanging score. Overall, it combines the science, legislation, and community action pieces that drive many ecosystem health report cards.
o Scoring: Grades “A” to “F”. Grades are based on an averaged score of two indices that each measured different sets of ecosystem health indicators.
o Visuals: Basic temporal graphs and charts; photographs of important features of certain areas; combination of all used and linked in the feature article mentioned above.
o Maps: Main feature of report: freshwater and estuarine/marine region. Maps have the catchment border, monitoring areas, and urban areas labeled, with offset labels with each grade and brief notes.
o Format: 4 pages. Is an overview of and introduction to a comprehensive report with detailed scorecards for each sub-region.
o Methodology: Within this part of the report, there is no methodology explained. However, there is a dedicated methodology section in the report, where there is a full explanation of collection techniques and scoring method.
Upper Deschutes Watershed Council, Deschutes River Conservancy. (2009). Whychus Creek: Progress in Restoration. As part of a long-term restoration project, the Upper Deschutes Watershed Council and Deschutes River Conservancy issued a progress report on their efforts. The report summarized restoration activities and goals for river health indicators. Because of this set up, the report did not have final scores. Rather the design used one to two pages to explain each indicator, its importance, and efforts and progress to improve it. For each indicator there was some visual feature, whether map, graphic, or photograph. The graphics in this report were extremely effective at illustrating the indicators in creative and graphically sleek ways (fish and water drops). The report is very accessible to the public, and would address concerns or questions about the restoration progress and project. However, the report stops short of providing technical details or quantitative data.
o Scoring: No final score or standard indicator-specific score. Some indicators
rated from “poor” to “good.” Text descriptions of progress. o Visuals: Excellent graphics with every indicator. Graphics used to explain
indicators, show progress, or further illustrate a graph. Photographs and charts also used.
Technical Committee
Compiled Meeting Notes 36

o Maps: Used for appropriate indicators, the map of the river is shown with results overlaying or offset from their river sites. Full page map with geographical context describing restoration activities along the river in the introduction.
o Format: 16 pages. About 1-2 pages per indicator. Allows for description of importance, improvement work, and measurable progress.
o Methodology: Not addressed within report, but available in technical reports offered online.
EcoCheck, Integration and Application Network, University of Maryland Center for Environmental Science. (2007). 2006 Chesapeake Bay Report Card.
This report card serves as a good overview and comparison of scores across sub-regions of the Bay and includes unusual circumstances and explanations of trends. These explanations are concise, clear, and easy to follow. The data behind the scores is available online. A unique and helpful feature was a ranking of each grade relative to the other sub-regions, especially since there was a small range of grades.
o Scoring: Letter grade derived from aggregated index. Initial scores are
calculated for each chosen “Water Quality” and “Biotic” indicator, based on progress against scientifically derived thresholds. Those scores are aggregated to scores for Water Quality Index and Biotic Health Index, which are averaged to produce overall index score and letter grade.
o Visuals: No graphics, only maps and tables. o Maps: Map of entire bay with regions color-coded according to score. This
report does not use visual graphics beyond maps and tables. There is a map of the entire bay with the regions color-coded according to grade.
o Format: 6 pages. At-a-glance notes, Bay map, and scores with descriptions grouped by tributary region.
o Methodology: Not explained, but available online at www.eco-check.org/reportcard/Chesapeake
University of Maryland Center for Environmental Science. (2008). 2007 Patuxent River Report Card.
This report card is almost identical to the Chester River report card, as they were funded by the same grant. It uses the same indicators and scoring system as the other Chesapeake Bay-related report cards reviewed here. However, this report card has river-specific content including: a request for citizen scientists to implement monitoring, actionable advice for individuals, and analysis of salient data. Approachable and accessible, the report card is informational for the public. The report card excels in explaining background information for the results, such as the source points of pollution. The group has instructional documents and resources online for developing a report card.
Technical Committee
Compiled Meeting Notes 37

o Scoring: Letter grade derived from aggregated index. Initial scores are calculated for each chosen Water Quality and Biotic indicator, based on progress against scientifically derived thresholds. Those scores are aggregated to scores for Water Quality Index and Biotic Health Index, which are averaged to produce overall index score and letter grade.
o Visuals: Photographs of river, scenery, and volunteers; small graphic for each indicator.
o Maps: Map of estuarine region examined with detailed shading according to grade. A second map was a graphic representation depicting land use types in the watershed.
o Format: 4 pages. Newsletter format. o Methodology: Explained in detail online.
Sonoran Institute. (2008, 2009, 2010). A Living River: Charting the Health of the Upper Santa Cruz River.
This report uses a very different design and style compared to others in this bibliography. The lengthy booklet includes detailed background and extensive description of scientific concepts. There are plentiful graphics, often integrated as the background, which helps make the results more meaningful for a non-scientific reader. Consequently, the majority is data and information that does not affect the final score, but explains reasoning and environmental justification for indicators. The authors note that there is limited data to perform statistical analysis, so a simple side-by-side comparison is offered. This report did well in assessing indicators important to the specific watershed (i.e. taking into consideration that effluent flow is a major water source).
o Scoring: Percentage of meeting standard or threshold as determined by
Arizona Department of Environmental Quality or scientific standards. +/- for changes relative to base year in cases where a threshold has not been determined. Summaries included, but not prominently featured; embedded with explanations.
o Visuals: Heavily used to illustrate scientific concepts, such as the story of each indicator beyond what it is specifically measuring. (E.coli, streamflow, etc)
o Maps: One of the entire watershed, with minimal environmental aspects, but state/county lines. Provides context, introduces locale. Results are not linked to the map, but refer to it throughout the report. A second, indicator-specific map is used, and results are displayed on the map.
o Format: 21 pages, booklet format. Can be understood independently from its other yearly reports. The descriptions remain almost the same.
o Methodology: General description of monitoring techniques and frequency. South River Federation. (2008). South River Scorecard. The South River Scorecard focuses on potential for community action and connection by using personal appeals from the organization’s leadership and
Technical Committee
Compiled Meeting Notes 38

suggesting indicator-specific ways for individuals to help improve the ecosystem’s health. Each indicator description included a subsection called “What Can You Do?” offering specific actions readers can take to help improve river health. Within the main description were general findings from the monitoring, and background information on the indicator. It was unclear how the report’s authors evaluated the status or progress of indicators that were not measured against a scientific threshold.
o Scoring: Scale of 0-10, based on percentage for most indicators. The scoring methodology is not explained for indicators without specific thresholds.
o Visuals: Photographs for each indicator, arrows indicating yearly change. o Map: No main map with results. Small map with monitoring stations is
hidden in conclusion. Lack of map could be justified since results are not monitoring-station specific and instead assess the entire river. One small map in conclusion shows monitoring stations in the tidal portion of the river, but this is only part of the entire watershed. Results are not linked to the map.
o Format: 16 pages. Includes letters, introduction and summary, and then one page per indicator.
o Methodology: General testing information of frequency, time period, locations, threshold, results.
Chesapeake Bay Program. (2007). Land Use and The Chesapeake Bay Report Card.
This newsletter serves to compare the 2006 and 2007 report card results, and further evaluates the scores regarding factors such as land use and nutrient loads. The report has a similar format to the report cards it is comparing, but with fewer analyses than other newsletters, there is space for more illustrative visuals.
o Scoring: Comparing scores of the Chesapeake Bay Program’s Bay Health
Index. The purpose is not to produce its own scores. Provides analysis of both years with graphs and charts.
o Visuals: Two notable visuals: 1) A three dimension-style map of the bay with a stacked bar graph
of modeled estimates of total nitrogen loads next to each reporting region.
2) Graphical representation of Best Management Practices undertaken around the bay, divided by land use. With description of the practice and labels within the graphic showing the effect.
o Map: Aforementioned map of Bay overlaid with nutrient load data. o Format: 4 pages. Newsletter format. 5 subsections, allowing one page for
major topics. o Methodology: No methodology explanation. Not needed, as this is a
comparison analysis, not piece by piece grading.
Technical Committee
Compiled Meeting Notes 39
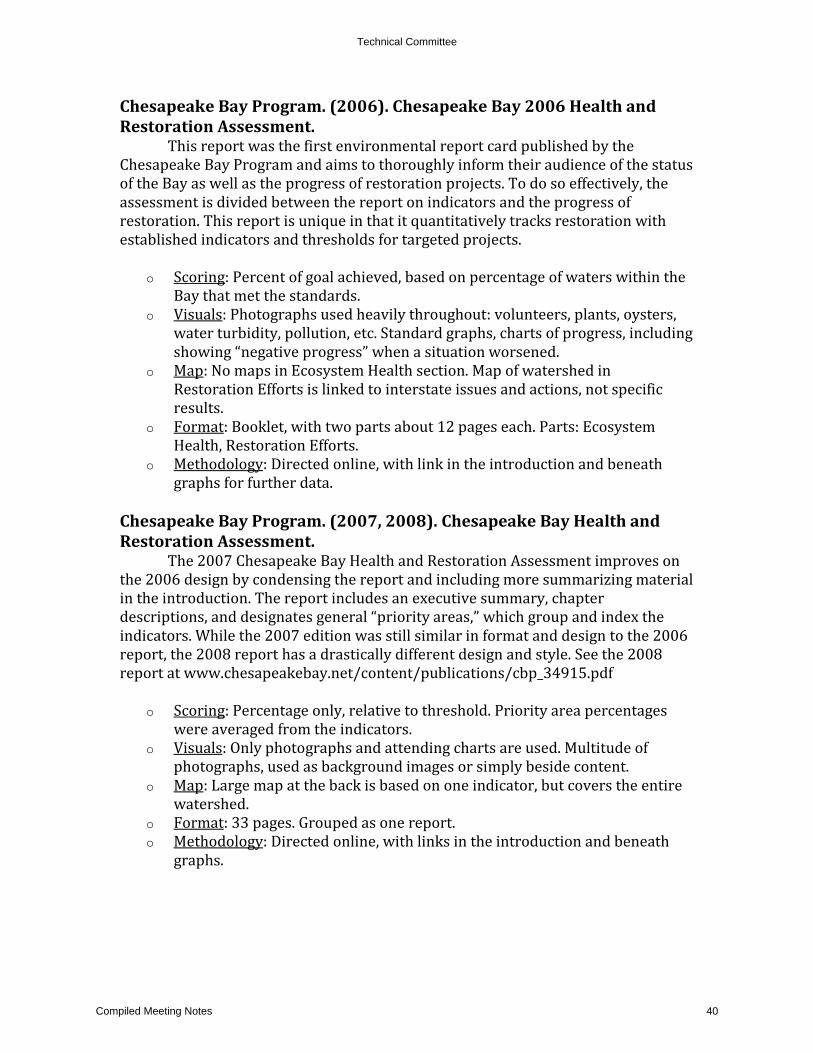
Chesapeake Bay Program. (2006). Chesapeake Bay 2006 Health and Restoration Assessment. This report was the first environmental report card published by the Chesapeake Bay Program and aims to thoroughly inform their audience of the status of the Bay as well as the progress of restoration projects. To do so effectively, the assessment is divided between the report on indicators and the progress of restoration. This report is unique in that it quantitatively tracks restoration with established indicators and thresholds for targeted projects.
o Scoring: Percent of goal achieved, based on percentage of waters within the Bay that met the standards.
o Visuals: Photographs used heavily throughout: volunteers, plants, oysters, water turbidity, pollution, etc. Standard graphs, charts of progress, including showing “negative progress” when a situation worsened.
o Map: No maps in Ecosystem Health section. Map of watershed in Restoration Efforts is linked to interstate issues and actions, not specific results.
o Format: Booklet, with two parts about 12 pages each. Parts: Ecosystem Health, Restoration Efforts.
o Methodology: Directed online, with link in the introduction and beneath graphs for further data.
Chesapeake Bay Program. (2007, 2008). Chesapeake Bay Health and Restoration Assessment.
The 2007 Chesapeake Bay Health and Restoration Assessment improves on the 2006 design by condensing the report and including more summarizing material in the introduction. The report includes an executive summary, chapter descriptions, and designates general “priority areas,” which group and index the indicators. While the 2007 edition was still similar in format and design to the 2006 report, the 2008 report has a drastically different design and style. See the 2008 report at www.chesapeakebay.net/content/publications/cbp_34915.pdf
o Scoring: Percentage only, relative to threshold. Priority area percentages
were averaged from the indicators. o Visuals: Only photographs and attending charts are used. Multitude of
photographs, used as background images or simply beside content. o Map: Large map at the back is based on one indicator, but covers the entire
watershed. o Format: 33 pages. Grouped as one report. o Methodology: Directed online, with links in the introduction and beneath
graphs.
Technical Committee
Compiled Meeting Notes 40

Ecosystem Health Monitoring Program (EHMP). (2011). 2011 Report Card for the waterways and catchments of South East Queensland. After 6 years of more thorough printed publications, such as the 2008 report card, EHMP switched to a shortened printed format. This summary report includes maps with the annual grades for each waterway and catchment, plus a special two-page segment on the impact of a flood event during the year. This is illustrated with excellent visual graphics of the stages of a flood and its effects on both freshwater and estuarine environments. Since the flood event would have undoubtedly had effects on various indicators, it makes the detailed information on the flooding extremely relevant. The report takes advantage of online technology to integrate explanations, full scoring breakdowns, and visual graphics for each catchment or waterway without printing exhaustive amount of data.
o Scoring: Grades based on indexed scores of percentage times a threshold was met.
o Visuals: Excellent visual graphics used for describing effects of the flood. Computer generated images of freshwater model and estuarine/marine model with symbols, yet the image was not overcrowded with the symbols or graphics.
o Maps: Two maps: freshwater and estuarine/marine of entire areas monitored. Each site result was offset from the map, with score and salient details of changes.
o Format: 6 pages. Newsletter format. o Methodology: No scientific explanation of methodology within this
publication, but a simplified explanation of the scores and basic tests was provided in a column next to the maps. Explained scale of grades, indicators used, and the organization’s history of monitoring.
Carruthers, T., S. Carter, L. Florkowski, J. Runde, and W. Dennison. 2009. Rock Creek Park natural resource condition assessment, National Capital Region Network. Natural Resource Report NPS/NCRN/NRR—2009/109. National Park Service, Fort Collins, Colorado.
This lengthy report is unique in its thoroughness and the amount of technical data printed within the publication. It also differs by expanding on the use of indicators and measurements of restoration objectives, to include measurement of a variety of the natural resources against thresholds. This report is notable for the array of elements studied, including environmental factors such as soils, artificial terrestrial habitat, and air quality. The report examines the natural resources and habitats present in the park, current and potential stressors, and metrics and thresholds before finally presenting its equivalent of an environmental health report card. o Scoring: Thresholds for resources and stressors. In the Resource Condition
Assessment chapter, metrics are judged by percent of times reaching the
Technical Committee
Compiled Meeting Notes 41

measured attainment of a threshold along a verbal scale from “very degraded” to “very good.”
o Format: 133 pages with appendices; 90 without appendices. o Visuals: Photographs throughout: historical, context of park relative to city,
park users, vegetation, animals, and researchers. Small cartoon-style graphics representing metrics or indicators. Similar graphics represent the habitat and its components.
o Maps: Used frequently, for overview of resources, habitats, and resource assessment, among others.
o Methodology: Within the “Resource Condition Assessment” chapter is a section devoted to methods for selecting indicators, thresholds, and measuring indicators.
Chester River Association. (2008). 2007 Chester River Report Card.
The Chester River Report Card is a river-specific ecosystem health report card with similar, if not identical attributes to the Patuxent River Report Card and other report cards affiliated with the Chesapeake Bay Program. There are four concise analyses within the short newsletter-style report, framed by the introduction and methodology. As with the Patuxent River report, it balances data analysis with analysis of major factors affecting the indicator scores. Uniquely, it shows scores for each test point, which helps give an idea of how the grade could change within the ecosystem.
o Scoring: Grades based on indexed scores of percentage times a threshold was met. 5 indicators for creeks and 6 for tidal regions. Indicator scores are based on frequency meeting the target level, then averaged to produce overall index score.
o Visuals: A few small photographs including an aerial view of the river. Graphs and charts with attending maps used in the analysis. Graphical representation of the watershed highlighting major land uses and other factors impacting the river.
o Map: Main map of river on front page with creek and estuary scores prominent. Scores at each test point within the map, then aggregate “regional” and “watershed” grades are offset. Color scale red to green is very effective, as well as time-series graphs for comparison.
o Format: 4 pages. Newsletter structure. First page provides an overview of the sub-regional scores, then four smaller articles over two pages focus on selected aspects of the results. The last page is dedicated to explaining how grades are calculated, opportunities for support and attributing authorship.
o Methodology: Explanation is presented as a flowchart and with a corresponding paragraph. Readers are directed to online resource for more thorough information.
Technical Committee
Compiled Meeting Notes 42

Notes, 2nd Reviving River Technical Committee Meeting Sonoran Institute, 44 E. Broadway Blvd., Tucson 85701 October 22, 2012 10 – 12:00 am 1. Welcome, Introductions & Approval of the minutes—Emily Brott, Sonoran
Institute welcomed participants and we did a round of introductions. • Technical Committee Members Attending: Patti Spindler (via telephone) –
Arizona Department of Environmental Quality (ADEQ); Jennifer Duan – University Of Arizona (UA); Juliet Stromberg (via teleconference)– Arizona State University (ASU); Kendall Kroesen – Tucson Audubon Society (TAS); Akitsu Kimoto – Pima County Regional Flood Control District (PCRFCD); James Dubois – Pima County Regional Wastewater Reclamation Department (PCRWRD); Brian Powell – Pima County Office of Conservation Science (PCOCS)
• Others Attending: Jason Jones (via telephone), ADEQ; Ed Curley, PCRWRD; Evan Canfield, PCRFCD; Julia Fonseca, PCOCS; Claire Zugmeyer, Sonoran Institute.
• Emily Brott had met with Technical Committee member Robert Webb – US
Geological Survey (USGS) on Friday October 19, 2012 to update him on what would be discussed and get his feedback to share with the group.
• Notes from the first Reviving River Technical Committee Meeting on
September 18, 2012 were approved. a. Motion to approve – Brian b. Seconded - ?
2. Upper Santa Cruz River Example—Claire Zugmeyer, Sonoran Institute, gave a
presentation about the Upper Santa Cruz River project that developed an annual river health assessment tool. This report series, the Living River, was produced three years in a row to track and communicate the health of a stretch of the Santa Cruz River between Rio Rico and Amado. She described the development process which included a Science Advisory Committee who helped select the indicators of river health and the evaluation process.
• Handout: series of handouts illustrating the process used by the Science Advisory Committee for the Living River series – the brainstorm, data being collected, possible evaluation process
• Presentation Questions: Julia – how was this report series used?
o Claire – primarily for outreach to public, managers, research community etc.
Technical Committee
Compiled Meeting Notes 43

o Emily – this series has also led to EPA’s encouragement of local groups applying for funding to develop a Water Quality Improvement Plan
Brian – Is data still being collected? o Claire - Yes, there is still data being collected by several of
the groups. We have just lacked funding to produce the annual report.
o Emily – we are continuing to look for funding and thinking of ways to reduce costs, such as online only, or to fundraise for the reports in groups of 3, rather than one year at a time.
Julie – what monitoring data was used and who collected it. o Claire – Friends of the Santa Cruz River is one of the main
sources of water quality data, though many others have data as well (see page two in handouts that accompanied the presentation).
3. Adapting to the Lower Santa Cruz Context—Evan Canfield, PCRFCD gave a
presentation discussing various Pima County efforts and how the Reviving River project fits in with those. There was also a discussion of the differences between the Living River and Reviving River projects.
• Questions: Jennifer: Is the historical conditions report complete?
o Evan: large parts of the report are written and we will have it complete by January.
Patti: Can you tell us more about the annual report and the time commitment. o Emily: All of the work from the TC will be completed within our
meetings. [Sonoran Institute will be writing the report and will likely request the TC to review the final draft, which won’t be for at least a year]
Julie: Has there been effort to divide the river into different reach types? o Evan: The Historical Conditions Report has broken the river into 7
reaches for the channel morphology section General discussion regarding the Quality Assurance Project Plan (QAPP)
that Pima County needs to submit to the EPA. Pima County may ask for feedback on parameters to include in a larger monitoring effort, though the TC will mainly be involved with selecting indicators for the annual report. o Jim – would appreciate having feedback from TC about monitoring
locations o Evan – if we want to include data, we need to put it in our QAPP and
share it with the EPA [reason for request of initial feedback on monitoring ideas in the first meeting. PC wanted to ensure that data being collected this fall will be approved by the EPA.]
[Break]
Technical Committee
Compiled Meeting Notes 44

4. Brainstorm – Universe of Indicators—Emily and Claire led a quick 20 min brainstorm to begin discussing what indicators are important for monitoring of wetland condition. This brainstorm/discussion will continue at the next meeting when we have additional TC members. Preliminary list in order discussed included: • Nutrients • Nitrogen species • Phosphorus
o Soluble reactive phosphorus • Ammonia is key issue for nitrogen but also for toxicity for fish • Dissolved oxygen – diel monitoring, varies with time of day • Repeated channel cross-sections • Geometry of the ground water mound • Baseflow bed and bank Erosion rates • Suspended sediments and dissolved solids
o Major cations and anions • Odor • Suds • Turbidity • Number of scouring floods • Daily fluctuation in discharge – variability with effluent discharge over 3-day and
even weekly period • Quantity of Inputs – total effluent, stormwater, any other inflows or diversions
(water in and water out) • Base area that is wet and dry on a daily basis • Soil moisture on the bank surface and riparian zones • Measured Infiltration rates rather than calculated – important for clogging layer • Overall infiltration rate • Flow extent, length of flow • Thickness of clogging layer across transects (using mm ruler) • Pebble counts to give a sense of fine sediments • Soil collection/analysis to understand percent clay and silts • Cover of obligate and facultative wetland plant species • Wetland indicator score - packet of related indicators • Riparian tree species – age and size class structure (get at recruitment and
mortality) • Bird indicator of some sort (maybe using point counts)
o Obligate riparian/wetland birds o Classify birds regarding fidelity to water o Bird diversity o Jennie MacFarland could share what current monitoring is being done on
the river • Abundance of different structure types – forest, woodland, marshlands etc.
Technical Committee
Compiled Meeting Notes 45
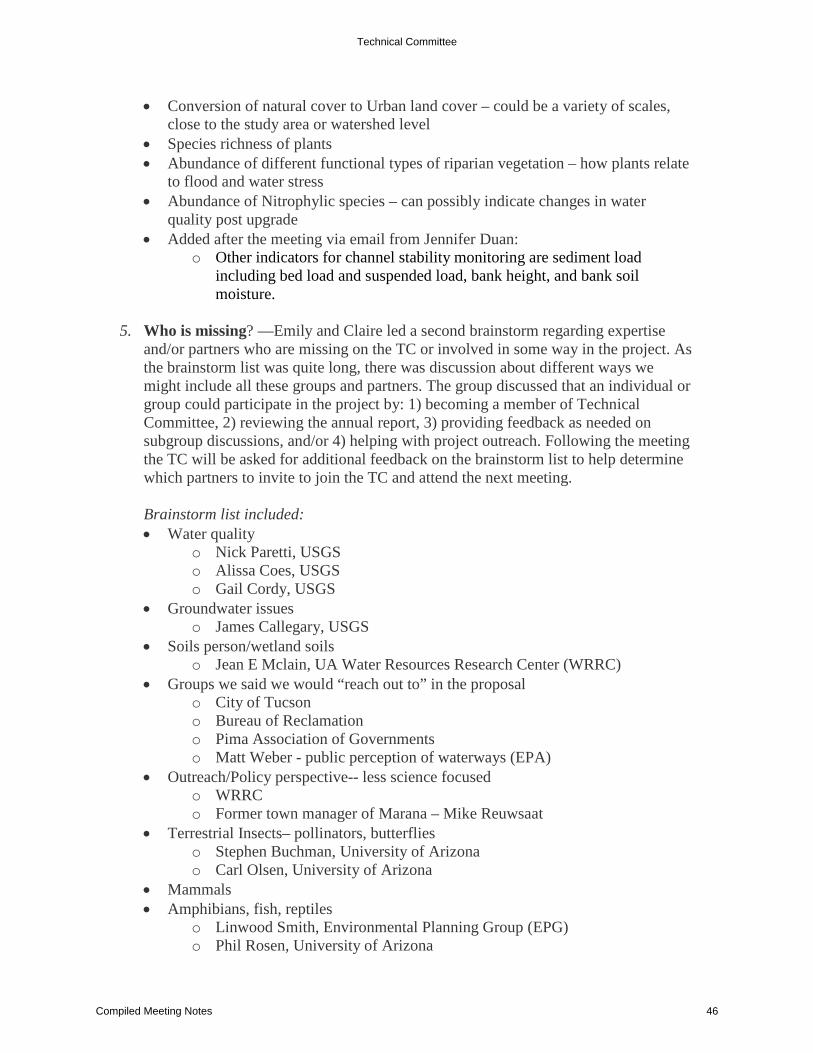
• Conversion of natural cover to Urban land cover – could be a variety of scales, close to the study area or watershed level
• Species richness of plants • Abundance of different functional types of riparian vegetation – how plants relate
to flood and water stress • Abundance of Nitrophylic species – can possibly indicate changes in water
quality post upgrade • Added after the meeting via email from Jennifer Duan:
o Other indicators for channel stability monitoring are sediment load including bed load and suspended load, bank height, and bank soil moisture.
5. Who is missing? —Emily and Claire led a second brainstorm regarding expertise
and/or partners who are missing on the TC or involved in some way in the project. As the brainstorm list was quite long, there was discussion about different ways we might include all these groups and partners. The group discussed that an individual or group could participate in the project by: 1) becoming a member of Technical Committee, 2) reviewing the annual report, 3) providing feedback as needed on subgroup discussions, and/or 4) helping with project outreach. Following the meeting the TC will be asked for additional feedback on the brainstorm list to help determine which partners to invite to join the TC and attend the next meeting.
Brainstorm list included: • Water quality
o Nick Paretti, USGS o Alissa Coes, USGS o Gail Cordy, USGS
• Groundwater issues o James Callegary, USGS
• Soils person/wetland soils o Jean E Mclain, UA Water Resources Research Center (WRRC)
• Groups we said we would “reach out to” in the proposal o City of Tucson o Bureau of Reclamation o Pima Association of Governments o Matt Weber - public perception of waterways (EPA)
• Outreach/Policy perspective-- less science focused o WRRC o Former town manager of Marana – Mike Reuwsaat
• Terrestrial Insects– pollinators, butterflies o Stephen Buchman, University of Arizona o Carl Olsen, University of Arizona
• Mammals • Amphibians, fish, reptiles
o Linwood Smith, Environmental Planning Group (EPG) o Phil Rosen, University of Arizona
Technical Committee
Compiled Meeting Notes 46

• Nonprofit or professor who uses the river in their classes o Michael Rosenzweig, University of Arizona o Dave Walker, University of Arizona
• Cultural/Social Issues o Friends of Tucson’s Birthplace—Roger Pfeuffer, Jonathan Mabry o Archaeology Southwest. o Neighborhood Associations around the river study area
• Natural Resource Issues o The Nature Conservancy—Jeanmarie Haney, Dale Turner o Tucson Parks and Recreation o Pima County-linear Parks along the River
• Agriculture/farming issues o Herb Kai o BKW Farms o Native Seeds Search
6. Next Agenda/Date—Emily announced the date and time for the next meeting as Wednesday November 28, 2012 10-noon. Once we have invited additional TC members, we will send out a doodle poll to determine the possibility of a December meeting.
Technical Committee
Compiled Meeting Notes 47
Notes, 3rd Reviving River Technical Committee Meeting Sonoran Institute, 44 E. Broadway Blvd., Tucson 85701 November 28, 2012 10 – 12:00 am 1. Welcome, Introductions & Approval of the minutes—Emily Brott, Sonoran
Institute welcomed new members of the Technical Committee and we did a round of introductions.
• Technical Committee Members Attending: Patti Spindler (via telephone) –
Arizona Department of Environmental Quality (ADEQ); Jennifer Duan – University Of Arizona (UA); James Dubois – Pima County Regional Wastewater Reclamation Department (PCRWRD); Eric Holler – Bureau of Reclamation; Kendall Kroesen – Tucson Audubon Society (TAS); Akitsu Kimoto – Pima County Regional Flood Control District (PCRFCD); Michael Liberti – Tucson Water; Jean McLain – University of Arizona; Brian Powell – Pima County Office of Conservation Science (PCOCS); Linwood Smith – ecological consultant; Bob Webb – US Geological Survey; Claire Zucker – Pima Association of Governments
• Others Attending: Nathan Lehman – Bureau of Reclamation; Ed Curley, PCRWRD; Evan Canfield, PCRFCD; Julia Fonseca, PCOCS; Claire Zugmeyer, Sonoran Institute.
• Updates/Announcements:
a. At the last meeting we had a brainstorm of additional partners/expertise that was needed on the Technical Committee (first two meetings were with partners who had written a letter of support for the grant proposal). With feedback from a survey of whom to invite, we added 5 new members and 1 alternate.
b. Pima County’s Quality Assurance Project Plan for the project was approved.
c. Several subgroups have met to discuss in more detail different methodologies for tracking wetland condition.
d. Emily met with Julie Stromberg on November 26 and noted that she expressed interest in a field trip to the project reach.
• Notes from the second Reviving River Technical Committee Meeting on
October 22, 2012 were approved. a. Motion to approve – Brian b. Seconded - Jim
Technical Committee
Compiled Meeting Notes 48

2. Brainstorm: Universe of Indicators—We reviewed the EPA definition of wetlands; many people imagine wetlands to be swampy areas. The EPA definition is quite broad and includes ephemeral and riparian areas in the arid west. We then reviewed the brainstorm from the October meeting and added additional ideas and indicators.
• Handout: EPA definition of Wetlands; list of indicators brainstormed during the October meeting.
• Additional Brainstorm items in order discussed: • Stormwater flows • Storm water events
o Impact on water quality physical factors “critters”
o Fire flow events • Tributary areas need to be monitored • Macroinvertebrates • Stream channel substrates • Aquatic biology • Algae
o Chlorophyll A as indicator of clogging layer o By periphyton or phytoplankton o Taxa counts by order which will give you blue green vs green algae
• Macroinvertebrates - Index of Biological Integrity (IBI index) o Densities o Diversity indices o % midges o % worms o % dominant taxon o % non insects o % mayflies, stone flies o Taxa richness o Presence of blood midges
• Presence or absence of fish • Biological stressors like crayfish, bullfrogs • Sediment quality/size
o Fine vs coarse gravel • Organic carbon (total organic carbon) • Mechanical properties of clogging layer (cohesion)
o Pre and post scouring floods • Total organic carbon loading from effluent being discharged into the river
(should decrease over time) • Endocrine distrupters • Caffeine • Pharmaceuticals • Add indicators from first meeting • Pesticide inputs
Technical Committee
Compiled Meeting Notes 49

• Terrestrial animals o Amphibians o Mammals o Herps o Birds – Tucson Audubon’s Important Bird Area program collects
transect data in the study area and Tucson bird count data (annual bird count data from randomly distributed locations) If extend project area NW to Simpson farm area, there is
additional data Focus on wetland obligate species (may reflect changes in
wetland quality better than terrestrial birds) o Flying insects (may be impacted by water quantity and rate of
infiltration if water isn’t flowing as far downstream) • Human landuse
o Landfill – was moved, but there could be remnant impacts o Effects of agriculture pesticides
• Socioeconomic effects o Community development may increase o Change in property values o May stimulate economic development/use of area o Housing development o Change in construction activity
• Town of Marana landuse plan looked at archaeology and recreational use • Cultural resources • Wildlife corridor – animals both large and small attracted to the area • Homeless communities • Human perception of the area • Wildcat dumping • % exotics • # of changes in the plant community • # of plant community types • Recreation: bike use, trip counts on river parks • Canopy metrics • Vegetation characteristics • Maximum canopy height • Leaf area index • Habitat measures in addition to physical factors
o Embededness (e.g. space for macros) o % macrophyte cover o % algae cover o Visual habitat assessment o % riffle/run/pool o Rosgen channel type (quick mental picture of channel type)
Technical Committee
Compiled Meeting Notes 50
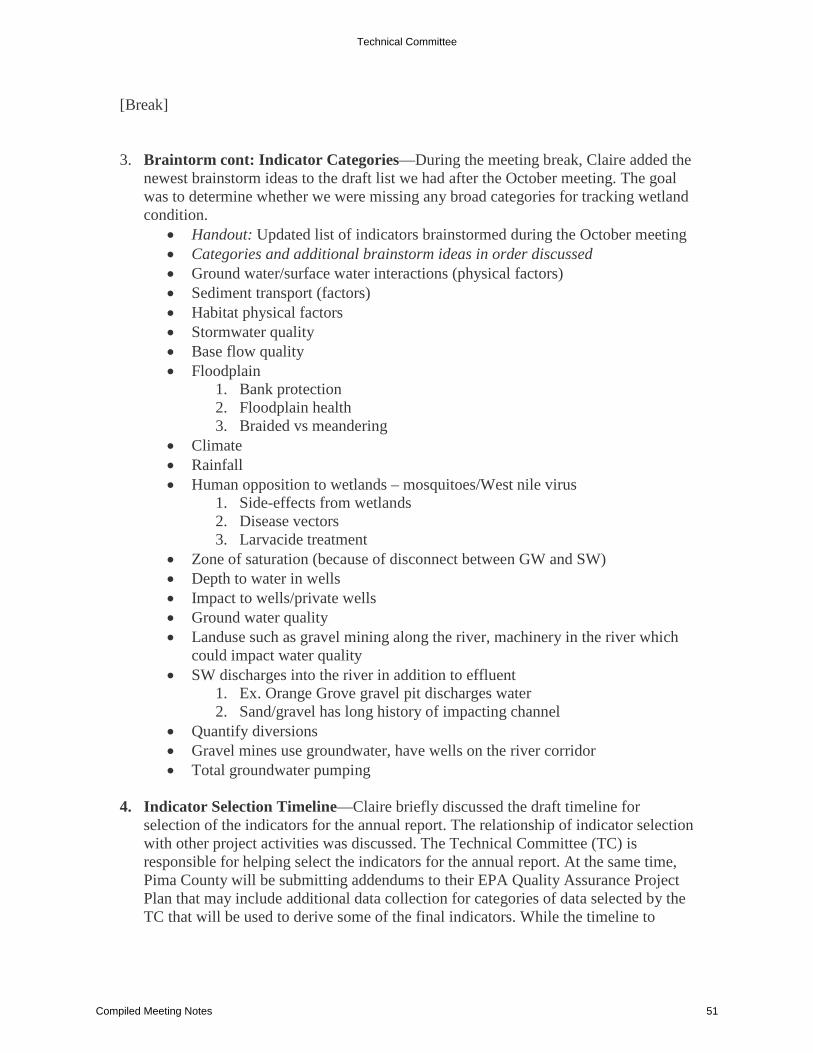
[Break]
3. Braintorm cont: Indicator Categories—During the meeting break, Claire added the
newest brainstorm ideas to the draft list we had after the October meeting. The goal was to determine whether we were missing any broad categories for tracking wetland condition.
• Handout: Updated list of indicators brainstormed during the October meeting • Categories and additional brainstorm ideas in order discussed • Ground water/surface water interactions (physical factors) • Sediment transport (factors) • Habitat physical factors • Stormwater quality • Base flow quality • Floodplain
1. Bank protection 2. Floodplain health 3. Braided vs meandering
• Climate • Rainfall • Human opposition to wetlands – mosquitoes/West nile virus
1. Side-effects from wetlands 2. Disease vectors 3. Larvacide treatment
• Zone of saturation (because of disconnect between GW and SW) • Depth to water in wells • Impact to wells/private wells • Ground water quality • Landuse such as gravel mining along the river, machinery in the river which
could impact water quality • SW discharges into the river in addition to effluent
1. Ex. Orange Grove gravel pit discharges water 2. Sand/gravel has long history of impacting channel
• Quantify diversions • Gravel mines use groundwater, have wells on the river corridor • Total groundwater pumping
4. Indicator Selection Timeline—Claire briefly discussed the draft timeline for selection of the indicators for the annual report. The relationship of indicator selection with other project activities was discussed. The Technical Committee (TC) is responsible for helping select the indicators for the annual report. At the same time, Pima County will be submitting addendums to their EPA Quality Assurance Project Plan that may include additional data collection for categories of data selected by the TC that will be used to derive some of the final indicators. While the timeline to
Technical Committee
Compiled Meeting Notes 51

submit the QAPP impacts the selection process, the TC is not responsible for writing or reviewing this document.
• Handout: draft timeline
5. Next Agenda/Date—Emily announced the date and time for the next meeting as
Thursday December 13, 2012 9-noon.
Technical Committee
Compiled Meeting Notes 52

Agenda-Reviving River Technical Committee Meeting Wednesday, November 28nd 2012
Sonoran Institute, 44 East Broadway Boulevard, Suite 350 9:30-10 am light breakfast; 10 am – 12 pm meeting
1. Updates, Introductions, Approval of Minutes—Emily Brott, Sonoran Institute, Facilitator
(10 – 10:25 am)
2. Brainstorm: Universe of Indicators (10:25 – 11:00) a. Review EPA’s wetland definition and project goal b. What do we measure? (continue brainstorm from October 22nd)
Break (15 min) 3. Brainstorm cont: Indicator Categories (11:15-11:35)
a. Review of broad categories and gaps identified
4. Indicator selection timeline (11:35 – 11:50)
5. Next Agenda items & Date: December 13, 2012 9am – 12 pm Adjourn at 12 pm
Technical Committee
Compiled Meeting Notes 53

EPA Wetlands Definitions (from: http://water.epa.gov/lawsregs/guidance/wetlands/definitions.cfm) “Generally, wetlands are lands where saturation with water is the dominant factor determining the nature of soil development and the types of plant and animal communities living in the soil and on its surface (Cowardin, December 1979). Wetlands vary widely because of regional and local differences in soils, topography, climate, hydrology, water chemistry, vegetation, and other factors, including human disturbance. Indeed, wetlands are found from the tundra to the tropics and on every continent except Antarctica.
For regulatory purposes under the Clean Water Act, the term wetlands means "those areas that are inundated or saturated by surface or groundwater at a frequency and duration sufficient to support, and that under normal circumstances do support, a prevalence of vegetation typically adapted for life in saturated soil conditions. Wetlands generally include swamps, marshes, bogs and similar areas."
[taken from the EPA Regulations listed at 40 CFR 230.3(t)]”
What Are Wetlands? (from: http://water.epa.gov/type/wetlands/what.cfm) Wetlands are areas where water covers the soil, or is present either at or near the surface of the soil all year or for varying periods of time during the year, including during the growing season. Water saturation (hydrology) largely determines how the soil develops and the types of plant and animal communities living in and on the soil. Wetlands may support both aquatic and terrestrial species. The prolonged presence of water creates conditions that favor the growth of specially adapted plants (hydrophytes) and promote the development of characteristic wetland (hydric) soils. Wetlands vary widely because of regional and local differences in soils, topography, climate, hydrology, water chemistry, vegetation, and other factors, including human disturbance. Indeed, wetlands are found from the tundra to the tropics and on every continent except Antarctica. Two general categories of wetlands are recognized: coastal or tidal wetlands and inland or non-tidal wetlands. Non-Tidal wetlands are most common on floodplains along rivers and streams (riparian wetlands), in isolated depressions surrounded by dry land (for example, playas, basins, and "potholes"), along the margins of lakes and ponds, and in other low-lying areas where the groundwater intercepts the soil surface or where precipitation sufficiently saturates the soil (vernal pools and bogs). Inland wetlands include marshes and wet meadows dominated by herbaceous plants, swamps dominated by shrubs, and wooded swamps dominated by trees.
Certain types of inland wetlands are common to particular regions of the country:
• bogs and fens of the northeastern and north-central states and Alaska • wet meadows or wet prairies in the Midwest • inland saline and alkaline marshes and riparian wetlands of the arid and semiarid west • prairie potholes of Iowa, Minnesota and the Dakotas • alpine meadows of the west • playa lakes of the southwest and Great Plains • bottomland hardwood swamps of the south • pocosins and Carolina Bays of the southeast coastal states • tundra wetlands of Alaska.
Many of these wetlands are seasonal (they are dry one or more seasons every year), and, particularly in the arid and semiarid West, may be wet only periodically. The quantity of water present and the timing of its presence in part determine the functions of a wetland and its role in the environment. Even wetlands that appear dry at times for significant parts of the year -- such as vernal pools-- often provide critical habitat for wildlife adapted to breeding exclusively in these areas.
Technical Committee
Compiled Meeting Notes 54

Standard Water Chemistry Measures Approved by EPA in the project’s Quality Assurance Project Plan Table 4 Parameters Measured for Water Quality Parameter Measurement Location Field Parameters: • Temperature • pH • Dissolved Oxygen • Electrical Conductivity
Field
Treatment Performance: • Biological Oxygen Demand • Total Suspended Solids
RWRD Lab
Microbiology • E-Coli
RWRD Lab
Nutrients • Ammonia • Total Kjehldahl Nitrogen • Nitrate + Nitirite • Phosphorus
RWRD Lab
Metals • Arsenic • Cadmium • Chromium • Copper • Lead • Mercury • Selenium • Zinc
RWRD Lab
Organic Compounds • EPA methods 608, 8260B, 8270C
RWRD Lab
Technical Committee
Compiled Meeting Notes 55

Water Quality
• Nutrients • Nitrogen • Phosphorus
o Soluble reactive phosphorus • Ammonia (toxic for fish) • Dissolved oxygen • Suds • Turbidity • Suspended sediments and dissolved solids
o Major cations and anions • Odor
Groundwater
• Geometry of the ground water mound
Surface Water Quantity • Daily fluctuation effluent discharge – variability over 3-day or
week • Quantity of Inputs – total effluent, stormwater, any inflows or
diversions • Daily base area wet/dry • Flow extent
Physical Factors
• Repeated channel cross-sections • Baseflow bed and bank erosion rates • Number of scouring floods • Soil moisture on the bank surface and riparian zones • Measured Infiltration rates rather than calculated – important
for clogging layer • Overall infiltration rate • Thickness of clogging layer across transects (using mm ruler) • Pebble counts to give a sense of fine sediments • Soil collection/analysis to understand percent clay and silts
Human/Social Factors
• Odor • Land Cover Conversion of natural cover to Urban land cover –
could be a variety of scales, close to the study area or watershed level
Wetland/Riparian Vegetation • Cover of obligate and facultative wetland plant species • Wetland indicator score - packet of related indicators • Riparian tree species – age and size class structure (get at
recruitment and mortality) • Abundance of structure types – forest, woodland, marshlands • Species richness of plants • Abundance of functional types • Abundance of Nitrophylic species
Terrestrial Animals
• Bird indicator of some sort (maybe using point counts) o Obligate riparian/wetland birds o Classify birds regarding fidelity to water o Bird diversity
Technical Committee
Compiled Meeting Notes 56

"Reviving River" EPA Wetlands Project ‐ Timeline for 2013 Water Year (prepared for TC Meeting November 28, 2012)
Technical Committee Work October November December January February March April May June July August SeptemberIndicator Selection Process for Annual Report
Brainstorm/discuss Wetland IndicatorsFirst "draft" of Indicators
Determine Indicator StandardsFinalize Selection of Indicators
Discuss evaluation of Indicators/Report format
Associated Project WorkData Collection for Wetland Monitoring
Standard water chemistry (4 sites)*What else to sample?
eg. Macroinvertebrates?**eg. Wetland Vegetation?**
Other Indicators?**
ReportsHistorical Conditions Report
Addendum to EPA Quality Assurance Project Plan (QAPP) ‐ data collection in addition to water quality
Indicator Selection Process Report
*Already approved under first submittal of QAPP in September 2012**Will require an approved addendum to QAPP before data collection can occur
2013 Water Year
what/when/where to sample?what/when/where to sample?
what/when/where to sample?
Technical Committee
Compiled Meeting Notes 57

Agenda-Reviving River Technical Committee Meeting Thursday, December 13, 2012
Sonoran Institute, 44 East Broadway Boulevard, Suite 350 8:45 – 9:00 light refreshments; 9:00 – 12 pm meeting
1. Updates, Introductions, Approval of Minutes—Emily Brott, Sonoran Institute,
Facilitator (9:00 am – 9:20 am)
2. Results of the Category Survey (9:20 – 9:40) 3. Category Survey Discussion (9:40 – 10:40)
a. Select top category choices b. Eliminate categories
Break (15 min)
4. Category Survey Discussion cont: “Big Bin” categories (10:55 – 11:25)
a. Are we missing anything?
5. Existing Data Discussion (11:25 – 11:35)
6. Next Steps (11:35-12:00) a. Subcommittees, field trips b. Meeting Date: January XX, 2013 TBD (doodle poll coming soon)
Adjourn at 12 pm
Technical Committee
Compiled Meeting Notes 58

Category Survey List 2. Water quality - Nutrients Such as:Total kjedahl nitrogen, Nitrate, Nitrite, Ammonia, Phosphorus, Soluble reactive phosphorus
3. Water quality - Organic Constituents Such as: Biological oxygen demand, Total organic carbon (also, TOC loading from effluent), E. coli, Volatile and semi-volatile safe drinking water constituents
4. Water quality - Inorganics Such as: Metals (copper lead, zinc, mercury, selenium, arsenic, cadmum, chromium), Alkalinity, Hardness, Major cations and anions
5. Water quality - Agriculture Runoff Such as: Herbicides, Pesticide inputs
6. Water quality - Emerging Contaminants Such as: Endocrine disruptors, Caffeine, Pharmaceuticals 7. Water quality - Standard Measures Such as: pH, Temperature, Conductivity, Dissolved oxygen
8. Water quality - physical properties Such as: Turbidity, Suspended sediments/solids, Total Dissolved solids
9. Water quality - Other Such as: Chlorine, Odor, Suds 10. Groundwater - Depth to/Presence Such as: Geometry of the ground water mound, Groundwater wells, Perched aquifers, Private wells (impact) 11. Groundwater - Quality Such as: water chemistry/quality of groundwater 12. Groundwater - Use Such as: Total groundwater pumping, Gravel Mines use of groundwater (have wells on the river corridor) 13. Surface Water Quantity - inputs/removals Such as:Daily fluctuation effluent discharge - variability over 3-day or week; other discharges into the river (Ex Orange grove gravel pit discharges water, sand/gravel has long history of impacting river); Quantify diversions 14. Surface Water Quantity - Extent Such as: Daily base area wet/dry, Flow extent 15. Surface Water Quantity - Stormwater flows 16. Physical - Sediment Transport Such as: Fine particles in urban runoff/storm water (less than 64 microns);Morphological change in sands and gravel; Baseflow bed and bank erosion rates; Fire flow events/impacts; properties of cohesion both pre/post scouring floods 17. Physical - Channel Morphology Such as: Repeated channel cross-sections; Soil moisture on the bank surface and riparian zones; Number of scouring floods; Pebble counts to give a sense of fine sediments; Soil collection/analysis to understand percent clay and silts; Stream channel substrates; Sediment quality/size (ex. fine vs coarse gravel); Rosgen channel type (quick mental picture of channel type) 18. Physical - Groundwater/Surface Water interaction Such as: Measured Infiltration rates rather than calculated - important for clogging layer; Overall infiltration rate; Thickness of clogging layer across transects (using mm ruler); properties of clogging layer both pre/post scouring floods; Zone of saturation(because disconnect of GW and SW) 19. Physical - Floodplain Function Such as: bank protection; floodplain health; braiding vs meandering
Technical Committee
Compiled Meeting Notes 59

20. Physical - Aquatic Habitat Such as: Embededness ex space for macros; Visual habitat assessment; % riffle/run/pool 21. Wetland Vegetation - Species Composition Such as: Cover of obligate and facultative wetland plant species; Species richness of plants; Abundance of Nitrophylic species; % exotics; # of plant community types; % macrophyte cover; % algae cover; %blue green algae vs. green 22. Wetland Vegetation - Structure/Function Such as: Abundance of structure types - forest, woodland, marshlands; Riparian tree species - age and size class structure (get at recruitment and mortality); # of changes in the plant community; Abundance of functional types ; Canopy metrics; Maximum canopy height; Leaf area index 23. Wetland Vegetation - Other Such as: Wetland indicator score - packet of related indicators 24. Terrestrial Animals - Birds Such as: Obligate riparian/wetland birds; Classify birds regarding fidelity to water; Bird diversity 25. Terrestrial Animals – Mammals 26. Terrestrial Animals – Amphibians 27. Terrestrial Animals – Herpetofauna 28. Terrestrial Animals - Flying Insects 29. Aquatic Animals - Macroinvertebrates Such as: Densities; Diversity indices; % midges; % worms; % dominant taxon; % non insects; % mayflies; stone flies; Taxa richness; Presence of blood midges 30. Aquatic Animals - Fish Such as: Presence/absence 31. Aquatic Animals - Biological Stressors Such as: crayfish; bullfrogs 32. Human/Social - Landuse Such as: Land Cover Conversion (natural to Urban - several scales); Human landuse (ex. old landfills, agriculture); Homeless communities; Wildcat dumping; Landuse such as gravel mining along the river, machinery in the river which could impact water quality; Stormwater Flows (an impact on water quality, physical, and animals) 33. Human/Social - Recreation Such as: Recreation: bike use, trip counts on river parks; Birdwatching - increased number of bird lists submitted to eBird and/or increased number of rare birds post improvements and thus increased number of postings to birding listserv 34. Human/Social - Socioeconomic Such as: Community development may increase; Change in property values; May stimulate economic development/use of area; Housing development; Change in construction activity 35. Human/Social - Perception Such as: Human perception of the area; Human opposition to wetlands (mosquitos/west nile/disease vectors/side-effects); Odor 36. Human/Social - Heritage Such as: Cultural resources 37. Other Such as: a category of data or indicator you feel is not represented by any of the above
Technical Committee
Compiled Meeting Notes 60

Reviving River ‐ Ranked Category Survey Results, Prepared for December 13, 2012 TC meeting
Rank Survey Category/Subcategory Description (Data collected or available) Yes No Did not respond Total
1 29 Aquatic Animals ‐ MacroinvertebratesSuch as: Densities; Diversity; % midges; % worms; % dominant taxon; % non insects; % mayflies; stone flies; Taxa richness; blood midges presence 10 0 3 13
2 2 Water quality ‐ NutrientsSuch as:Total kjedahl nitrogen, Nitrate, Nitrite, Ammonia, Phosphorus, Soluble reactive phosphorus 9 1 3 13
3 17 Physical ‐ Channel Morphology
Such as: Repeated channel cross‐sections; Soil moisture ‐ bank surface and riparian zones; Number of scouring floods; Pebble counts; Soil collection/analysis to understand % clay and silt; Stream channel substrates; Sediment quality/size (ex. fine vs coarse gravel); Rosgen channel type (quick mental picture of channel type); Lidar/orthophotos (every 3 years); post‐flood RFCD studies 9 1 3 13
4 21Wetland Vegetation ‐ Species Composition
Such as: obligate/facultative wetland plant cover; Species richness of plants; Abundance of Nitrophylic species; % exotics; # of plant community types; % macrophyte cover; % algae cover; % blue green algae vs. green 9 3 1 13
5 22Wetland Vegetation ‐ Structure/Function
Such as: Abundance of structure types ‐ forest, woodland, marshlands; Riparian tree species ‐ age and size class structure (get at recruitment and mortality); # of changes in the plant community; Abundance of functional types ; Canopy metrics; Maximum canopy height; Leaf area index 9 3 1 13
6 7 Water quality ‐ Standard Measures Such as: pH, Temperature, Conductivity, Dissolved oxygen 8 2 3 13
7 3 Water quality ‐ Organic ConstituentsSuch as: Biological oxygen demand, Total organic carbon (also, TOC loading from effluent), E. coli, Volatile/semi‐volatile safe drinking water constituents 8 3 2 13
8 18Physical ‐ Groundwater/Surface Water interaction
Such as: Measured Infiltration rates rather than calculated ‐ important for clogging layer; Overall infiltration rate; Thickness of clogging layer across transects (using mm ruler); properties of clogging layer both pre/post scouring floods; Zone of saturation (disconnect of GW and SW) 8 3 2 13
9 14 Surface Water Quantity ‐ Extent Such as: Daily base area wet/dry, Flow extent 7 3 3 13
10 4 Water quality ‐ InorganicsSuch as: Metals (copper lead, zinc, mercury, selenium, arsenic, cadmum, chromium), Alkalinity, Hardness, Major cations and anions 6 4 3 13
11 8 Water quality ‐ physical properties Such as: Turbidity, Suspended sediments/solids, Total Dissolved solids 6 4 3 13
12 30 Aquatic Animals ‐ Fish Such as: Presence/absence 6 4 3 13
13 24 Terrestrial Animals ‐ BirdsSuch as: Obligate riparian/wetland birds; Classify birds regarding fidelity to water; Bird diversity (Tucson Audubon point count data) 5 4 4 13
14 10 Groundwater ‐ Depth to/PresenceSuch as: Geometry of the ground water mound, Groundwater wells, Perched aquifers, Private wells (impact) 4 5 4 13
15 26 Terrestrial Animals – Amphibians 4 5 4 13
16 16 Physical ‐ Sediment Transport
Such as: Fine particles in urban runoff/storm water (less than 64 microns);Morphological change in sands and gravel; Baseflow bed and bank erosion rates; Fire flow events/impacts; properties of cohesion both pre/post scouring floods 4 6 3 13
Technical Committee
Compiled Meeting Notes 61

Rank Survey Category/Subcategory Description (Data collected or available) Yes No Did not respond Total
17 20 Physical ‐ Aquatic HabitatSuch as: Embededness ex space for macros; Visual habitat assessment; % riffle/run/pool 4 6 3 13
18 33 Human/Social ‐ Recreation
Such as: Recreation: bike use, trip counts on river parks; Birdwatching via increased bird lists submitted to eBird, increased number of rare birds post improvements and thus increased number of postings to birding listserv 4 6 3 13
19 9 Water quality ‐ Other Such as: Chlorine, Odor, Suds 3 6 4 13
20 6 Water quality ‐ Emerging Contaminants Such as: Endocrine disruptors, Caffeine, Pharmaceuticals 3 7 3 13
21 32 Human/Social ‐ Landuse
Such as: Land Cover Conversion ‐ natural to Urban ‐ several scales (NLCD data periodically available; # building permits, but not acres converted) ; Human landuse (ex. old landfills, agriculture); Homeless communities; Wildcat dumping; Landuse such as gravel mining along the river, machinery in the river which could impact water quality; Stormwater Flows (an impact on water quality, physical, and animals); 2 6 5 13
22 13Surface Water Quantity ‐ inputs/removals
Such as: Daily fluctuation effluent discharge ‐ variability over 3‐day or week; other discharges into the river (Ex Orange grove gravel pit discharges water, sand/gravel has long history of impacting river); Quantify diversions 2 7 4 13
23 15Surface Water Quantity ‐ Stormwater flows 2 7 4 13
24 12 Groundwater ‐ UseSuch as: Total groundwater pumping (exists, not compiled) , Gravel Mines use of groundwater (have wells on the river corridor) 1 7 5 13
25 19 Physical ‐ Floodplain Function Such as: bank protection; floodplain health; braiding vs meandering 1 7 5 13
26 23 Wetland Vegetation ‐ Other Such as: Wetland indicator score ‐ packet of related indicators 1 7 5 13
27 28 Terrestrial Animals ‐ Flying Insects 1 7 5 13
28 34 Human/Social ‐ Socioeconomic
Such as: Community development may increase; Change in property values; May stimulate economic development/use of area; Housing development; Change in construction activity 1 7 5 13
29 5 Water quality ‐ Agriculture Runoff Such as: Herbicides, Pesticide inputs 1 8 4 13
30 11 Groundwater ‐ Quality Such as: water chemistry/quality of groundwater (some data on SC wells) 1 8 4 13
31 31 Aquatic Animals ‐ Biological Stressors Such as: crayfish; bullfrogs 1 8 4 13
32 35 Human/Social ‐ PerceptionSuch as: Human perception of the area; Human opposition to wetlands (mosquitos/west nile/disease vectors/side‐effects); Odor 1 8 4 13
33 37 Other Such as: category of data/indicator not represented by any of the above 0 7 6 13
34 25 Terrestrial Animals – Mammals 0 8 5 13
35 27 Terrestrial Animals – Herpetofauna 0 8 5 13
36 36 Human/Social ‐ Heritage Such as: Cultural resources 0 9 4 13
Technical Committee
Compiled Meeting Notes 62

Rank Survey Name: Reviving River ‐ Ranked Category Survey Results (with comments), prepared for December 13, 2012 TC meeting
1
Stong indicators of enhanced water quality and physical habitat quality. I believe Chironomids currently dominate the aquatic macroinvertebrate faunaGood indicators of water quality, but low natural species richness given substraint constraintsImportant.Key biological indicator of changes/improvements in water quality.These are good indicators of habitat health,and the ability of the river to support higher level animals. Others are better qualified to comment on this.very good metricMacroinverts are sensitive indicators of water quantity and quality
2
Important for vegetationI am not responding to water quality questions as I assume many other technical committee members will respond with "yes" to many water quality issues. Most of Fundamental to what we are doing. Being done alreadyEssentialnutrients are being removed by the new WWTP, so we need to track the resulting changes in water quality. Also Ammonia is very toxic to aquatic life; changes is NH3 concentration will be linked to vast improvements..This is important for aquatic life, but also because there may be some input from historic land use.Very importantEssential
3
Would be my 11th choice, but Claire said only 10 and I am sticking to it!Pebble counts allow for standardized method to track changes in percent fines following a reduced load of fine particulates in the wastewater. This measure represents loss of habitable space for macroinvertebrates in the substrate, so is an important stressor indicator and correlate with aquatic life diversity.This is very similar to number 16, so I would count them both as yes. Some element of channel morphology and sediment transport should be included.possibly covered by metrics above
4
Some species may respond to enhanced water quality, especially aquatic ones.Fundamental to wetland health.Wetland plants, algae and macrophyte cover are primary biological indicators that will likely change rapidly with improved water quality.especially algeaMeasuring wetland vegetation seems essential to this project
5
There may be indicators of enhanced water quality here but they may be difficult to elucidate. Vegetaton, including some emergent species, is presently well‐established and I wonder how uch change may be wrought by enhanced water quality
2. Water quality ‐ Nutrients (9 Yes, 1 No, 3 Did not respond, Total 13) Such as: Total kjedahl nitrogen, Nitrate, Nitrite, Ammonia, Phosphorus, Soluble reactive phosphorus
29. Aquatic Animals ‐ Macroinvertebrates (10 Yes, 0 No, 3 Did not respond, Total 13) Such as: Densities; Diversity indices; % midges; % worms; % dominant taxon; % non insects; % mayflies; stone flies; Taxa richness; Presence of blood midges
21. Wetland Vegetation ‐ Species Composition (9 Yes, 3 No, 1 Did not respond,13 Total) Such as: obligate/facultative wetland plant cover; Species richness ; Abundance of Nitrophylic species; % exotics; # of plant community types; % macrophyte cover; % algae cover; %blue green algae vs. green
22. Wetland Vegetation ‐ Structure/Function (9 Yes, 3 No, 1 Did not respond,13 Total) Such as: Abundance of structure types ‐ forest, woodland, marshlands; Riparian tree species ‐ age and size class structure (get at recruitment and mortality); # of changes in the plant community; Abundance of functional types ; Canopy metrics; Maximum canopy height; Leaf area index
17. Physical ‐ Channel Morphology (9 Yes, 1 No, 3 Did not respond, 13 Total) Such as: Repeated channel cross‐sections; Soil moisture on bank surface/riparian zones; Number of scouring floods; Pebble counts ; Soil collection/analysis to understand % clay/silts; Stream channel substrates; Sediment quality/size (ex. fine vs coarse gravel); Rosgen channel type (quick mental picture of channel type)
Page 1
Technical Committee
Compiled Meeting Notes 63

Fundamental to wetland health.Ran out of choices.Secondary but still important riparian indicators to overall riparian condition. Consider adding PFC here?This is probably easier to measure and does not have to be repeated, so it would be a cost effective measure of habitat availability.more of a long‐term study metricMeasuring wetland vegetation seems essential to this project
6Easy to do.DO is essential. Other parameters may not be as critical.DO is critically important for aquatic life.This is a no brainer and cheap. I didn't count this in my 10 cause you would do this anyway.Very important
7
Important WQ for life in the river.E coli is important wrt public perception and recreational use on the river. VOC and Semi‐volatiles will get data wrt industrial chemicals & some pesticides.Of special concern, given that the source of the river water ‐‐ treated effluent ‐‐ can contain elevated levels of some of these constituents.These are all necessary to evaluate the habitat for aquatic species or to see the impact (fecal coliform)from birds and animals in the corridor.Also very important
8
Ok, so I think this is pretty important because it affects length of flow. Do not know how expensive it is, however.Important as indicator of substrate conditions for aquatic life. Also important to understand for surface water budget and for microbial processing of nutrientsInfiltration rates and clogging rates are needed in order to get more credit for in‐channel managed recharge.I beleive that the clogging layer is one of the most important metricsThis seems very important, but it won't fit in my top ten list
9Fundamental to our investigationRan out of choices.Since flows vary dramatically within every 24hr period; we need to know where the wetted bank area is to understand the wetland plant dynamics.Given that much of the river will flow due to effluent release, I don't think this is critical except to measure how far downstream flow extends.This is important in terms of the effect of scour events that limit flow extent.Essential
10
Again, important for lifemetals have been a water quality concern in past assessmentsSee my answer above for "organic contaminants". Treated effluent has often been found to contain elevated levels of heavy metals.This would be nice to have and they were evaluated upstream, but they might not be as indicative of an issue. Cost of testing may be a factor too. Others may have a pH a good precursor indicator of metal solubility
3. Water quality ‐ Organic Constituents (8 Yes, 3 No, 2 Did not respond, 13 Total) Such as: Biological oxygen demand, Total organic carbon (also, TOC loading from effluent), E. coli, Volatile and semi‐volatile safe drinking water constituents
4. Water quality ‐ Inorganics (6 Yes, 4 No, 3 Did not respond, 13 Total) Such as: Metals (copper lead, zinc, mercury, selenium, arsenic, cadmum, chromium), Alkalinity, Hardness, Major cations and anions
18. Physical ‐ Groundwater/Surface Water interaction (8 Yes, 3 No, 2 Did not respond, 13 Total) Such as: Measured Infiltration rates rather than calculated ‐ important for clogging layer; Overall infiltration rate; Thickness of clogging layer across transects (using mm ruler); properties of clogging layer both pre/post scouring floods; Zone of saturation(because disconnect of GW and SW)
7. Water quality ‐ Standard Measures (8 Yes, 2 No, 3 Did not respond, 13 Total) Such as: pH, Temperature, Conductivity, Dissolved oxygen
14. Surface Water Quantity ‐ Extent (7 Yes, 3 No, 3 Did not respond, 13 Total) Such as: Daily base area wet/dry, Flow extent
Page 2
Technical Committee
Compiled Meeting Notes 64
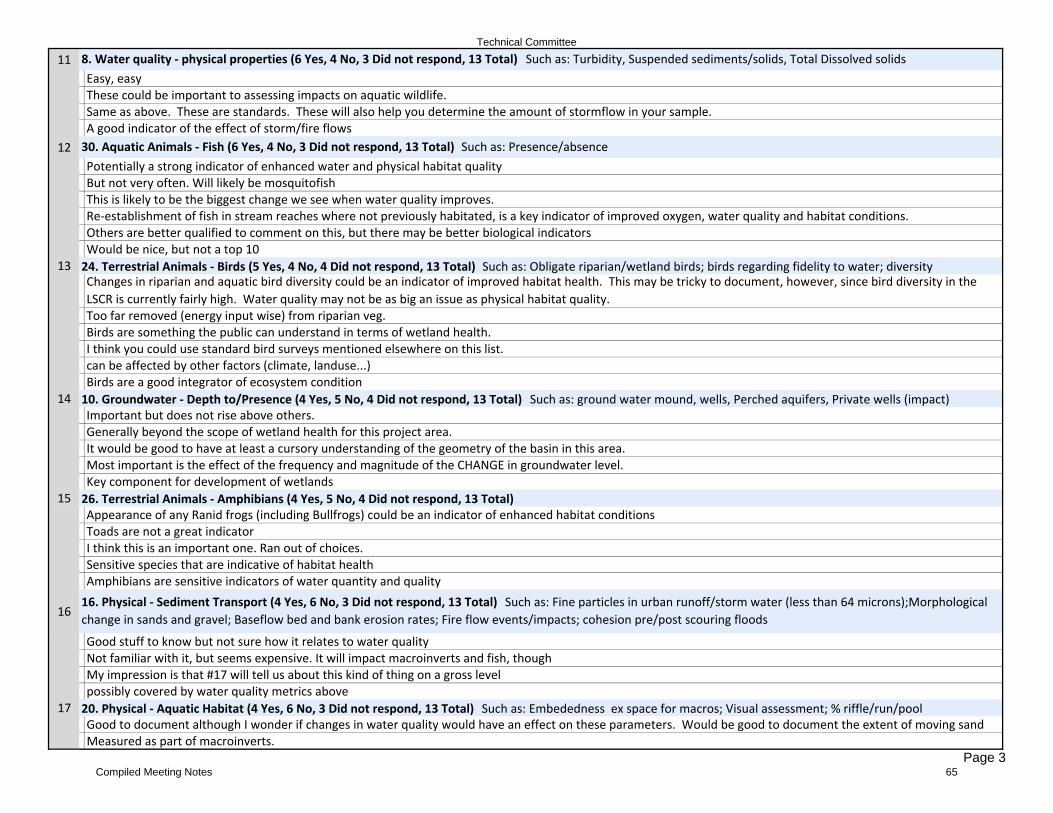
11Easy, easyThese could be important to assessing impacts on aquatic wildlife.Same as above. These are standards. These will also help you determine the amount of stormflow in your sample.A good indicator of the effect of storm/fire flows
12Potentially a strong indicator of enhanced water and physical habitat qualityBut not very often. Will likely be mosquitofishThis is likely to be the biggest change we see when water quality improves.Re‐establishment of fish in stream reaches where not previously habitated, is a key indicator of improved oxygen, water quality and habitat conditions.Others are better qualified to comment on this, but there may be better biological indicatorsWould be nice, but not a top 10
13Changes in riparian and aquatic bird diversity could be an indicator of improved habitat health. This may be tricky to document, however, since bird diversity in the LSCR is currently fairly high. Water quality may not be as big an issue as physical habitat quality.Too far removed (energy input wise) from riparian veg.Birds are something the public can understand in terms of wetland health.I think you could use standard bird surveys mentioned elsewhere on this list.can be affected by other factors (climate, landuse...)Birds are a good integrator of ecosystem condition
14Important but does not rise above others.Generally beyond the scope of wetland health for this project area.It would be good to have at least a cursory understanding of the geometry of the basin in this area.Most important is the effect of the frequency and magnitude of the CHANGE in groundwater level.Key component for development of wetlands
15Appearance of any Ranid frogs (including Bullfrogs) could be an indicator of enhanced habitat conditionsToads are not a great indicatorI think this is an important one. Ran out of choices.Sensitive species that are indicative of habitat healthAmphibians are sensitive indicators of water quantity and quality
16
Good stuff to know but not sure how it relates to water qualityNot familiar with it, but seems expensive. It will impact macroinverts and fish, thoughMy impression is that #17 will tell us about this kind of thing on a gross levelpossibly covered by water quality metrics above
17Good to document although I wonder if changes in water quality would have an effect on these parameters. Would be good to document the extent of moving sand Measured as part of macroinverts.
8. Water quality ‐ physical properties (6 Yes, 4 No, 3 Did not respond, 13 Total) Such as: Turbidity, Suspended sediments/solids, Total Dissolved solids
10. Groundwater ‐ Depth to/Presence (4 Yes, 5 No, 4 Did not respond, 13 Total) Such as: ground water mound, wells, Perched aquifers, Private wells (impact)
26. Terrestrial Animals ‐ Amphibians (4 Yes, 5 No, 4 Did not respond, 13 Total)
30. Aquatic Animals ‐ Fish (6 Yes, 4 No, 3 Did not respond, 13 Total) Such as: Presence/absence
20. Physical ‐ Aquatic Habitat (4 Yes, 6 No, 3 Did not respond, 13 Total) Such as: Embededness ex space for macros; Visual assessment; % riffle/run/pool
24. Terrestrial Animals ‐ Birds (5 Yes, 4 No, 4 Did not respond, 13 Total) Such as: Obligate riparian/wetland birds; birds regarding fidelity to water; diversity
16. Physical ‐ Sediment Transport (4 Yes, 6 No, 3 Did not respond, 13 Total) Such as: Fine particles in urban runoff/storm water (less than 64 microns);Morphological change in sands and gravel; Baseflow bed and bank erosion rates; Fire flow events/impacts; cohesion pre/post scouring floods
Page 3
Technical Committee
Compiled Meeting Notes 65
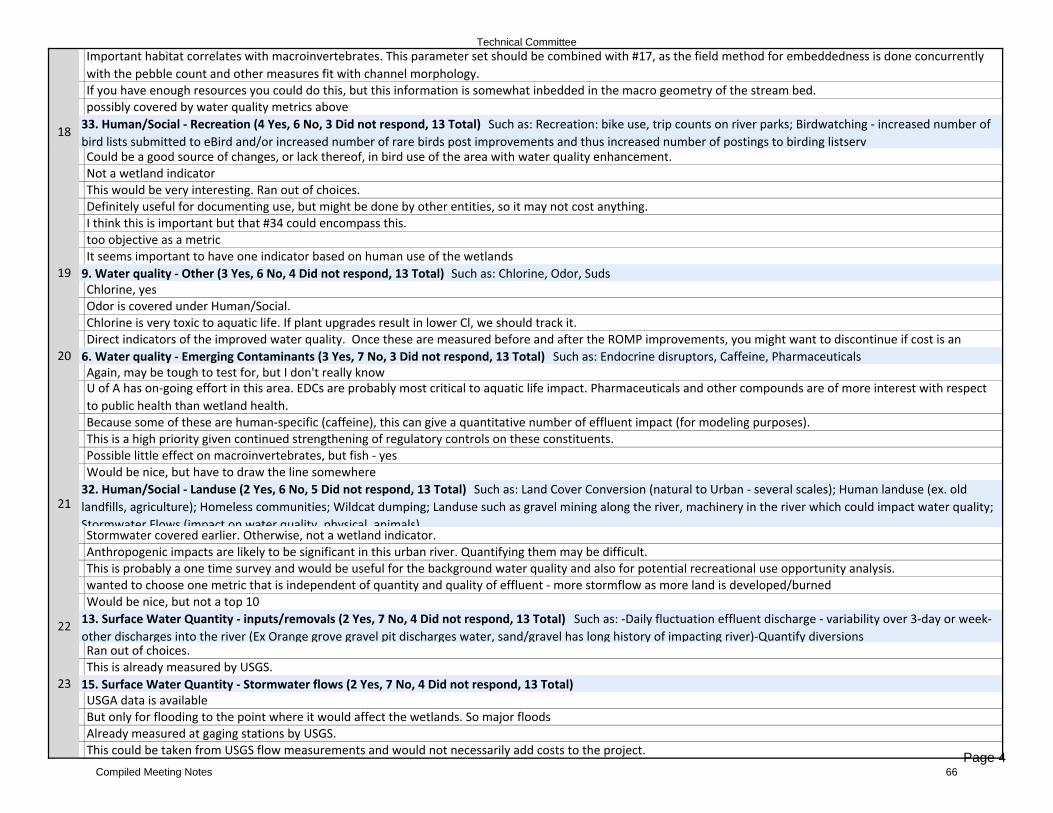
Important habitat correlates with macroinvertebrates. This parameter set should be combined with #17, as the field method for embeddedness is done concurrently with the pebble count and other measures fit with channel morphology.If you have enough resources you could do this, but this information is somewhat inbedded in the macro geometry of the stream bed.possibly covered by water quality metrics above
18
Could be a good source of changes, or lack thereof, in bird use of the area with water quality enhancement.Not a wetland indicatorThis would be very interesting. Ran out of choices.Definitely useful for documenting use, but might be done by other entities, so it may not cost anything.I think this is important but that #34 could encompass this.too objective as a metricIt seems important to have one indicator based on human use of the wetlands
19Chlorine, yesOdor is covered under Human/Social.Chlorine is very toxic to aquatic life. If plant upgrades result in lower Cl, we should track it.Direct indicators of the improved water quality. Once these are measured before and after the ROMP improvements, you might want to discontinue if cost is an
20Again, may be tough to test for, but I don't really knowU of A has on‐going effort in this area. EDCs are probably most critical to aquatic life impact. Pharmaceuticals and other compounds are of more interest with respect to public health than wetland health.Because some of these are human‐specific (caffeine), this can give a quantitative number of effluent impact (for modeling purposes).This is a high priority given continued strengthening of regulatory controls on these constituents.Possible little effect on macroinvertebrates, but fish ‐ yesWould be nice, but have to draw the line somewhere
21
Stormwater covered earlier. Otherwise, not a wetland indicator.Anthropogenic impacts are likely to be significant in this urban river. Quantifying them may be difficult.This is probably a one time survey and would be useful for the background water quality and also for potential recreational use opportunity analysis.wanted to choose one metric that is independent of quantity and quality of effluent ‐ more stormflow as more land is developed/burnedWould be nice, but not a top 10
22
Ran out of choices.This is already measured by USGS.
23USGA data is availableBut only for flooding to the point where it would affect the wetlands. So major floodsAlready measured at gaging stations by USGS.This could be taken from USGS flow measurements and would not necessarily add costs to the project.
6. Water quality ‐ Emerging Contaminants (3 Yes, 7 No, 3 Did not respond, 13 Total) Such as: Endocrine disruptors, Caffeine, Pharmaceuticals
9. Water quality ‐ Other (3 Yes, 6 No, 4 Did not respond, 13 Total) Such as: Chlorine, Odor, Suds
13. Surface Water Quantity ‐ inputs/removals (2 Yes, 7 No, 4 Did not respond, 13 Total) Such as: ‐Daily fluctuation effluent discharge ‐ variability over 3‐day or week‐other discharges into the river (Ex Orange grove gravel pit discharges water, sand/gravel has long history of impacting river)‐Quantify diversions
15. Surface Water Quantity ‐ Stormwater flows (2 Yes, 7 No, 4 Did not respond, 13 Total)
32. Human/Social ‐ Landuse (2 Yes, 6 No, 5 Did not respond, 13 Total) Such as: Land Cover Conversion (natural to Urban ‐ several scales); Human landuse (ex. old landfills, agriculture); Homeless communities; Wildcat dumping; Landuse such as gravel mining along the river, machinery in the river which could impact water quality; Stormwater Flows (impact on water quality physical animals)
33. Human/Social ‐ Recreation (4 Yes, 6 No, 3 Did not respond, 13 Total) Such as: Recreation: bike use, trip counts on river parks; Birdwatching ‐ increased number of bird lists submitted to eBird and/or increased number of rare birds post improvements and thus increased number of postings to birding listserv
Page 4
Technical Committee
Compiled Meeting Notes 66

possibly addressed by #14 and #18Won't this be measured anyway at the USGS gauges?
24
Maybe as a covariate, but unlikely to affect wetland healthGenerally beyond the scope of wetland health for this project area. Wetland conditions would be greatly improved if pumping discontinued, but that is not a likely Probably a second order need.Groundwater pumping may increase as water providers begin utilizing effluent recharge creditsThis would be really nice to have, but if i have to keep it to 10, than I would choose #10 over this one.
25Channel is pretty restricted already. Not sure what floodplain health is.Ran out of choices. But, bank protection is a significant limitation on stream channel area.This is very linked to channel morphology and could be part of the same item. It is just a horizontal mapping effort in addition to cross sectional mapping.
26Not a big fan of indices, but may not be a subgroupRan out of choices.Others are better qualified to comment on this.This would be captured by #21
27Could be an indicator of enhanced riparian vegetation and enhanced water quality in the case of those insects with aquatic life history componentsTalk about pricey.....Some of this may be reflected in the aquatic species.Others are better qualified to comment on this.Would be nice, but not a top 10
28
Not related to wetlandsLonger term than 4 years, but important.too objective as a metricSeems beyond the main scope of the grant
29I would like to say yes, but very expensive and broad array to test for. How to choose?Unclear where to sample to assess this in a targeted way. Study by Gebler(2000) found DDT, chlordane, and breakdown products in one composited sediment sample taken at Cortaro Rd in 1996. Did not find dieldrin, toxaphene and PCBs. The presence of these banned pesticides may reflect more about their persistence in the environment than any continued discharge from current land use. While a concern, this is maybe not highest priority.How would you separate this from background levels that may be contained in the treated effluent?less important than some of the others.Ag limited to downstream reachWould be nice, but have to draw the line somewhere
30Not related to wetland healthGenerally beyond the scope of wetland health for this project area.
5. Water quality ‐ Agriculture Runoff (1 Yes, 8 No, 4 Did not respond, 13 Total) Such as: Herbicides, Pesticide inputs
28. Terrestrial Animals ‐ Flying Insects (1 Yes, 7 No, 5 Did not respond, 13 Total)
19. Physical ‐ Floodplain Function (1 Yes, 7 No, 5 Did not respond, 13 Total) Such as: bank protection; floodplain health; braiding vs meandering
23. Wetland Vegetation ‐ Other (1 Yes, 7 No, 5 Did not respond, 13 Total) Such as: Wetland indicator score ‐ packet of related indicators
34. Human/Social ‐ Socioeconomic (1 Yes, 7 No, 5 Did not respond, 13 Total) Such as: Community development may increase; Change in property values; May stimulate economic development/use of area; Housing development; Change in construction activity
11. Groundwater ‐ Quality (1 Yes, 8 No, 4 Did not respond, 13 Total) Such as: water chemistry/quality of groundwater
12. Groundwater ‐ Use (1 Yes, 7 No, 5 Did not respond, 13 Total) Such as: Total groundwater pumping, Gravel Mines groundwater use ‐ wells in river corridor
Page 5
Technical Committee
Compiled Meeting Notes 67

One of the greatest concerns about the use of treated effluent is the potential for contaminants to enter into water used for human consumption. Monitoring of groundwater quality can address this concern.Not as important in a riparian/wetland environment
31They will be picked up incidentally to other activitiesRan out of choices.this parameter set should be kept but perhaps join together with macroinverts and amphibians.Maybe anecdotally noting presence, but not conducting full survey, due to expense.Bullfrogs would be captured in #26
32
Interesting and near the top of social, but not reasonable for a wetlands programPublic perception is likely to change significantly with improved water quality and odor aspects.This seems like something that municipalities are already doing and odor is already covered in another element.too objective as a metric
33Climate variables were not included: precip, humif
As you see, I chose more than 10. In general, I think there needs to be a suite of water quality measurements and many of them are standard measurements. As for indicator species, I defer to our biologists. Several types of information may need a baseline surveys, but no repeat surveys (river geometry, land use, groundwater aquifer characteristics). Others need repeat surveying (biological species, recreational use, water quality). I am sure cost will be a major factor.
34Too expesive and not linked to wetlandsRan out of choices.can be affected by other factors (climate, landuse...)Would be nice, but not a top 10
35I think what you mean is reptiles.No‐ too expensive and variable.Ran out of choices.Others are better qualified to comment on this.Would be nice, but not a top 10
36Don't see a relationship between water quality and cultural resources, especially archaeological resourcesNot wetlansBeyond the wetland scope.If you can't do all of them, this might be expendable.too objective as a metric
27. Terrestrial Animals ‐ Herpetofauna (0 Yes, 8 No, 5 Did not respond, 13 Total)
37. Other (0 Yes, 7 No, 6 Did not respond, 13 Total) Such as: a category of data or indicator you feel is not represented by any of the above ‐ Comments
31. Aquatic Animals ‐ Biological Stressors (1 Yes, 8 No, 4 Did not respond, 13 Total) Such as: crayfish; bullfrogs
35. Human/Social ‐ Perception (1 Yes, 8 No, 4 Did not respond, 13 Total) Such as: Human perception of the area; Human opposition to wetlands (mosquitos/west nile/disease vectors/side‐effects); Odor
36. Human/Social ‐ Heritage (0 Yes, 9 No, 4 Did not respond, 13 Total) Such as: Cultural resources
25. Terrestrial Animals ‐ Mammals (0 Yes, 8 No, 5 Did not respond, 13 Total)
Page 6
Technical Committee
Compiled Meeting Notes 68

Notes, 4th Reviving River Technical Committee Meeting Sonoran Institute, 44 E. Broadway Blvd., Tucson 85701 December 13, 2012 9 – 12:00 am 1. Welcome, Introductions & Approval of the minutes—Emily Brott, Sonoran
Institute welcomed everyone and began with introductions. • Technical Committee Members Attending: Jennifer Duan – University Of
Arizona (UA); James Dubois – Pima County Regional Wastewater Reclamation Department (PCRWRD); Nathan Lehman – Bureau of Reclamation; Kendall Kroesen – Tucson Audubon Society (TAS); Akitsu Kimoto – Pima County Regional Flood Control District (PCRFCD); Michael Liberti – Tucson Water; Brian Powell – Pima County Office of Conservation Science (PCOCS); Linwood Smith – ecological consultant; Patti Spindler (via telephone) – Arizona Department of Environmental Quality (ADEQ); Julie Stromberg (via telephone) – Arizona State University; Claire Zucker – Pima Association of Governments
• Others Attending: Eve Halper – Bureau of Reclamation; Ed Curley, PCRWRD; Evan Canfield, PCRFCD; Claire Zugmeyer, Sonoran Institute.
• Updates/Announcements:
a. When emailing Sonoran Institute regarding this project, please be sure to email both Emily and Claire.
b. Emily reviewed the diagram presented in a previous meeting that demonstrates the role of the Technical Committee and how it feeds into other ongoing Pima County work. The TC is focused on determining the final indicators that will be used in the annual report series. Other workgroups may form on an as needed basis to discuss detailed methodology and possible monitoring parameters within specific data types to inform indicator selection for the annual report (e.g. macroinvertebrates and wetland vegetation). Interested TC members are welcome to join these groups, though are not required. Although not the priority of the TC, discussions will naturally inform two other Pima County efforts 1) refining of the Wetland Program, and 2) Development of the Lower Santa Cruz River Management Plan. Having the large “master” list of brainstormed indicators will be useful for informing these other activities.
Technical Committee
Compiled Meeting Notes 69

• Notes from the second Reviving River Technical Committee Meeting on
November 28, 2012 were not approved because the group had not had time to review them as they were sent out the day before the December 13th meeting.
2. Results of the Subcategory Survey—Claire Zugmeyer reviewed the three handouts
that were used to foster discussion about the category survey results. • Handouts: List of subcategories as originally ordered in the survey; Ranked
survey results summarizing the votes; Ranked survey results that included all the individual commentary.
• There was concern that the survey format did not fairly weight all the “Big Bins” or categories of data. Some categories, like water quality, had greater number of subcategories and thus had greater likelihood of being selected and having a higher rank.
1. The “Big Bins” were the words prior to the dash in the name of each category. The subcategories were the words after the dash. For example, Water Quality – Emerging contaminants; water quality is the “big bin” while emerging contaminants is a subcategory.
2. This structure was chosen in order to help group similar parameters and make it easier to vote for specific item; rather than voting for a larger group when only one parameter in the group was of interest. However, this format may have resulted in more confusion.
• We developed the survey as a tool to begin to prioritize categories and subcategories of data that are important for tracking wetland condition. Prioritizing the types of data needed is critical for developing the final list of indicators as they will be derived from either data collected by Pima County or another available source. The limitation to 10 “yes” votes was an arbitrary number and merely an attempt to begin seeing which subcategories were getting the most votes.
1. There seemed to be confusion regarding the intent of the survey. Some committee members indicated in the survey that they didn’t choose certain subcategories because they were “easy data” or “already being collected”.
a) Regardless of ease of data collection etc, the TC is charged with determining the best indicators for tracking wetland conditions for the annual report. Even if data is being collected, unless the TC selects this parameter, it will not be in the annual report.
• There was concern that we would ignore data that didn’t get a lot of votes. The survey results are merely a way to start the conversation about how to begin to narrow in on the final indicator selection.
• There was a suggestion that moving forward, it would be helpful to vote and rank within categories. Such as looking at all possible parameters of water quality and ranking these to determine which might be the best indicators.
Technical Committee
Compiled Meeting Notes 70

3. Subcategory Survey Discussion—After preliminary discussion of the survey results the group transitioned into a discussion about which subcategories were top choices and which could be eliminated at this time. Selecting top subcategories did not mean others would automatically drop out. To facilitate this discussion we used the rankings from the survey to discuss the “top” and the “bottom”, agreeing to revisit at a future meeting those subcategories that fell in the middle.
• After much discussion the group agreed that the top ten categories were important categories of data to continue discussing.
• Within the top ranking subcategories, Aquatic Macroinvertebrates (which had the highest number of votes) and Wetland vegetation, appear to be very important to monitor and are not currently being collected.
1. Two subcommittees will discuss in more detail data collection for Macroinvertebrates and wetland vegetation. The results of these discussions will inform the development of an addendum to the Quality Assurance Project that Plan Pima County has submitted to the EPA.
a) Macroinvertebrate – Brian, Patti, Jim, Julie, Linwood, Akitsu, Julia
b) Wetland Vegetation – Brian, Julia, Jennifer, Julie, Claire Zucker
• The group suggested that the subcategories that Rank 4 and 5, Wetland Vegetation – Species Composition and Wetland Vegetation – Structure/Function, could be combined into one category, Wetland Vegetation.
• The group suggested that subcategory, Physical- groundwater/surface water interaction, should be called Infiltration.
• To begin the process of eliminating subcategories of data for consideration as indicators of wetland health in the annual report, the group looked at the lower prioritized subcategories, those ranked 21-36. The group was asked to identify which of these we should not eliminate at this time.
1. Subcategories that were not eliminated at this time were: Human/Social – Landuse; Surface Water Quantity – inputs/removals; Surface Water Quantity – Stormwater flows; Physical – floodplain function; Human/Social – Socioeconomic; Water quality – agriculture runoff; Human/Social – Perception
2. Subategories that were eliminated at this time were: Groundwater – Use; Wetland vegetation – Other; Terrestrial Animals – flying insects; Groundwater – Quality; Aquatic animals – biological stressors; Terrestrial Animals – Mammals; Terrestrial Animals – Herpetofauna
• Suggestions were made about “filters” that the group could use to help select the final indicators. These included: whether it was important baseline information; repeatability; price; ease of collection; how well it relates to the project goal; and how many sites would be needed.
[Break]
Technical Committee
Compiled Meeting Notes 71
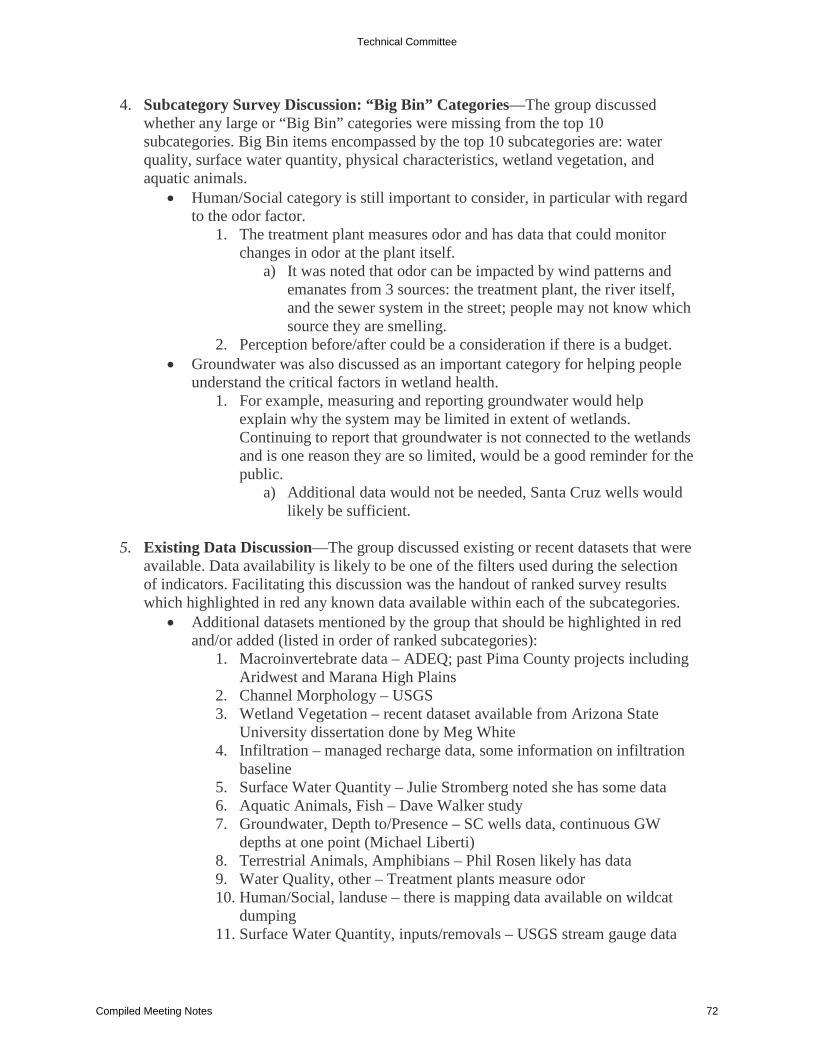
4. Subcategory Survey Discussion: “Big Bin” Categories—The group discussed whether any large or “Big Bin” categories were missing from the top 10 subcategories. Big Bin items encompassed by the top 10 subcategories are: water quality, surface water quantity, physical characteristics, wetland vegetation, and aquatic animals.
• Human/Social category is still important to consider, in particular with regard to the odor factor.
1. The treatment plant measures odor and has data that could monitor changes in odor at the plant itself.
a) It was noted that odor can be impacted by wind patterns and emanates from 3 sources: the treatment plant, the river itself, and the sewer system in the street; people may not know which source they are smelling.
2. Perception before/after could be a consideration if there is a budget. • Groundwater was also discussed as an important category for helping people
understand the critical factors in wetland health. 1. For example, measuring and reporting groundwater would help
explain why the system may be limited in extent of wetlands. Continuing to report that groundwater is not connected to the wetlands and is one reason they are so limited, would be a good reminder for the public.
a) Additional data would not be needed, Santa Cruz wells would likely be sufficient.
5. Existing Data Discussion—The group discussed existing or recent datasets that were
available. Data availability is likely to be one of the filters used during the selection of indicators. Facilitating this discussion was the handout of ranked survey results which highlighted in red any known data available within each of the subcategories.
• Additional datasets mentioned by the group that should be highlighted in red and/or added (listed in order of ranked subcategories):
1. Macroinvertebrate data – ADEQ; past Pima County projects including Aridwest and Marana High Plains
2. Channel Morphology – USGS 3. Wetland Vegetation – recent dataset available from Arizona State
University dissertation done by Meg White 4. Infiltration – managed recharge data, some information on infiltration
baseline 5. Surface Water Quantity – Julie Stromberg noted she has some data 6. Aquatic Animals, Fish – Dave Walker study 7. Groundwater, Depth to/Presence – SC wells data, continuous GW
depths at one point (Michael Liberti) 8. Terrestrial Animals, Amphibians – Phil Rosen likely has data 9. Water Quality, other – Treatment plants measure odor 10. Human/Social, landuse – there is mapping data available on wildcat
dumping 11. Surface Water Quantity, inputs/removals – USGS stream gauge data
Technical Committee
Compiled Meeting Notes 72

12. Surface Water Quantity, stormwater flows – permit data 13. Human/Social, socioeconomic – changes in property values can be
derived from existing data sources
6. Next Agenda/Date—Claire announced that she would send out a doodle poll for selecting the dates for the January field trip and meeting. Having both the meeting and the field trip on the same day would be too long for some to get away from the office, thus two separate days would be better. Julie suggested that the field trip and meeting be on adjacent days so that she could stay the night in Tucson and maybe attend both events in person.
Technical Committee
Compiled Meeting Notes 73

Macro invertebrate and habitat assessment data will be collected within the study reach. Arizona Department of Environmental Quality (ADEQ) has been collecting macro invertebrate samples near Cortaro Road. This project will use the ADEQ’s macro invertebrate and habitat assessment data at Cortaro site as acquired data. Additionally, a contractor (to be determined) will collect additional macro invertebrate samples and habitat assessment data at three RWRD’s surface water sampling sites (SC-2, 4, 8 or 9, depending on the river condition) in Spring (April to May) and 4 to 6 weeks after flood events if necessary and will analyze to the Genus level for insects, and other levels for other taxonomic groups. A contractor will also measure Dissolved Oxygen (DO) for 24 hours at SC-2, SC-4 and additional appropriate sites if necessary, concurrently with the macroinvertebrate sampling. Sample and data collection efforts will follow ADEQ’s “Biocriteria Program Quality Assurance Program Plan” (ADEQ, 2006) and “Standard Operating Procedures for Surface Water Quality Sampling” (ADEQ, 2010). Fish will be monitored at the macroinvertebrate sampling sites. Fish species will be identified by following the American Fisheries Society’s publication, “Common and Scientific Names of Fishes from the United States, Canada and Mexico” (Nelson, et al. 2004) that was recommended by EPA (U.S. EPA, 2006).
Technical Committee
Compiled Meeting Notes 74
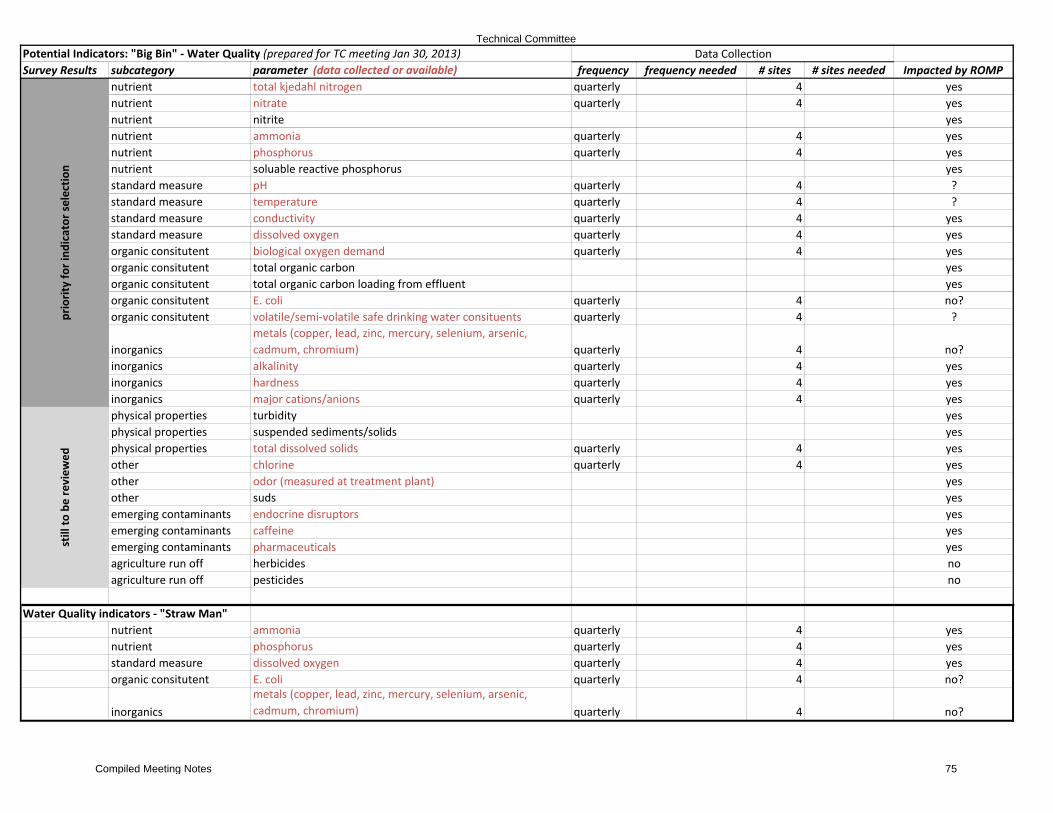
Potential Indicators: "Big Bin" - Water Quality (prepared for TC meeting Jan 30, 2013)Survey Results subcategory parameter (data collected or available) frequency frequency needed # sites # sites needed Impacted by ROMP
nutrient total kjedahl nitrogen quarterly 4 yesnutrient nitrate quarterly 4 yesnutrient nitrite yesnutrient ammonia quarterly 4 yesnutrient phosphorus quarterly 4 yesnutrient soluable reactive phosphorus yesstandard measure pH quarterly 4 ?standard measure temperature quarterly 4 ?standard measure conductivity quarterly 4 yesstandard measure dissolved oxygen quarterly 4 yesorganic consitutent biological oxygen demand quarterly 4 yesorganic consitutent total organic carbon yesorganic consitutent total organic carbon loading from effluent yesorganic consitutent E. coli quarterly 4 no?organic consitutent volatile/semi-volatile safe drinking water consituents quarterly 4 ?
inorganicsmetals (copper, lead, zinc, mercury, selenium, arsenic, cadmum, chromium) quarterly 4 no?
inorganics alkalinity quarterly 4 yesinorganics hardness quarterly 4 yesinorganics major cations/anions quarterly 4 yesphysical properties turbidity yesphysical properties suspended sediments/solids yesphysical properties total dissolved solids quarterly 4 yesother chlorine quarterly 4 yesother odor (measured at treatment plant) yesother suds yesemerging contaminants endocrine disruptors yesemerging contaminants caffeine yesemerging contaminants pharmaceuticals yesagriculture run off herbicides noagriculture run off pesticides no
Water Quality indicators - "Straw Man"nutrient ammonia quarterly 4 yesnutrient phosphorus quarterly 4 yesstandard measure dissolved oxygen quarterly 4 yesorganic consitutent E. coli quarterly 4 no?
inorganicsmetals (copper, lead, zinc, mercury, selenium, arsenic, cadmum, chromium) quarterly 4 no?
Data Collectionpr
iori
ty fo
r in
dica
tor
sele
ctio
nst
ill t
o be
rev
iew
ed
Technical Committee
Compiled Meeting Notes 75

Potential Indicators: "Big Bin" - Wetland Vegetation (prepared for TC meeting Jan 30, 2013)parameter frequency frequency needed # sites # sites needed Impacted by ROMPobligate/facultative wetland plant cover yes?Species richness of plants ?Abundance of Nitrophylic species yes?% exotics ?# of plant community types ?% macrophyte cover ?% algae cover yes?% blue green algae vs. green yes?Abundance of structure types - forest, woodland, marshlands ?Riparian tree species - age and size class structure (get at recruitment and mortality) ?# of changes in the plant community ?Abundance of functional types ?Canopy metrics ?Maximum canopy height ?Leaf area index ?
Data CollectionTechnical Committee
Compiled Meeting Notes 76

Notes, Reviving River Technical Committee Meeting Sonoran Institute, 44 E. Broadway Blvd., Tucson 85701 January 30, 2013 9:30 – 12:00 am 1. Welcome, Introductions & Approval of the minutes—Emily Brott, Sonoran
Institute welcomed everyone and began with introductions. • Technical Committee Members Attending: James Dubois – Pima County
Regional Wastewater Reclamation Department (PCRWRD); Nathan Lehman – Bureau of Reclamation (BOR); Akitsu Kimoto – Pima County Regional Flood Control District (PCRFCD); Michael Liberti – Tucson Water; Jean McLain, University of Arizona; Brian Powell – Pima County Office of Conservation Science (PCOCS); Linwood Smith – ecological consultant; Patti Spindler (via telephone) – Arizona Department of Environmental Quality (ADEQ); Robert Webb, US Geological Survey; Claire Zucker – Pima Association of Governments
• Others Attending: Evan Canfield, PCRFCD; Ed Curley, PCRWRD; Julia Fonseca, PCOCS; Eve Halper – BOR alternate; Jason Jones, ADEQ alternate; Jacob Prieto, PCRFCD; and Claire Zugmeyer, Sonoran Institute.
• Updates/Announcements:
a. There were several requests to have a central place for reports and documents that pertain to the Lower Santa Cruz River. Pima County has agreed to set up a website to serve as a “Library” for these documents.
b. Emily thanked the Pima County staff for organizing and leading a great field trip.
c. Macroinvertebrate Subgroup – Brian Powell gave an update regarding the discussions of the subgroup working on macroinvertebrate sampling. At this time the group has mainly focused on methodology and will discuss possible indicators for the annual report after the methodology is confirmed.
i. Locations - three sites, maybe four. (SC-2, 4, 8 or 9 depending on river condition; 9 may be too dry)
ii. Timing – April is ideal and could be measured again in October, but the communities will likely be similar. Sampling would occur in 2013, 2014, and 2015.
Technical Committee
Compiled Meeting Notes 77

1. What if there is a significant flood/scouring event? If this is the case, then sampling will occur 4-6 weeks after the event.
• Notes from the Reviving River Technical Committee Meetings on November
28, 2012 and December 13, 2012 were approved. a. Motion to approve – Linwood Smith b. Second – Jean McLain
2. Historical Conditions Report—Evan Canfield and other Pima County staff gave a
presentation on the Historical Conditions Report. • Handouts: Note pages of the power point presentation (see attached). • The report is not completed yet, but some initial results were shared with the
group. • The report will discuss historical water quantity, geomorphology, vegetation,
water quality, macroinvertebrates, and anticipated changes due to the ROMP upgrades which will impact both water quality and quantity.
• In order to begin assessing what indicators should be selected for the annual report, the group needs to understand what past conditions have been and what might change after the ROMP upgrades are completed.
[Break] 3. What is an Indicator—Claire Zugmeyer gave a brief presentation to get the group
on the same page regarding how we are defining an indicator in this project. She also proposed a timeline for indicator selection.
• Handouts: Slides of power point presentation (see attached) • General definition of indicator – a measure or component from which
conclusions on the phenomenon of interest can be inferred • Living River example from the Upper Santa Cruz River.
1. Phenomenon of interest was River Health – what indicators can give us a snapshot of river health on an annual basis
2. 10 indicators were selected, 7 that related to water quality and the health of the aquatic system, and 3 that related to groundwater availability and the health of the riparian area along the river.
3. Other data was included in the annual report, but was not a formal indicator. These included:
a) Precipitation – important to estimate the amount of rainfall in the area, as this impacts the indicators of health. It is not an “indicator” because there is no known quantity of rainfall that the river must have in order to be healthy.
b) Streamflow – important to track general quantity of surface flows and whether there were large flood events, as these impact indicators of health. Stream flow was not chosen as an indicator as necessary baseflows to maintain the river have not
Technical Committee
Compiled Meeting Notes 78

been determined. Thus there would be no clear way to evaluate the system.
c) Birds – Birds are influenced by many factors that may not reflect local conditions along the river and would thus not necessarily reflect the health of the river. However, this stretch of the river is an “Important Bird Area” and many birders come to this region to hike along the river, so it was thought to be important to summarize data in terms of number of species seen and how many non-native species were present.
• “Reviving River” phenomenon – wetland quality pre/post ROMP upgrades. 1. We want to develop a short list of indicators that can give the public:
a) an annual snap shot of wetland quality and/or condition b) an assessment of the impacts of the ROMP upgrades.
2. Data for the selected indicators will be evaluated to help the public understand the condition of the river, how it is changing, and why it is important to track wetland condition. Indicators could be evaluated with either a regulatory standard, scientific standard, desired goal, or compared to some baseline that helps assess change.
• Timeline – using a suggestion from the Committee, we will try to select draft indicators for the report from within each “big bin” of data. To address the 8 bins of data (wetland vegetation, water quality, water quantity, groundwater, physical characteristics, aquatic animals, terrestrial animals, and human social) that the group has discussed, the proposed timeline is:
1. January meeting – wetland vegetation and water quality 2. February meeting – 3 more bins 3. March meeting – 3 more bins 4. April meeting – full draft list compiled from the previous meetings
that can be evaluated together and allow possible addition missing indicators or elimination of unnecessary indicators.
5. May meeting – final list of indicators • General Group Discussion:
1. Some data, like macroinvertebrates require spring sampling, what other kinds of data will require spring sampling? There is a concern that we will miss the opportunity to collect that data if we haven’t selected the indicators in time. The suggestion was made move any of these potential bins of data earlier in the timeline to ensure necessary data is collected.
a) Additional concern was voiced about summer heat, if we didn’t determine indicators that require data until summer, data collection would occur in a less ideal time of the year.
b) Some bins that we may want to consider early on are physical characteristics like geomorphology, human/social factors, and animals.
2. With the Living River, did we think about the public and what was most relevant to them when selecting indicators?
Technical Committee
Compiled Meeting Notes 79

a) No – we simply tried to determine what indicators would give us the best snapshot of river health.
3. There are three levels to this project – a) Indicators – engage the community and give them a snapshot
of river health b) Diverse data – other data that may not be an indicator will still
be included in the monitoring plan and help us tell the story c) Santa Cruz Management Plan – how does the snapshot and
diverse data inform the plan 4. There seems to be an incentive for every party with a right to the
effluent to take it off the river. If we are able to show the benefits, we may be able to build a constituency to change the policy and keep the water in the river.
4. Indicator Selection – Wetland Vegetation and Water Quality— To date, we have
been discussing all the “big bins” of data and determining what is important to have in a monitoring program that tracks wetland condition. For example, with these discussions we have identified that wetland vegetation and macroinvertebrates are important datasets to collect and Pima County has worked with subgroups to develop the methodology to collect data for their monitoring program. Now our goal is to home in on the best indicators for our annual report that will help the public understand wetland condition and impacts from the ROMP upgrade. The group started discussing indicators for the final report with the first “big bin” categories of wetland vegetation and water quality.
• Wetland Vegetation – Julia Fonseca gave an update of the progress made by the vegetation subgroup. They have developed a methodology and developed a short list of possible indicators for the annual report (see attached handout labeled Table 1. Plant-based indicators evaluated for assessment of wetland condition).
1. Of 7 possible indicators that could be reported on annually or every three years, the subgroup suggested 3 priority indicators. (note: any of the indicators could be derived from the plot/transect methodology discussed by the subgroup and does not preclude the supplementation of LIDAR data)
a) Priority 1: Species composition – wetland indicator score 1. Annual indicator of permanent surface water in low-
flow channel and low daily/weekly fluctuation in stream stage during dry season
2. Tracks surface water availability and is a national scoring system
3. Ground based method b) Priority 2: Cover of wetland (hydroriparian) trees
1. Three year indicator of presence of shallow groundwater to sustain wetland trees across the floodplain and adequate soil moisture vertically and laterally
Technical Committee
Compiled Meeting Notes 80

2. Tracks shallow groundwater availability. Also tracks ecosystem services like habitat (for birds) and aesthetic/recreational enjoyment (people like trees)
3. Lidar based method with ground truthing c) Priority 3: Species Composition – Nitrophiles
1. Annual indicator of the abundance of species with high affinity for nitrogen and high competitive ability under high nitrogen situations
2. Tracks levels of nitrogen in the wetlands and links to water quality changes anticipated with ROMP. Also is nationally relevant and comparable across the U.S.
3. Ground based method 2. General Discussion:
a) An indicator that can relate or can be compared to other rivers was thought to be helpful.
b) There was concern regarding a high emphasis on herbaceous species and making the public believe these are most important.
c) Trees and shrubs are also important. Perhaps there should be some emphasis on finding perennial seedlings.
1. These are important from a hydrologic standpoint and could be revisited within the vegetation subgroup.
• Water Quality – the group ran out of time to begin discussing indicators of water quality. This will be reviewed at a future meeting.
5. Next Agenda/Date—Claire Zugmeyer announced that she would send out a doodle
poll for selecting the dates for the February and March meetings.
Technical Committee
Compiled Meeting Notes 81

2/8/2013
1
The Historical Conditions Report The Historical Conditions Report of the Lower Santa Cruz Riverof the Lower Santa Cruz River
Evan CanfieldEvan CanfieldAkitsuAkitsu KimotoKimotoJacob Jacob PriettoPriettoJames DuboisJames DuboisJulia FonsecaJulia Fonseca
Report Outline
• Introduction• Water• Geomorphology
V t ti• Vegetation• Water Quality• Macroinvertebrates• Anticipated Changes in LSCR
– Possible Impacts of Water Quality upgrades – Possible Changes in Water Supply
ROMP Implementation Schedule
2006 2007 2008 2009 2010 2011 2012 2013 2014 2015 2016 2017 2018 2019 2020
Ina Road WRF 50 MGD
ADEQ Treatment Deadline Ina Road WRF
–ADEQ Treatment Deadline Roger Road WRF
3
Power Plant (Ina Road WRF)
Water Reclamation Campus 32 MGD
Demolish existing Roger Road plantCentral Laboratory
(Water Reclamation Campus)
Design/Approval Construction Acceptance/Startup Testing
2006 2007 2008 2009 2010 2011 2012 2013 2014 2015 2016 2017 2018 2019 2020
Origin of the Report• RFCD Director Suzanne Shields asks me to
write a report on impact of ROMP upgrades to:– Pima County water supply (i.e. potential for
improved recharge)– RFCD Infrastructure (1999 modeling study of RFCD Infrastructure (1999 modeling study of
effluent flows said)• Ina to Cortaro: 7-13 feet (downstream of the Ina Rd
grade control had deep scour) • Cortaro to Avra Valley: 5-7 feet
GoalRespect for the Environment Goal #4: Ensure the future of riparian and aquatic habitat along the effluent-dependent reach of
Pima County/City Pima County/City of Tucson Planning of Tucson Planning
StudyStudy
effluent dependent reach of the Santa Cruz River
Action PlanRespect for the Environment Program #4:‘Lower Santa Cruz River ‘Lower Santa Cruz River Management Plan’ Management Plan’ (2011-2015)
Relevance of Relevance of Historical Conditions Historical Conditions ReportReport with Other Effortswith Other Efforts
EPA Wetland Program:
‘Reviving River’ Annual Report of Indicators
Regulatory: Refine the Existing Wetland (Riparian)
Program (Title 16.30)
Planning: Development of a Lower Santa
Cruz River Management
Plan
Technical Committee
Compiled Meeting Notes 82

2/8/2013
2
Report Outline
• Introduction•• WaterWater• Geomorphology
V t ti• Vegetation• Water Quality• Macroinvertebrates• Anticipated Changes in LSCR
– Possible Impacts of Water Quality upgrades – Possible Changes in Water Supply
History of Flow in Effluent Dependent Reach
• 1973 - Discharge from Roger creates perennial flow
• 1977 - Discharge from Ina added to flow from Roger Rdflow from Roger Rd.
• 1985 - Classified as ‘Effluent ‘Effluent ––Dominated Water’ Dominated Water’ (EDW) because over 75% of flow in a typical year is effluent
Effluent Inflow Peaked in 2002 and is now declining
Annual Flows Greater at Ina than Trico Rd
Fraction of Effluent Discharge to Annual Flow
Technical Committee
Compiled Meeting Notes 83
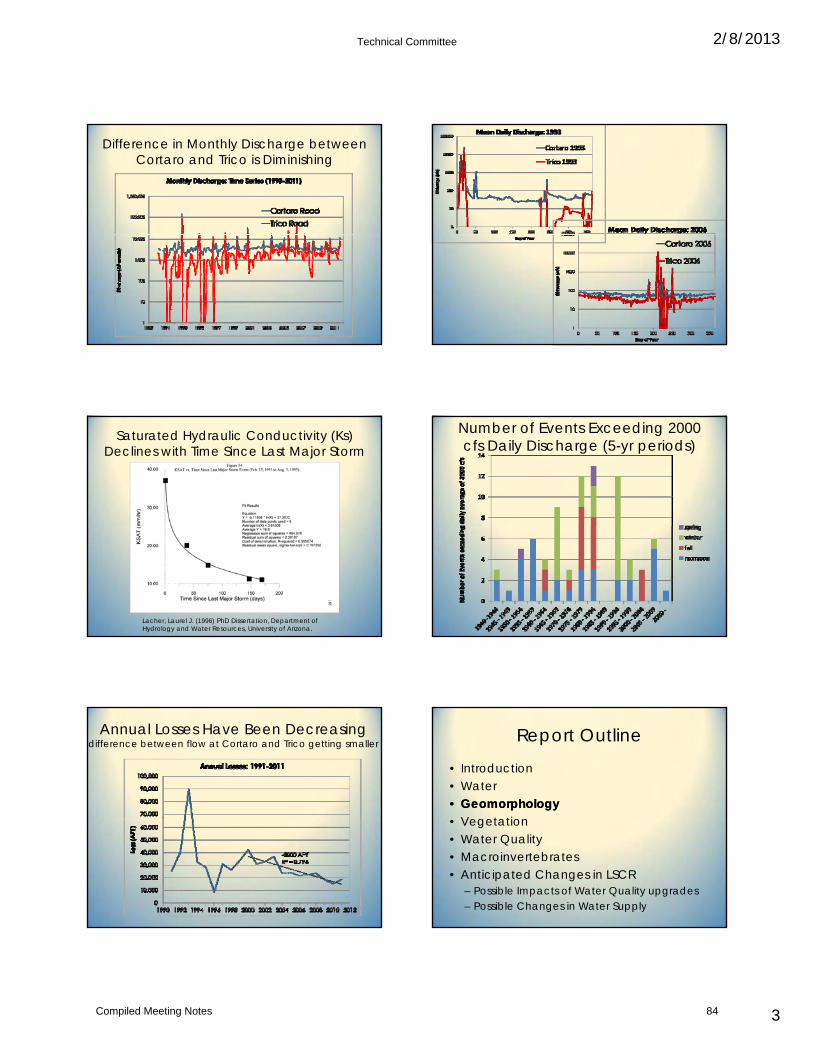
2/8/2013
3
Difference in Monthly Discharge between Cortaro and Trico is Diminishing
Saturated Hydraulic Conductivity (Ks) Declines with Time Since Last Major Storm
Lacher, Laurel J. (1996) PhD Dissertation, Department of Hydrology and Water Resources, University of Arizona.
Number of Events Exceeding 2000 cfs Daily Discharge (5-yr periods)
Annual Losses Have Been Decreasing difference between flow at Cortaro and Trico getting smaller Report Outline
• Introduction• Water•• GeomorphologyGeomorphology
V t ti• Vegetation• Water Quality• Macroinvertebrates• Anticipated Changes in LSCR
– Possible Impacts of Water Quality upgrades – Possible Changes in Water Supply
Technical Committee
Compiled Meeting Notes 84

2/8/2013
4
Major Changes (Red): Sanders- Avra Valley (2)Cortaro- Sunset (5 and 6)
Effluent Flow Location Change between 1998-2011
Minor Changes (Blue): Trico-Sanders (1)Sunset-Sweetwater (7)
Major Location Change Effluent Flow between Ina – Cortaro
2005 2008
Large Channel Bed Elevation ChangeEffluent Channel between Ina-Cortaro
1998-2005 2005-2008
Elevation Difference 05-98<Feet>
< -3-3 - -2-2 - -1-1 - 00 - 11 - 22 - 3> 3
Reach in 2005
Reach in 1998Reach in 2005
Reach in 2008
Minor Location Change Effluent Flow between Sunset-
Sweetwater
• Minor Location Change but Relatively Deep Erosion/Deposition
Large Channel Bed Elevation ChangeEffluent Channel between Sunset-
Sweetwater
1998-2005 2005-2008
Elevation Difference 05-98<Feet>
< -3-3 - -2-2 - -1-1 - 00 - 11 - 22 - 3> 3
Small Channel Bed Elevation ChangeEffluent Channel between Trico- Sanders
Minor Location Change Shallow Erosion/Deposition
Elevation Difference 05-98<Feet>1998-2005 2005-2008<Feet>
< -3-3 - -2-2 - -1-1 - 00 - 11 - 22 - 3> 3
1998 2005 2005 2008
Technical Committee
Compiled Meeting Notes 85
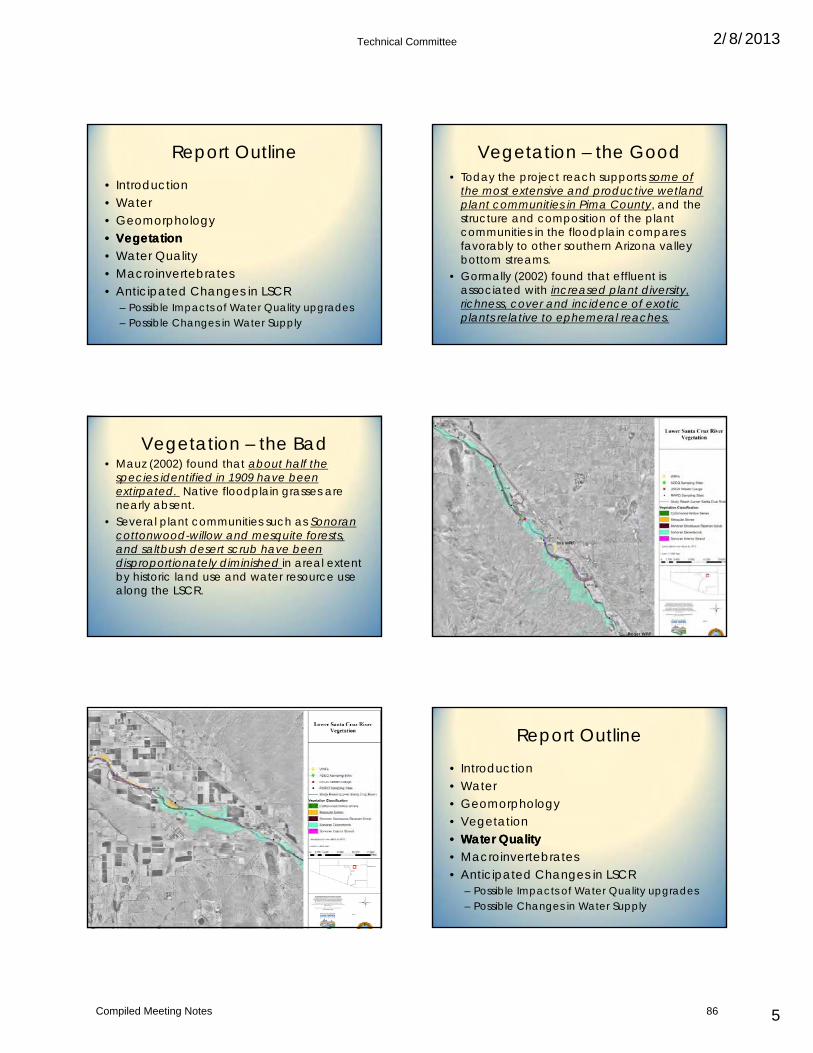
2/8/2013
5
Report Outline
• Introduction• Water• Geomorphology
V t tiV t ti•• VegetationVegetation• Water Quality• Macroinvertebrates• Anticipated Changes in LSCR
– Possible Impacts of Water Quality upgrades – Possible Changes in Water Supply
Vegetation – the Good• Today the project reach supports some of
the most extensive and productive wetland plant communities in Pima County, and the structure and composition of the plant communities in the floodplain compares communities in the floodplain compares favorably to other southern Arizona valley bottom streams.
• Gormally (2002) found that effluent is associated with increased plant diversity, richness, cover and incidence of exotic plants relative to ephemeral reaches.
Vegetation – the Bad• Mauz (2002) found that about half the
species identified in 1909 have been extirpated. Native floodplain grasses are nearly absent.
• Several plant communities such as Sonoran pcottonwood-willow and mesquite forests, and saltbush desert scrub have been disproportionately diminished in areal extent by historic land use and water resource use along the LSCR.
Report Outline
• Introduction• Water• Geomorphology
V t ti• Vegetation•• Water QualityWater Quality• Macroinvertebrates• Anticipated Changes in LSCR
– Possible Impacts of Water Quality upgrades – Possible Changes in Water Supply
Technical Committee
Compiled Meeting Notes 86
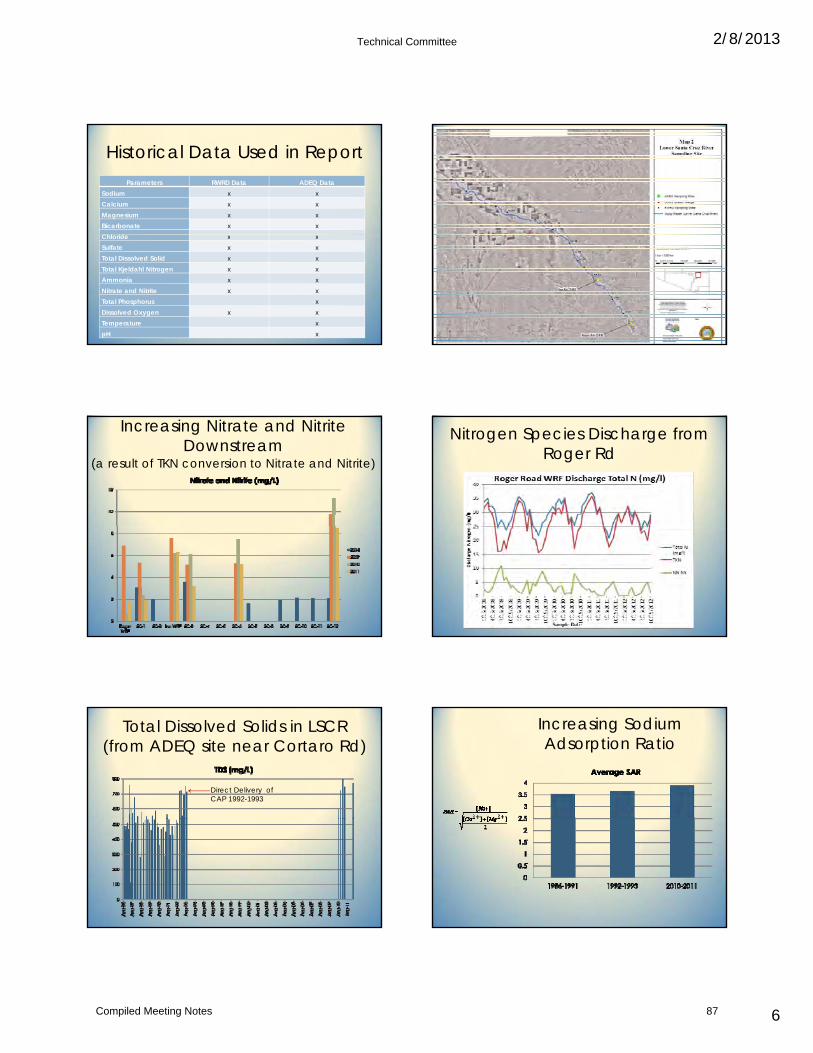
2/8/2013
6
Historical Data Used in ReportParameters RWRD Data ADEQ Data
Sodium x xCalcium x xMagnesium x xBicarbonate x xChl idChloride x xSulfate x xTotal Dissolved Solid x xTotal Kjeldahl Nitrogen x xAmmonia x xNitrate and Nitrite x xTotal Phosphorus xDissolved Oxygen x xTemperature xpH x
Increasing Nitrate and Nitrite Downstream
(a result of TKN conversion to Nitrate and Nitrite)
Nitrogen Species Discharge from Roger Rd
Total Dissolved Solids in LSCR (from ADEQ site near Cortaro Rd)
Direct Delivery of CAP 1992-1993
Increasing Sodium Adsorption Ratio
Technical Committee
Compiled Meeting Notes 87

2/8/2013
7
Report Outline
• Introduction• Water• Geomorphology
V t ti• Vegetation• Water Quality• Macroinvertebrates• Anticipated Changes in LSCR
– Possible Impacts of Water Quality upgrades – Possible Changes in Water Supply
‘..low species richness consistent with a stream with poor water quality (ADEQ, 1990).’
• Studies have recognized a lack of suitable substrate for macroinvertebrates (WERF 2000, Walker et. al 2005)
• Water quality is not conducive to a more • Water quality is not conducive to a more diverse population of macroinvertebrates, specifically:– High Ammonia and Total Kjeldahl Nitrogen– Low Dissolved Oxygen decreasing with
distance from outfall.
Report Outline
• Introduction• Water• Geomorphology
V t ti• Vegetation• Water Quality• Macroinvertebrates•• Anticipated Changes in LSCRAnticipated Changes in LSCR
–– Possible Impacts of Water Quality upgrades Possible Impacts of Water Quality upgrades –– Possible Changes in Water SupplyPossible Changes in Water Supply
Expected Water Quality Changes from ROMP
Existing Concentration (mg/liter)
Anticipated Concentration (mg/liter)
Ina Rd WRF Roger Rd WRF Ina Rd WRF Roger Rd WRF
Nitrogen 26 31 2.5 2.3
Phosphorus 3.4 4 < 1 < 1
BOD 12 10 2.4 2.7
TSS 7 16 3.1 3.3
Data Source: RWRD, Compliance and Regulatory Affairs Office, April 2011
Expected Effects of Water Quality Changes on Physical Processes
• Reduction of the biotic component of the clogging layer, and associated interstitial trapping of fines (Case, 2012).
• Increased infiltrationMore water availability closer to point of – More water availability closer to point of generation
– Less water available at the distal end of the reach.
• Reduced biotic cohesion– Less trapping of small particles in the
schmutzdecke.– Change in sediment transport characteristics
of the effluent flows.
Possible Effects of Water Quality Changes on Biota
• Vegetation– Change in access to water because of
improved infiltration characteristics.• More access close to outfalls• Less access at distal end of reaches
– Reduced nitrogen loading may cause some shifts in the composition of wetland forbs.
– Increasing the salt load may favor tamarisk.• Macroinvertebrates
– Possible increased diversity because of less ammonia, TKN, dissolved oxygen and mean diel dissolved oxygen (Walker et al, 2005).
Technical Committee
Compiled Meeting Notes 88

2/8/2013
8
2005
Ina Road WRF24,939 AFY
Metropolitan Sewer Service Area
2005~70,000 AFY Effluent Generated
43
Roger Road WRF43,625 AFY
Randolph Park WRF3,362 AFY
2030
Plant InterconnectIna Road WRF
56,044 AFY
Metropolitan Sewer Service Area
2030~95,000 AFY Effluent Treatment Capacity
44
New Water Reclamation Campus35,858 AFY Randolph
Park WRF3,362 AFY
Anticipated Changes in SupplyEffluent Production at Roger and Ina WRFs
28,000 AFY SAWRSA
50% of what is recharged in managed recharge project, recharge has been declining
PC
OV TW
Providers
Met
10,000 AFY CEP
10% 90%
Not really intended for restoration in LSCR
PC and all the providers have plans to use effluent (TW says all by 2020) and effluent has been declining
Questions?
Technical Committee
Compiled Meeting Notes 89

2/12/2013
1
What is an Indicator?
Claire ZugmeyerEcologist
Sonoran InstituteJanuary 30, 2013
Indicator ‐ a measure or component from which conclusions on the
phenomenon of interest can be inferred
Living River Phenomenon – River HealthIndicators Standard Source and Type
Dissolved OxygenAmmoniaTotal phosphorousE. Coli
ADEQ: wildlife in effluentADEQ: wildlife in effluentHistoric (1992-1999 median)ADEQ: human health
Metals (As, Cd, Cu, Pb, Se, Zn)Aquatic InvertebratesFish
ADEQ: wildlifeBaseline informationBaseline information
Depth to groundwaterGroundwater variabilityRiparian vegetation
Scientific standardScientific standardBaseline Information
Annual report summarized other data
“Reviving River”Phenomenon = wetland quality pre/post ROMP upgrades
Develop a list of indicators that:• Give annual snap shot of wetland quality and/or condition • Help assess impacts of ROMP upgrades
Water Quality
W t Q tit
“Big Bins”
Groundwater
Wetland Vegetation
Water Quantity
Physical Characteristics Aquatic Animals
Groundwater
Terrestrial AnimalsHuman/Social
Technical Committee
Compiled Meeting Notes 90

2/12/2013
2
Road to Indicators
Water Quality
Water QuantityAquatic Animals
Groundwater
Wetland Vegetation
Wetland Monitoring Program (ie. QAPP – EPA approved data
ll ti / i iti l )Physical Characteristics Aquatic Animals
Terrestrial Animals
collection/acquisition plan)
Annual Report Indicators(ie. public communication tool)
Human/Social
Indicator Selection Timeline
Water Quality
Water QuantityAquatic Animals
Groundwater
Wetland VegetationJanuary Wetland Vegetation
Water Quality
February 3 more bins
Physical Characteristics Aquatic Animals
Terrestrial Animals Human/SocialMarch
AprilMay
3 more bins
Full Draft List
Final List
Technical Committee
Compiled Meeting Notes 91
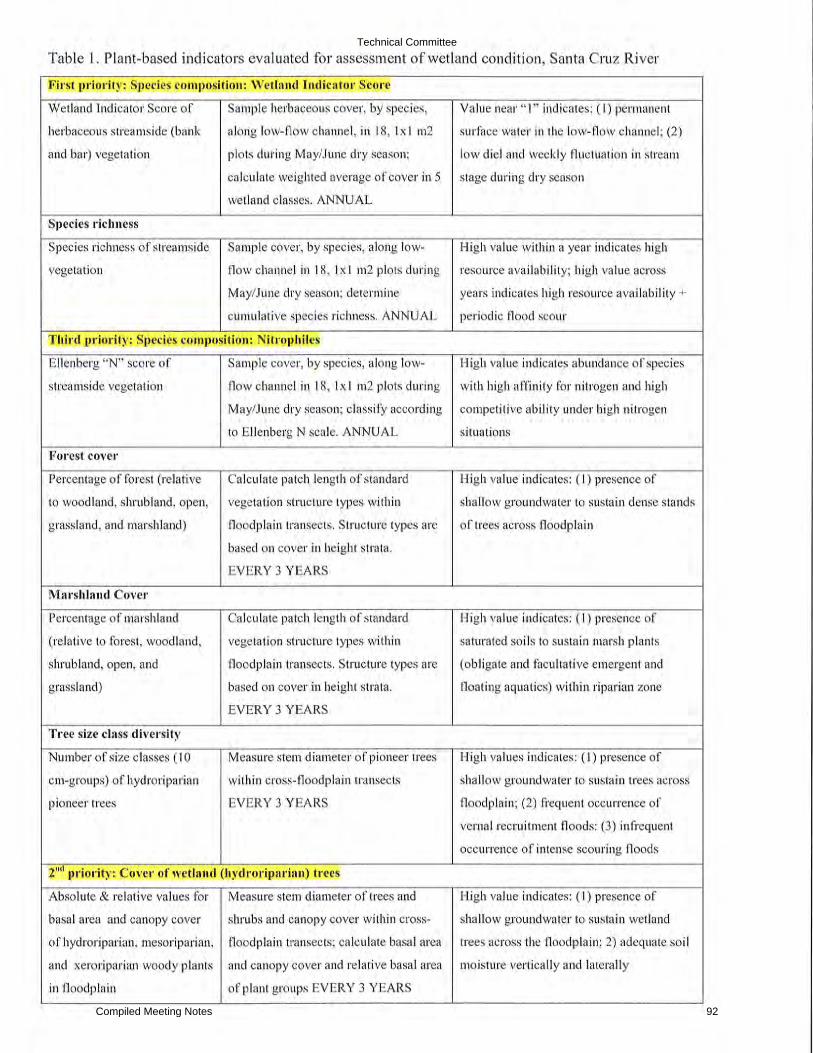
Technical Committee
Compiled Meeting Notes 92

Santa Cruz River Field Trip 01‐29‐13 Core question: How will wetlands change due to the man‐made interventions projected in the future? 08:00 Meet at WESC Lab (see map)
Pima County Can Provide Transportation (Van and Two Vehicles) Car Pool to First Site at Trico Rd
STOP 1 (08:45): Trico Road Gage Location – Evan Canfield (RFCD) Site Leader
USGS Gaging Station
Frequency of no‐flows historically
Projected frequency of no‐flows
Audubon project mitigation efforts STOP 2 (09:30): BOR Instream Recharge Project – Nathan Lehman (BOR) Site Leader
River Vegetation – divided channel
Pre‐1983 channel with mature riparian vegetation
Instream Recharge
STOP 3 (10:10): Cortaro Road Area – Patti Spindler (ADEQ) Site Leader
Ongoing ADEQ Macroinvertebrate Site
USGS Gaging Station
SC‐04 Sampling Site, if possible STOP 4 (11:00): Ina Road Wetlands and Riparian ‐ Julia Fonseca (PC OSC) Site Leader
Effects of grade controls.
Mature vegetation upstream of Ina Rd
Outfall from Ina
Mature Athel Forest in old gravel pit STOP 5 (12:00): Mature Goodding Willow Riparian in Entrenched Channel – Jim DuBois (RWRD) Site Leader
SC‐02 water quality sampling site
El Corazon project area. STOP 6 (12:30): Columbus Park: (Bathrooms here). – Evan Canfield (RFCD) Site Leader
River vegetation with and without effluent
ROMP will improve effluent quality, reduce discharge here but effects will be greater downstream. Return to WESC Lab around 1:00 Notes –
1. Expect to encounter mud, brush and cockleburs, so dress appropriately. 2. In order to keep on schedule, we encourage discussion in vehicles between stops.
Technical Committee
Compiled Meeting Notes 93

The Water & Energy Sustainability Center is at 3035 W El Camino del Cerro Rd. It is on the northwest side of Tucson. Coming south from Phoenix on I-10, look for the El Camino del Cerro exit, which is 2 miles south of the Orange Grove Rd exit. Turn west on El Camino del Cerro and look for the first entry point in the fence line along the south side of the road.
E I10W
I10
N BU
SINESS C
ENTER
W I1
0 E
XIT 2
52 O
FF RAM
P
E I10 FRONTAGE RD
E I10 EXIT 252 O
N R
AM
P
N S
ILVER
BELL R
D
W EL CAMINO DEL CERRO W EL CAMINO DEL CERRO
W I10 FR
ONTA
GE R
D
W RUTHRAUFF RD
Site entrance is an open gate in chain link fence. Follow the driveway until you come to a brand new building labeled “Water & Energy Sustainability Center.”
Building Entrance & Parking
Technical Committee
Compiled Meeting Notes 94

!
!
!
!
!
!
!
!
!
!
!
!
"6
"6
_̂
)
)
)
)
)
)5
4
3
2
1
6
SC-11
SC-10
SC-09
SC-08SC-07
SC-05
SC-04
SC-02
SC-12
SC-06
SC-03
SC-01
E I10W I10
W INA RD
N SILVERBELL RD
N SA
NDAR
IO R
D
N TR
ICO
RD
N LA
CHO
LLA B
L
W AVRA VALLEY RD
W TANGERINE RD
N LA
CAN
ADA D
R
N AN
WAY
RD
N TH
ORNY
DALE
RD
W I10 FRONTAGE RD
W MANVILLE RD
N SA
NDER
S RD
W MOORE RD
W RIVER RD
W PICTURE ROCKS RDN
CAMI
NO D
E OE
STE
W SILVERBELL RD
W MARANA RD
W TWIN PEAKS RD
N SH
ANNO
N RD
W GO
LDEN
GAT
E RD
W LAMBERT LN
W LINDA VISTA BL
W SUNSET RD
W MAGEE RD
N WA
DE R
D
W ORANGE GROVE RD
W CORTARO FARMS RD
N DO
VE M
OUNT
AIN
BL
W NARANJA DR
E I10 FRONTAGE RD
N KINNEY RDN RE
SERV
ATIO
N RD
N CORT
ARO RD
N FL
OWIN
G W
ELLS
RD
W GORET RD
N HA
RTMA
N LN
N FREEWAY
W TRICO MARANA RD
N EL
MOR
AGA D
R
N CA
MINO
DE
OEST
E
N SA
NDAR
IO R
D
N AN
WAY
RD
W MOORE RD
W TWIN PEAKS RD
W I10 FRONTAGE RD The information depicted on this display is the result of digital analyses performed on a variety of databases
provided and maintained by several governmental agencies.The accuracy of the information presented is limited tothe collective accuracy of these databases on the date
of the analysis. The Pima County Regional Flood Control District makes no claims regarding the accuracy of the information
depicted herein.This product is subject to the GIS Division Disclaimer
and Use Restrictions.
Lower Santa Cruz RiverField Trip
Pima County Regional Flood Control97 East Congress Street - 3rd FloorTucson. Arizona 85701-1207(520)243-1800 - FAX (520)243-1821http://www.rfcd.pima.gov
Date:
1 inch = 3,000 feet
) Field Trip Site_̂ WESC Lab
ADEQ Sampling Sites"6 USGS Stream Gauge! RWRD Sampling Sites
Study Reach (Lower Santa Cruz River)
0 6,750 13,500 20,250 27,0003,375Feet
©
Ina Rd. WRF
Roger Rd. WFR
Aerial photo was taken in 2011
Technical Committee
Compiled Meeting Notes 95
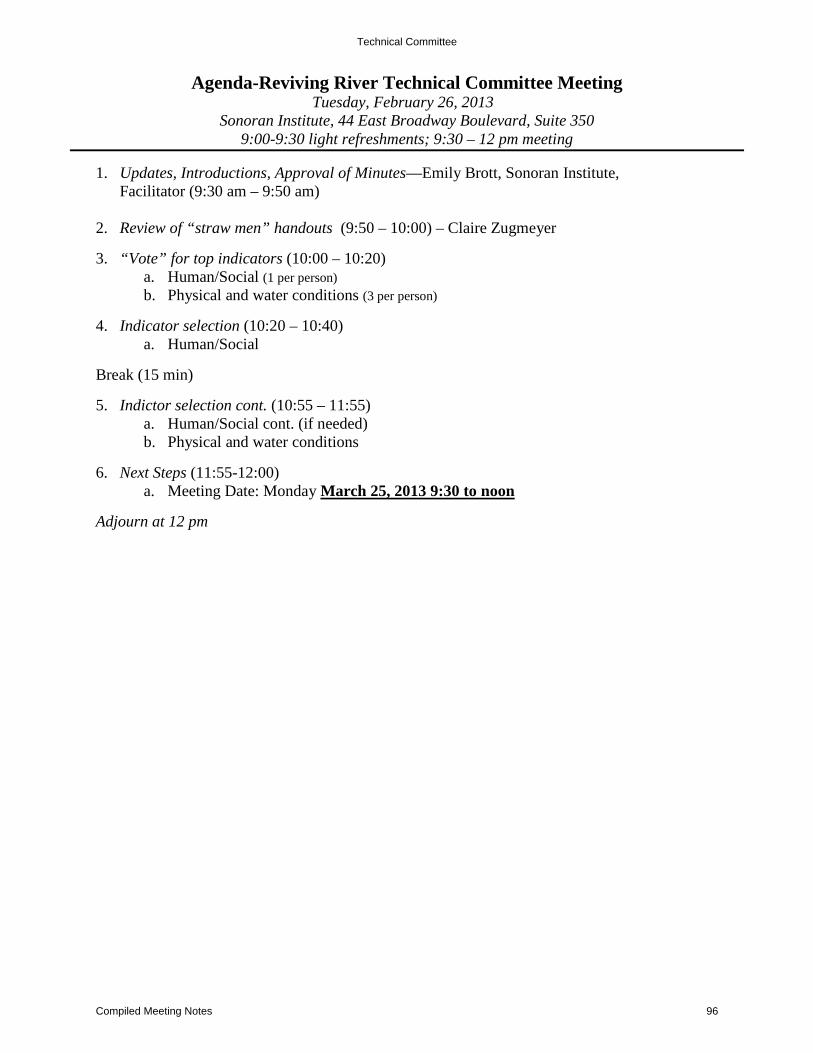
Agenda-Reviving River Technical Committee Meeting Tuesday, February 26, 2013
Sonoran Institute, 44 East Broadway Boulevard, Suite 350 9:00-9:30 light refreshments; 9:30 – 12 pm meeting
1. Updates, Introductions, Approval of Minutes—Emily Brott, Sonoran Institute,
Facilitator (9:30 am – 9:50 am)
2. Review of “straw men” handouts (9:50 – 10:00) – Claire Zugmeyer 3. “Vote” for top indicators (10:00 – 10:20)
a. Human/Social (1 per person) b. Physical and water conditions (3 per person)
4. Indicator selection (10:20 – 10:40)
a. Human/Social
Break (15 min)
5. Indictor selection cont. (10:55 – 11:55) a. Human/Social cont. (if needed) b. Physical and water conditions
6. Next Steps (11:55-12:00)
a. Meeting Date: Monday March 25, 2013 9:30 to noon
Adjourn at 12 pm
Technical Committee
Compiled Meeting Notes 96
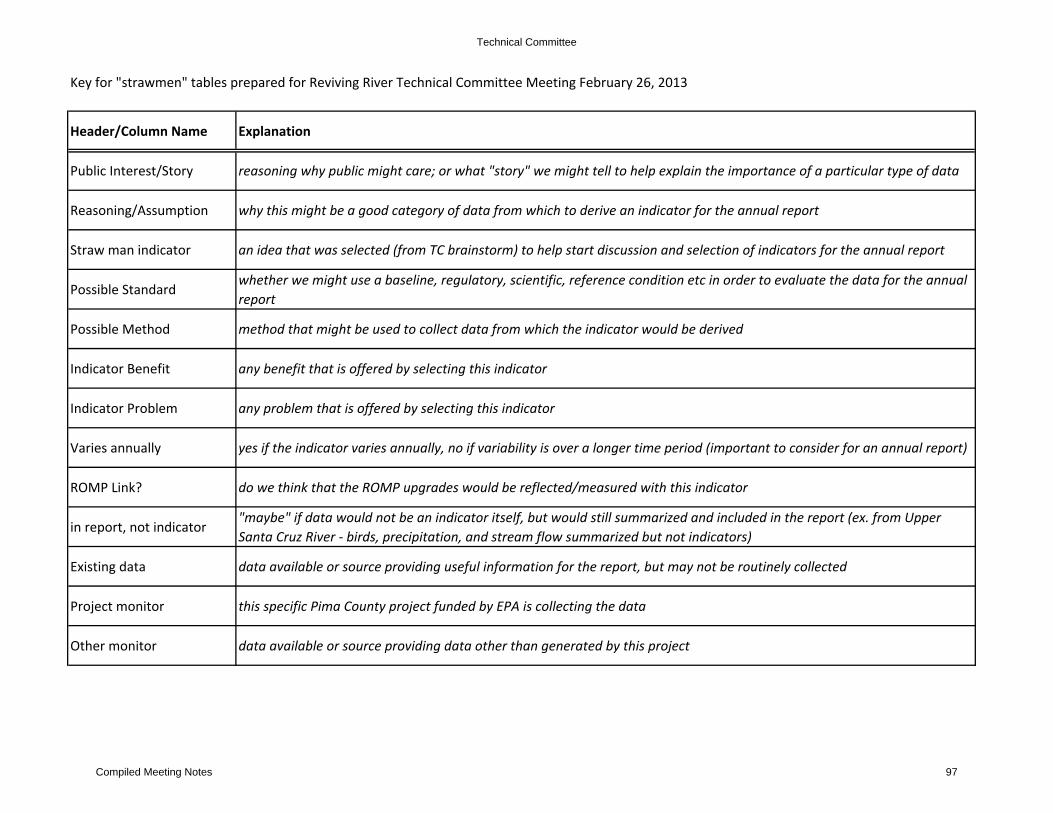
Key for "strawmen" tables prepared for Reviving River Technical Committee Meeting February 26, 2013
Header/Column Name Explanation
Public Interest/Story reasoning why public might care; or what "story" we might tell to help explain the importance of a particular type of data
Reasoning/Assumption why this might be a good category of data from which to derive an indicator for the annual report
Straw man indicator an idea that was selected (from TC brainstorm) to help start discussion and selection of indicators for the annual report
Possible Standardwhether we might use a baseline, regulatory, scientific, reference condition etc in order to evaluate the data for the annual report
Possible Method method that might be used to collect data from which the indicator would be derived
Indicator Benefit any benefit that is offered by selecting this indicator
Indicator Problem any problem that is offered by selecting this indicator
Varies annually yes if the indicator varies annually, no if variability is over a longer time period (important to consider for an annual report)
ROMP Link? do we think that the ROMP upgrades would be reflected/measured with this indicator
in report, not indicator"maybe" if data would not be an indicator itself, but would still summarized and included in the report (ex. from Upper Santa Cruz River ‐ birds, precipitation, and stream flow summarized but not indicators)
Existing data data available or source providing useful information for the report, but may not be routinely collected
Project monitor this specific Pima County project funded by EPA is collecting the data
Other monitor data available or source providing data other than generated by this project
Technical Committee
Compiled Meeting Notes 97

Indicator Discussion "strawmen" ‐ prepared for Reviving River Technical Committee Meeting February 26, 2013
HUMAN SOCIALPERCEPTION
Straw man Indicator
Possible Standard Possible Method Indicator Benefit Indicator Problem
Varies Annually
ROMP Link?
in report, not indicator
Existing Data
Project Monitor
Other Monitor
odor baselineElectronic Nose, or number of odor complaints
already being collected at treatment plants (TPs); odor reflects water quality and will likely decrease with upgrades;
may be difficult to distinguish between odor from river, TPs, and sewers; would need additional monitoring to have odor data from other parts of the study reach
yes yes yesyes, only at TPs
?
Trash presence/absence; # of trash clean ups
baselineADEQ Narrative Standard, ADEQ Trash protocol
some recent polling suggests public view the river as full of trash ‐ could provide data supporting the issue and may lead to efforts to address it?
no plan to directly address this with ROMP upgrades and no clear way how to measure this effectively.
no maybe? ?yes, general presence
?
SOCIOECONOMIC
property values baseline; reference reaches?
PC Assessed Value of Property
can likely be derived from existing data sources; may reflect change in perception
yes yes maybe yes no yes?
RECREATION
bike use/trip counts on river parks
baseline?Trip Count collection w/ data logger
if increases, can help reverse negative impressions of the river
would require data collection; may not change during the grant period; may require more than simply ROMP upgrades to have increase. Ex. may need promotion, signs, trash removal etc
yes maybe maybe ? no ?
HERITAGE
# of cultural resources found in/near the wetlands
?Number of Cultural Sites
foundhelps promote link between river and heritage not likely to change during the grant period no? no
maybe, could help with intro/ story
PC Cultural Resources
noPC Cultural Resources
Public Interest/Story: cultural heritage helps tell the story and attract public interestReasoning/Assumption: there is a strong link between the river and our cultural resource/heritage
Public Interest/Story: people have bad perception of the river/effluent because of odor, trash, homeless communities etc. Reasoning/Assumption: tracking an indicator associated with bad perception provides an opportunity to alter perception
Public Interest/Story: people relate to monetary valueReasoning/Assumption: improvements to the wetland quality/quantity may change socioeconomic value of the study reach; there is economic value of upgrade and/or high quality wetlands
Public Interest/Story people like to spend time in nice outdoor spacesReasoning/Assumption: recreation is linked to public perception of the area ‐ high use is positive perception; may increase over time with reductions in odor, increasing amenities etc.
1
Technical Committee
Compiled Meeting Notes 98

Indicator Discussion "strawmen" ‐ prepared for Reviving River Technical Committee Meeting February 26, 2013
PHYSICAL AND WATER CONDITIONS 1INFILTRATION
Straw man IndicatorPossible Standard Possible Method Indicator Benefit Indicator Problem
Variable Annually
ROMP Link?
in report, not indicator
Existing Data
Project Monitor
Other Monitor
Point Measured infiltration rate
baseline; Past measures?
Temporary Piezometers (e.g. per Case, 2012)
estimate of clogging spatial variability; helpful for understanding clogging process
Point measures don't scale well; spatial variation may require a lot of measuring points
yes yesCase (2012)
no no
Annual Recharge Volume
baseline; Past measures?
Calculations in Managed Recharge Project;
easy to calculate with existing data for two phases of study reach; Phase I (Roger to Ina), Phase II (Ina to Trico)
Provides no actual info. on clogging layer; general measure for two Phases of study reach; somewhat skewed by credit formula that doesn't count storm days.
yes yes maybeManaged Recharge Project
noManaged Recharge Project
avg. thickness of clogging layer across transects
baselineField Measurement of point locations (e.g. per Natalie Case)
direct measure of biotic component of clogging layer presence; thickness linked to infiltration rate
spatial variation may require many points; no estimate of infiltration rate; some subjectivity in estimating thickness of layer
yes yesCase (2012)
no no
Percent Silt & Clay baseline Lab Particle Size analysisPercent fines correlated with interstitial (abiotic) clogging
Point measurements don't scale well; no info on biotic clogging component, affected by nutrients
yes? noCase (2012) U of A
no no
AQUATIC HABITAT
% riffle/run/pool and/or Embededness
baseline
field visual characterization of channel and habitat availability
helps explain changes in Macro/Fish data; can be collected as part of Macro data;
would require more field work if entire study reach is needed; may not have any change over three years; public likely more interested in direct measures of wildlife;
yes maybe ADEQyes (Macro)
ADEQ
pebble counts baselinePer ADEQ Pebble Count Method
sediment condition is linked to habitat for macroinvertebrates
may not have any change over three years; public likely more interested in direct measures of wildlife;
yes? no maybe ADEQYes (Macro)
ADEQ
GROUNDWATER DEPTH
SC wells data, continuous depths at Representative points
baseline
Depth to Water in wells (e.g. SC‐O1 to SC‐12), some continuous data (M. Liberti)
Tracks effect of recharge (i.e. groundwater/ surface water interaction); SC wells adjacent to river and most accessible for measures
could be complicated/confusing to describe to general public; water depth related to overall hydrologic cycle, not just recharge
yes no? maybe TW/ RWRD noTW/ RWRD
Public Interest/Story: important for wetland condition and health of vegetation along the river; people like to know that water is getting rechargedReasoning/Assumption: 1) rate of infiltration is impacted by presence of clogging layer, level of nutrients in the water, and sediment content of the stream bed. With nutrients decreasing, presumably rate of infiltration will increase. 2) demonstrating changes in infiltration could lend support for increasing recharge credit
Public Interest/Story: shallow groundwater supports wetland healthReasoning/Assumption: groundwater depths are a limiting factor in the system; may or may not be linked to infiltration rate?
Public Interest/Story: wetland quality influenced by physical characteristics that create habitat for aquatic life; Reasoning/Assumption: availability of certain physical characteristics determine if there is habitat for aquatic life ‐ thus indicator of wetland quality
2
Technical Committee
Compiled Meeting Notes 99

Indicator Discussion "strawmen" ‐ prepared for Reviving River Technical Committee Meeting February 26, 2013
PHYSICAL AND WATER CONDITIONS 2WATER QUANTITY
Straw man IndicatorPossible Standard Possible Method Indicator Benefit Indicator Problem
Variable Annually
ROMP Link?
in report, not indicator
Existing Data
Project Monitor
Other Monitor
Daily base area wet/dry
baselineMap high and low at representative reach
will quantify and track quantity of wetland (Julie Stromberg may have data)
may require more field work? yes yes Stromberg no maybe
Flow extent baselineFurthest extent of flow at Low/High Point of Year
could track quantity, infiltration, habitat; (Julie S. Data; USGS Stream Gauges)
must estimate low or high; requires field chase, maybe far into Pinal County where inaccessible
yes yes maybeApprox. (Gaylean)
no no
Stream Flow baselineUSGS Gage and RWRD Discharge Values
data being collected; reflects flood volumesmay have limited data if flows don't cross both stream gauges
yes yes maybeUSGS/ RWRD
yesUSGS/ RWRD
daily fluctuation or avg. effluent discharge
baseline; estimate base flow needs?
USGS Gage and RWRD Discharge Values (15 minute)
data available, will directly track vol. of water available for wetlands as effluent is removed from the system
yes yes maybe yes yes yes
CHANNEL MORPHOLOGY/CHARACTERISTICS
Overall channel location and/or elevation change
baselineOrthophoto and/or LiDAR Comparison of Low Flow Channel
Will give us an idea of where channel is stable and unstable; may help explain other indicator data
likely no annual change and more challenging to summarize importance for public, Orthophotos/LiDAR not available every year
no unclear maybeHist Cond Rept
no no
Phankuch Proper Functioning Condition
baselinePer ADEQ Sampling Method
Will be collected for Macro invertebrates at some sections; can help explain other indicator data
A few Individual reaches may not be adequate to characterize the River.
maybe no yesYes (Macro)
ADEQ
Cross‐section change baselineRepeat Cross‐Sections of Monumented sites
Some data available from USGS for Trico and Cortaro, updated every 2 weeks;
A few Individual cross‐sections may not be adequate to characterize the River.
yes? no yes no USGS
SEDIMENT TRANSPORT
Suspended Sediment Concent., Total Suspended Solids, Turbidity
baseline; regulatory
Lab tests or Turbidity Meter
linked to water quality? Indicator of erosion?may be difficult to explain, unless its something like turbidity that people can see themselves?
yes?yes, in part
maybe no no ?
Scour and Deposition
baseline Scour ChainsCurrently being collected by U of A, Scour is known to affect infiltration
Known to have great local variability maybe yes maybe no no U of A
Reasoning/Assumption: sediment transport is linked to water quality; And maybe infiltration?; Indication of erosion/deposition
Public Interest/Story: important for wetland condition; people love water in the river Reasoning/Assumption: 1)volume of water, number of floods, and wetted area influence wetland health; 2)provides important context and influences other indicators
Public Interest/Story: wetland quality and quantity influenced by physical characteristics; Reasoning/Assumption: repeated cross‐sections track changes in main channel; indicate floods, erosion, and other disturbances
Public Interest/Story: unclear; wetland amount and condition is linked to whether the river is eroding or depoisting sediments
3
Technical Committee
Compiled Meeting Notes 100

Notes, Living River Technical Committee Meeting Sonoran Institute, 44 E. Broadway Blvd., Tucson 85701 February 26, 2013 9:30 – 12:00 am 1. Welcome, Introductions & Approval of the minutes—Emily Brott, Sonoran
Institute welcomed everyone and began with introductions. • Technical Committee Members Attending: Jennifer Duan – University of
Arizona; James Dubois – Pima County Regional Wastewater Reclamation Department (PCRWRD); Eve Halper – Bureau of Reclamation (alternate); Akitsu Kimoto – Pima County Regional Flood Control District (PCRFCD); Kendall Kroesen – Tucson Audubon Society; Michael Liberti – Tucson Water; Jean McLain, University of Arizona; Brian Powell – Pima County Office of Conservation Science (PCOCS); Linwood Smith – ecological consultant; Julie Stromberg – Arizona State University; Robert Webb – US Geological Survey; Claire Zucker – Pima Association of Governments
• Others Attending: Evan Canfield, PCRFCD; Ed Curley, PCRWRD; Jacob Prietto, University of Arizona, Hydrology and Water Resources; and Claire Zugmeyer, Sonoran Institute.
• Updates/Announcements:
a. The date for Santa Cruz River Research Days has been finalized and will take place April 15-16, 2013. Abstracts are due March 8th.
b. March is Archaeology and Heritage Awareness month and booklets from Arizona State Parks are available for those interested.
c. Sonoran Institute was contacted by the Intermountain West Funders Network. They will be hosting their meeting in Tucson in April and will be touring the Santa Cruz River.
d. Historical Conditions report is almost complete. e. Pima County website for ‘library’ of Santa Cruz River publications
will be available soon. f. The EPA approved Pima County’s amendment to the Quality
Assurance Project Plan that addresses the collection of macroinvertebrate samples.
g. The project name “Reviving River” was reconsidered and replaced with “Living River” for the project and the annual publication.
i. Living River permits the concept to be used throughout the watershed and gives consistent recognition/messaging.
Technical Committee
Compiled Meeting Notes 101

• Notes from the Reviving River Technical Committee Meetings on January 30, 2013 were approved.
a. Motion to approve – Claire Zucker b. Second – Linwood Smith
2. Review of “straw men” handouts — Claire Zugmeyer reviewed the straw men
handouts that were developed for two types of data – Human/Social, Physical & Water Conditions – that might be considered for indicators in the annual report. The handouts highlighted a number of different ideas proposed in previous meetings that were grouped into general subcategories. Each subcategory had an explanation regarding why the public would be interested or how we might explain the importance of this particular type of data, as well as the reasoning or assumption for its inclusion. Possible indictors to measure or address the subcategory were listed in a matrix that included additional information to facilitate the selection process.
• Handouts: straw men indicator matrix and key explaining the different columns.
3. “Vote” for top indicators – To help facilitate discussion of indicators desired for the
annual report, each committee member was asked to vote for 4 straw men indicators (1 Human Social and 3 Physical and Water condition). If an indicator was not included in the handouts, members were welcome to suggest and vote for another idea. The “dot-voting” method consisted of sticky “dots” placed adjacent to the desired indicator, which were listed on large pieces of paper taped to the wall. Claire Zugmeyer placed sticky dots to reflect votes voiced from members who were joining the meeting by phone. The votes were tallied, summarized, and displayed for all to see using web conference software. The results of the votes for the straw men indicators are as follows (# votes – possible indicator):
• Human/Social 1. Perception
a) 7 - Odor b) 0 - Trash
2. Socioeconomic a) 0 - Property values
3. Recreation a) 4 - Public use/Trip counts on river parks
4. Heritage a) 0 - # Cultural resources found in/near wetlands
5. Other Human/Social Indicator Ideas a) No other ideas given
• Physical and Water Conditions 1. Infiltration
a) 0 - Point measured infiltration rate b) 6 - Annual recharge volume c) 2 - Avg. thickness of clogging layer across transects d) 0 - % silt and clay
2. Aquatic Habitat
Technical Committee
Compiled Meeting Notes 102

a) 5 - % riffle/run/pool of whole reach b) 0 - Pebble counts
3. Groundwater depth a) 0 – Santa Cruz wells data, continuous depths at representative
points 4. Water Quantity
a) 0 - Daily base area wet/dry b) 7 - Flow extent c) 3 - Stream flow d) 0 - Daily fluctuation or avg. effluent discharge
5. Channel Morphology a) 1 - Overall channel location and/or elevation change b) 1 - Pfankuck Proper Functioning Condition c) 0 - Cross-section change
6. Sediment Transport a) 7 - Suspended Sediment Concentration, Total Dissolved Solids,
Turbidity, or Total suspended solids b) 0 - Scour and Deposition
7. Other Physical/Water Condition Indicator Ideas a) No other ideas given
4. Indicator Selection – Human/Social — Much of the discussion regarding possible
indicators in this category focused on public perception and recreation. The group agreed to move two ideas forward for consideration.
• Odor - There was much discussion regarding the importance of odor as an indicator as there are anticipated changes and reductions in unpleasant odors.
1. Data is available from the treatment plants that could easily track any changes in odors produced at the plant.
2. Seems odor doesn’t track the interaction of people with river, while recreation does. However, odor has clear data that can demonstrate change over time.
• Public use/Trip counts - An indicator that tracked public use of the area could provide the intersection between human use and improvements in water quality. If the area is more attractive after the ROMP upgrades because of reductions in odor, there might be more people using the bike paths, going bird and wildlife watching, and enjoying river parks.
1. Pima Association of Governments collects data on bike use along the river.
2. Other possible sources of data to measure public use of the area need to be researched.
3. Trip counts may not be directly associated with river health, though could change over time.
• General Discussion: 1. The group was asked whether indicators in this category should be
formal indicators or whether simply reported more anecdotally within the report.
Technical Committee
Compiled Meeting Notes 103

2. The group likes the idea of indicators being flexible over time. There may be studies from UA that suggest different indicators or new findings.
5. [Break]
6. Indicator Selection – Physical and water conditions — The group agreed to move
several ideas forward for consideration. • Total Dissolved Solids, Turbidity, or Total Suspended Solids – all of these are
being collected and could be good indicators that are related to water quality 1. High levels of TDS becomes a concern for aquatic species.
• Suspended Sediment Concentration – In addition to giving you an idea of water quality, this measure would provide an idea of the scour and stability of the river.
1. Not currently being collected; estimate of cost associated with this indicator is necessary.
• % riffle/run/pool of whole reach – An indicator of this sort would provide an understanding of the available habitat for aquatic life.
1. Will be collected at locations where macroinvertebrates are sampled; is the whole reach needed?
2. Cost and methods to estimate this for the whole reach would need to be determined.
3. May not be applicable to the lower stretch of the reach that is very sandy and thus no riffles.
4. This measure is subjective and may not be easy to determine. • Water mass balance/Water budget – An indicator that measures or
summarizes annual recharge, flow extent, and stream flow. 1. Infiltration and presence of the clogging layer would be estimated
when considering the water mass balance. 2. Stream flow is measured by USGS stream gauges and annual recharge
is estimated with the managed recharge project. 3. Flow extent is measured occasionally by Pima County; could be
measured more regularly with students from UA. 4. Groundwater measures would not be needed. 5. Public will relate to recharge volume and surface flow extent, which
are an important part of the story. • Channel morphology – there were two indicators discussed for this idea
1. Overall channel location and/or elevation change a) Relates back to wetland extent; periodic Lidar data available b) Elevation change can give you an idea of channel stability c) Could be a covariate/event-driver for other indicators d) May be something we include in the first year report only
2. Pfankuck Proper Functioning Condition a) More information was needed to assess this measure.
Technical Committee
Compiled Meeting Notes 104

b) Can it give an overall change of context and does it permit comparison to other rivers? There was a vote for this if this measure was a good integrator of several factors.
7. Next Agenda/Date—The next meeting is set for Monday, March 25, 2013 from 9:30
to noon. Claire Zugmeyer reviewed the timeline. The March meeting would discuss possible indicators pertaining to water quality, aquatic animals, and terrestrial animals. We would use the same matrix handout/voting format for the next meeting, as it seems to have been useful for directing an efficient discussion. At the April meeting we will revisit the full draft list of indicators, the compilation selected during previous meetings.
Technical Committee
Compiled Meeting Notes 105

Agenda-Living River Technical Committee Meeting Monday, March 25, 2013
Sonoran Institute, 44 East Broadway Boulevard, Suite 350 9:00-9:30 light refreshments; 9:30 – 12 pm meeting
1. Updates, Introductions, Approval of Minutes—Emily Brott, Sonoran Institute,
Facilitator (9:30 am – 9:50 am)
2. Review of “straw men” handouts (9:50 – 10:00) – Claire Zugmeyer 3. “Vote” for top indicators (10:00 – 10:10)
a. Wetland Animals (1 per person) b. Water Quality (3 per person)
4. Indicator selection (10:10 – 10:40)
a. Wetland Animals
Break (15 min)
5. Indictor selection cont. (10:55 – 11:55) a. Wetland Animals cont. (if needed) b. Water Quality
6. Next Steps (11:55-12:00)
a. Meeting Date: Monday April 29, 2013 9:30 to noon
Adjourn at 12 pm
Technical Committee
Compiled Meeting Notes 106

Key for "strawmen" tables prepared for Reviving River Technical Committee Meeting March 25, 2013
Header/Column Name Explanation
Public Interest/Story reasoning why public might care; or what "story" we might tell to help explain the importance of a particular type of data
Reasoning/Assumption why this might be a good category of data from which to derive an indicator for the annual report
Straw man indicator an idea that was selected (from TC brainstorm) to help start discussion and selection of indicators for the annual report
Possible Standardwhether we might use a baseline, regulatory, scientific, reference condition etc in order to evaluate the data for the annual report
Possible Method method that might be used to collect data from which the indicator would be derived
Indicator Benefit any benefit that is offered by selecting this indicator
Indicator Problem any problem that is offered by selecting this indicator
Varies annually yes if the indicator varies annually, no if variability is over a longer time period (important to consider for an annual report)
ROMP Link? do we think that the ROMP upgrades would be reflected/measured with this indicator
in report, not indicator"maybe" if data would not be an indicator itself, but would still summarized and included in the report (ex. from Upper Santa Cruz River ‐ birds, precipitation, and stream flow summarized but not indicators)
Existing data data available or source providing useful information for the report, but may not be routinely collected
Project monitor this specific Pima County project funded by EPA is collecting the data
Other monitor data available or source providing data other than generated by this project
Technical Committee
Compiled Meeting Notes 107

Indicator Discussion "strawmen" ‐ prepared for Living River Technical Committee Meeting March 25, 2013
WETLAND ANIMALSMACROINVERTEBRATES NOTE ‐ already chosen and subcommittee will work on the indicator for this group
Reasoning/Assumption: 1) snapshot of water quality & stream habitat; macroinverts highly sensitive to enviro. changes; 2) would show changes post ROMP
FISH
Straw man IndicatorPossible Standard Possible Method Indicator Benefit Indicator Problem
Varies Annually
ROMP Link?
in report, not indicator
Existing Data
Project Monitor
Other Monitor
presence/absence baselinelook for fish while collecting macros
general observations combined with macroinvertebrate sampling
Hard to track relative changes with only presence vs absence; may not be able to tell species without catching the fish
yes yes maybe yes yes ?
relative fish numbers baselineseining and "shock
A combination of electroshocking, seining, and dipnetting could easily give relative changes in
Requires more field work than observations while yes yes ? no ?
Public Interest/Story: "wildlife" ‐ Direct measure of a biological component that is important for supporting other wildlife like fish, birds etc.; people like wildlife
Public Interest/Story: "wildlife" ‐ direct measure of wetland wildlife, people like wildlife; fish #s increasing in the Upper SCR was the "sexy" news item that caught people's attention
Reasoning/Assumption: 1) long‐lived & move throughout waterway, give idea of "bigger picture" (water quality, food web, vegetation/channel morph); 2) historically at start of study reach; 3) show changes of ROMP ‐ fish washed down in floods could survive; 4) one of the easier wildlife to track
1
relative fish numbers baselineand block"
dipnetting could easily give relative changes in fish numbers/species
doing macroinvertebrates. yes yes ? no ?
# species present baselineseining and "shock and block"
would highlight specific species supported by the wetlands
while the wetlands may be able to support fish, it may take a while for some to get "washed in" ; so there might not be changes during study period
yes yes yes no ?
BIRDS
# species baseline point countsthere is available data through Tucson Audubon point count data
birds are impacted by factors beyond local site, so may not reflect only ROMP upgrades or local wetland condition
yes uncertain maybe yes no yes
#obligate riparian/wetland bird species
baseline point counts could be derived from Tucson Audubon data? may require targeted sampling yes uncertain maybe yes? no yes?
AMPHIBIANSPublic Interest/Story people like wildlife;
Public Interest/Story: people like wildlife; measure of wildlife that could be impacted by wetland quality; has ecosystem service value through birding/tourismReasoning/Assumption: number of species present linked to wetland quality/condition
Reasoning/Assumption: number of species present linked to wetland quality/condition# species baseline ? Phil Rosen may have data may require targeted or additional sampling yes uncertain maybe likely no ?
1
Technical Committee
Compiled Meeting Notes 108

Indicator Discussion "strawmen" ‐ prepared for Living River Technical Committee Meeting March 25, 2013
WATER QUALITY ‐ 1
STANDARD MEASURES
Straw man IndicatorPossible Standard Possible Method Indicator Benefit Indicator Problem
Varies Annually
ROMP Link?
in report, not indicator
Existing Data
Project Monitor
Other Monitor
pH
regulatory? (permits usually restrict to range 6‐9)
field measureaffects solubility of substances in water and thus availability/toxicity to humans and wildlife; necessary to evaluate ammonia
not sure this would change much, hard to explain to public
yes maybe? maybe yes yes ?
dissolved oxygenregulatory (wildlife)
field measuresupports aquatic life, will likely improve; helps explain indicators like macros/fish
is quarterly data enough? May require some 24‐hr monitoring
yes yes yes yes ?
conductivitybaseline or reference
field measure quick easy estimate of total dissolved solids may be challenging to explain to public yes yes yes yes ?
Public Interest/Story: people like good water quality that is safe and supports wildlife
Reasoning/Assumption: quick easy measure of water quality and conditions necessary for aquatic life
2
total dissolved solidsbaseline or reference
grab sample/lab test
wildlife perspective ‐ impacts osmotic balance, water flow in/out of cells if too high or too low, so high levels have adverse effects; TDS levels expected to increase with more influent from CAP; drinking water perspective ‐ has a defined contaminant level
yes yes yes yes ?
turbiditybaseline or reference
field measure high levels degrade aquatic habitat may require additional field measure yes yes ? yes ?
NUTRIENTS
ammoniaregulatory (wildlife)
grab sample/lab testcould calculate % attainment; helps explain fish and macros
yes yes yes yes ?
phosphorusbaseline or reference
grab sample/lab test could calculate % attainment may have concerns related to eutrophication yes yes yes yes ?
b l
Reasoning/Assumption: direct measure of water quality 1) high nutrient loads lead to poor aquatic habitat; in excess can be toxic to aquatic life; 2) would show improvements from ROMP upgrades
total kjedahl nitrogenbaseline or reference
grab sample/lab test measure of total ammonia and organic nitrogen yes yes yes yes ?
nitrateregulatory (human)
grab sample/lab testnecessary nutrient for plant growth; can cause increased plant and algae growth
concerns are related to drinking water quality and eutrophication
yes yes yes yes ?
2
Technical Committee
Compiled Meeting Notes 109

Indicator Discussion "strawmen" ‐ prepared for Living River Technical Committee Meeting March 25, 2013
WATER QUALITY ‐ 2
OTHER ORGANIC CONSTITUENT
Straw man IndicatorPossible Standard Possible Method Indicator Benefit Indicator Problem
Varies Annually
ROMP Link?
in report, not indicator
Existing Data
Project Monitor
Other Monitor
E. coli
regulatory (human ‐ partial body contact)
grab sample/lab testindicates fecal contamination and possible human health risk; could calculate % attainment
people have little access to the river, so is fecal contamination a wading/swimming health risk?
yes yes yes yes ?
biological oxygen demandbaseline or reference
grab sample/lab testlinked to dissolved oxygen; measures amount of oxygen consumed and available for aquatic life; impacts aquatic habitat
more challenging to explain to public yes yes yes yes ?
total organic carbonbaseline or reference
grab sample/lab testaffects productivity of aquatic systems and treatment effects
yes yes yes? no ?
Reasoning/Assumption: direct measure of water quality as bacteria can cause impact health of humans wading/swimming in water
Public Interest/Story: people like good water quality that is safe and supports wildlife
3
INORGANICS
metals (copper, lead, zinc, mercury, selenium, arsenic, cadmium, chromium)
regulatory (wildlife)
grab sample/lab testcould calculate % attainment; could help explain fish and macros
yes yes yes yes ?
alkalinitybaseline or reference
grab sample/lab testlinked to aquatic life, measures ability to buffer from metal/acid pollution
yes yes yes yes ?
hardnessbaseline or reference
calculated from alkalinity
necessary for determining standards for metals yes? yes? yes yes ?
major cations/anionsbaseline or reference
grab sample/lab testhelps track changes in salinity that may impact plants that are less salt tolerant or infiltration through clay sealing
yes yes yes yes ?
EMERGING CONTAMINANTS
f th ld i dditi l li d i l b
Reasoning/Assumption: direct measure of water quality such as metal contamination that can impact wildlife or affect habitat quality
Reasoning/Assumption: water quality concern that can directly impact wildlife and human health; may be of greater concern in effluent dependent watersone or more of the following ‐ endocrine disruptor, caffeine, or pharmaceutical
baseline? grab sample/lab test emerging concern and "hot topic"
would require additional sampling and expensive lab analysis; direct impacts to weltand health unclear, may be more human health concern; many options to choose from
yes yes maybe yes no maybe
3
Technical Committee
Compiled Meeting Notes 110

Notes, Living River Technical Committee Meeting Sonoran Institute, 44 E. Broadway Blvd., Tucson 85701 March 25, 2013 9:30 – 12:00 am 1. Welcome, Introductions & Approval of the minutes—Emily Brott, Sonoran
Institute welcomed everyone and began with introductions. • Technical Committee Members Attending: Jennifer Duan – University of
Arizona; James Dubois – Pima County Regional Wastewater Reclamation Department (PCRWRD); Eve Halper – Bureau of Reclamation (alternate); Kendall Kroesen – Tucson Audubon Society; Michael Liberti – Tucson Water; Jean McLain, University of Arizona (by phone); Brian Powell – Pima County Office of Conservation Science (PCOCS); Linwood Smith – ecological consultant; Patti Spindler – Arizona Department of Environmental Quality (on the phone); Julie Stromberg – Arizona State University (submitted email votes only); Robert Webb – US Geological Survey; Claire Zucker – Pima Association of Governments
• Others Attending: Ed Curley, PCRWRD; Placido dos Santos, University of Arizona; Julia Fonseca, PCOCS; John Kmiec, Town of Marana; Jacob Prietto, University of Arizona, Hydrology and Water Resources; and Claire Zugmeyer, Sonoran Institute.
• Updates/Announcements: Emily gave a series of announcements that Evan Canfield wanted to share but was not able to attend the meeting. Many updates relate to discussion from the last meeting.
a. Historical Conditions Report – Completed. b. Vegetation Contract – in place with Harris Environmental Group–
Kickoff meeting was held 03-21-13. c. Macroinvertebrate contract – in place. d. Suspended Sediment Sampling – this year Jennifer Duan. e. Flow Extent – this year Jennifer Duan, possibly other means. f. There will likely be money for additional monitoring efforts after the
macroinvertebrate and vegetation work. g. QAPP for Vegetation and Suspended Sediment Sampling – prepared. h. Bike Path Use – some data obtained from PC and PAG, as well as
commitment to work with us for future years in coordinated effort. i. Park Use – data available on water use and vandalism. j. Macroinvertebrate field day at Cortaro site with Patti Spindler –
morning of April 17 (TC welcome to join if interested). k. PAG contacted about the idea of a walk through along the river. l. Pima County is looking into mass-balance diagrams.
Technical Committee
Compiled Meeting Notes 111

• Notes from the Living River Technical Committee Meetings on February 26, 2013 were approved.
a. Motion to approve – Linwood Smith b. Second – Brian Powell c. Discussion –
i. Do the indicators that received no “votes” (such as pebble count) mean they will no longer be considered as an indicator?
1. Data may still be collected, even if not selected as an indicator for the annual report. Indicators in the report are meant to be those that people can easily relate to, while also helping explain the science.
2. There will be the opportunity to revisit indicators in the future and change what we use in the annual report if we find better options.
3. Pebble count will likely be discussed again as a potential indicator for macros.
2. Review of “straw men” handouts — Claire Zugmeyer reviewed the straw men
handouts that were developed for the data – Wetland Animals, Water Quality – that might be considered for indicators in the annual report. The handouts highlighted a number of different ideas proposed in previous meetings that were grouped into general subcategories. Each subcategory had an explanation regarding why the public would be interested or how we might explain the importance of this particular type of data, as well as the reasoning or assumption for its inclusion. Possible indicators to measure or address the subcategory were listed in a matrix that included additional information to facilitate the selection process.
• Handouts: straw men indicator matrix. 3. “Vote” for top indicators – To help facilitate discussion of indicators desired for the
annual report, each committee member was asked to vote for 4 straw men indicators (1 Wetland Animal and 3 Water quality). If an indicator was not included in the handouts, members were welcome to suggest and vote for another idea. The “dot-voting” method consisted of sticky “dots” placed adjacent to the desired indicator, which were listed on large pieces of paper taped to the wall. Claire Zugmeyer placed sticky dots to reflect votes voiced from members who were joining the meeting by phone. The votes were tallied, summarized, and displayed for all to see using web conference software. The results of the votes for the straw men indicators are as follows (# votes – possible indicator):
• Wetland Animals 1. Macroinvertebrates – already chosen and thus not part of vote (a
subcommittee will determine the best way to summarize the data); 2. Fish
a) 1 – Presence/absence b) 0 – Relative numbers c) 3 – # species
3. Birds
Technical Committee
Compiled Meeting Notes 112

a) 7 - # species and #obligate riparian species (these two measures were lumped into one category)
4. Amphibians a) 1 - # species
• Water Quality 1. Standard Measures
a) 0 - pH b) 10 - dissolved oxygen c) 0 - conductivity d) 6 - total dissolved solids e) 0 - turbidity
2. Nutrients a) 9 - ammonia b) 0 - phosphorus c) 0 - total kjedahl nitrogen d) 1 – nitrate
3. Other Organic Constituent a) 0 - E. coli b) 2 - biological oxygen demand c) 1 - total organic carbon
4. Inorganics a) 6 - metals (copper, lead, zinc, mercury, selenium, arsenic,
cadmium, chromium) b) 0 - alkalinity c) 0 - hardness d) 0 - major cations/anions
5. Emerging Contaminants a) 2 - one or more of the following - endocrine disruptor, caffeine,
or pharmaceutical 6. Other Water Quality Indicator
a) Biomass index
4. Indicator Selection – Wetland Animals — The group agreed to move several ideas forward for consideration in addition to macroinvertebrates. At this time it was unclear whether data from additional wetland animals would be a formal indicator or simply anecdotal data shared in the report.
• Macroinvertebrates – already selected to be an indicator. • Birds – while the best measure to summarize available bird data was not yet
clear, the group agreed that birds would provide important information about the wetland ecosystem.
1. Data from Tucson Audubon could provide both counts of overall species and obligate riparian species.
2. Focusing on obligate species may permit the use of volunteers or citizen scientists who can search for a few specific species.
3. We may want to budget for additional targeted surveys beyond the Tucson Audubon data.
Technical Committee
Compiled Meeting Notes 113

4. Birds may be best as a long term indicator, as they may not respond quickly to the changes in water quality. Obligate species could also be responding to other factors than what is being measured.
5. Birds reflect economic interest with tourism related to birding. • Fish – while observations of fish could occur during the macroinvertebrate
sampling, any formal fish indicator would likely require additional sampling particularly if species identification is desired.
1. Fish could be a good short term indicator of wetland conditions and improvements. Currently only mosquito fish in the river, but other native fish are found upstream of the study area and they could be washed down in floods.
• Amphibians – while there is likely some data available on amphibians this may simply be reported anecdotally rather than be a formal indicator.
1. There are no known populations of leopard frogs (though they had been abundant near A mountain in the past). Likely amphibians in the area are bullfrogs and Colorado River toads.
5. [Break]
6. Indicator Selection – Water Quality — The group agreed to move several ideas
forward for consideration. There was agreement that the indicators chosen reflected the desire to have indicators that the general public can relate to. Other indicators that received zero “dot” votes could always be added in at a later point in time as data is being collected for all.
• Dissolved Oxygen – very easy measure for people to understand 1. Likely requires additional sampling as this is not being measured when
water quality samples are collected quarterly. 2. May not be worth reporting without having a diel study. 3. Would be collected during sample collection of macroinvertebrates. 4. Claire Zugmeyer made the observation that fewer data points might
require a different reporting format than used on the Upper SCR. There may not be enough data for graphing.
• Biological Oxygen Demand (BOD) – This measure is closely related to dissolved oxygen, but more complicated for the public to understand.
1. This is being measured at the treatment plant and is a good measure of the treatment process.
2. Not traditionally measured in or associated with the river itself, rather more associated with the treatment plant.
3. Could be a measure that is an integrator of several factors, including E. coli.
• Ammonia – Of all the nutrient indicators, ammonia seems the most intuitive for the public and most important at least initially.
1. Ammonia is a limiting factor for aquatic communities, as it is toxic at high concentrations.
Technical Committee
Compiled Meeting Notes 114
2. We expect significant changes initially and later could switch to a different measure (nitrate, nitrite, total kjedahl nitrogen) if the committee desires.
• Total Dissolved Solids (TDS) – this measure was viewed as important both as an indicator of water quality and physical conditions.
1. The general TDS of the water is going up (CO river water has greater TDS). So TDS has a pattern independent of effluent.
2. High TDS concentrations constrain effluent reuse options. • Metals – the group agreed metals, either individually or as a combined value,
would be an important indicator. 1. Some of metals have not met the standards for the lower SCR.
• Other Discussion: 1. Nutrients
a) At some point it might be better to report nitrate levels which would be a better indicator of effluent which is supposed to be de-nitrified.
b) Perhaps a combination of total kjeldhal nitrogen, nitrate and ammonia? Or phosphorus.
2. Total organic carbon a) Will change because of treatment process, but unclear how it is
a factor in wetland health. b) In CA, this measure is important indicating the level of treated
wastewater that mixing with groundwater – tested in groundwater that is recovered for use as drinking water.
3. E. coli the group didn’t feel strongly that this had to move forward to the draft list. However, there were some arguments for including E. coli, so it could be added at a later time.
a) Usually a good indicator, but in this case, high levels are not coming from the treatment plant. Impacted by non-point source pollution and thus not linked to the treatment upgrades.
1. The fact that it is a non-point source could offer an educational opportunity.
b) There was concern that high levels would cause unnecessary concern for the public.
c) Could be something to consider in terms of wadeable stream standard and report this measure more anecdotally?
d) Could link with regional push to decrease E. coli and there is long term data in the southwest.
4. Emerging contaminants (EC) – there was good discussion about this topic, but the group agreed that this was not a good indicator at this time.
a) This is a very hot button topic and very new research. b) There is currently no single EC that could represent this larger
category. c) As research is so new, there are no clear standards – thus could
create unnecessary concerns.
Technical Committee
Compiled Meeting Notes 115

d) While the public is concerned about these issues, EC may be a more challenging indicator to explain and summarize simply.
e) EC is more of a research issue and we could refer more anecdotally to all the research being conducted. So it could be addressed, but not be an indicator.
f) Over time if there is an EC that warrants being an indicator, it could be added at that time.
5. Biomass index – this idea was brought up as a possible indicator that is linked to the clogging layer.
a) Discussed in thesis by Natalie Case. b) May be more related to the soil itself and thus a physical
parameter rather than an indicator of water quality. c) More information was needed to further discuss this idea.
7. Next Agenda/Date—The next meeting is set for Monday, April 29, 2013 from 9:30
to noon. At the April meeting we will revisit the full draft list of indicators, the compilation selected during previous meetings.
Technical Committee
Compiled Meeting Notes 116

Agenda-Living River Technical Committee Meeting Monday, April 29, 2013
Sonoran Institute, 44 East Broadway Boulevard, Suite 350 9:00-9:30 light refreshments; 9:30 – 12 pm meeting
1. Updates, Introductions, Approval of Minutes (9:30 am – 9:50 am) – Emily Brott
2. Finalize Indicator selection (9:50 – 10:40) – Claire Zugmeyer
a. Review/discuss possible indicators compiled from previous meetings b. Eliminate indicators? c. Add missing indicators?
Break (15 min)
3. Finalize Indictor selection cont. (10:55 – 11:55)
4. Next Steps (11:55-12:00)
a. Meeting Date: TBD - midsummer 2013
Adjourn at 12 pm
Technical Committee
Compiled Meeting Notes 117

24 Possible Annual Report Indicators ‐ compiled from previous Technical Meetings for the meeting on April 29, 2013
Possible indicator (*summary measure still to be determined)
Varies Annually
ROMP Link?
in report, not indicator Existing Data
Project Monitor
Other Monitor Notes
wetland indicator score yes yes ? yes ?hydroriparian tree cover maybe yes yes yes ?nitrophilic plants yes yes yes yes ?
odor yes yes yesyes, only at TPs
?
public use/trip counts on river parks yes maybe maybe yes no PC, PAG
diagram of inflitration and surface flow yes yes yes yes yes
flow extent yes yes Approx. (Gaylean)
yes no Jennifer Duan will measure in 2013
suspended sediment concent. yes?yes, in part
maybe no yes ADEQ1 ADEQ reported 'suspended solids/sediment'
total suspended solids yes?yes, in part
maybe no yes ADEQ1 ADEQ reported 'suspended solids/sediment'
turbidity yes?yes, in part
maybe no yes ADEQ1
% riffle/run/pool and/or Embededness ‐ Macro Sites only
yes maybe ADEQ yes ADEQ1
% riffle/run/pool and/or Embededness ‐ Full study reach
yes maybe no no no
overall channel location and/or elevation change
maybe unclear maybeHist Cond Rept
yes no Lidar and aerial photos every three years
Pfankuch Channel Stability Index at Macro sites
maybe no maybe ADEQ yes ADEQ1 discuss in terms of macro data?
BLM Proper Functioning Condition Index at Macro sites
maybe no maybe ADEQ yes ADEQ1 discuss in terms of macro data?
macroinvertebrates* yes yes yes yes ADEQ1
fish* yes yes maybe yes yes ? combined with macro
birds* yes uncertain maybe yes no yes would use Tucson Audubon data
amphibians* yes uncertain maybeyes (MHP & Arid West)
no ?
dissolved oxygen yes yes yes yes ADEQ1
biological oxygen demand yes yes yes yes ?
total dissolved solids yes?yes, in part
maybe no yes ?
metals (combined score for copper, lead, zinc, mercury, selenium, arsenic, cadmium, chromium)
yes yes yes yes ?# of samples that exceed standards for each of the metals
ammonia yes yes yes yes ?1 periodic data available
Wildlife
Water Quality
Wetland Veg
Human Social
Water Budget
Sediment Transport
Aquatic Habitat
Channel Character
Technical Committee
Compiled Meeting Notes 118
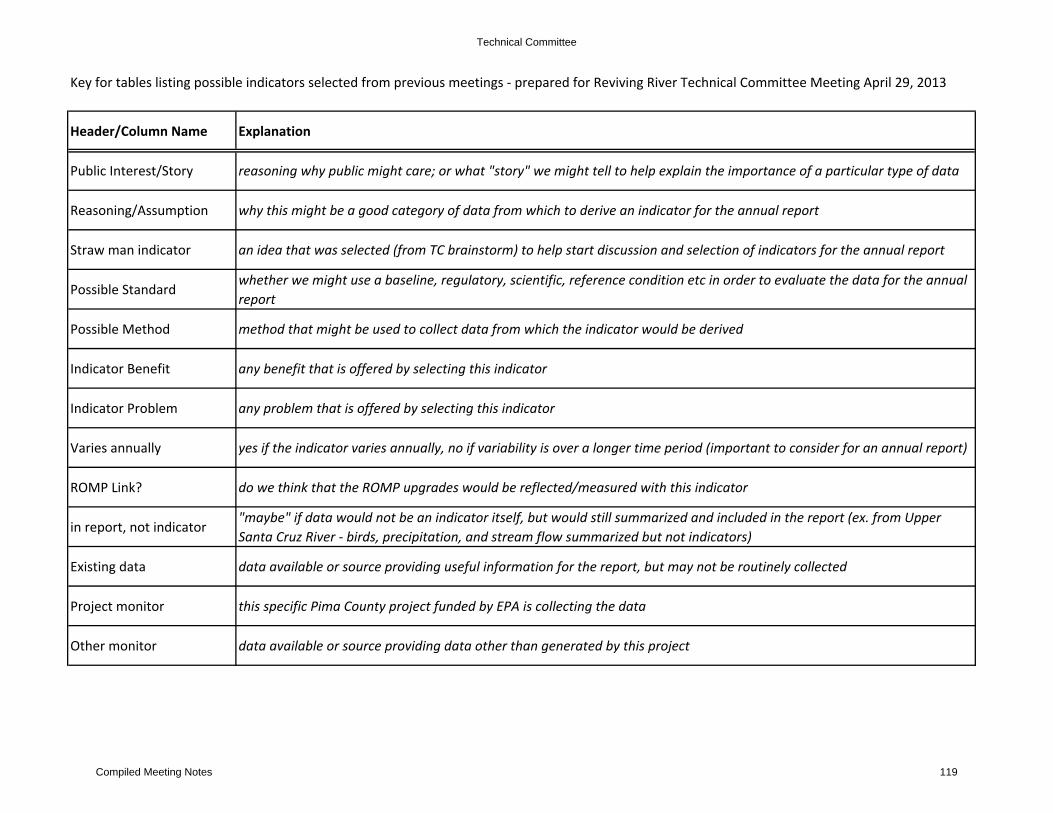
Key for tables listing possible indicators selected from previous meetings ‐ prepared for Reviving River Technical Committee Meeting April 29, 2013
Header/Column Name Explanation
Public Interest/Story reasoning why public might care; or what "story" we might tell to help explain the importance of a particular type of data
Reasoning/Assumption why this might be a good category of data from which to derive an indicator for the annual report
Straw man indicator an idea that was selected (from TC brainstorm) to help start discussion and selection of indicators for the annual report
Possible Standardwhether we might use a baseline, regulatory, scientific, reference condition etc in order to evaluate the data for the annual report
Possible Method method that might be used to collect data from which the indicator would be derived
Indicator Benefit any benefit that is offered by selecting this indicator
Indicator Problem any problem that is offered by selecting this indicator
Varies annually yes if the indicator varies annually, no if variability is over a longer time period (important to consider for an annual report)
ROMP Link? do we think that the ROMP upgrades would be reflected/measured with this indicator
in report, not indicator"maybe" if data would not be an indicator itself, but would still summarized and included in the report (ex. from Upper Santa Cruz River ‐ birds, precipitation, and stream flow summarized but not indicators)
Existing data data available or source providing useful information for the report, but may not be routinely collected
Project monitor this specific Pima County project funded by EPA is collecting the data
Other monitor data available or source providing data other than generated by this project
Technical Committee
Compiled Meeting Notes 119

Indicator Discussion "strawmen" ‐ prepared for Living River Technical Committee Meeting April 29, 2013
WETLAND ANIMALSMACROINVERTEBRATES NOTE ‐ already chosen and subcommittee will work on the indicator for this group
Reasoning/Assumption: 1) snapshot of water quality & stream habitat; macroinverts highly sensitive to enviro. changes; 2) would show changes post ROMP
FISH
Straw man IndicatorPossible Standard Possible Method Indicator Benefit Indicator Problem
Varies Annually
ROMP Link?
in report, not indicator
Existing Data
Project Monitor
Other Monitor
presence/absence baselinelook for fish while collecting macros
general observations combined with macroinvertebrate sampling
Hard to track relative changes with only presence vs absence; may not be able to tell species without catching the fish
yes yes maybe yes yes ?
# species present baselineseining and "shock and block"
would highlight specific species supported by the wetlands
while the wetlands may be able to support fish, it may take a while for some to get "washed in" ; so there might not be changes during study period
yes yes yes no ?
BIRDS
# species and/or #obligate riparian/ wetland bird species
baseline point counts could be derived from Tucson Audubon data?birds impacted by factors beyond local site, may not reflect only ROMP upgrades or local wetland condition; may require targeted sampling
yes uncertain maybe yes no yes
AMPHIBIANS
# species baseline ? Phil Rosen may have data may require targeted or additional sampling yes uncertain maybe likely no ?
WETLAND VEGETATION
wetland indicator scorenational scoring
field based transects/plots
tracks availability and permanence of surface water; can compare to other rivers
yes yes ? yes ?
hydroriparian tree coverbaseline or reference
field based transects/plots
tracks availability of shallow groundwater or surface water disribution across floodplain to support wetland trees
maybe yes yes yes ?
NitrophilesEllenberg score
field based transects/plots
tracks levels of nitrogen; could show changes with ROMP
yes yes yes yes ?
Public Interest/Story people like wildlife;
Public Interest/Story: "wildlife" ‐ Direct measure of a biological component that is important for supporting other wildlife like fish, birds etc.; people like wildlife
Public Interest/Story: "wildlife" ‐ direct measure of wetland wildlife, people like wildlife; fish #s increasing in the Upper SCR was the "sexy" news item that caught people's attentionReasoning/Assumption: 1) give idea of "bigger picture" (water quality, food web, vegetation/channel morph); 2) historically at start of study reach; 3) show changes of ROMP 4) one of the easier wildlife to track
Public Interest/Story: people like wildlife; measure of wildlife that could be impacted by wetland quality; has ecosystem service value through birding/tourismReasoning/Assumption: number of species present linked to wetland quality/condition
Reasoning/Assumption: number of species present linked to wetland quality/condition
Public Interest/Story: People like plants, trees and seeing vegetation along waterwaysReasoning/Assumption: wetland vegetation is a good visual indicator of wetland condition
1
Technical Committee
Compiled Meeting Notes 120

Indicator Discussion "strawmen" ‐ prepared for Living River Technical Committee Meeting April 29, 2013
WATER QUALITY
Straw man IndicatorPossible Standard Possible Method Indicator Benefit Indicator Problem
Varies Annually
ROMP Link?
in report, not indicator
Existing Data
Project Monitor
Other Monitor
dissolved oxygenregulatory (wildlife)
field measuresupports aquatic life, will likely improve; helps explain indicators like macros/fish
what is minimum sampling required? May require additional monitoring, such as 24‐hr
yes yes yes yes ?
total dissolved solidsbaseline or reference
grab sample/lab test
wildlife perspective ‐ impacts osmotic balance, water flow in/out of cells if too high or too low, so high levels have adverse effects; TDS levels expected to increase with more influent from CAP; drinking water perspective ‐ has a defined contaminant level
yes yes yes yes ?
ammoniaregulatory (wildlife)
grab sample/lab testcould calculate % attainment; helps explain fish and macros
yes yes yes yes ?
biological oxygen demandbaseline or reference
grab sample/lab testlinked to dissolved oxygen; measures amount of oxygen consumed and available for aquatic life; impacts aquatic habitat
more challenging to explain to public yes yes yes yes ?
metals (copper, lead, zinc, mercury, selenium, arsenic, cadmium, chromium)
regulatory (wildlife)
grab sample/lab testcould calculate % attainment; could help explain fish and macros
yes yes yes yes ?
HUMAN SOCIALPERCEPTION
odor baselineElectronic Nose, or number of odor complaints
already being collected at treatment plants (TPs); odor reflects water quality and will likely decrease with upgrades;
may be difficult to distinguish between odor from river, TPs, and sewers; would need additional monitoring to have odor data from other parts of the study reach
yes yes yesyes, only at TPs
?
RECREATION
public use/trip counts on river parks
baseline?Trip Count collection w/ data logger
if increases, can help reverse negative impressions of the river
would require data collection; may not change during the grant period; may require more than simply ROMP upgrades to have increase. Ex. may need promotion, signs, trash removal etc
yes maybe maybe yes no PC, PAG
Public Interest/Story: people like good water quality that is safe and supports wildlifeReasoning/Assumption: linked to ROMP upgrades, measures wetland quality,
Public Interest/Story: people have bad perception of the river/effluent because of odor, trash, homeless communities etc. Reasoning/Assumption: tracking an indicator associated with bad perception provides an opportunity to alter perception
Public Interest/Story people like to spend time in nice outdoor spacesReasoning/Assumption: recreation is linked to public perception of the area ‐ high use is positive perception; may increase over time with reductions in odor, increasing amenities etc.
2
Technical Committee
Compiled Meeting Notes 121

Indicator Discussion "strawmen" ‐ prepared for Living River Technical Committee Meeting April 29, 2013
PHYSICAL AND WATER CONDITIONSWATER MASS BALANCE/WATER BUDGET
Straw man IndicatorPossible Standard Possible Method Indicator Benefit Indicator Problem
Varies Annually
ROMP Link?
in report, not indicator
Existing Data
Project Monitor
Other Monitor
flow extent baseline field measure in June could track quantity, infiltration, habitat; requires field chase, maybe far into Pinal County where inaccessible
yes yes Approx. (Gaylean)
yes no
diagram of surface flows and infiltration
baselinecompliation of data sources
summarizes multiple data sources to tell story about water quantity and infiltration
not as simple of an indicator yes yes yes yes yes
SEDIMENT TRANSPORT
Suspended Sediment Concent., Total Suspended Solids, Turbidity
baseline; regulatory
Lab tests or Turbidity Meter
linked to water quality? Indicator of erosion?may be difficult to explain, unless its something like turbidity that people can see themselves?
yes? yes, in part maybe no yes (SSC) ?
AQUATIC HABITAT
% riffle/run/pool and/or Embededness ‐ Macro sites
baselinefield visual characterization of channel/habitat
helps explain changes in Macro/Fish data; can be collected as part of Macro data;
may not have any change over three years; public likely more interested in direct measures of wildlife;
yes maybe ADEQyes (Macro)
ADEQ
% riffle/run/pool and/or Embededness ‐ Full Study Reach
baselinefield visual characterization of channel/ habitat
helps explain changes in Macro/Fish data; can be collected as part of Macro data;
requires more field work if entire study reach is needed; may not have any change over three years; public likely more interested in direct measures of wildlife;
yes maybe ADEQ no ADEQ
CHANNEL MORPHOLOGY/CHARACTERISTICS
Overall channel location and/or elevation change
baselineOrthophoto and/or LiDAR Compare of Low Flow Channel
Will give us an idea of where channel is stable and unstable; may help explain other indicator data
likely no annual change and more challenging to summarize importance for public, Orthophotos/LiDAR not available every year
maybe unclear maybeHist Cond Rept
no no
Pfankuch channel stability or Proper Functioning Condition
baselinePer ADEQ Sampling Method
Will be collected for Macro invertebrates at some sections; can help explain other indicator data
A few Individual reaches may not be adequate to characterize the River.
maybe no maybe yesYes (Macro)
ADEQ
Public Interest/Story: unclear; wetland amount and condition is linked to whether the river is eroding or depoisting sediments
Public Interest/Story: important for wetland condition; people love water in the river, like to know that water is getting rechargedReasoning/Assumption: water quantity, estimated recharge levels, and flow extent provides important context and influences other indicators
Reasoning/Assumption: sediment transport is linked to water quality; And maybe infiltration?; Indication of erosion/deposition
Public Interest/Story: wetland quality influenced by physical characteristics that create habitat for aquatic life; Reasoning/Assumption: availability of certain physical characteristics determine if there is habitat for aquatic life ‐ thus indicator of wetland quality
Public Interest/Story: wetland quality and quantity influenced by physical characteristics; Reasoning/Assumption: repeated cross‐sections track changes in main channel; indicate floods, erosion, and other disturbances
3
Technical Committee
Compiled Meeting Notes 122

Notes, Living River Technical Committee Meeting Sonoran Institute, 44 E. Broadway Blvd., Tucson 85701 April 29, 2013 9:30 – 12:00 am 1. Welcome, Introductions & Approval of the minutes—Emily Brott, Sonoran
Institute welcomed everyone and began with introductions. • Technical Committee Members Attending: Placido dos Santos, University of
Arizona; Jennifer Duan – University of Arizona; James Dubois – Pima County Regional Wastewater Reclamation Department (PCRWRD); Eve Halper – Bureau of Reclamation (alternate); Akitsu Kimoto – Pima County Regional Flood Control District (PCRFCD); Kendall Kroesen – Tucson Audubon Society; Michael Liberti – Tucson Water; Jean McLain, University of Arizona (by phone); Brian Powell – Pima County Office of Conservation Science (PCOCS); Linwood Smith – consulting ecologist;
• Others Attending: Evan Canfield, PCRFCD; Ed Curley, PCRWRD; Julia Fonseca, PCOCS; John Kmiec, Town of Marana; Jacob Prietto, University of Arizona, Hydrology and Water Resources; and Claire Zugmeyer, Sonoran Institute.
• Updates/Announcements: a. Santa Cruz River Research Days on April 15 and 16, 2013 was a
success – thank you to all committee members who attended/participated in this event.
b. Patti Spindler led a macroinvertebrate training for the consultant who then collected samples the following two days (April 18 and 19).
i. Four sites were sampled and mosquito fish were observed at two of the sites downstream of Ina Road.
ii. A protocol for estimating blood worm populations was added to the macroinvertebrate survey methods
c. The 2nd quarter sampling for Water Quality is complete. d. The protocol for vegetation surveys and field site selection has been
completed by consultant, Harris Environmental. e. Jean McLain noted that ADEQ has funded a project for a graduate
student at University of Arizona to monitor bacteria levels along the Santa Cruz River from Nogales through Pima County. The project is looking at water quality and trying to identify the source of any bacteria found in the water.
• Notes from the Living River Technical Committee Meetings on March 25, 2013 were approved.
Technical Committee
Compiled Meeting Notes 123

a. Motion to approve – Linwood Smith b. Second – Brian Powell
2. Finalize Indicator Selection — This meeting was focused on finalizing the list of
indicators to be used in the annual report. Claire Zugmeyer provided a compilation of indicators identified in the previous three meetings. This included a list of 24 possible indicators which were discussed at length by the committee. Over the course of the meeting, TC members reviewed the compilation of indicators and discussed what needed to be eliminated and/or added to the list.
• Handouts: matrix of 24 possible indicators compiled from previous meetings. • Short list of indicators: Over the course of the meeting, the following
indicators were identified as important for inclusion as a formal indicator in the annual report.
a. Wetland indicator score – a vegetation measure that relates to availability of permanent surface water in the low flow channel.
b. Hydroriparian tree cover – a vegetation measure that relates to the availability of shallow groundwater to sustain wetland trees across the floodplain.
c. Nitrophyllic plants – a vegetation measure that relates to water quality, specifically nitrogen levels in the water.
d. Odor – a social indicator that relates to water quality. Flagged as needing more follow-up to determine how this might work and whether sufficient data is currently being collected by the wastewater treatment plants.
e. Flow extent – rough measure of water quantity. f. Macroinvertebrates – wildlife measure that relates to water quality. g. Fish – wildlife measure that relates to water quality and habitat.
Flagged as needing more follow-up to determine how this might work and whether targeted surveys are possible.
h. Dissolved oxygen – direct measure of water quality that is important for aquatic wildlife.
i. Biological oxygen demand – direct measure of water quality that relates to levels of dissolved oxygen. (Could be packaged with DO?)
j. Metals – direct measure of water quality; though different metals would be evaluated individually, they would be bundled together as one indicator.
k. Ammonia – direct measure of water quality that is expected to decrease with the treatment plant upgrades.
l. Total dissolved solids – a measure of salinity and water chemistry (important when considering the source of the water – CAP water has high TDS values, so this will increase).
m. Sediment transport/clarity – an indicator that would perhaps combine or discuss both Turbidity and Suspended sediment concentration. Flagged as needing more follow-up to determine how this might work.
• Short list of “side-bar” items: Over the course of the meeting there was discussion about several data types that would be important to include in the
Technical Committee
Compiled Meeting Notes 124

report, but not as a formal indicator. Rather this data would be reported in side-bars or as supplemental data to help tell the river’s story.
a. birds b. amphibians/turtles (if data available) c. peak flow d. stream flow e. precipitation f. storm event flows g. diurnal flow patterns h. water budget (estimated recharge and surface flow) – the graphic or
figure that would visually represent the volumes of water flowing in the river, recharging etc.
i. public use of the river (using trip counts and other data available from Pima Association of Governments and Pima County)
• Other General Discussion/Notes: a. Monitoring budget – collection of macroinvertebrate samples is
costing more than anticipated while vegetation surveys are costing less. There is a very limited amount of remaining funding for additional data collection (maybe $10-20,000 over the full 4 years), so we will need to be strategic.
b. Rainfall and peak discharge were not included in the final matrix; these are items that could be reported on to help explain the relationship between scour events and infiltration.
c. A graphic design element of side-bars, boxes, or insets could be used to add interesting information (such as extraordinary flow events).
1) Perhaps this is how data on amphibians and reptiles could be included.
d. % riffle/run/pool – how might this be used as an indicator? If we did a survey of the entire study reach, we would maybe find a very small percentage of these different categories, in particular the riffles. So would this be useful?
1) More likely best used as explanatory data for macroinvertebrates rather than an indicator in itself.
2) There could be observer bias when quantifying and classifying stretches of river as riffle vs. run.
3) This may require too much effort. e. Habitat suitability indexes may be useful for targeting specific species.
1) This was done in other areas with trout for example. For the SCR, perhaps it would be Longfin dace, which don’t require riffles/pools. Maybe stream temperature or use reference reach.
f. The matrix handout identified measures that might be in the report, but not as an indicator, with “maybe”. Of the 24 possible indicators in the matrix, 13 were identified with a “maybe” in this category. This left 11 that the group proposed discussing as the initial list of final indicators for the annual report.
Technical Committee
Compiled Meeting Notes 125

g. A measure of sediment transport was missing from the list of 11, thus adding something like suspended solids or total dissolved solids was viewed as worthwhile.
h. There was much discussion about the different ways to measure this – turbidity is good measure best for public understanding, Suspended sediment concentration is best for getting actual measure of sediment transport and thus channel change.
1) Total suspended solids not good for sandy environments and loses some representation of the river with the methodology.
2) Turbidity is very easy to measure; harder to figure out the best number of samples that will be representative to the study reach.
i. most days of the year the quality of the discharge will determine turbidity – so most days of the year, turbidity will work; other days with storm flows – more of a research question and not the goal of this report.
i. Fish species – not confident that we can determine all species present simply by making observations during the collection of macro invertebrate samples. May require targeted surveys.
j. Birds – hard to have this as a formal indicator because they are impacted by so many factors.
k. Channel character – 1) Proper functioning condition and Pfankuch channel
stability index are too coarse of measures. 2) Channel location – very interesting, but the public won’t
notice this change, they see the channel as the entire area between the bank protections.
l. We anticipate increased infiltration post upgrade – is this primarily straight down, or lateral movement as well?
1) Not sure at this point, likely most of the infiltration is straight down, with the exception of storm events.
m. Water budgets are difficult to calculate – thus the budget should be estimated and used to set context rather than be an indicator.
1) The indicators should be a firm measure 3. Next Agenda/Date—Claire Zugmeyer discussed that with the selection of a “final”
short list of indicators, the project had reached a transition point. The focus now is to take the short list and begin developing the annual report to discuss the chosen items. Future meetings will be to discuss data and proposed format for the report, among other things. A rough sketch of the report will help the group visualize how the narrative is coming together for this set of indicators and help validate selection; ie. Are the selected indicators and side-bars telling the story? Claire will be sending out a doodle poll for a midsummer meeting.
Technical Committee
Compiled Meeting Notes 126

Agenda-Living River Technical Committee Meeting Wednesday, September 4, 2013
Sonoran Institute, 44 East Broadway Boulevard, Suite 350 1:00 – 3:30 pm meeting
1. Introductions, Approval of Minutes (1:00 pm – 1:15 pm) – Emily Brott
2. Monitoring Data Updates (1:15 – 2:00) – Pima County Staff
a. Work completed/in progress
Break (15 min)
3. Indicator and Draft Format Review (2:15 – 3:15) – Claire Zugmeyer a. Review selected indicators and draft standards (discuss orange highlighted items) b. Review draft report structure c. Are we missing anything?
4. Next Steps (3:15 – 3:30) – Claire Zugmeyer
Adjourn at 3:30 pm
Technical Committee
Compiled Meeting Notes 127

Draft Living River indicators (as determined April 29, 2013) and their possible standards. Prepared for Technical Committee Meeting on September 4, 2013.
Original Bin
INDICATOR (black ‐ data collected or available, blue ‐ in development, Orange ‐ needs more discussion )
Standard Source/Type of Standard Analysis (by reporting reach) Graphic/illustration
wetland indicator scoreBaseline and/or reference condition from San Pedro River (Stromberg et al. 2005)
Stromberg JC, KJ Bagstad, JM Leenhouts, SJ Lite, E Makings. 2005. Effects of stream flow intermittency on riparian vegetation of a semiarid region river (San Pedro River, Arizona). River Research and Applications 21:925‐938
Average score, and increase, decrease, or no change
map/visual depiction of the type of plants found within reporting reaches; maybe show a "key" with classes 1‐5 next to visual representation of plants expected
hydroriparian tree cover baseline canopy cover and basal area baselinetotal or average? increase, decrease, or no change
map/diagram of basal area/canopy cover classes
nitrophilic plants baseline ellenberg score and % cover baseline increase, decrease, or no change ellenberg diagram…like Stromberg presentation
Human/ Social
odor at treatment plant ‐ fenceline and TP odor likely, still determining if more is possible
baseline of: # odor complaints within 2.5 mile buffer of TP; Hydrogen Sulfide (H2S) levels; dilutions to threshold values
baseline increase, decrease, or no changeLR style graph for levels of H2S; map of complaints and/or dilution to threshold contour lines about the plants
Water Budget
flow extent prior to monsoon season 1) in study area; 2) by reporting reach, or 3) overall, regardless of water source and study area
baseline distance in miles baseline increase, decrease, or no change map and/or visual representation of distance
suspended sediment concent.
Baseline or maybe median value of four samples ‐ 80 mg/L (can be used if have 4 samples within 5 years)
ADEQ: warmwaters (disclaimer that river is an effluent dependent, not warm water, standard doesn't apply)
median valueLR style graph? graph of all results with dotted line indicating median value?
pebble count that produces a %fines value (possible new indicator)
Baseline; <50% fines ADEQ: warmwaters (disclaimer that river is an effluent dependent, not warm water, standard doesn't apply)
increase, decrease, or no changeLR style graph? Though would only have 4 measures.
turbiditybaseline X NTU (very highly variable, may be hard to detect trends over time because very correlated with high flow events)
baseline # samples and and report avg & range of results?; increase, decrease, or no change
LR Style graph? With all values
Wetland Veg
Sediment Transport
Technical Committee
Compiled Meeting Notes 128

Draft Living River indicators (as determined April 29, 2013) and their possible standards. Prepared for Technical Committee Meeting on September 4, 2013.
Original Bin
INDICATOR (black ‐ data collected or available, blue ‐ in development, Orange ‐ needs more discussion )
Standard Source/Type of Standard Analysis (by reporting reach) Graphic/illustration
macroinvertebrates
baseline ‐ measured by % midges (pollution tolerant), % mayflies (Ephemeroptera, pollution intolerant), % caddisflies (Trichoptera, pollution intolerant), % dominant taxon (> 50% suggests environmental stress), # orders (measure of species/taxa richness); Density of midges; Simpson's diversity index
studies suggesting different measures (Patti summary)
% increase or decreasevisual depiction/illustration of species found; possible bar charts with % change over time/distance
fish (will be collected in November)
baseline number of species (native and non‐native) baseline increase, decrease, or no changevisual depiciton/illustration of natives either that are found; and others historically were found in study reach
dissolved oxygen>1 mg/L between sunset and 3 hrs after sunrise; >3 mg/L all other times
ADEQ: wildlife in effluent % samples meet standard LR Style graph
biological oxygen demand <5 ppm? (30 ppm for waste water treatment plant)
online table suggests 1‐2 is very good, 3‐5 is fair, 6‐9 is poor, >10 very poor (http://www2.vernier.com/sample_labs/ESI‐16‐bod.pdf)
% samples meet standard LR Style graph
total dissolved solids baseline and compare to "natural background" range ADEQ database % increase or decrease
metals (combined score for copper, lead, zinc, mercury, selenium, arsenic, cadmium, chromium)
varies by metal ADEQ: standard for wildlife overall % samples meet standard and number meeting standard per metal (list any value of exceedance)
ammonia varies with pH and temp ADEQ: wildlife in effluent % samples meet standard LR Style graph
SIDE BAR DATA ‐ Not evaluated with standards
Originial Bin
Topic Data reported Graphic/illustration
Human/ Social
public use/trip counts on river parks
# pedestrians, # bikes, # bird tours/field trips photos/illustration of use of the area
Water Budget
diagram of inflitration and surface flow
total effluent/stormwater inflow, total infiltration estimate, total outflow
summary diagram in the precipitation/stream flow intro
birds# natives and non‐natives; # rare bird sightings; exciting bird species observed
photo/illustration of native birds found in the area
amphibians # natives and non‐natives; photo/illustration of natives either that are found or historically were found in study reach
Wildlife
Wildlife
Water Quality
Technical Committee
Compiled Meeting Notes 129

General introduction – intro to the river’s story, desert streams/effluent dependence Map (showing 3 reporting reaches)
Notable findings (quick report highlights) Assessing the Health – intro to healthy river/ecosystem services and how the report works, description of the three reporting reaches Table with indicators and standards (explains the “groups” of indicators) Water Sources – explanation of the sources of water that flow in the river Precipitation and Streamflow –intro explaining how water quantity impacts most of the indicators and thus provides the context to help understand the changes we see. Summary with graphs/diagrams of the following:
USGS stream gauge data – peak flow, mean daily flow average Precipitation – total inches, breakdown into summer and winter Effluent discharge Diagram – total effluent/stormwater inflow, total infiltration estimate, total outflow
Indicator results grouped into sections: Water Budget/Flow extent prior to monsoon season– explanation regarding how this measure gives us a rough measure of quantity of river habitat dependent on flowing water, both aquatic and riparian. Water Quality – intro to aquatic ecosystems and how they need certain water quality (avg. and range of ph/temp) Dissolved Oxygen Biological Oxygen Demand Ammonia Metals TDS Wildlife – intro that riparian areas important to wildlife, some can be indicators of river health, while others , like birds are impacted by lots of factors…and still other wildlife are simply harder to observe/quantify Fish Macroinvertebrates
Side bars – birds, amphibians Sediment Transport/Channel Change (or some other name) – intro about how erosion/deposition of sediments result in channel change and impact aquatic habitat
Suspended Sediment Concentration Turbidity (could be included in Water Quality)
Vegetation – intro about riparian vegetation benefit…visual indicator of river health Wetland indicator score Hydroriparian tree cover Nitrophyllic plants Social – intro health/value of an area can be evaluated with social indicators, ie. land value increases near rivers etc.
Odor (related to water quality, but most impact is to humans? Explain as a social indicator?) Side bars – public use
Health Summary – Report summary of what was found Table with % attainment of standards
Ongoing or other work - could be a place to talk about other research that is being conducted? Acknowledgements Production Credits Ideas for back cover or a special section: We want to hear from you – Survey requesting report feedback (might be way to monitor/track project impact) Get Involved – suggestions for what people can do, go see, etc…
Technical Committee
Compiled Meeting Notes 130

Technical Committee
Compiled Meeting Notes 131
Technical Committee
Compiled Meeting Notes 132
Technical Committee
Compiled Meeting Notes 133

Technical Committee
Compiled Meeting Notes 134

Technical Committee
Compiled Meeting Notes 135
Technical Committee
Compiled Meeting Notes 136

Notes, Living River Technical Committee Meeting Sonoran Institute, 44 E. Broadway Blvd., Tucson 85701 December 12, 2013 1:30 – 3:30 pm 1. Welcome, Introductions & Approval of the minutes—Claire Zugmeyer, Sonoran
Institute welcomed everyone and began with introductions. • Technical Committee Members Attending: Jennifer Duan – University of
Arizona; Eve Halper – Bureau of Reclamation (alternate); John Kmiec, Town of Marana; Michael Liberti – Tucson Water; Jean McLain, University of Arizona; Brian Powell – Pima County Office of Conservation Science; Linwood Smith – consulting ecologist; Robert Webb, University of Arizona; Claire Zucker, Pima Association of Governments.
• Others Attending: Sarah Ashby, Sonoran Institute; Ed Curley, Pima County Regional Wastewater Reclamation Department; Jacob Prietto and Ryan Toomey, University of Arizona, Hydrology and Water Resources.
• Updates/Announcements: a. Santa Cruz River Research Days date is officially March 27-28, 2014
and will be downtown at the library on the bottom floor. Call for papers will go out in January.
b. Outreach on Living River Project – both Claire Zugmeyer and Evan Canfield gave presentations at the Arizona Hydrological Society (AHS) Symposium. Claire gave a similar presentation to the Tucson chapter of AHS. Claire also attended and briefly discussed the project at the Western Coalition of Arid States meeting in October.
c. Odor data looks promising and we should be able to represent data with map showing model of odor changes over time.
d. Todd McOmber, a UA graduate student that Jean McLain supervises is working on lower Santa Cruz. Arizona Department of Environmental Quality mentioned upper Santa Cruz River monitoring during a meeting; there is potential for joining of data sets.
• Notes from the Living River Technical Committee Meetings on September 4, 2013 were approved.
a. Motion to approve – Claire Zucker b. Second – Linwood Smith and Jean McLain
2. Monitoring Data Updates — There were two presentations given at the start of the
meeting. Copies of the powerpoint presentations are attached to these notes. • Fish: Claire Zugmeyer gave a quick presentation about the recent fish surveys.
a. Discussion - 1) The Living River report will have data on herps (likely
from Phil Rosen and Cecil Schwalbe).
Technical Committee
Compiled Meeting Notes 137
2) Do the falls at Ina discourage movement by fish? We are not sure, we could survey between Ina Falls and site #3.
3) Several native fish species, including two sucker fish were historically found in this reach of the river.
4) Next survey will be in fall Nov 2014 (annually). • Nitrogen and Vegetation: Ryan Toomey, a senior at the U of A and
recipient of the Leonard Halpenny Internship via AHS, shared plots of data he made while working with the Regional Flood Control District.
a. Discussion – 1) How did was total cover assessed? This was cover of
herbaceous/stream-side vegetation and part of the data collected by Harris Environmental in May 2013.
2) Other interesting graph would be to plot streamflow on a different axis. Data is on USGS website.
3. Reporting Reaches – draft names — Claire Zugmeyer began this discussion by reviewing the project timeline and reminding people of what we accomplished. Earlier in the year we discussed designing the Living River report to present data in three reaches. The group discussed a draft naming system for these reaches.
• Handouts: timeline handout to review project progress; map of the study area with draft reach names and monitoring sites.
• The draft names of Flowing Wells, Cortaro, and Marana were suggested to follow the model of the upper Santa Cruz series where reach names matched geography/towns. The idea is to have names that are meaningful to the public.
• While the group thought the names were intuitive, discussion suggested that these be modified and changed to the following:
o Three Rivers – reflects the reach between Roger and Ina that includes two major tributaries (Rillito and Canada del Oro)
o Cortaro Narrows o Marana Flats (Marana Farms was also considered; Flats was selected
because it’s a physiographic descriptor like the other reach names) • There was some discussion about the boundaries of the reaches and that we
might need to refine the boundary of the Three Rivers and Cortaro Narrows o The USGS stream gauges were not included on the map; the boundary
may be adjusted depending on where the stream gauge is located. o Claire Zugmeyer pulled up the reach justification handout (sent out
earlier in the year).
4. Indicator results – draft summaries — The previous meeting discussed flow extent and sediment transport at length. However, there still seemed to be some questions and room for clarification. Claire Zugmeyer presented some initial summaries of the data for these indicators to help facilitate the discussion and finalize selection.
• Handouts: Two handouts with draft summaries of the different indicators that fall under sediment transport and flow extent.
Technical Committee
Compiled Meeting Notes 138

• Sediment Transport: as previously discussed, this section of the report would include data on three indicators - % Fines, Turbidity, and Suspended Sediment Concentration.
1. % Fines and Turbidity are both fairly straightforward. There was discussion about perhaps removing data points influenced by storm flows if it was too confusing to include.
a) There is a control point upstream of the Roger outfall sampled during storm flows. This will help explain any patterns observed resulting from storm flows.
2. Suspended Sediment Concentration was plotted along with Total Suspended Solids (note - a typo in the handout incorrectly labeled this Total Suspended Sediments) – the suggestion for the committee to consider was to replace SSC with TSS for the following reasons:
a) SSC is a less reliable data stream; TSS is measured quarterly. b) TSS tracks SSC during baseflow conditions, which is what we
are most interested in. SSC is better when looking at conditions during stormflows.
3. After much discussion about SSC and the complex nature of this system, the committee agreed to replace SSC with TSS for this section of the report.
a) Many people are more familiar with TSS. b) TSS is measured at the treatment plant and better reflects the
effluent quality that we are concerned about. • Flow Extent: as previously discussed, flow extent would be the first section
following the discussion of stream flow and precipitation. Extent would be measured with two indicators, miles of flow and number of dry days at Trico.
1. Flow miles was discussed the most. a) Miles as graphed in the handout is not useful alone; the
committee recommended merging all the bars into one bar and graphing with measures of stream flow taken at this same time of year. Jennifer Duan’s data will provide measures of streamflow in addition to the USGS stream gauge. Including a baseflow measure of flow will help explain changes in extent.
1. Pima County annual effluent generation reports could be helpful.
b) Including a measure with % riffle/run/pool would be more informative regarding available habitat than just miles – but currently this type of data is not available.
c) While the upper Santa Cruz River saw significant reductions in flow extent over time, we may not see that same pattern in this study area. Ina water quality is not as bad as Roger – so we may not see as big of a change.
d) Stormflow scour events will be a big factor influencing this section – 1983 flood that dramatically increased infiltration and Trico Road crossing was dry for a year.
2. Number of dry days at Trico will be a useful measure to include.
Technical Committee
Compiled Meeting Notes 139

a) Could also include a “low flow” analysis where we determine the lowest flow recorded.
b) Interesting note - occasionally streamflows switch channels near the Trico gauge. The channel may be dry at the gauge, but flowing in an adjacent channel – and flow is still recorded as a “dry day”.
5. Next Steps Claire Zugmeyer thanked group for good discussion and stated that she thought we had our final list of indicators (swapping out SSC with TSS) and adding information to flow extent. The next meeting will be sometime in the Spring (TBD). The hope is to share draft summaries for the other indicators. Ed Curley made a final announcement. He congratulated Bob Webb and his coauthors for their upcoming book “Requiem for a River”. On behalf of Pima County, Ed also thanked the group for fantastic job this year and is looking forward to continued meetings and discussions.
Technical Committee
Compiled Meeting Notes 140

2013 Fish Survey Results
Claire Zugmeyer Living River Technical Committee Meeting
December 12, 2013
Technical Committee
Compiled Meeting Notes 141

Wildlife Indicator - Fish
• Indicator of river health/water quality
• Live for several years
• Historically several native fish species
Longfin dace
Technical Committee
Compiled Meeting Notes 142

First Annual Survey
• November 13, 2013
• Multi partner
• Four sites
Technical Committee
Compiled Meeting Notes 143

1
2
4
3
Technical Committee
Compiled Meeting Notes 144
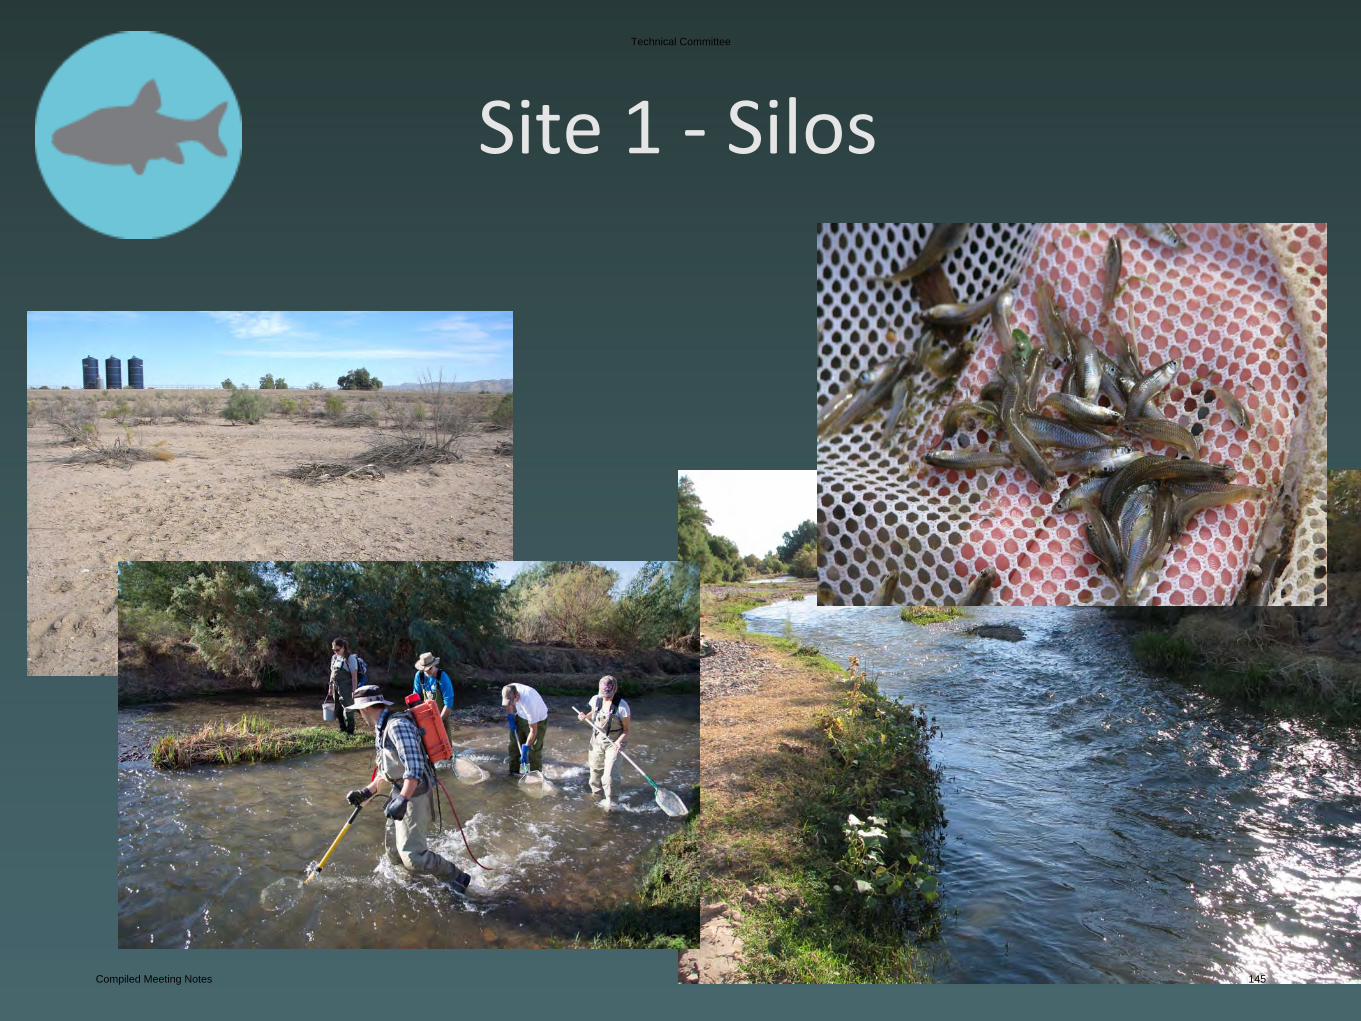
Site 1 - Silos Technical Committee
Compiled Meeting Notes 145

Site 2 - Cortaro Technical Committee
Compiled Meeting Notes 146

Site 3 - Silverbell Technical Committee
Compiled Meeting Notes 147

Site 4 - Roger Technical Committee
Compiled Meeting Notes 148

2013 data - fish at two sites
Silos 589 Western Mosquitofish
Cortaro 309 Western Mosquitofish
Silverbell No fish captured or observed;
Roger No fish captured or observed; a bullfrog and spiny soft-shell turtle were captured
Technical Committee
Compiled Meeting Notes 149

Spatial Analysis of Water Quality and Vegetation Data Along the Santa Cruz River
Ryan Toomey
Leonard Halpenny Intern
Assistance from Evan Canfield and Akitsu Kimoto of Pima County RFCD
Technical Committee
Compiled Meeting Notes 150

Technical Committee
Compiled Meeting Notes 151

y = -5.204ln(x) + 69.511 R² = 0.989
y = -4E-10x2 + 0.0001x + 0.1131 R² = 0.9985
0
1
2
3
4
5
6
7
8
9
0
5
10
15
20
25
30
35
0 20,000 40,000 60,000 80,000 100,000 120,000 140,000
Nitr
ate
+ N
itrite
(mg/
l)
Tota
l Kje
ldah
l Nitr
ogen
(mos
tly A
mm
onia
) mg/
l TKN (2013)
Ammonia (2013)
Nitrate+Nitrite (2013)
Ina Road Treatment Plant
Trico Road
Technical Committee
Compiled Meeting Notes 152

Changes in Vegetation Dynamics
Sunflower Helianthus annuus High affinity for nitrogen – Ellenberg’s N score = 8
Wild Petunia Calibrachoa parviflora Low affinity for nitrogen Ellenberg’s N score = 1
Technical Committee
Compiled Meeting Notes 153

y = -4E-10x2 + 0.0001x + 0.1131 R² = 0.9985
0
1
2
3
4
5
6
7
8
9
0
1
2
3
4
5
6
7
8
0 20,000 40,000 60,000 80,000 100,000 120,000 140,000
mg/
l
Elle
nber
g's N
Sco
re
Ellenberg's N Score Nitrate+Nitrite (2013) Technical Committee
Compiled Meeting Notes 154

0
1
2
3
4
5
6
7
8
0
10
20
30
40
50
60
70
80
90
100
0 20,000 40,000 60,000 80,000 100,000 120,000
Elle
nber
g's N
Sco
re
Tota
l Cov
er
Total Cover Ellenberg's N Score Technical Committee
Compiled Meeting Notes 155

Agenda-Living River Technical Committee Meeting Thursday, December 12, 2013
Sonoran Institute, 44 East Broadway Boulevard, Suite 350 1:30 – 3:30 pm meeting
1. Updates, Introductions, Approval of Minutes (1:30 pm – 1:50 pm) – Claire Zugmeyer
2. Monitoring Data - Updates (1:50 – 2:20)
a. Fish – Claire Zugmeyer b. Nitrogen and Vegetation – Ryan Toomey
3. Reporting Reaches – draft names (2:20 – 2:30)
4. Indicator results – draft summaries (2:30 – 3:20)
a. Sediment Transport b. Flow Extent
5. Next Steps (3:20 – 3:30)
a. Meeting Date: TBD, Spring
Adjourn at 3:30 pm
Technical Committee
Compiled Meeting Notes 156

Living River – Project Overview TIMELINE Brainstorm Large List September - December 2012 Select Indicators January – May 2013 Refine Selection September – December 2013 Review Draft Report Spring 2014 Release Living River Report #1 Summer 2014 Planning for Living River Report #2 Fall 2014 Review of Draft Report #2 Spring 2015 Release Living River Report #2 Summer 2015 Planning for Living River Report #3 Fall 2015 Review of Draft Report #3 Spring 2016 Release Living River Report #3 Summer 2016
Draft Indicator List, September 2013
Category Indicator
Wetland Vegetation
wetland indicator score
hydroriparian tree cover
nitrophilic plants
Human/ Social odor at treatment plant
Water Budget flow extent
Sediment Transport
suspended sediment concentration
percent fines
turbidity
Wildlife
macroinvertebrates
fish
Water Quality
dissolved oxygen
biological oxygen demand
total dissolved solids
metals (combined score for copper, lead, zinc, mercury, selenium, arsenic, cadmium, chromium)
ammonia
Technical Committee
Compiled Meeting Notes 157

!(
!(
G
#0
#0
#0
#0
$+
$+
$+
$+
$+
Marana
Cortaro
Flowing Wells
Ina Rd WRF
Roger Rd WRF Outfall
E I10W I10
W INA RD
N ORA
CLE R
D
W TANGERINE RD
N LA
CHO
LLA
BL
N LA
CAN
ADA
DR
W AVRA VALLEY RD
N SA
NDAR
IO R
D
N TR
ICO
RD
N 1S
T AV
N AN
WAY
RD
N TH
ORNY
DALE
RD
W MOORE RD
W RIVER RDW MANVILLE RD
W I10 FRONTAGE RD
W LAMBERT LN
W EL TIRO RD
N PU
MP S
TATIO
N RD
W PICTURE ROCKS RD
N CA
MINO
DE
OEST
E
W SILVERBELL RD
W MARANA RD
W MAGEE RD
N SH
ANNO
N RD
W G
OLDE
N GA
TE R
D
W ORANGE GROVE RD
W LINDA VISTA BL
N W
ADE
RD
W CORTARO FARMS RD
E INA RDN CORT
ARO RD
N CASA GRANDE HY
W HARDY RDW AVRA VALLEY RD
N AN
WAY
RD N 1S
T AV
Pima County Regional Flood Control District97 E Congress - 3rd Floor
Tucson, Arizona 85701-1207(520) 243-1800, FAX: (520)243-1821
http: //www.rfcd.pima.gov
The information depicted on this display is the result of digital analyses performed on a variety of databases
provided and maintained by several governmental agencies.The accuracy of the information presented is limited tothe collective accuracy of these databases on the date
of the analysis. The Pima County Regional Flood Control Dis trict makes no claims regarding the accuracy of the information
depicted herein.This product is subject to the GIS Division Disc laimer
and Use Restrictions .Date:
Lower Santa Cruz River Sampling Sites
RWRD WQ Sites_Active$+ Suspended Sed_Sites
Vegetation_sites#0 MI and Fish_SitesG ADEQ_Sites!( Outfall ©
0 4,600 9,200 13,800 18,4002,300Feet1 inch = 9,167 feet
Technical Committee
Compiled Meeting Notes 158

Sediment Transport Importance –
1) carries nutrients that support aquatic life, 2) can impact quality of aquatic habitat
We’re measuring this in three ways –Percent Fines, Turbidity, and Total Suspended Solids (Rather than Suspended Sediment Concentration) Maybe include some overall evaluation summary statement of what all three indicators are telling us about Sediment Transport
Percent Fines Relates to aquatic habitat. Gives us a measure of amount of fine sediments and materials that are deposited on the stream bed – ie too much results in “smothering” of aquatic life. Reference is 50% fines (regulatory standard for warm waters; no standard for effluent waters) 2013 Results Include evaluation summary statement
Flowing Wells samples from two sites resulted in values of 41% and 72% (50% attainment) Cortaro samples from one site resulted in a value of 70% (0% attainment) Marana samples from one site resulted in a value of 67% (0% attainment)
Pe
rce
nt
Fin
es (
de
term
ine
d b
y p
eb
ble
co
un
t)
0
25
50
75
100
Flowing Wells Cortaro Marana
Turbidity Standard visual indicator of water clarity or the amount of sediments and materials in the water. No regulatory standard. We are creating baseline with first year’s data or could compare to reference. 2013 Results Include evaluation summary statement Flowing Wells 3 samples ranged from 3.6 to 6.2 NTU Cortaro 6 samples ranged from 2.2 to 18.4 NTU, a single sample taken during summer
storm flows measured 50.7 NTU Marana 3 samples ranged from 8.4 to 89.9 NTU
Oct Nov Dec Jan Feb Mar Apr May Jun Jul Aug Sep
Tu
rbid
ity (
NT
U)
0
10
20
40
80Flowing WellsCortaroMarana*Influenced by storm flows *
Technical Committee
Compiled Meeting Notes 159

Sediment Transport - Continued Importance –
1) carries nutrients that support aquatic life, 2) can impact quality of aquatic habitat
We’re measuring this in three ways –Percent Fines, Turbidity, and Total Suspended Solids (Rather than Suspended Sediment Concentration) Maybe include some overall evaluation summary statement of what all three indicators are telling us about Sediment Transport
Total Suspended Sediments A measure of the amount of nutrients/materials transported in the water (best for base flows). High amount creates a “sandstorm” for aquatic life. No regulatory standard or reference 2013 Results Include evaluation summary statement Option 1 report by data point
Flowing Wells 4 of 6 samples met the standard (67% attainment)* Cortaro 8 of 11 samples met the standard (73% attainment)* Marana 5 of 11 samples met the standard (45% attainment)*
Oct Nov Dec Jan Feb Mar Apr May Jun Jul Aug Sep
To
tal S
usp
en
de
d S
olid
s (
mg/L
)
0
40
80
120
160
200
240
280
2000
4000
6000
Not Detected
*
*
Flowing WellsCortaroMarana*Influenced by storm flows
Suspended Sediment Concentration A measure of the amount of nutrients/materials transported in the water (measures storm flows well). High amount creates a “sandstorm” for aquatic life. Reference is 80 mg/L for the median of 4 samples (regulatory standard for warm waters; no standard for effluent waters)
2013 Results Include evaluation summary statement OPTION 1 REPORT BY DATA POINT
Flowing Wells 4 of 6 samples met the standard (67% attainment)* Cortaro 8 of 11 samples met the standard (73% attainment)* Marana 5 of 11 samples met the standard (45% attainment)*
*can we compare single samples to this standard?
Oct Nov Dec Jan Feb Mar Apr May Jun Jul Aug Sep
Su
sp
en
de
d S
ed
ime
nt
Co
nce
ntr
atio
n m
g/L
0
40
80
120
160
200
240
280
2000
4000
6000 Flowing WellsCortaroMarana
NOTE - Uncertain if data is influenced by stormflows
OPTION 2 REPORT BY MEDIAN
Flowing Wells samples from one site resulted in a median value of 25.2 (100% attainment)
Cortaro samples from two sites resulted in a median values of 15.6 and 21.0 (100% attainment)
Marana samples from two sites resulted in a median values of 42.3 and 723.6 (50% attainment)
Media
n S
uspended S
edim
ent C
oncentr
ation (
mg/L
)
0
40
80
600
800
Flowing Wells Cortaro Marana
NOTE - Uncertain if data is influenced by stormflows
Technical Committee
Compiled Meeting Notes 160

Flow extent Extent of water flowing in the riverbed is a rough measure of the water budget, local recharge, and the amount of aquatic habitat is available. We’re measuring this in 2 ways – Miles of Flow and Number of “Dry days” at Trico Maybe include some overall evaluation summary statement
Miles of flow Miles of flowing water estimated in June, the dry period prior to the start of the summer monsoon that represents the minimum extent of flow.
2013 Results There were approximately 26 miles of flow between Flowing Wells and Marana.
Flowing Wells Approximately 6 miles Cortaro Approximately 7.5 miles Marana Approximately 12.5 miles
Other overall measures to possibly report: • Approximately 32 miles from Flowing Wells to Pima County line* • Approximately 64 miles from the Flowing Wells into Pinal County*
*determining the extent of the effluent reach of the river is difficult beyond the study area as flows become mixed with agricultural runoff.
Approximate Miles of Flow
0 2 4 6 8 10 12 14
Marana
Cortaro
Flowing Wells
Number of “dry days” at Trico A stream gauge at Trio Road measures stream flow year round. The number of “dry days” or no flow give us an overall estimate of daily flow extent for the study area. 2013 Results There were no dry days at the Trico Road stream gauge during the 2013 water year. Could develop a graphic for comparing years is subsequent reports
Upper Santa Cruz River Comparison The river retreated approximately 8 miles between 2009 and 2010 (one year after upgrade and flow estimated in June 2009 and June 2010). By June 2013, river retreated over 9 miles from 2009 estimate.
Technical Committee
Compiled Meeting Notes 161

Appendix B - Technical Committee Biographies
* indicates alternate Placido dos Santos Plácido dos Santos is a consultant with WestLand Resources, Inc. He has over 28 years of experience in water resources and environmental management with much of the career focused on U.S.-Mexico border issues. Plácido served in senior positions with the Arizona Water Institute (AWI), the Arizona Department of Environmental Quality (ADEQ), the Arizona Department of Water Resources (ADWR) and the Central Arizona Project (CAP). He was also an Analyst with the University of Arizona’s Water Resources Research Center (WRRC.) He is a member of the U.S. National Climate Assessment Development and Advisory Committee (NCADAC) and has served on several other federal advisory bodies including the National Environmental Conflict Resolution Advisory Committee (NECRAC), the U.S. Governmental Advisory Committee (GAC) regarding North American environmental issues, and the Good Neighbor Environmental Board (GNEB) which advises the President and Congress on U.S.-Mexico border environmental issues. He was chairman of the GNEB and the GAC. Before entering public service Plácido was a mining geologist in Chile’s Atacama Desert and served honorably in the United States Marine Corps. Plácido earned a Bachelor's Degree in geology from the University of Colorado and performed graduate studies in geosciences at the University of Arizona. Jennifer G. Duan, Ph.D., P.E. Jenniferhas extensive research experience in hydraulics, hydrology, and sediment transport, both in experimental research and numerical modelling. She won National Science Foundation (NSF) CAREER Award from NSF Hydrological Science Program in 2008 to study flow field, sediment transport, and river meandering processes. She was funded by the Department of Defence University Research Instrument Program (DURIP) to build a large-scale infiltration flume at the University of Arizona, which will be used in this research. She has led several research projects funded by the Army Research Office, Terrestrial Science Program and the Corps of Engineers since 2001. She has over 20 papers in peer-reviewed journals and over 30 papers in per-reviewed conference proceedings. James (Jim) DuBois, R. G. Jim DuBois is an experienced hydrologist and registered geologist in the state of Arizona. He is currently employed as Principal Hydrologist for Pima County’s Regional Wastewater Reclamation Department. He has been in this position managing groundwater recharge, aquifer protection, surface water discharge, and reuse permit issues since 2008. Prior to joining Pima County, Mr. DuBois spent 2½ years as an Environmental Project Manager handling the City of Tucson’s MS4 permit responsibilities in the Stormwater Section of TDOT. Previously, he served as a Senior Hydrologist for ADEQ for 19 years, specializing in aquifer impact and discharge control technology related to mines, wastewater treatment, industrial facilities, and groundwater recharge. He has also worked for 5 years as a consulting geologist in Wisconsin, and for 3 years as an exploration geologist in Arizona and Wisconsin. Mr. DuBois holds a B.A. in geology from Carleton College and an M.S. in geology from the University of Kansas.

Nathan Lehman Nathan is a civil engineer for the Bureau of Reclamation’s Tucson Field Office. He graduated with a B.S. in Civil Engineering from the University of Arizona, and has focused on: engineering design and construction, water conveyance, groundwater recharge and water resource planning and management. *Eve Halper, Ph.D. Dr. Halper has served as a Natural Resource Specialist in the Tucson Field Office of the Bureau of Reclamation for the past ten years. She oversees water resource studies in the Sierra Vista Subwatershed, as well as the Green Valley and Nogales areas of the Santa Cruz Watershed. She received her Ph.D. from the University of Arizona in Geography, with a minor in Remote Sensing in May, 2011. Her research uses remote sensing and Geographic Information Systems to understand relationships between water use and the urban environment. She also holds degrees in Environmental Engineering and Environmental Science. Akitsu Kimoto, Ph.D., CFM Principal Hydrologist at Pima County Regional Flood Control District. She completed a Ph.D. in Agricultural Science in Kyoto University in 2003, a M.S. in Agricultural Science at Kyoto University, and a B.S. in Environmental Science at Hiroshima University. She has over 14 years of experience in watershed management, hydrology, sediment transport, and soil conservation. John Kmiec John is the current Utilities Director for the Town of Marana. Prior to joining Marana, John was the Environmental & Regulatory Compliance Supervisor for Tucson Water. John’s primary duties involved potable water and reclaimed water compliance, as well as coordinating research opportunities for Tucson Water. John is current committee chair of the State of Arizona’s Emerging Chemical Contaminant Committee. This committee is part of Arizona’s Advisory Panel on Emerging Contaminants. From 2009 through 2011, John served as the president of Watereuse AZ, the state chapter of the Watereuse Association. This association’s mission is to advance the beneficial use of recycled water and desalination. John holds a bachelors of Science from Michigan State University in geological sciences, as well as a master of public administration degree from Troy University. He is also a certified public manager (Arizona State University). Kendall Kroesen Staff member of Tucson Audubon (TA) since February 2002. During his first eight years he worked with the habitat restoration program and helped improve communications, especially via the website and newsletter. In 2010 he became the Habitats Program Manager and is helping TA create an urban-focused sustainability program. TA is working with businesses, homeowners, and landscape designers to better define the characteristics of urban landscapes that make them ecological sustainable and useful for declining populations of birds, as well as being productive for people. He also continues to direct riparian habitat restoration projects in the Tucson metro area. He has a BA in anthropology from the University of California, Riverside, and a Ph.D. in cultural anthropology from University of California, San Diego.

Michael F. Liberti As Groundwater Hydrologist for Tucson Water, Michael has spent the last 11 years in GIS/database development and management and describes his work as Hydrologic Cartographic Modeling. He began his Hydrology career in Tucson in 1998 as a Doctoral Student in Renewable Natural Resources with an interest in Forensic Isotope Hydrology, though never completed the degree. At the same time, he was also a Hydrologic intern for Tucson Water Hydrology and began his career at Tucson Water in 2001. Michael completed a B.S. in Biology from Indiana University in 1995 and a M.S. in Natural Resource and Environmental Management from Ball State University in 1998, with an emphasis in Hazardous Waste. Before moving to Tucson to attend the U of A, he spent the summer as a Governors’ Intern, electro-fishing for Indiana Department of Environmental Management, River Biological Assessment Section. Jean (Jeannie) E. McLain, Ph.D. Associate Director of the University of Arizona Water Resources Research Center (WRRC) and an Associate Research Scientist at the Water Resources Research Center and the Department of Soil, Water and Environmental Science. Jean joined the WRRC in November 2011 after a 10-year research career with the USDA-Agricultural Research Service. With a strong focus on environmental microbiology, Jean has directed numerous research projects focused on establishing the human health and environmental risks of using recycled municipal wastewater for augmenting surface waters. Jean received her doctorate from Duke University in Microbial Ecology after earning a Master’s Degree in Forest Science from Yale University and a Bachelor of Science degree in Forestry from the University of Vermont. Brian Powell Program Manager for Pima County Office of Sustainability and Conservation. He is the lead biologist responsible for developing a long-term ecological monitoring program for Pima County’s award-winning Sonoran Desert Conservation Plan. He has expertise in evaluating potential monitoring parameters and designing monitoring programs. E. Linwood (Lin) Smith, Ph.D. Consulting ecologist with 40 years experience, primarily in the desert southwest but with experience ranging from Nome, Alaska to Guam. He has had considerable involvement with the Sonoran Desert Conservation Plan and assisted Pima County Wastewater sampling a variety of biological and hydrological parameters at ten western, effluent-dominated streams. He has earned a Bachelors, Masters, and PhD in zoology with a PhD specialization in ornithology. Patrice (Patti) Spindler Employed by the Arizona Department of Environmental Quality for the past 22 years. She is a stream ecologist/water quality scientist who conducts stream water quality and macroinvertebrate monitoring, research and standards development. She developed biocriteria and bottom deposits criteria for the surface water quality standards and has participated in various studies on intermittent stream biocriteria, nutrient standards, physical integrity of stream channels, and probabilistic survey designs, as well as monitoring of the states waterbodies including EDWs. She is a graduate of Arizona State University, with a masters degree in biology.

*Jason Jones Supervisor for Arizona Department of Environmental Quality Monitoring Unit, which is responsible for monitoring Arizona’s lakes, streams, wetland and groundwater. He’s been with ADEQ for 11 years and is currently the EPA Region IX representative for the National Water Quality Monitoring Council. Recently, he has completed a wetland mapping project as part of a 104(b) EPA grant and has coauthored a paper summarizing groundwater quality data for over 1,500 wells. Jason has a Master’s degree in biology from Clarion University. Julie Stromberg, Ph.D. Plant ecologist in the School of Life Sciences at Arizona State University. She and her students have been studying desert rivers for over two decades, to understand how changes in stream flow regime influence riparian plant communities, and to provide managers with information that can inform conservation and restoration efforts. She is co-editor of “Ecology and Conservation of the San Pedro River” (UA Press), and teaches courses in restoration ecology and conservation biology. Robert Webb, Ph.D. Robert has worked on long-term changes in natural ecosystems of the southwestern United States since 1976. He has degrees in engineering (B.S., University of Redlands, 1978), environmental earth sciences (M.S., Stanford University, 1980), and geosciences (Ph.D, University of Arizona, 1985). His dissertation concerned late Holocene and historical flooding of the Escalante River within Grand Staircase – Escalante National Monument and the relation of that flooding with arroyo downcutting. Since 1985, he has been a research hydrologist with the U.S. Geological Survey in Tucson and an adjunct faculty member of the Departments of Geosciences and Hydrology and Water Resources at the University of Arizona. Webb does interdisciplinary work merging history, climate change, desert vegetation ecology, hydrology, geomorphology, and Quaternary geology to attempt to understand long-term change in the desert regions of the United States and Mexico. Webb as authored or edited 14 books, including Environmental Effects of Off-Road Vehicles (with Howard Wilshire); Grand Canyon, A Century of Change; Floods, Droughts, and Changing Climates (with Michael Collier); The Changing Mile Revisited (with Raymond Turner); Cataract Canyon: A Human and Environmental History of the Rivers in Canyonlands (with Jayne Belnap and John Weisheit); The Ribbon of Green (with Stanley A. Leake and Turner), and most recently, the Mojave Desert: Ecosystem Processes and Sustainability (with 5 other editors). His most recent book is The Santa Cruz River through Tucson: Historic Change in an Arid Region River (with three co-authors, in press). Claire Zucker As the Director of the Sustainable Environment Program at Pima Association of Governments (PAG), Claire Zucker and her staff conduct watershed, air quality and travel demand management planning in eastern Pima County. PAG is the Designated Planning Agency for water reclamation facilities, and as such it is responsible for updating the region’s Water Quality Management Plan as required under Section 208 of the Clean Water Act. Ms. Zucker brings over 20 years of local planning expertise to the Reviving River Project including committee facilitation, wastewater planning, Santa Cruz River land use investigations, water well inventories, stormwater monitoring and outreach, and riparian system groundwater and surface water monitoring. Ms. Zucker has Bachelors and Masters degrees in geological sciences and has worked as a geologist, hydrologist, and planner in her career. She also

serves on the boards of directors for the Southern Arizona Buffelgrass Coordination Center, Conserve to Enhance, Tucson Audubon Society, and Tucson Friends of Traditional Music. Project Staff Evan Canfield Civil Engineering Manager at Pima County Regional Flood Control District. He is registered P.E. in Civil Engineering with over 20 years of experience in hydrology and water resources. He holds a Ph.D. in Agricultural Engineering from the University of Arizona, with B.S. and M.S. in Geology and a minor in Hydrology and Water Resources. Ed Curley Ed has over 30 years of experience and currently assists the Pima County Regional Wastewater Reclamation Department (RWRD) on a part-time basis working with the jurisdictions and tribal entities that RWRD serves and with special projects for the Director’s Office. He is involved in analysis of state and national legislative activity and coordination with regional water quality planning and a co-editor of Relevance of Ambient Water Quality Criteria for Ephemeral and Effluent-Dependent Watercourses of the Arid Western United States (SETAC, 2008). Julia Fonseca Environmental Planning Manager for Pima County Office of Sustainability and Conservation. She developed the riparian element of the Sonoran Desert Conservation Plan, which included comprehensive water resource inventory and riparian vegetation mapping. In her 21 years at Pima County Regional Flood Control District, she led and assisted in many studies and projects along the effluent-dependent Santa Cruz River. Emily Brott Southern Arizona Project Manager for Sonoran Institute's Sun Corridor Legacy Program. She leads the Institute's engagement in innovative water harvesting, river restoration, and water policy initiatives in the binational Santa Cruz Watershed. She has nine years of experience in international community development and watershed restoration. Brott received a Masters in Environmental Sciences from Lund University, in Sweden, specialized in US EPA drinking water policy at the Cadmus Group, Inc., and completed a B.S. in Biology at Harvard University. Claire Zugmeyer Ecologist for the Sonoran Institute. She has worked on the Institute’s Santa Cruz River Initiative for 5 years and has led the production of recent Living River reports (2009 and 2010 water years). She completed a Masters in Wildlife and Fisheries Biology at the University of Arizona in 2007, a B.S. in Ecology, Behavior, and Evolution at the University of California, Los Angeles, and has worked on a variety of research and management projects focusing on birds, mammals, fish and amphibians.