Embed Size (px)
Citation preview
1
Self-Assembly of Fmoc-Tetrapeptides Based on the RGDS Cell
Adhesion Motif
V. Castelletto, C. M. Moulton, G. Cheng, I. W. Hamley,*
School of Chemistry, Pharmacy and Food Biosciences, University of Reading,
Reading RG6 6AD, U.K.
Matthew R. Hicks, Alison Rodger
Department of Chemistry, University of Warwick, Coventry CV4 7AL, U.K.
Daniel E. López-Pérez, Guillermo Revilla-López, and Carlos Alemán
Departament d’Enginyeria Química, E. T. S. d’Enginyeria Industrial de Barcelona
and Center for Research in NanoEngineering, Universitat Politècnica de Catalunya,
Diagonal 647, 08028 Barcelona, Spain.
Revised 20/9/11.
* Author for correspondence.
2
Abstract
Self-assembly in aqueous solution has been investigated for two Fmoc [Fmoc = N-
(fluorenyl)-9-methoxycarbonyl] tetrapeptides comprising the RGDS cell adhesion
motif from fibronectin or the scrambled sequence GRDS. The hydrophobic Fmoc unit
confers amphiphilicity on the molecules, and introduces aromatic stacking
interactions. Circular dichroism and FTIR spectroscopy show that the self-assembly of
both peptides at low concentration is dominated by interactions among Fmoc units,
although Fmoc-GRDS shows -sheet features, at lower concentration than Fmoc-
RGDS. Fibre X-ray diffraction suggests -sheet formation by both peptides at
sufficiently high concentration. Strong alignment effects are revealed by linear
dichroism experiments for Fmoc-GRDS. Cryo-TEM and small-angle X-ray scattering
(SAXS) reveal that both samples form fibrils with a diameter of approximately 10 nm.
The SAXS intensity profile for Fmoc-RGDS can be fitted with a model cylinder form
factor, however for Fmoc-GRDS the SAXS data is more consistent with a fractal
network structure of fibrils. Both Fmoc-tetrapeptides form self-supporting hydrogels at
sufficiently high concentration. Dynamic shear rheometry enabled measurements of
the moduli for the Fmoc-GRDS hydrogel, however significant syneresis was observed
for the Fmoc-RGDS hydrogel which was significantly less stable to shear. Molecular
dynamics computer simulations indicate that an antiparallel -sheet configuration is
clearly favoured for Fmoc-RGDS although there is less difference in total internal
energy of parallel and antiparallel -sheet configurations of Fmoc-GRDS.
3
Introduction
Amphiphilic peptides enable the creation of novel self-assembling systems which
incorporate the biofunctionality offered by the diversity of natural amino acids.1-5
A
number of strategies may be adopted to build in amphiphilicity. Hydrophilic peptides
may be attached to alkyl chains to produce peptide amphiphiles or other hydrophobic
units. Alternatively, hydrophobic peptides may be linked to hydrophilic chains such as
poly(ethylene glycol), leading in the polymeric limit to polymer-peptide conjugates.
Fmoc-dipeptides and Fmoc-tripeptides [Fmoc = N-(fluorenyl-9-methoxycarbonyl)]
containing hydrophilic residues can be considered as amphiphilic peptides since the
Fmoc unit is hydrophobic. However, the main driving force for self-assembly is -
stacking of the aromatic Fmoc units. This has been established by work in several
groups. 6-15
Here, we investigate the use of Fmoc as a motif to control the self-assembly of the
bioactive peptide RGDS. This peptide is part of a sequence from fibronectin.16-18
The
tetrapeptide sequence and more especially the tripeptide RGD subunit are widely
employed in the development of bionanomaterials for applications in cell
growth/differentiation or tissue scaffolding.19
The RGDS tetrapeptide has
antithrombotic activity due to the inhibition of platelet aggregation resulting from the
fibrinogen recognition sequence.20, 21
The bioactive RGDS motif has also been
incorporated into peptide amphiphiles (PAs),22-24
including a PA based on the
hydrophobic Fmoc unit.25
The self-assembly of materials containing RGD-peptide
sequences has been reviewed elsewhere.5, 26
Among recent examples, a designed
4
peptide containing the RGDS motif has been shown to form fibrils in the presence of
Mg2+
ions, and the fibrous hydrogel was shown to be capable to absorb growth factors
and cytokines released by embryonic stem cells.27
In another example, incorporation
of the RGD motif within an amyloid peptide containing an 11-residue sequence from
transthyretin led to bioactive materials with fibroblast cell adhesion properties.28
We
have recently reported on the self-assembly of Fmoc-RGD compared to Fmoc-GRD.29
Fibrillar structures based on -sheet self-assembly were observed for both peptides,
hydrogelation was noted at sufficiently high concentration, and the dynamic
mechanical response of the hydrogels was measured. In contrast to Fmoc-RGD, the
control Fmoc-GRD containing a scrambled tripeptide sequence formed cloudy
hydrogels which was ascribed to the formation of clusters of fibrils (supported by
analysis of in situ SAXS data). Preliminary cell culturing experiments using bovine
fibroblasts established that cell viability is retained for Fmoc-RGD, but not Fmoc-
GRD. Although the RGD sequence is widely used in the development of model
systems, the RGDS tetrapeptide is expected to have enhanced bioactivity due to the
additional serine residue.16, 26, 30-32
Here, we report on an investigation of the self-assembly in aqueous solution of two
Fmoc-tetrapeptides, Fmoc-RGDS and Fmoc-GRDS. The former contains the RGDS
adhesion motif, while the latter is a control containing the same residues but in a
scrambled sequence. The secondary structure is probed via FTIR specotroscopy and
circular dichroism (CD) spectroscopy, complemented by UV linear dichroism (LD)
spectroscopy to examine alignment effects. Fibril formation is examined using
cryogenic transmission electron microscopy (cryo-TEM), and confirmed by in situ
small-angle X-ray scattering (SAXS) experiments. The rheological properties of
5
hydrogels formed by the two peptides are compared. In addition, we compare the self-
assembly of the two Fmoc-tetrapeptides with our previous data on the Fmoc-
tripeptides lacking the terminal serine residue.
Experimental
Some of the studies reported herein were performed with peptides synthesized in-
house, whilst others used peptides obtained commercially. The purchased samples of
Fmoc-GRDS and Fmoc-RGDS were obtained from CS Bio (Menlo Park, USA). For
Fmoc-GRDS, the purity was 98.76% (by HPLC in a TFA/water/acetonitrile gradient
system). Molecular weight obtained by electrospray-mass spectrometry was 655.60
(expected: 655.67). For Fmoc-RGDS, the purity was 99.41% (by HPLC in a
TFA/water/acetonitrile gradient system). Molecular weight obtained by electrospray-
mass spectrometry was 655.87 (expected: 655.67).
For the in-house synthesis, Fmoc-Arg(Pbf)-OH, Fmoc-Gly-OH, Fmoc Asp(OtBu)-
OH, Fmoc-Ser(tBu)-Wang resin (100-200 mesh), diisopropylethylamine (DIPEA),
HOBt (1-hydroxybenzotriazole) and HBTU [2-(1H-benzotriazol-1-yl)-1,1,3,3-
tetramethyluronium hexafluorophosphate] were purchased from Novabiochem (United
Kingdom). Anhydrous N,N-dimethylformamide (DMF), trifluoroacetic acid (TFA)
piperidine, triisopropylsilane (TIPS) and Congo red were purchased from Sigma-
Aldrich (United Kingdom); acetonitrile (HPLC grade) and water (HPLC grade) were
purchased from Fisher Scientific (United Kingdom).
Fmoc peptide synthesis and purification
6
Fmoc peptides were synthesized on a 0.45 mM scale using a standard Fmoc chemistry
procedure with a sintered glass funnel. After the resin was swelled in DMF for 30 min
it was drained and treated with piperidine in DMF (1 : 4 ) to deprotect the Fmoc group.
The reaction mixture was agitated for 10 min by nitrogen bubbling and then drained.
After the piperidine treatment was repeated three times, the solution was drained and
washed with DMF (6 ), followed by coupling with activated Fmoc-protected amino
acids. Three equiv. of Fmoc-Xxx-OH to resin loading and 3 equiv HBTU / HOBt
were dissolved in the minimum amount of DMF necessary, followed by addition of
5.0 equiv. (iPr)2Net. The mixture was allowed to stand for 5 minutes prior to adding to
the drained resin. The coupling reaction was then agitated for 1.5 h by nitrogen
bubbling, drained and washed with DMF (6 ). The drained resin was treated with
piperidine in DMF (1 : 4 ) to deprotect the Fmoc group for coupling with Fmoc-
protected amino acids. After completion of the peptide sequence by repetition of the
above steps, the resin was washed with DMF (4 ), MeOH (4 ), CH2Cl2 (4 ) and
dried under vacuum for an hour prior to TFA-mediated cleavage. In the cleavage step,
the obtained peptide attached to the solid support was treated with a mixture of 95%
TFA, 2.5% triisopropylsilane, and 2.5% water, and the mixture was stirred at room
temperature for approximately 4 h, followed by filtration. The cleaved resin was
washed three times with TFA. The obtained peptide solution was collected and
concentrated by evaporating TFA under vacuum, followed by precipitation in cold
diethyl ether. The crude product was separated by centrifugation and decanting of the
supernatant.
The crude peptide was redissolved in a HPLC grade water/acetonitrile co-solvent
mixture for RP-HPLC purification. Preparative reverse-phase HPLC was carried out
7
on a Perkin-Elmer 200 system using a C18 column (Macherey-Nagel, 7 m, 10mm
250mm) at 35 C (Perkin-Elmer Series 200 Peltier Column Oven) with UV/vis detector
(Perkin-Elmer Series 200 UV/vis Detector) at 254 nm. The eluents, 0.1% TFA in
acetonitrile and 0.1% aqueous TFA, were used as a gradient solvent system in the RP-
HPLC, where the acetonitrile portion increased linearly from 0% to 90% over 20 min
and then decreased linearly to 0% over 10 min with a flow rate of 4 ml/min. A UV/vis
detector monitored the sample elution at 238 or 254 nm. The fractions of the peptide
were collected, followed by lyophilization to give a white solid, which was
characterized by electrospray-MS and 1H NMR.
Fmoc-RGDS as a white powder (RP-HPLC, tR = 13.88 min): MS: calc. [M]+ =
655.26, found [M+H]+ = 656.27;
1H NMR (400 MHz, MeOH-d4) δ (ppm):1.55(m,
3H), 1.73 (m, 1H), 2.68 (dd, J = 17.2 Hz, 7.6 Hz, 1H), 2.80 (dd, J = 17.0 Hz, 5.6 Hz,
1H), 3.08(t, J = 6.4 Hz, 2H) , 3.79(m, 4H), 3.99 (t, J = 7.2 Hz,1H ), 4.13 (t, J = 6.4 Hz,
1H), 4.37( m, 4H), 7.21 (t, J = 7.6 Hz, 2H), 7.31 (t, J = 7.6 Hz, 2H), 7.57 (t, J = 8.0
Hz, 2H), 7.71 (d, J = 7.6 Hz, 2H ), 7.88, 8.22, 8.39 [amide-H].
Fmoc-GRDS as a white powder (RP-HPLC, tR = 13.56 min): MS: calc. [M]+ =
655.26, found [M+H]+ = 656.27;
1H NMR (400 MHz, MeOH-d4) δ (ppm): 1.56 (m,
3H), 1.81 (m, 1H), 2.66 (dd, J = 16.8 Hz, 8.0 Hz, 1H), 2.84 (dd, J = 16.8 Hz, 4.8 Hz,
1H), 3.08 (t, J = 6.8 Hz, 2H), 3.71 (m, 4H),, 3.81 (dd, J = 11.6 Hz, 4.4 Hz, 1H), 4.14 (t,
J = 6.4 Hz, 1H), 4.29 (m, 4H), 7.22 ( td, J = 7.6 Hz, 1.2 Hz, 2H), 7.30 (t, J= 7.6 Hz,
2H), 7.58 (d, J= 7.6 Hz, 2H), 7.71 (d, J = 7.6 Hz, 2H ), 7.83, 8.21 [amide-H].
Hydrogel Formation
Each Fmoc-tripeptide was added into a vial, followed by addition of water to make up
the desired concentration. The mixture was sonicated in an ultrasonic bath with
8
shaking at 45 – 55 C for 5-10 minutes to produce a clear Fmoc-tetrapeptide solution.
Upon cooling to room temperature it was allowed to stand overnight and gelation was
observed by the inverted vial method.
Circular Dichroism (CD) and Linear Dichroism (LD)
CD spectra for 1 wt% peptide solutions were recorded at room temperature using a
Chirascan spectropolarimeter (Applied Photophysics, UK). Solutions were loaded in
parallel plaque cells (Hellma quartz Suprasil®), with a nominal 0.01 mm path length.
The CD data were measured using 1 sec acquisition time per point and 0.5 nm step.
The post-acquisition smoothing tool from Chirascan software was used to remove
random noise elements from the averaged spectra. A residual plot was generated for
each curve in order to verify whether or not the spectrum has been distorted during
the smoothing process. The CD signal from the water was subtracted from the CD
data of the peptide solutions. For CD the path length was 1 mm for the 0.02 wt%
samples using Spectrosil quartz cuvettes (Starna Optiglass, Hainault, UK). Note that
the sample was placed directly adjacent to the photomultiplier tube in order to
minimize loss of light due to scattering. The samples were mounted with the long axis
of the cuvette either vertical or horizontal using a modified cell holder.
Linear dichroism measurements on samples with 0.02 wt% or 0.2 wt% peptide
concentration were performed at room temperature (21 °C) on a Jasco J-815
spectropolarimeter modified for linear dichroism (Jasco UK, Great Dunmow, UK).
Spectra were measured between 350 and 180 nm with a step size of 0.2 nm. Data was
truncated below the wavelength at which the HT reading indicated that there was not
enough light incident on the detector. The bandwidth was set to 1 nm with a scanning
9
speed of 100 nm min-1
and a digital integration time of 1 s. In order to improve the
signal to noise, triplicate spectra were measured and averaged.
For Couette LD measurements, alignment of the samples was achieved using a
microvolume Couette cell with a path length of 0.5 mm and rotation speed of 3000
rpm, which was built in-house33, 34
(equivalent models are available from Kromatek,
Great Dunmow, UK). Three spectra were averaged and a water baseline spectrum was
subtracted from this to account for the inherent LD signal of the system originating
from the optics and the detector. LD spectra are reported in Δ absorbance units.
Fourier Transform Infra-Red (FTIR) Spectroscopy
Spectra were recorded using a Nexus-FTIR spectrometer equipped with a DTGS
detector. Solutions of Fmoc-tetrapeptide in D2O with concentrations of 1 or 3 wt%
were sandwiched in ring spacers between two CaF2 plate windows (spacer 25 m).
All spectra were scanned 128 times over the range of 4000 950 cm-1
.
Cryogenic-Transmission Electron Microscopy (Cryo-TEM)
Experiments were performed at Unilever Research, Colworth, Bedford, UK. Sample
preparation was carried out using a CryoPlunge 3 unit (Gatan Instruments) employing
a double blot technique. 3 µl of sample was pipetted onto a plasma etched (15 s) 400
mesh holey carbon grid (Agar Scientific) held in the plunge chamber at approx 90%
humidity. The samples were blotted, from both sides for 0.5, 0.8 or 1.0 s dependant on
sample viscosity. The samples were then plunged into liquid ethane at a temperature of
-170 ˚C. The grids were blotted to remove excess ethane then transferred, under liquid
nitrogen to the cryo TEM specimen holder (Gatan 626 cryo holder) at -170 ˚C.
10
Samples were examined using a Jeol 2100 TEM operated at 200 kV and imaged using
a Gatan Ultrascan 4000 camera and images captured using DigitalMicrograph
software (Gatan).
Small-Angle X-ray Scattering (SAXS)
Experiments were performed on beamline ID02 at the ESRF, Grenoble, France. The
sample was mounted into a glass capillary flow-through cell within a metal chamber
heated by a water bath. The data presented are averages of ten frames, taken at
different sample positions. The sample-to-detector distance was 1 m and the X-ray
wavelength was = 0.995 Å. The q = 4 sin / scale (here 2 is the scattering angle)
was calibrated using silver behenate.
Fibre X-ray Diffraction
X-ray diffraction was performed on stalks prepared from 2 wt% solutions in water.
The stalks were mounted (vertically) onto the four axis goniometer of a RAXIS IV++
X-ray diffractometer (Rigaku) equipped with a rotating anode generator. The XRD
data was collected using a Saturn 992 CCD camera.
Rheology
The rheological properties of the systems were determined at 25 °C, using a controlled
stress AR-2000 rheometer from TA Instruments. A cone and plate geometry (20 mm
diameter, 1° angle) was used for both samples. Preliminary strain sweeps (frequency
ω = 1 Hz) were measured to determine the linear regime and ensure that the moduli
were independent of strain. Then, frequency sweeps were performed for ω= 0.1 600
11
rad s-1
, with the oscillatory stress fixed to 0.2 Pa, and strain values within the linear
regime (0.01% 0.03%).
Computer Simulation
All Molecular Dynamics (MD) simulations were performed using the AMBER force-
field.35, 36
RESP charges for Fmoc moiety were derived at HF/6-31G* level. Atom
pair distance cut-offs were applied at 14.0 Å to compute the van der Waals and
electrostatic interactions. To avoid discontinuities in the potential energy function, the
van der Waals energy term was forced to slowly converge to zero by applying a
smoothing factor from a distance of 12.0 Å. Electrostatic interactions were computed
using the non-truncated electrostatic potential with Ewald summations.37
The real
space term was determined by the van der Waals cutoff (14.0 Å), while the reciprocal
term was estimated by interpolation of the effective charge into a charge mesh with a
grid thickness of 5 points per volume unit, i.e., using the particle-mesh Ewald (PME)
method. Both temperature and pressure were controlled by the weak coupling method,
the Berendsen thermobarostat,38
using a time constant for heat bath coupling and a
pressure relaxation time of 1 ps. Bond lengths were constrained using the SHAKE
algorithm39
with a numerical integration step of 2 fs. All MD simulations were
performed using the NAMD program.40
Simulations were carried considering the
following systems: (i) n explicit Fmoc-RGDS peptide molecules (with n= 7 or 21)
assembled in one strand forming n-1 -sheets, which adopt parallel or antiparallel
arrangements (denoted p/Fmoc-RGDS and a/Fmoc-RGDS systems, respectively); and
(ii) n explicit Fmoc-GRDS peptide molecules (with n= 7 or 21) assembled in one
strand forming n 1 -sheets, which adopt parallel or antiparallel arrangements
(p/Fmoc-GRDS and a/Fmoc-GRDS systems, respectively). Figure 10 shows the
12
starting structures for the four simulations with n= 21 explicit peptide molecules.
Neutralization of the charge at pH= 7 was achieved by adding 7 and 21 Na+ counter-
ions for systems with n= 7 and 21, respectively. The p/Fmoc-RGDS, a/Fmoc-RGDS,
p/Fmoc-GRDS and a/Fmoc-GRDS systems with n= 7 were solvated by including
16237, 16679, 14691 and 14935 TIP3P41
water molecules, respectively, whereas the
number of explicit water molecules used for simulations with n= 21 were 290392,
290114 and 290478, respectively.
Each system was equilibrated by running a NVT-MD simulation at 310 K for 1 ns, the
resulting atom velocities and coordinates being used to start a 2 ns of NPT MD (298
K, 1 bar pressure) simulation to equilibrate density to 1 g cm-3
. Constraints to
maintain inter-chain distances were applied through all the equilibration period.
Productive simulation for systems with n= 7 or 21 consisted in 20 and 10 ns NPT MD
(298 K, 1 bar pressure) runs, respectively, which were started using the coordinates
and atom velocities obtained at the end of the equilibration.
Results
a) Synthesis and Hydrogelation
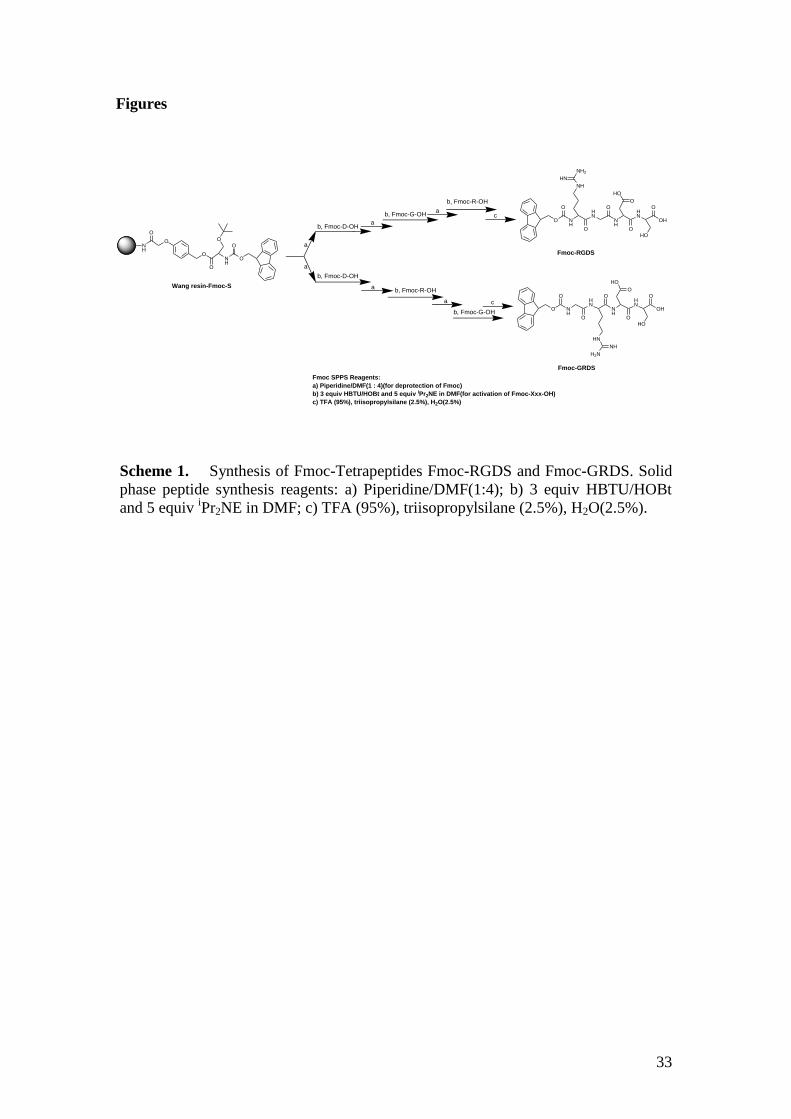
Batches of Fmoc-RGDS and Fmoc-GRDS tetrapeptides were synthesized (Scheme 1)
using standard techniques of solid-phase Fmoc peptide synthesis. Other batches of
sample were purchased. The synthesis was performed on pre-loaded Wang resin
(Fmoc-Ser(tBu)-Wang resin) and Fmoc (9-fluorenylmethoxycarbonyl) protected
amino acids, Fmoc-Arg(Pbf)-OH, Fmoc-Gly-OH, Fmoc Asp(OtBu)-OH, with tBu (t-
butyl) and Pbf (2,2,4,6,7-pentamethyldihydrobenzofuran-5-sulfonyl) as side chain
protecting groups, which were removed during the course of the TFA-mediated
13
cleavage. The obtained crude Fmoc tetrapeptides were purified by preparative
reverse-phase HPLC. Fmoc-RGDS was found to form a self-supporting hydrogel at a
concentration of 2 wt% in water. On the other hand, Fmoc-GRDS became highly
viscous at this concentration it did not form a self-supporting hydrogel. The hydrogels
are cloudy, which we associate with the presence of extended fibrils (vide infra). The
dynamic mechanical properties of the hydrogels were probed in more detail by shear
rheometry, as discussed shortly.
b) Secondary Structure
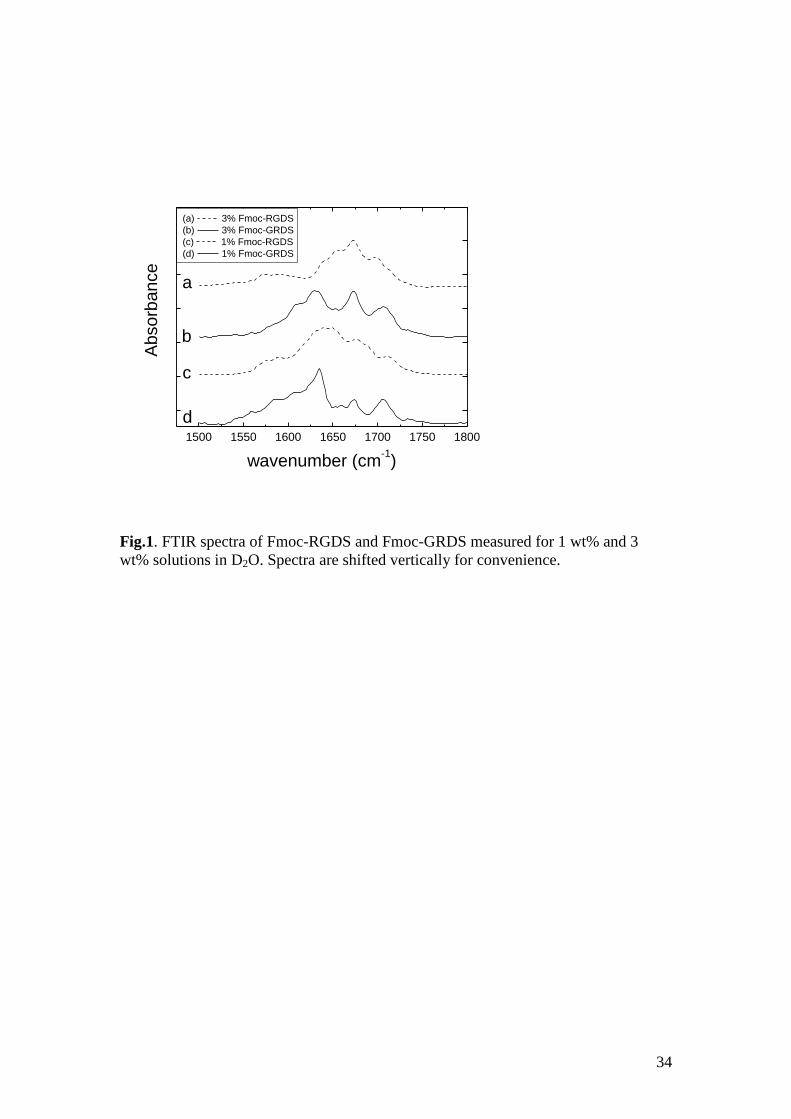
FTIR was also used to examine secondary structure, focussing on the amide I' region.
Fig.1 shows spectra obtained for two concentrations of both Fmoc-RGDS and Fmoc-
GRDS. The 3 wt% Fmoc-GRDS sample shows features ascribed to -sheets, i.e. a
peak at 1630 cm-1
. The peak at 1608 cm-1
is associated with the arginine side chain.42,
43 A peak at 1707 cm
-1 is similar to those observed for Fmoc-RGD and Fmoc-GRD
and is assigned to hydrogen bonded carbonyl units44
(in the D residue or at the C
terminus), rather than a frequency-shifted peak arising from antiparallel -sheets
which are normally observed42, 45, 46
in the range 1680 – 1690 cm-1
. It has to be noted
that the assignment of a band in this range to antiparallel sheets has been the subject
of debate in the literature{Barth, 2002 #7021}{Torii, 2008 #8509} although now
commonly accepted.{Kubelka, 2001 #4372}{Barth, 2007 #8162} This spectrum and
all others contain a strong peak at 1673 cm-1
which is assigned to TFA counterions46-
48 bound to NH3
+ groups (in the R residue). The spectrum for 3 wt% Fmoc-RGDS
shows features of antiparallel -sheets (peaks at 1638 cm-1
and 1698 cm-1
) along with
a broad peak in the range 1640 – 1655 cm-1
that are assigned to disordered structure.42,
49 Interestingly, the 1608 cm
-1 arginine side chain peak is absent for this peptide,
14
pointing possibly to salt bridging interactions (as supported by MD computer
simulations, vide infra). At 1 wt%, the spectrum in the amide I' region for Fmoc-
RGDS shows only a broad weak peak centered around 1645 cm-1
plus the TFA/NH3+
peak. The spectrum for Fmoc-GRDS has the same features as the one for the 3 wt%
sample. These results show that Fmoc-GRDS is able to form -sheets for
concentrations as low as 1 wt% in contrast to Fmoc-RGDS which mainly adopts a
disordered conformation under these conditions. However, evidence from Congo red
dye staining (vide infra), and cryo-TEM suggests at least the presence of some -sheet
amyloid fibrils at 1 wt% for this sample). These results are surprising in view of our
previous findings on Fmoc-RGD and Fmoc-GRD,29
both of which show -sheet
features in the FTIR spectra at 3 wt%, but not at 1 wt%. It appears that the additional
serine residue significantly reduces the aggregation tendency of Fmoc-RGDS, but has
the opposite effect for Fmoc-GRDS.
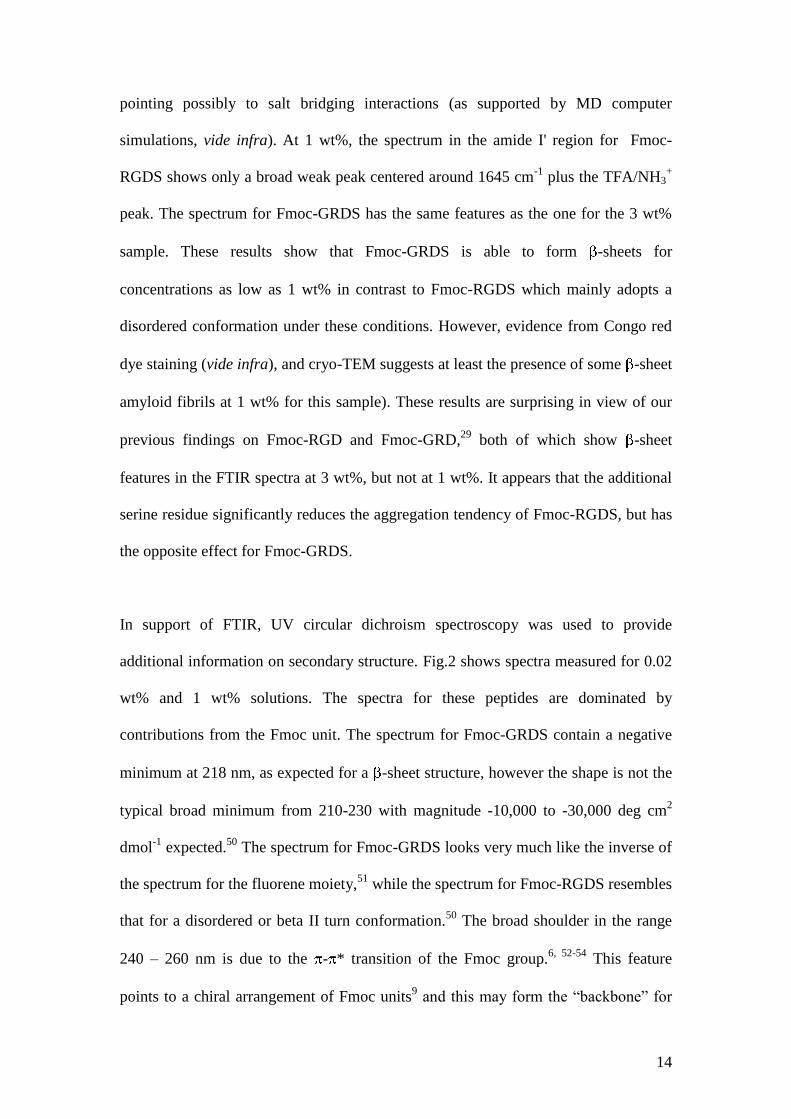
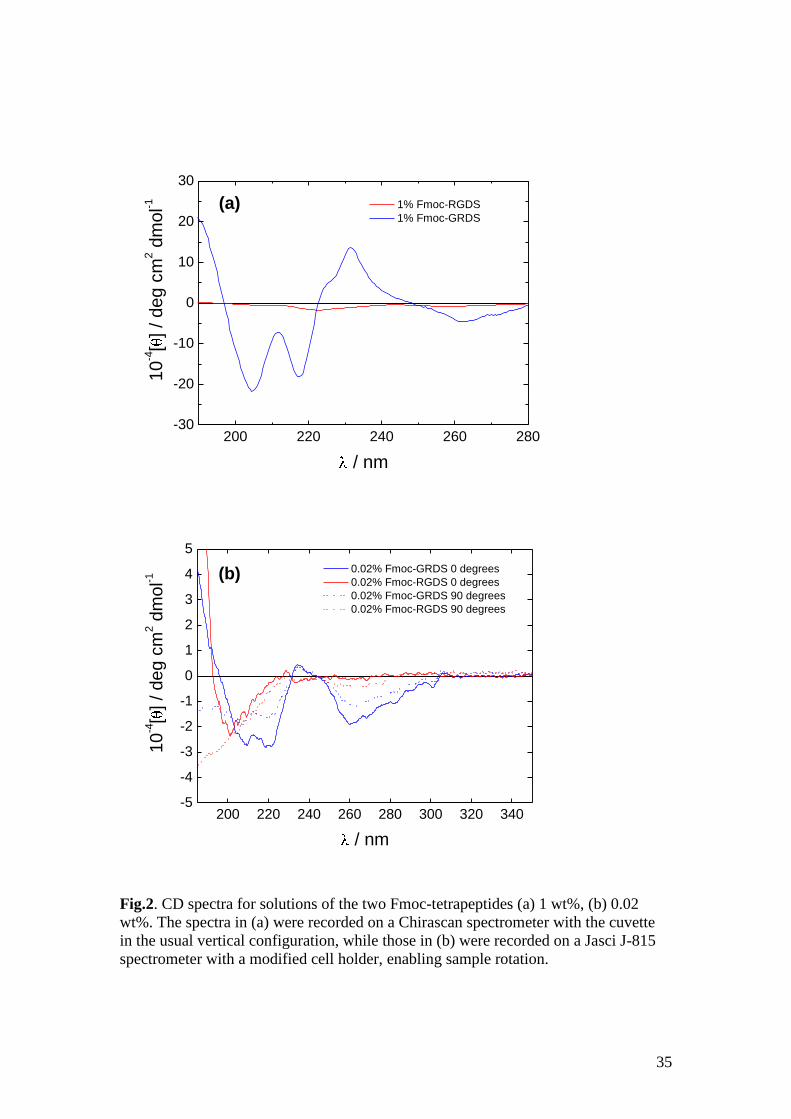
In support of FTIR, UV circular dichroism spectroscopy was used to provide
additional information on secondary structure. Fig.2 shows spectra measured for 0.02
wt% and 1 wt% solutions. The spectra for these peptides are dominated by
contributions from the Fmoc unit. The spectrum for Fmoc-GRDS contain a negative
minimum at 218 nm, as expected for a -sheet structure, however the shape is not the
typical broad minimum from 210-230 with magnitude -10,000 to -30,000 deg cm2
dmol-1
expected.50
The spectrum for Fmoc-GRDS looks very much like the inverse of
the spectrum for the fluorene moiety,51
while the spectrum for Fmoc-RGDS resembles
that for a disordered or beta II turn conformation.50
The broad shoulder in the range
240 – 260 nm is due to the - * transition of the Fmoc group.6, 52-54
This feature
points to a chiral arrangement of Fmoc units9 and this may form the “backbone” for
15
-sheet fibrils, as discussed later when results from molecular dynamics computer
simulations are presented. In contrast, the spectrum for Fmoc-RGDS shows a much
lower signal (ellipticity) and, for the 1 wt% solution a broad minimum at around 222
nm. The spectrum for Fmoc-GRDS indicates stacking of Fmoc units in a chiral
configuration.
These CD spectra show a difference in signal from the two peptides suggesting a
difference in secondary structure. In order to ascertain that the signals were not from
LD artifacts, the spectra for 0.02 wt% sample were measured with the sample oriented
vertically (0 degrees) and horizontally (90 degrees).55
Down to around 200 nm, the
spectra were of similar shape for the two orientations indicating that these were true
CD spectra. Further, the shapes do not follow that of the LD (see below). However, at
wavelengths < 200 nm light scattering artefacts are prevalent and data should be
treated with caution. This is because there is a non-linear inverse relationship between
light scattering and wavelength.
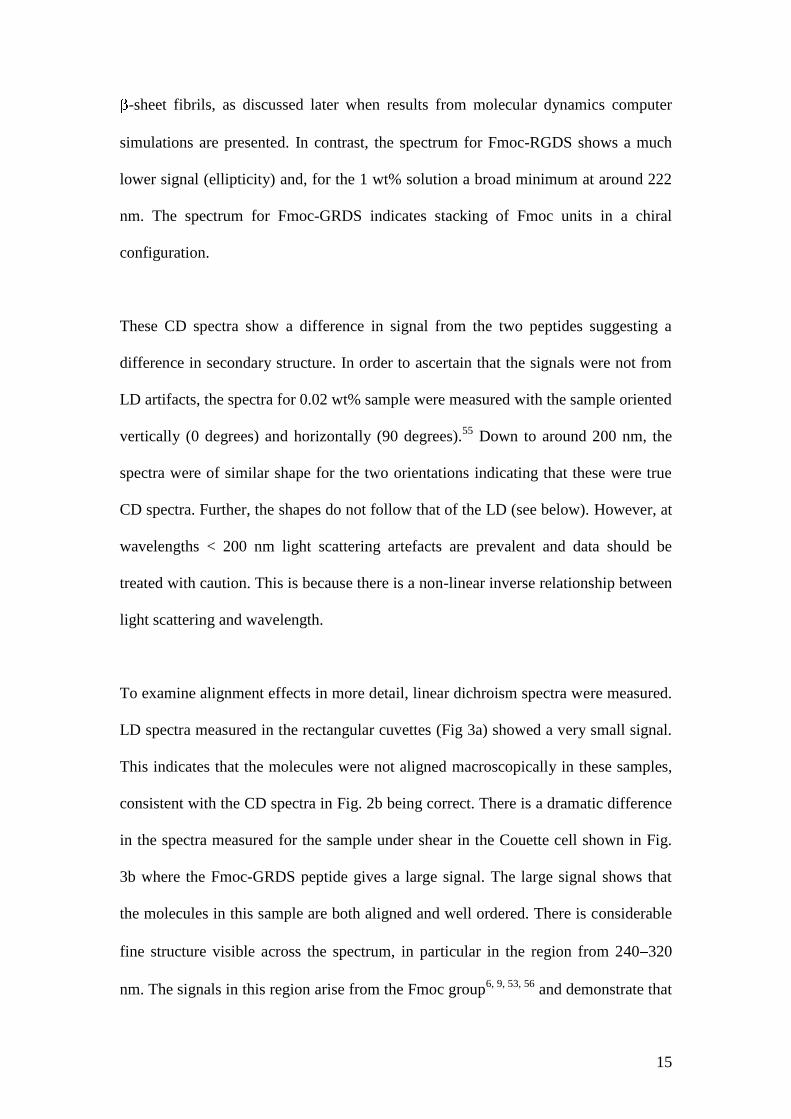
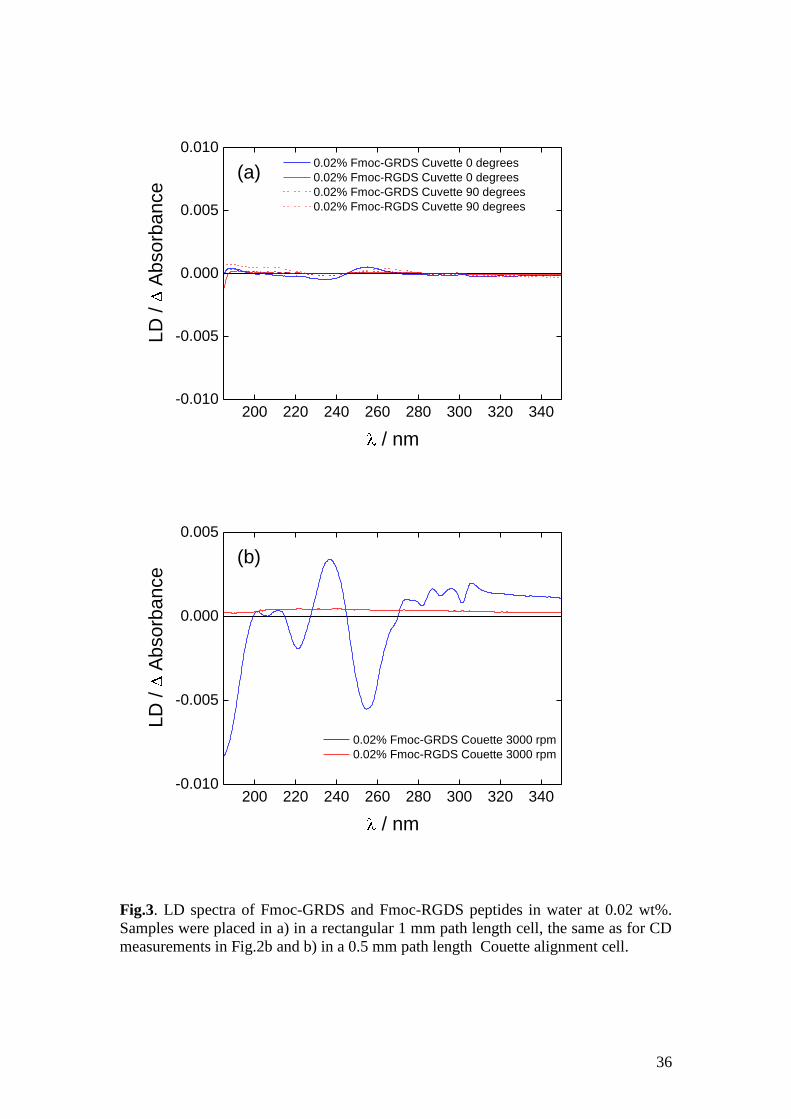
To examine alignment effects in more detail, linear dichroism spectra were measured.
LD spectra measured in the rectangular cuvettes (Fig 3a) showed a very small signal.
This indicates that the molecules were not aligned macroscopically in these samples,
consistent with the CD spectra in Fig. 2b being correct. There is a dramatic difference
in the spectra measured for the sample under shear in the Couette cell shown in Fig.
3b where the Fmoc-GRDS peptide gives a large signal. The large signal shows that
the molecules in this sample are both aligned and well ordered. There is considerable
fine structure visible across the spectrum, in particular in the region from 240 320
nm. The signals in this region arise from the Fmoc group6, 9, 53, 56
and demonstrate that
16
this part of the molecule is highly ordered. The sign of the LD absorbance from
245 260 nm indicates that the planar Fmoc unit is predominantly aligned
perpendicular rather than parallel to the fibre axis, however the Fmoc absorbance at
240 nm is significant and the LD is positive so it must be tilted in some way.
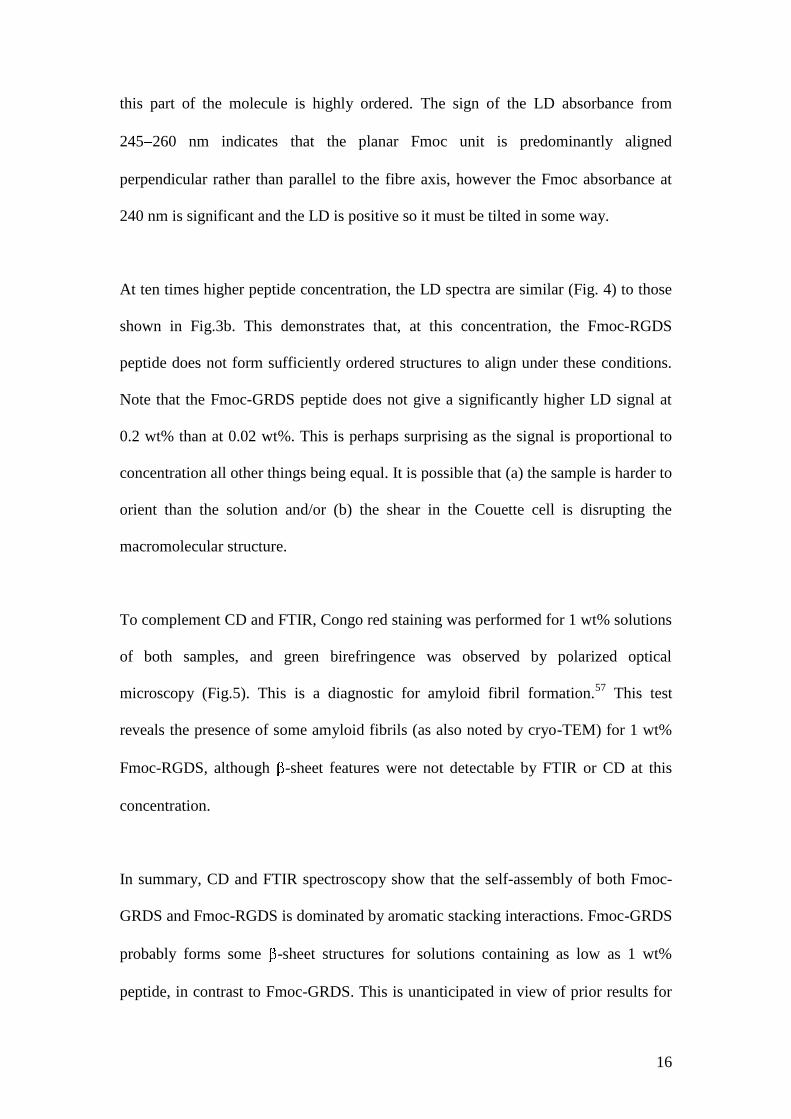
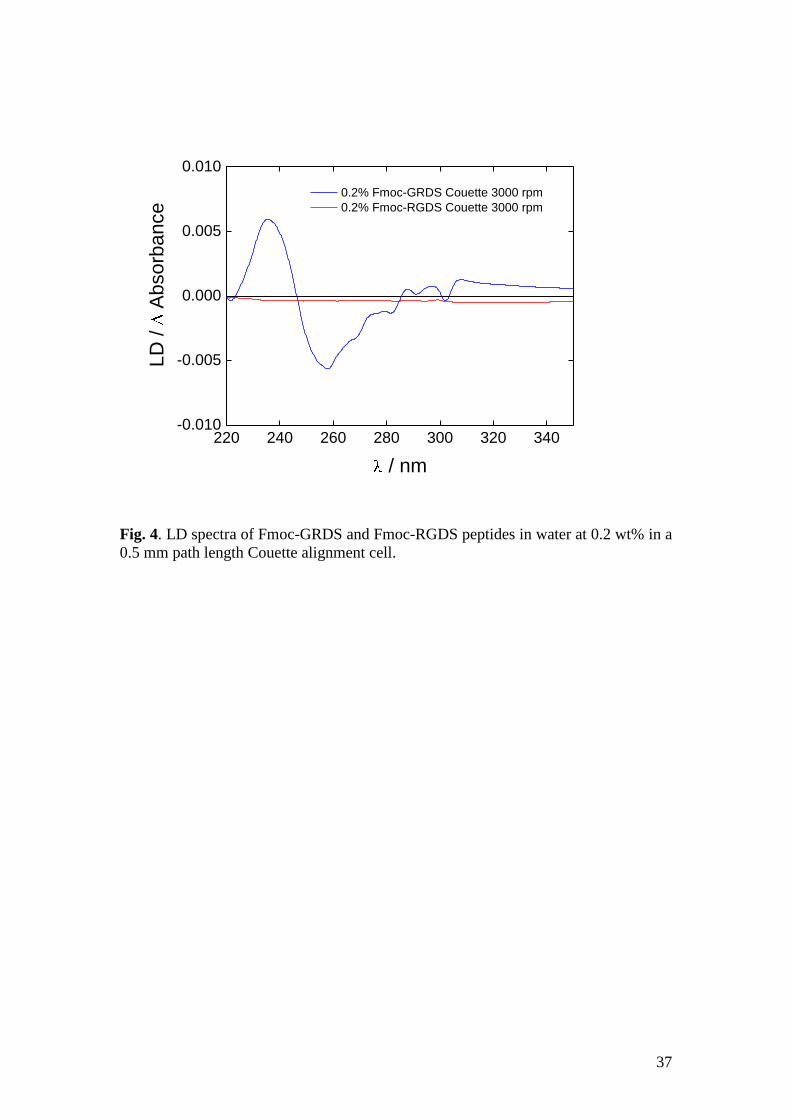
At ten times higher peptide concentration, the LD spectra are similar (Fig. 4) to those
shown in Fig.3b. This demonstrates that, at this concentration, the Fmoc-RGDS
peptide does not form sufficiently ordered structures to align under these conditions.
Note that the Fmoc-GRDS peptide does not give a significantly higher LD signal at
0.2 wt% than at 0.02 wt%. This is perhaps surprising as the signal is proportional to
concentration all other things being equal. It is possible that (a) the sample is harder to
orient than the solution and/or (b) the shear in the Couette cell is disrupting the
macromolecular structure.
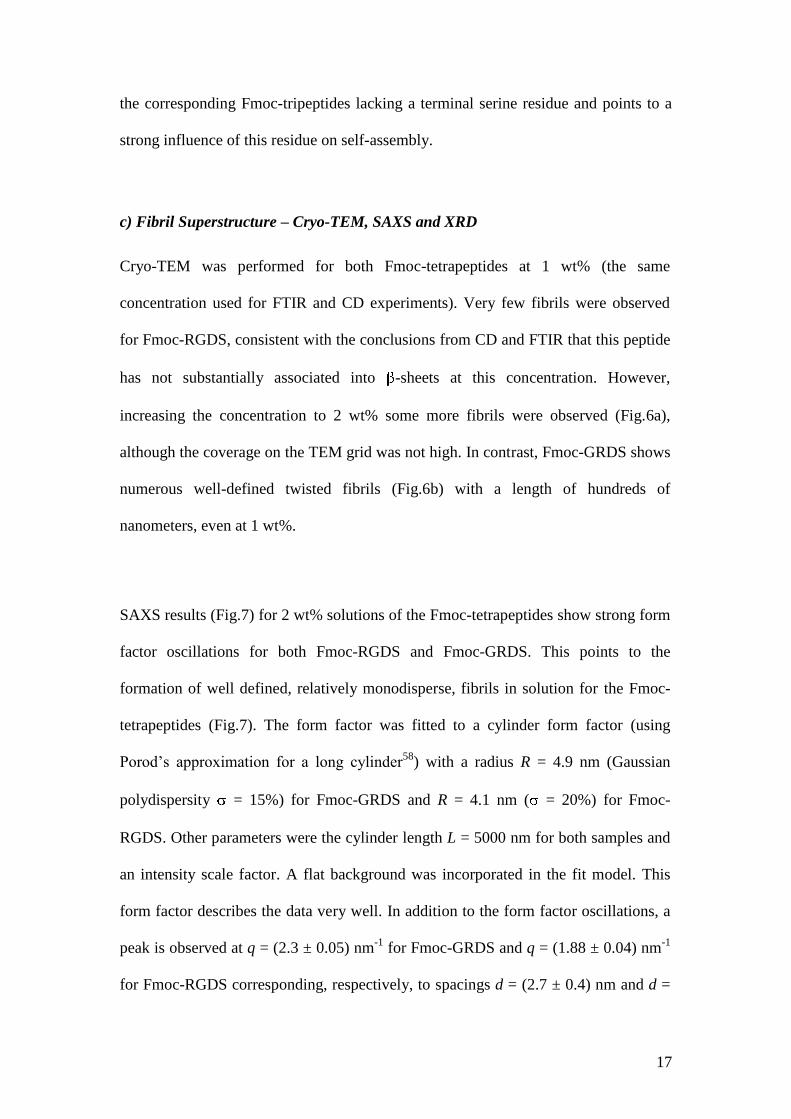
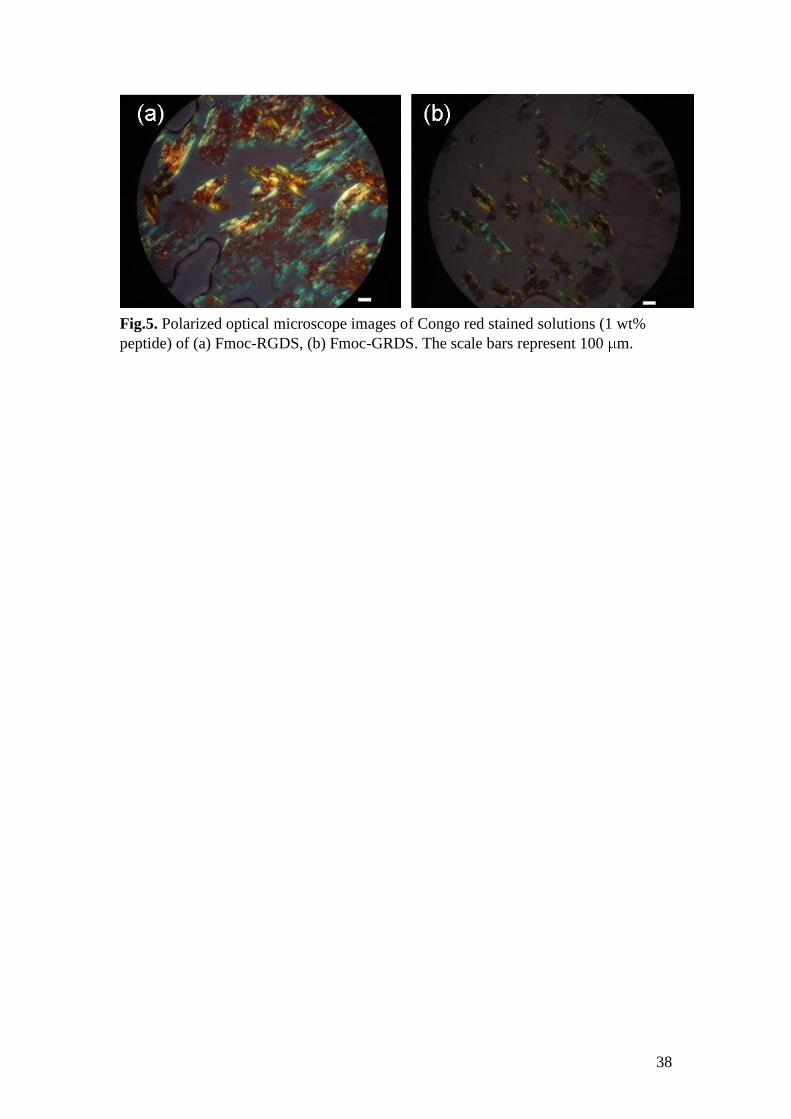
To complement CD and FTIR, Congo red staining was performed for 1 wt% solutions
of both samples, and green birefringence was observed by polarized optical
microscopy (Fig.5). This is a diagnostic for amyloid fibril formation.57
This test
reveals the presence of some amyloid fibrils (as also noted by cryo-TEM) for 1 wt%
Fmoc-RGDS, although -sheet features were not detectable by FTIR or CD at this
concentration.
In summary, CD and FTIR spectroscopy show that the self-assembly of both Fmoc-
GRDS and Fmoc-RGDS is dominated by aromatic stacking interactions. Fmoc-GRDS
probably forms some -sheet structures for solutions containing as low as 1 wt%
peptide, in contrast to Fmoc-GRDS. This is unanticipated in view of prior results for
17
the corresponding Fmoc-tripeptides lacking a terminal serine residue and points to a
strong influence of this residue on self-assembly.
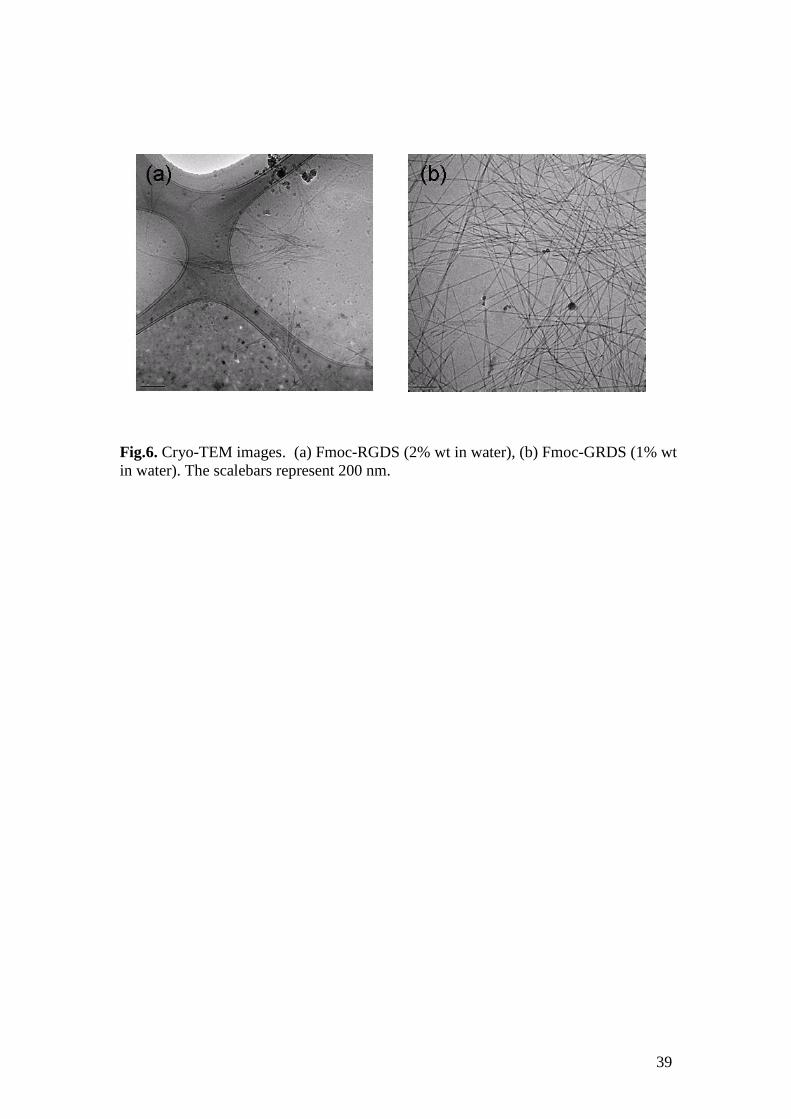
c) Fibril Superstructure – Cryo-TEM, SAXS and XRD
Cryo-TEM was performed for both Fmoc-tetrapeptides at 1 wt% (the same
concentration used for FTIR and CD experiments). Very few fibrils were observed
for Fmoc-RGDS, consistent with the conclusions from CD and FTIR that this peptide
has not substantially associated into -sheets at this concentration. However,
increasing the concentration to 2 wt% some more fibrils were observed (Fig.6a),
although the coverage on the TEM grid was not high. In contrast, Fmoc-GRDS shows
numerous well-defined twisted fibrils (Fig.6b) with a length of hundreds of
nanometers, even at 1 wt%.
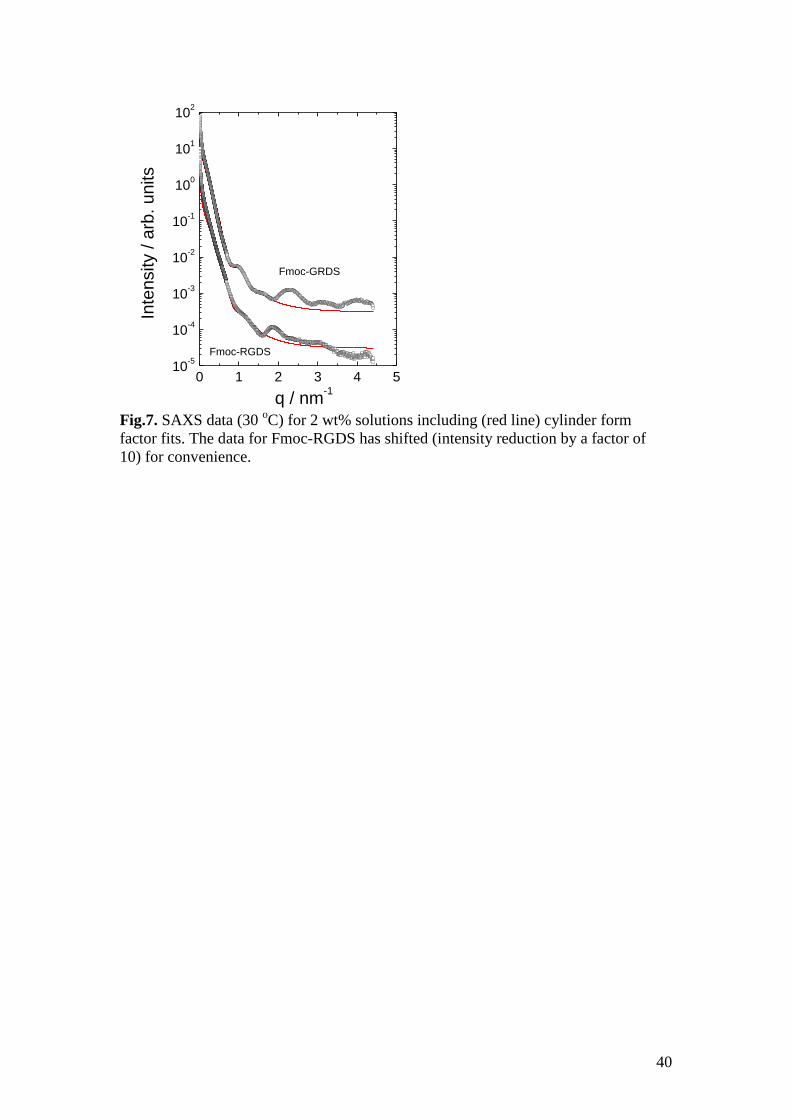
SAXS results (Fig.7) for 2 wt% solutions of the Fmoc-tetrapeptides show strong form
factor oscillations for both Fmoc-RGDS and Fmoc-GRDS. This points to the
formation of well defined, relatively monodisperse, fibrils in solution for the Fmoc-
tetrapeptides (Fig.7). The form factor was fitted to a cylinder form factor (using
Porod’s approximation for a long cylinder58
) with a radius R = 4.9 nm (Gaussian
polydispersity = 15%) for Fmoc-GRDS and R = 4.1 nm ( = 20%) for Fmoc-
RGDS. Other parameters were the cylinder length L = 5000 nm for both samples and
an intensity scale factor. A flat background was incorporated in the fit model. This
form factor describes the data very well. In addition to the form factor oscillations, a
peak is observed at q = (2.3 ± 0.05) nm-1
for Fmoc-GRDS and q = (1.88 ± 0.04) nm-1
for Fmoc-RGDS corresponding, respectively, to spacings d = (2.7 ± 0.4) nm and d =
18
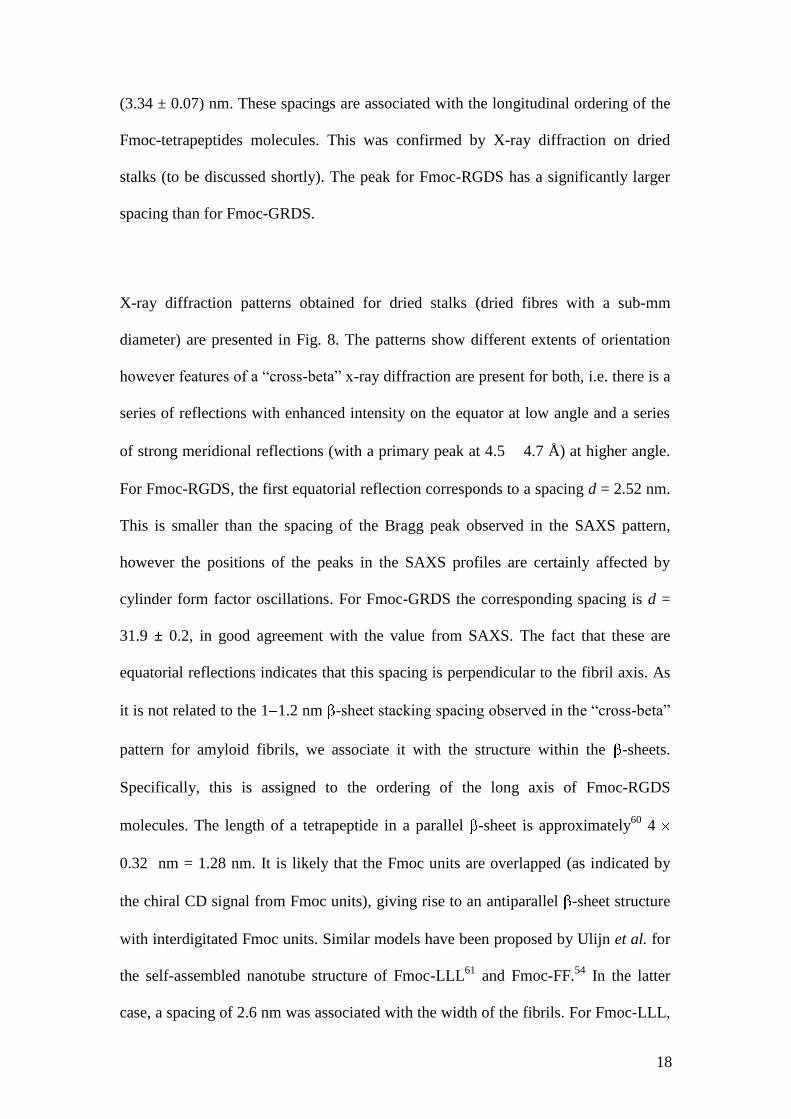
(3.34 ± 0.07) nm. These spacings are associated with the longitudinal ordering of the
Fmoc-tetrapeptides molecules. This was confirmed by X-ray diffraction on dried
stalks (to be discussed shortly). The peak for Fmoc-RGDS has a significantly larger
spacing than for Fmoc-GRDS.
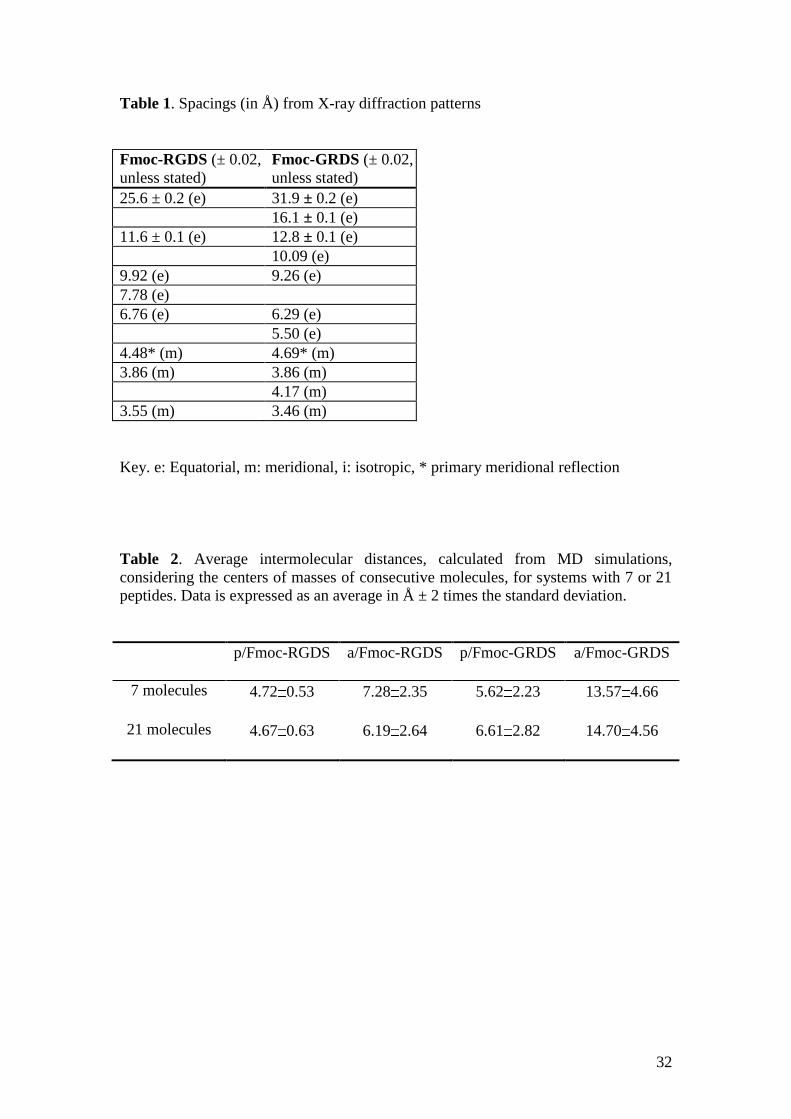
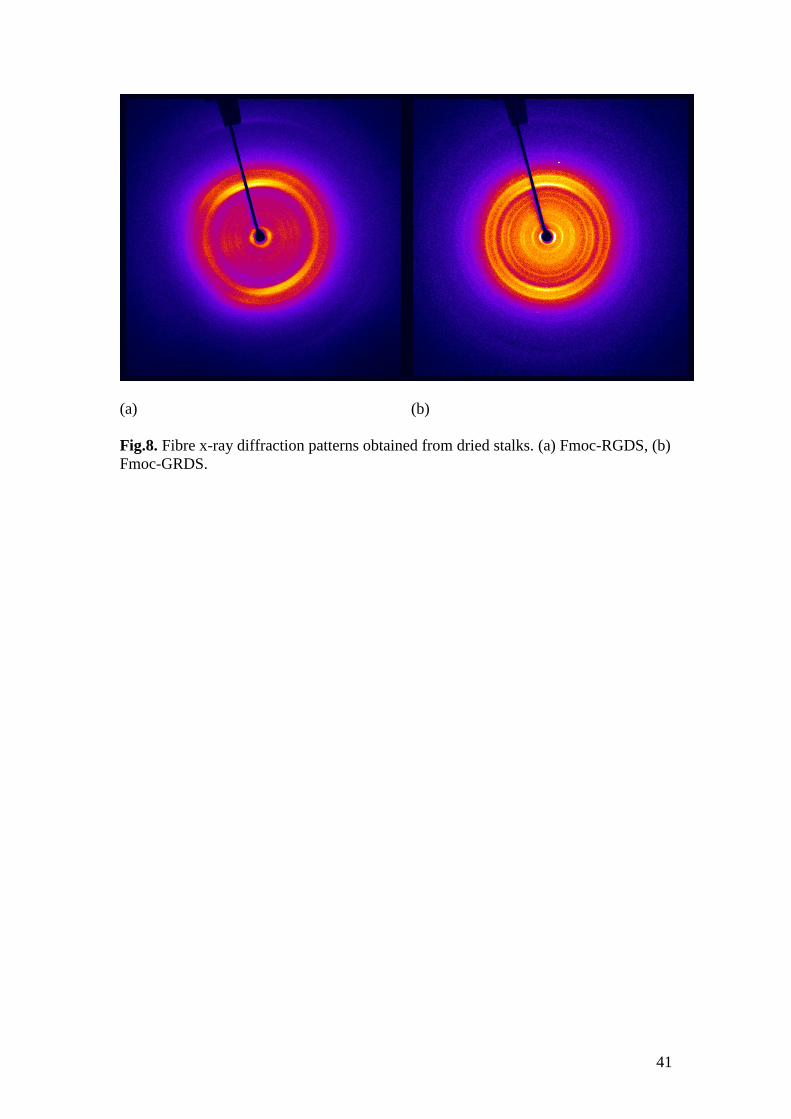
X-ray diffraction patterns obtained for dried stalks (dried fibres with a sub-mm
diameter) are presented in Fig. 8. The patterns show different extents of orientation
however features of a “cross-beta” x-ray diffraction are present for both, i.e. there is a
series of reflections with enhanced intensity on the equator at low angle and a series
of strong meridional reflections (with a primary peak at 4.5 4.7 Å) at higher angle.
For Fmoc-RGDS, the first equatorial reflection corresponds to a spacing d = 2.52 nm.
This is smaller than the spacing of the Bragg peak observed in the SAXS pattern,
however the positions of the peaks in the SAXS profiles are certainly affected by
cylinder form factor oscillations. For Fmoc-GRDS the corresponding spacing is d =
31.9 ± 0.2, in good agreement with the value from SAXS. The fact that these are
equatorial reflections indicates that this spacing is perpendicular to the fibril axis. As
it is not related to the 1 1.2 nm -sheet stacking spacing observed in the “cross-beta”
pattern for amyloid fibrils, we associate it with the structure within the -sheets.
Specifically, this is assigned to the ordering of the long axis of Fmoc-RGDS
molecules. The length of a tetrapeptide in a parallel -sheet is approximately60
4
0.32 nm = 1.28 nm. It is likely that the Fmoc units are overlapped (as indicated by
the chiral CD signal from Fmoc units), giving rise to an antiparallel -sheet structure
with interdigitated Fmoc units. Similar models have been proposed by Ulijn et al. for
the self-assembled nanotube structure of Fmoc-LLL61
and Fmoc-FF.54
In the latter
case, a spacing of 2.6 nm was associated with the width of the fibrils. For Fmoc-LLL,
19
the outer diameter of the tubes was 2.4 nm. The spacings reported in Table 1 for
Fmoc-RGDS differ substantially from those previously reported for Fmoc-RGD,29
indicating that the arrangement of -sheets is very sensitive to peptide sequence. In
contrast, the spacings for Fmoc-GRD29
and Fmoc-GRDS are in closer agreement. The
long spacings obtained from fibre XRD on dried stalks are in general in good
agreement with the values from in situ SAXS on solutions detailed above, and this
provides confidence that the fibre XRD patterns reflect the -sheet structure in
solution.
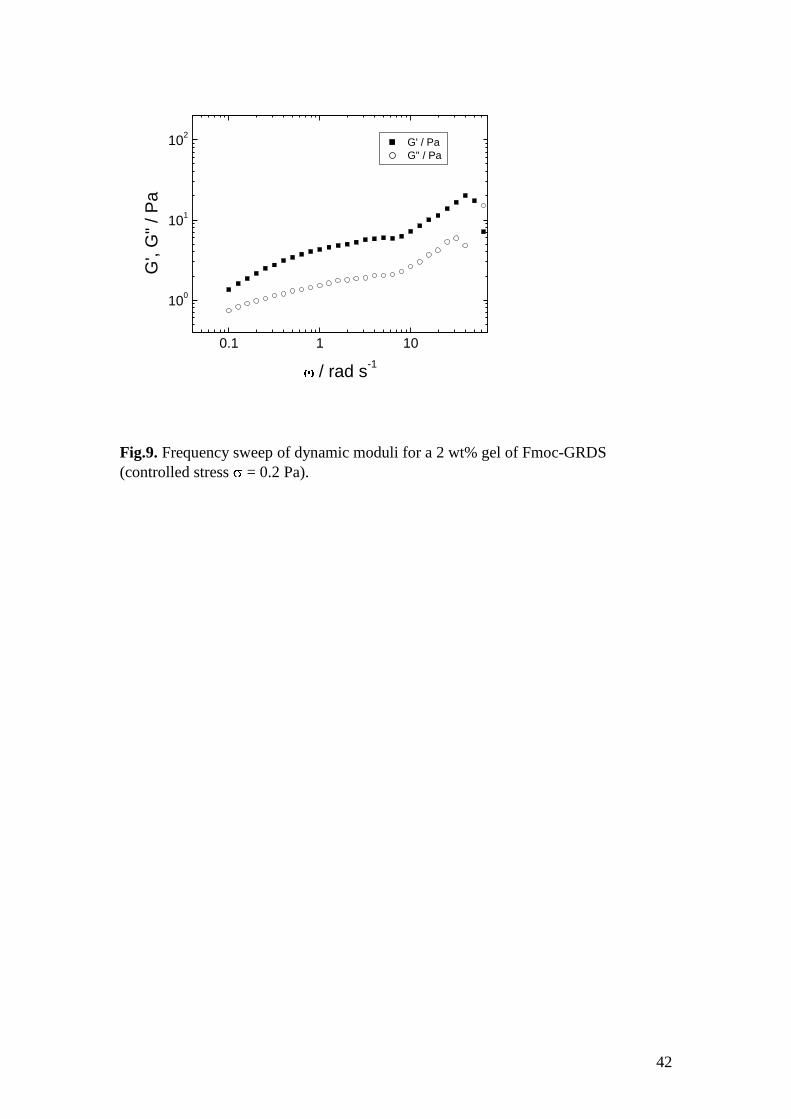
d) Rheology
Attempts were made to measure the dynamic shear moduli of hydrogels formed by
the two Fmoc-tetrapeptides in 2 wt% aqueous solutions. The gel of Fmoc-RGDS
although extremely stiff (apparent values of G in the range 105 – 10
6 Pa were found
in controlled strain experiments at low strain 0.008 – 0.02%) was found to undergo
significant syneresis when subjected even to very low stresses or strains. Therefore
reliable dynamic moduli values could not be obtained. In contrast, although the gel of
Fmoc-GRDS was much weaker, reliable shear rheometry experiments could be
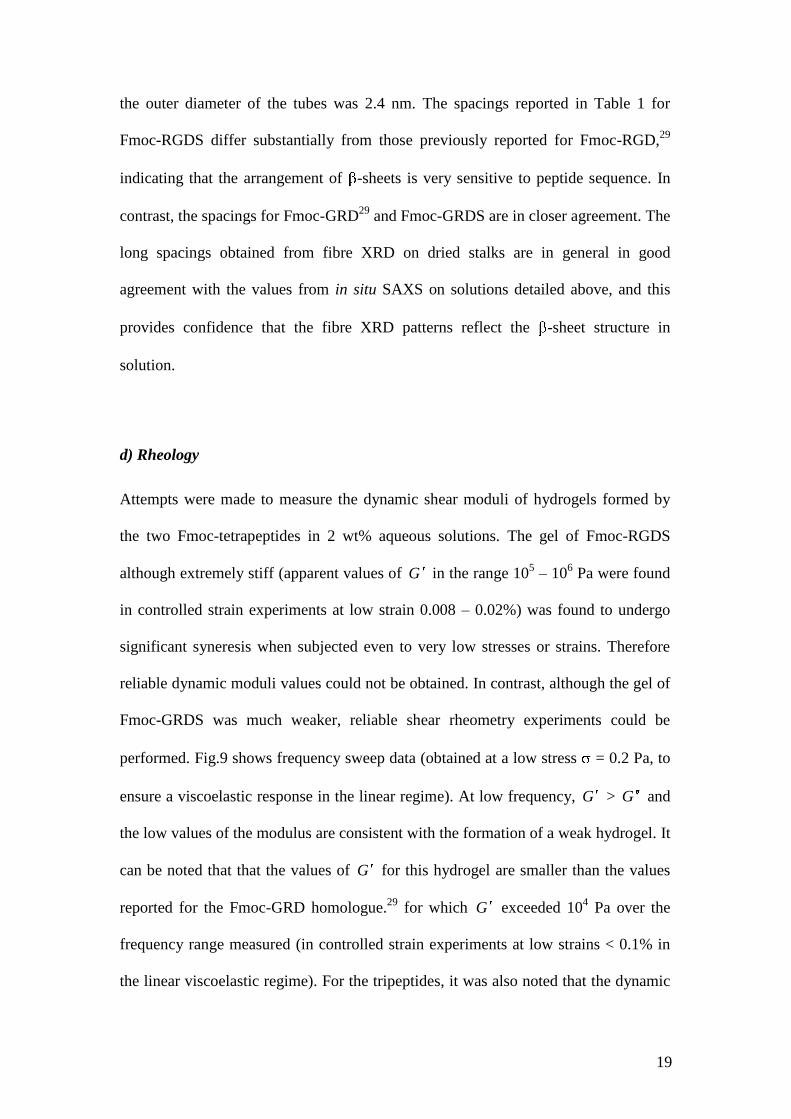
performed. Fig.9 shows frequency sweep data (obtained at a low stress = 0.2 Pa, to
ensure a viscoelastic response in the linear regime). At low frequency, G > G and
the low values of the modulus are consistent with the formation of a weak hydrogel. It
can be noted that that the values of G for this hydrogel are smaller than the values
reported for the Fmoc-GRD homologue.29
for which G exceeded 104 Pa over the
frequency range measured (in controlled strain experiments at low strains < 0.1% in
the linear viscoelastic regime). For the tripeptides, it was also noted that the dynamic
20
elastic modulus was larger for the 2 wt% Fmoc-RGD gel than the 2 wt% Fmoc-GRD
gel.
e) Molecular Dynamics Computer Simulations
In order to examine the stability of different configurations of Fmoc-RGDS and
Fmoc-GRDS molecular dynamics computer simulations in aqueous solution were
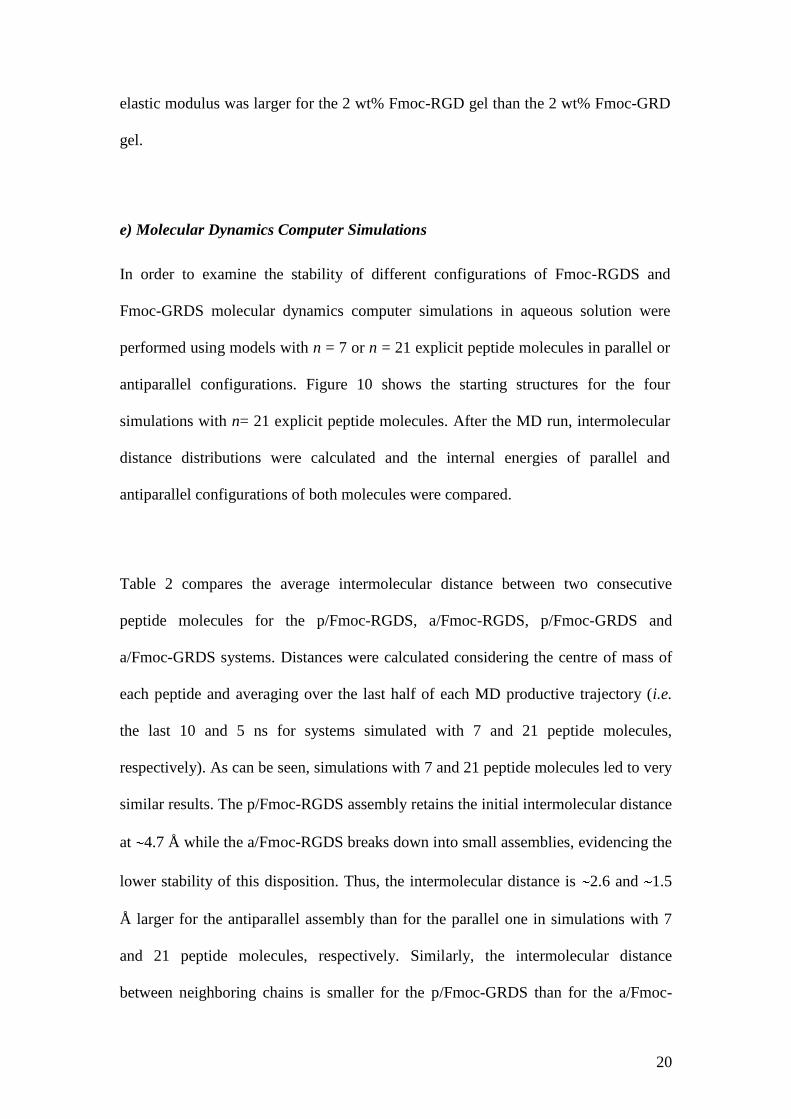
performed using models with n = 7 or n = 21 explicit peptide molecules in parallel or
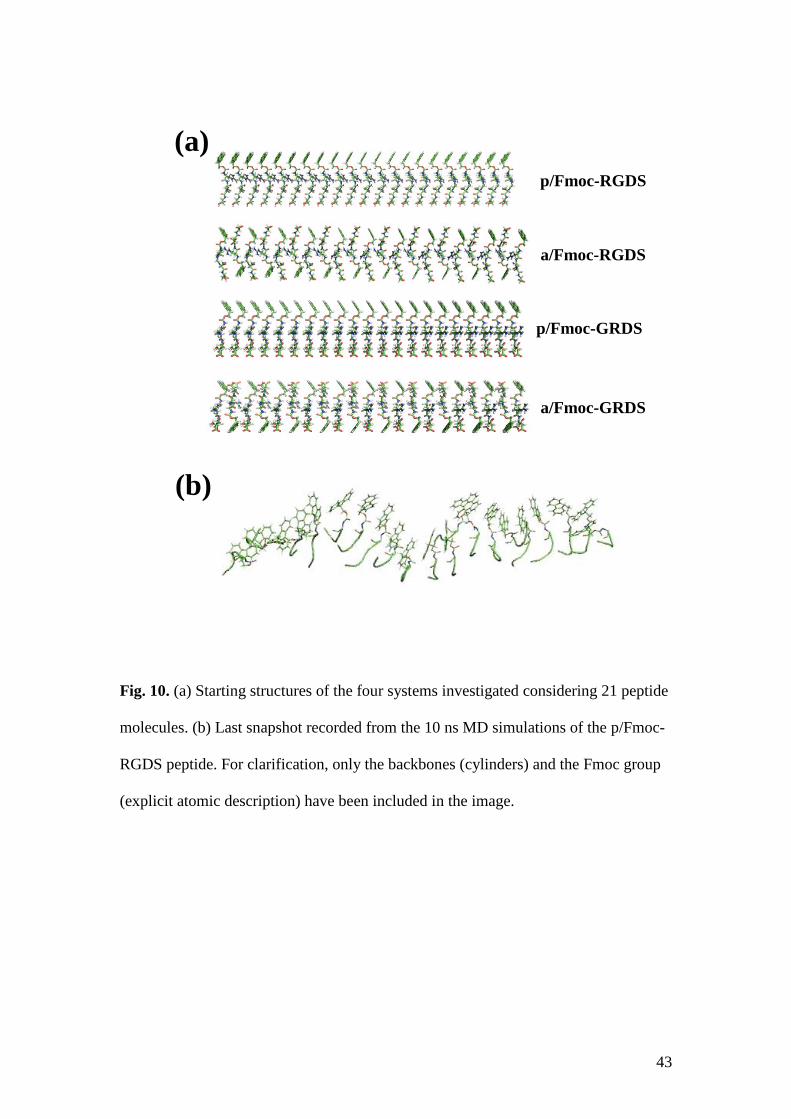
antiparallel configurations. Figure 10 shows the starting structures for the four
simulations with n= 21 explicit peptide molecules. After the MD run, intermolecular
distance distributions were calculated and the internal energies of parallel and
antiparallel configurations of both molecules were compared.
Table 2 compares the average intermolecular distance between two consecutive
peptide molecules for the p/Fmoc-RGDS, a/Fmoc-RGDS, p/Fmoc-GRDS and
a/Fmoc-GRDS systems. Distances were calculated considering the centre of mass of
each peptide and averaging over the last half of each MD productive trajectory (i.e.
the last 10 and 5 ns for systems simulated with 7 and 21 peptide molecules,
respectively). As can be seen, simulations with 7 and 21 peptide molecules led to very
similar results. The p/Fmoc-RGDS assembly retains the initial intermolecular distance
at 4.7 Å while the a/Fmoc-RGDS breaks down into small assemblies, evidencing the
lower stability of this disposition. Thus, the intermolecular distance is 2.6 and 1.5
Å larger for the antiparallel assembly than for the parallel one in simulations with 7
and 21 peptide molecules, respectively. Similarly, the intermolecular distance
between neighboring chains is smaller for the p/Fmoc-GRDS than for the a/Fmoc-
21
GRDS, even though in this case the difference increases to 8 Å, independently of the
number of peptide molecules. This result indicates that Fmoc-GRDS prefers the
parallel assembly. There is also a significant difference between p/Fmoc-RGDS and
p/Fmoc-GRDS in that the intermolecular distance is 0.9 and 1.9 Å larger for the latter
than for the former in simulations with 7 and 21 peptide molecules, respectively,
which reflects the higher tendency of the Fmoc-RGDS peptide to form assemblies.
The final snapshot of the p/Fmoc-RGDS simulation with 21 peptide molecules is
depicted in Figure 10b.
On the other hand, analysis of the p/Fmoc-GRDS systems at the end of the MD
simulations indicates that the initial arrangements, in which neighbouring peptides
were located at the identical intermolecular distances defining a unique assembly
(Figure 10a), transformed into aggregates of smaller assemblies. More specifically,
the system involving 21 peptide chains transformed into four assemblies, each one
being constituted by 4-7 peptide molecules separated by 4.7 Å. These assemblies
tend to aggregate, as is reflected by the shortest distance between the centre of mass
of two peptides belonging to different but neighboring assemblies, which range
between 5.5 and 6.2 Å. This is an important difference with respect to p/Fmoc-RGDS,
in which the 21 peptide molecules remained within the initial assembly (Figure 10b).
Thus, although the Fmoc-RGDS peptide is able to stabilize assemblies involving a
large number of molecules through salt bridges networks (see below), the dimensions
of the assemblies involving Fmoc-GRDS is limited by the formation of weaker
hydrogen bonds. A complete analysis of the interactions involved in both p/Fmoc-
RGDS and p/Fmoc-GRDS is provided below.
22
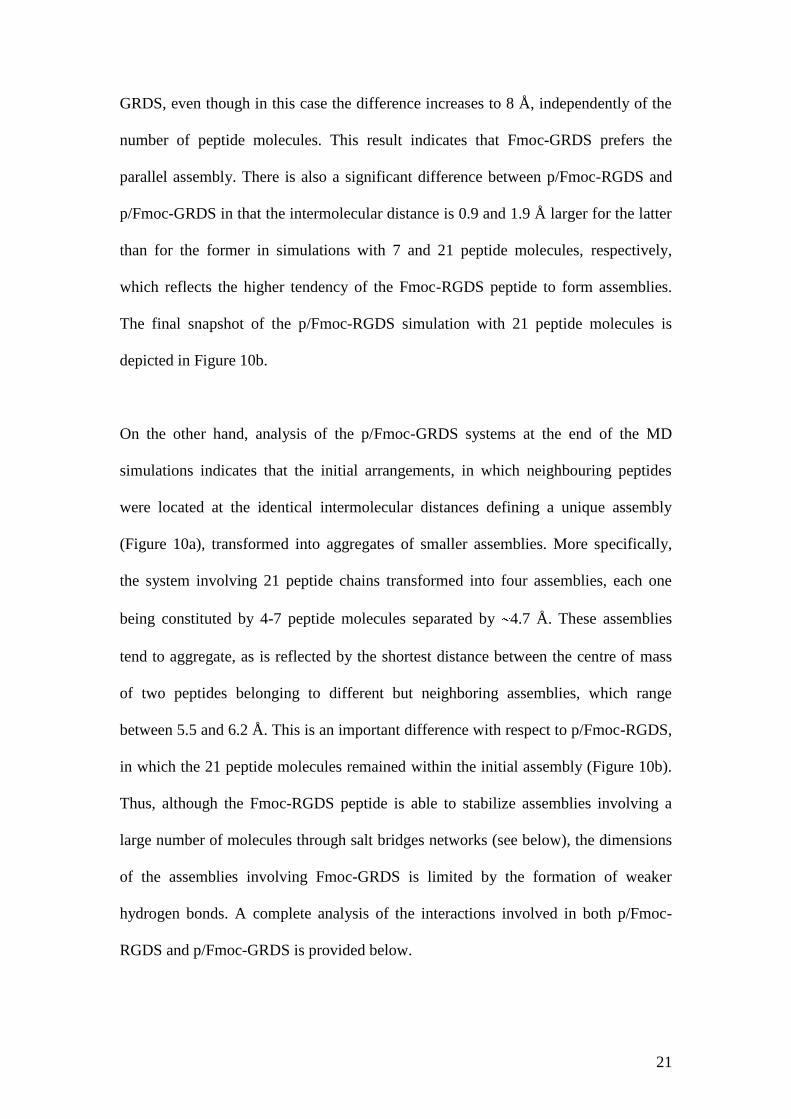
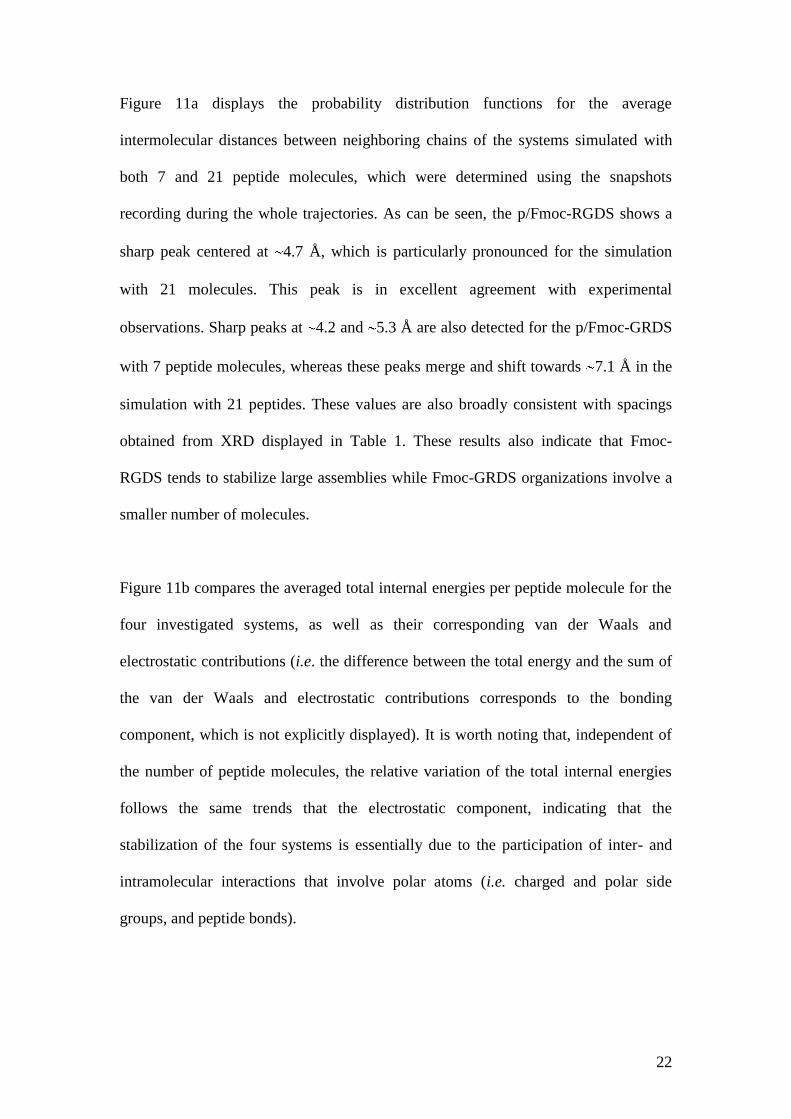
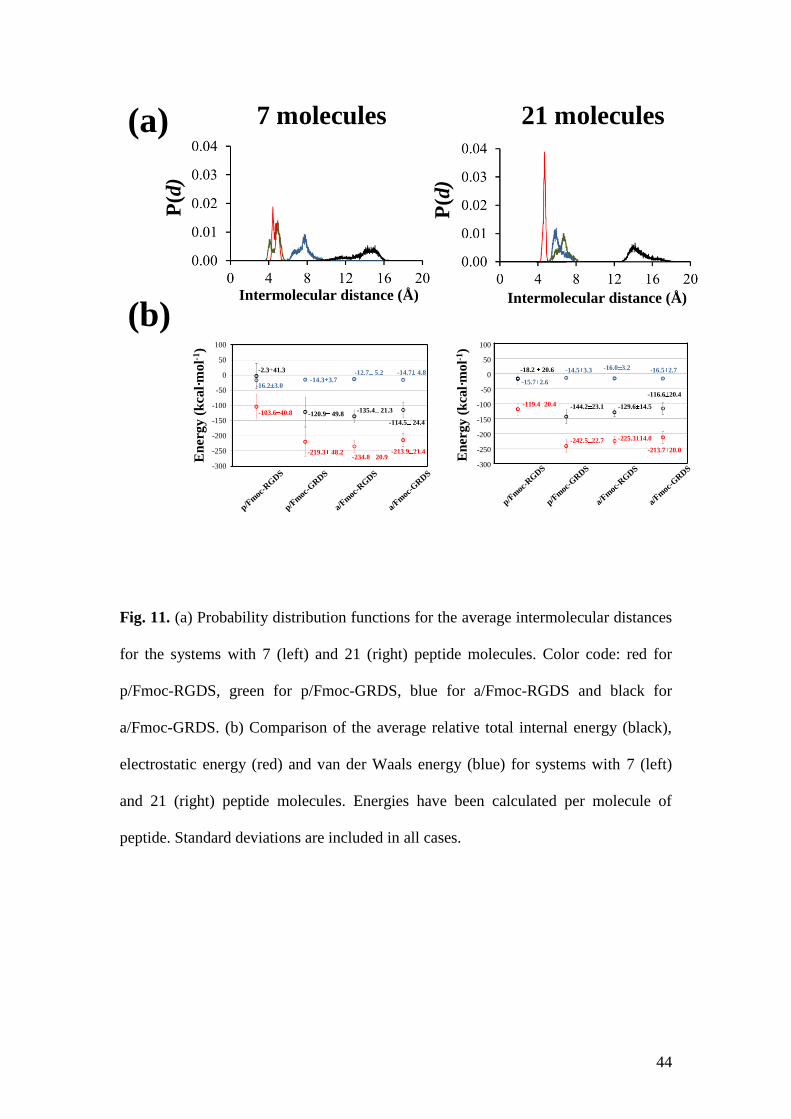
Figure 11a displays the probability distribution functions for the average
intermolecular distances between neighboring chains of the systems simulated with
both 7 and 21 peptide molecules, which were determined using the snapshots
recording during the whole trajectories. As can be seen, the p/Fmoc-RGDS shows a
sharp peak centered at 4.7 Å, which is particularly pronounced for the simulation
with 21 molecules. This peak is in excellent agreement with experimental
observations. Sharp peaks at 4.2 and 5.3 Å are also detected for the p/Fmoc-GRDS
with 7 peptide molecules, whereas these peaks merge and shift towards 7.1 Å in the
simulation with 21 peptides. These values are also broadly consistent with spacings
obtained from XRD displayed in Table 1. These results also indicate that Fmoc-
RGDS tends to stabilize large assemblies while Fmoc-GRDS organizations involve a
smaller number of molecules.
Figure 11b compares the averaged total internal energies per peptide molecule for the
four investigated systems, as well as their corresponding van der Waals and
electrostatic contributions (i.e. the difference between the total energy and the sum of
the van der Waals and electrostatic contributions corresponds to the bonding
component, which is not explicitly displayed). It is worth noting that, independent of
the number of peptide molecules, the relative variation of the total internal energies
follows the same trends that the electrostatic component, indicating that the
stabilization of the four systems is essentially due to the participation of inter- and
intramolecular interactions that involve polar atoms (i.e. charged and polar side
groups, and peptide bonds).
23
Interestingly, the p/Fmoc-RGDS is the least stable system for both simulations with 7
and 21 peptide molecules. This can be attributed to the fact that, in spite of its
tightness, this self-assembly is mainly stabilized through salt bridges between the Arg
and Asp side chains of residues located at the same molecule (intramolecular
interactions) or at consecutive molecules (intermolecular interactions), rather than by
intermolecular hydrogen bonds typically associated to the sheets (Figure 10b). This
conclusion is supported by the FTIR spectra shown in Fig. 1. The simulations reveal
that, in terms of population, such intra- and inter- molecular salt bridges show
occurrences of 28% and 53%, respectively. The importance of salt bridges is
considerably lower for the other three investigated systems (i.e. occurrences are lower
than 7% and 38% for intra- and intermolecular Arg–Asp salt bridges). On the other
hand, the p/Fmoc-GRDS system is essentially stabilized through backbone···backbone
intermolecular hydrogen bonds, even though the participation of inter- and
intramolecular interactions between the side groups of Arg and Ser is not negligible
(i.e. 25% and 20%, respectively).
Summary and Discussion
Both Fmoc-RGDS and Fmoc-GRDS fibrillise under appropriate conditions. The self-
assembly at low concentration is driven by interactions between Fmoc units which
produces many features in the CD spectra. Unexpectedly, the scrambled “control”
peptide Fmoc-GRDS actually self-assembles more readily than Fmoc-RGDS. In
addition, strong alignment of this peptide occurs under shear, even in dilute solution
leading to significant linear dichroism. This system is promising for the development
of aligned biomolecular substrates. The use of either Fmoc-RGDS or Fmoc-GRDS
within collagen-based substrates for cell growth applications is the subject of ongoing
24
research in our labs. 62
It is possible that the reduced tendency for Fmoc-RGDS to
form amyloid fibrils may result in reduced toxicity to cells and hence enhanced
bioactivity. This is presently being investigated further.
The observations from XRD that, at sufficiently high concentration, Fmoc-RGDS
forms antiparallel -sheets is in conflict with the model proposed by Nilsson and
coworkers for Fmoc-F derivatives containing fluorinated phenylalanine residues.63, 64
They propose that stacking of Fmoc residues and exposure of the carboxyl termini
favours a parallel configuration. This model is distinct from that put forward by Uljin
et al. for Fmoc-FF54
and by ourselves for Fmoc- AH (Fmoc- -alanine-histidine)65
based on antiparallel stacking, as confirmed by the presence of a peak in the amide I'
FTIR spectrum in the 1680 – 1690 cm-1
range. On the other hand, XRD data and
FTIR spectra for Fmoc-RGDS do not provide clear cut information on a parallel vs.
antiparallel of the -sheets, but MD simulations seem to indicate a preferred parallel
-sheet configuration. It appears that the -sheet arrangement of short Fmoc peptides
depends on peptide length and/or sequence.
MD computer simulations suggest that Fmoc-RGDS may self-assemble into an
antiparallel configuration, since the parallel configuration was found to be less stable
as salt bridging was found to play a significant role in this case. This finding is in
agreement with the experimental results. In contrast, Fmoc-GRDS forms more stable
assemblies than p/Fmoc-RGDS in either parallel or antiparallel configurations due to
-sheet intermolecular hydrogen bonding interactions. The simulations favour the
parallel configuration of Fmoc-GRDS -sheets, in contrast to Fmoc-RGDS. This is
25
on the basis of the internal energy calculations, as well as the intermolecular distance
distributions (the spacing for a/Fmoc-GRDS is too large).
Gazit and coworkers showed that the Fmoc-tetrapeptides Fmoc-RGDF and Fmoc-
FRGD both form hydrogels containing -sheet hydrogels.66
It may be noted that F is
much more hydrophobic than the serine residue used in our Fmoc-RGDS peptide. In
addition, Gazit’s “scrambled” peptide differs in sequence from Fmoc-GRDS, since in
both of our peptides the terminal serine functionality is retained.
Applications of collagen-based materials in biomedical applications including tissue
growth have been reviewed.67, 68
In future work, we plan to use the two Fmoc-
tetrapeptides to produce collagen-based gels that can be used to grow corneal
fibroblasts.62
These biomaterials offer the potential advantage that the collagen gels
can now be functionalised. i.e. they combine the best of both worlds, the tissue-like
mechanical properties of compressed collagen gels with the chemical functionality of
functionalized tetrapeptides.
Acknowledgements. This work was supported by EPSRC grants EP/F048114/1 and
EP/G026203/1 to IWH. We are grateful to Steve Furzeland and Derek Atkins
(Unilever, Colworth, UK) for the cryo-TEM experiments. Use of the Chemical
Analysis Facility at the University of Reading is acknowledged. We are grateful to Dr
Jeremie Gummel for assistance with SAXS experiments at the ESRF (beamtime ref.
SC2985). Work at Warwick was supported by grants EPSRC EP/F500378/1 and
BBSRC BB/F011199/1. Work in Barcelona was funded by grants MAT2009-09138

26
and 2009SGR1208. Support for the research of C.A. was received through the prize
“ICREA Academia” for excellence in research funded by the Generalitat de
Catalunya.
27
References
1 X. B. Zhao, F. Pan, H. Xu, M. Yaseen, H. H. Shan, C. A. E. Hauser, S. G.
Zhang, and J. R. Lu, Chem. Soc. Rev., 2010, 39, 3480.
2 S. S. Santoso, S. Vauthey, and S. Zhang, Curr. Opin. Colloid Interface Sci.,
2002, 7, 262.
3 S. G. Zhang, Nature Biotechnology, 2003, 21, 1171.
4 X. Zhao and S. Zhang, Trends in Biotechnology, 2004, 22, 470.
5 I. W. Hamley Soft Matter, 2011, 7, 4122.
6 Z. Yang and B. Xu, Chem. Comm., 2004, 2424.
7 Z. Yang, G. Liang, M. Ma, Y. Gao, and B. Xu, J. Mater. Chem., 2007, 17,
850.
8 S. Toledano, R. J. Williams, V. Jayawarna, and R. V. Ulijn, J. Am. Chem.
Soc., 2006, 128, 1070.
9 V. Jayawarna, M. Ali, T. A. Jowitt, A. F. Miller, A. Saiani, J. E. Gough, and
R. V. Ulijn, Adv. Mater., 2006, 18, 611.
10 V. Jayawarna, S. M. Richardson, A. R. Hirst, N. W. Hodson, A. Saiani, J. E.
Gough, and R. V. Ulijn, Acta Biomater., 2009, 5, 934.
11 M. Zhou, A. M. Smith, A. K. Das, N. W. Hodson, R. F. Collins, R. V. Ulijn,
and J. E. Gough, Biomaterials, 2009, 30, 2523.
12 R. J. Mart, R. D. Osborne, M. M. Stevens, and R. V. Ulijn, Soft Matter, 2006,
2, 822.
13 A. Mahler, M. Reches, M. Rechter, S. Cohen, and E. Gazit, Adv. Mater.,
2006, 18, 1365.
14 D. J. Adams, M. F. Butler, W. J. Frith, M. Kirkland, L. Mullen, and P.
Sanderson, Soft Matter, 2009, 5, 1856.
28
15 D. J. Adams, Macromol. Biosci., 2011, 11, 160.
16 E. Ruoslahti and M. D. Pierschbacher, Science, 1987, 238, 491.
17 J. A. Hubbell, Bio-Technology, 1995, 13, 565.
18 M. Tirrell, E. Kokkoli, and M. Biesalski, Surf. Sci., 2002, 500, 61.
19 M. D. Mager, V. LaPointe, and M. M. Stevens, Nature Chemistry, 2011, 3,
582.
20 J. Samanen, F. Ali, T. Romoff, R. Calvo, E. Sorenson, J. Vasko, B. Storer, D.
Berry, D. Bennett, M. Strohsacker, D. Powers, J. Stadel, and A. Nichols, J.
Med. Chem., 1991, 34, 3114.
21 L. Alig, A. Edenhofer, P. Hadvary, M. Hurzeler, D. Knopp, M. Muller, B.
Steiner, A. Trzeciak, and T. Weller, J. Med. Chem., 1992, 35, 4393.
22 M. O. Guler, L. Hsu, S. Soukasene, D. A. Harrington, J. F. Hulvat, and S. I.
Stupp, Biomacromolecules, 2006, 7, 1855.
23 T. Muraoka, C.-Y. Koh, H. Cui, and S. I. Stupp, Angew. Chem., Int. Ed. Engl.,
2009, 38, 5946.
24 M. J. Webber, J. Tongers, M.-A. Renault, J. G. Roncalli, D. W. Losordo, and
S. I. Stupp, Acta Biomater., 2010, 6, 3.
25 Y. Jin, X.-D. Xu, C.-S. Chen, S.-X. Cheng, X.-Z. Zhang, and R.-X. Zhuo,
Macromol.Rapid Comm., 2009, 29, 1726.
26 U. Hersel, C. Dahmen, and H. Kessler, Biomaterials, 2003, 24, 4385.
27 E. L. Bakota, Y. Wang, F. R. Danesh, and J. D. Hartgerink,
Biomacromolecules, 2011, 12, 1651.
28 S. L. Gras, A. K. Tickler, A. M. Squires, G. L. Devlin, M. A. Horton, C. M.
Dobson, and C. MacPhee, Biomaterials, 2008, 29, 1553.
29
29 G. Cheng, V. Castelletto, R. Jones, C. J. Connon, and I. W. Hamley, Soft
Matter, 2011, 7, 1326.
30 M. D. Pierschbacher and E. Ruoslahti, Nature (London), 1984, 309, 30.
31 M. D. Pierschbacher and E. Ruoslahti, J. Biol. Chem., 1987, 262, 17294.
32 Y. Hirano, M. Okuno, T. Hayashi, K. Goto, and A. Nakajima, J. Biomater.
Sci.-Polym. Ed., 1993, 4, 235.
33 R. Marrington, T. R. Dafforn, D. J. Halsall, and A. Rodger, Biophys. J., 2004,
87, 2002.
34 R. Marrington, T. R. Dafforn, D. J. Halsall, J. I. MacDonald, M. Hicks, and A.
Rodger, Analyst, 2005, 130, 1608.
35 Y. Duan, C. Wu, S. Chowdhury, M. C. Lee, G. M. Xiong, W. Zhang, R.
Yang, P. Cieplak, R. Luo, T. Lee, J. Caldwell, J. M. Wang, and P. Kollman, J.
Comput. Chem., 2003, 24, 1999.
36 W. D. Cornell, P. Cieplak, C. I. Bayly, I. R. Gould, K. M. Merz, D. M.
Ferguson, D. C. Spellmeyer, T. Fox, J. W. Caldwell, and P. A. Kollman, J.
Am. Chem. Soc., 1995, 117, 5179.
37 T. Darden, D. York, and L. Pedersen, J. Chem. Phys., 1993, 98, 10089.
38 H. J. C. Berendsen, J. P. M. Postma, W. F. Vangunsteren, A. Dinola, and J. R.
Haak, J. Chem. Phys., 1984, 81, 3684.
39 J. P. Ryckaert, G. Ciccotti, and H. J. C. Berendsen, J. Comput. Phys., 1977,
23, 327.
40 J. C. Phillips, R. Braun, W. Wang, J. Gumbart, E. Tajkhorshid, E. Villa, C.
Chipot, R. D. Skeel, L. Kale, and K. Schulten, J. Comput. Chem., 2005, 26,
1781.
30
41 W. L. Jorgensen, J. Chandrasekhar, J. D. Madura, R. W. Impey, and M. L.
Klein, J. Chem. Phys., 1983, 79, 926.
42 A. Barth, Biochim. Biophys. Acta-Bioenerg., 2007, 1767, 1073.
43 A. Barth and C. Zscherp, Q. Rev. Biophys., 2002, 35, 369.
44 L. J. Bellamy, 'The infra-red spectra of complex molecules', Chapman and
Hall, 1975.
45 S. Krimm and J. Bandekar, Adv. Protein Chem., 1986, 38, 181.
46 P. Haris and D. Chapman, Biopolymers, 1995, 37, 251.
47 H. Gaussier, H. Morency, M. C. Lavoie, and M. Subirade, Appl. Environ.
Microbiol., 2002, 68, 4803.
48 J. T. Pelton and L. R. McLean, Anal. Biochem., 2000, 277, 167.
49 B. Stuart, 'Biological Applications of Infrared Spectroscopy', Wiley, 1997.
50 R. W. Woody, in 'Circular dichroism of peptides and proteins', ed. K.
Nakanishi, N. Berova, and R. W. Woody, New York, 1994.
51 W. V. Mayneord and E. M. F. Roe, Proceedings of the Royal Society
(London), Series A, 1937, 158, 634.
52 Z. Yang, H. Gu, D. Fu, P. Gao, J. K. W. Lam, and B. Xu, Adv. Mater., 2004,
16, 1440.
53 Y. Zhang, H. Gu, Z. Yang, and B. Xu, J. Am. Chem. Soc., 2003, 125, 13680.
54 A. M. Smith, R. J. Williams, C. Tang, P. Coppo, R. F. Collins, M. L. Turner,
A. Saiani, and R. V. Ulijn, Adv. Mater., 2008, 20, 37.
55 M. R. Hicks, J. Kowalski, and A. Rodger, Chem. Soc. Rev., 2010, 39, 3380.
56 D. M. Ryan, S. B. Anderson, and B. L. Nilsson, Soft Matter, 2010, 6, 3220.
57 I. W. Hamley Angew. Chem., Int. Ed. Engl., 2007, 46, 8128.
58 J. Kohlbrecher, in 'http://kur.web.psi.ch/sans1/SANSSoft/sasfit.html', 2009.
31
59 G. Cheng, V. Castelletto, C. M. Moulton, G. E. Newby, and I. W. Hamley
Langmuir, 2010, 26, 4990.
60 T. E. Creighton, 'Proteins. Structures and Molecular Properties',
W.H.Freeman, 1993.
61 H. Xu, A. K. Das, M. Horie, M. S. Shaik, A. M. Smith, Y. Luo, X. Lu, R.
Collins, S. Y. Liem, A. Song, P. L. A. Popelier, M. L. Turner, P. Xiao, I. A.
Kinloch, and R. V. Ulijn, Nanoscale, 2010, 2, 960.
62 R. R. Jones, V. Castelletto, C. J. Connon, and I. W. Hamley in preparation,
2011.
63 D. M. Ryan, T. M. Doran, and B. L. Nilsson, Chem. Comm., 2011, 47, 475.
64 D. M. Ryan, T. M. Doran, S. B. Anderson, and B. L. Nilsson, Langmuir,
2011, 27, 4029.
65 V. Castelletto, G. Cheng, B. W. Greenland, and I. W. Hamley, Langmuir,
2011, 27, 2980.
66 R. Orbach, L. Adler-Abramovich, S. Zigerson, I. Mironi-Harpaz, D. Seliktar,
and E. Gazit, Biomacromolecules, 2009, 10, 2646.
67 C. H. Lee, A. Singla, and Y. Lee, Int. J. Pharm., 2001, 221, 1.
68 S. van Vlierberghe, P. Dubruel, and E. Schacht, Biomacromolecules, 2011,
12, 1387.
32
Table 1. Spacings (in Å) from X-ray diffraction patterns
Fmoc-RGDS (± 0.02,
unless stated)
Fmoc-GRDS (± 0.02,
unless stated)
25.6 ± 0.2 (e) 31.9 ± 0.2 (e)
16.1 ± 0.1 (e)
11.6 ± 0.1 (e) 12.8 ± 0.1 (e)
10.09 (e)
9.92 (e) 9.26 (e)
7.78 (e)
6.76 (e) 6.29 (e)
5.50 (e)
4.48* (m) 4.69* (m)
3.86 (m) 3.86 (m)
4.17 (m)
3.55 (m) 3.46 (m)
Key. e: Equatorial, m: meridional, i: isotropic, * primary meridional reflection
Table 2. Average intermolecular distances, calculated from MD simulations,
considering the centers of masses of consecutive molecules, for systems with 7 or 21
peptides. Data is expressed as an average in Å ± 2 times the standard deviation.
p/Fmoc-RGDS a/Fmoc-RGDS p/Fmoc-GRDS a/Fmoc-GRDS
7 molecules 4.72 0.53 7.28 2.35 5.62 2.23 13.57 4.66
21 molecules 4.67 0.63 6.19 2.64 6.61 2.82 14.70 4.56
33
Figures
NH
O
Wang resin-Fmoc-S
O
ONH
O
O
O
O
b, Fmoc-D-OH
a
a
a
b, Fmoc-G-OHa
Fmoc SPPS Reagents:
a) Piperidine/DMF(1 : 4)(for deprotection of Fmoc)
b) 3 equiv HBTU/HOBt and 5 equiv iPr2NE in DMF(for activation of Fmoc-Xxx-OH)
c) TFA (95%), triisopropylsilane (2.5%), H2O(2.5%)
O NH
HN
NH
O
O
OHN
O
Fmoc-RGDS
NH
NH2
HN
HO
O
OH
O
HO
O NH
HN
NH
O
O
OHN
O
Fmoc-GRDS
HO
HN
H2N
NH
O
OH
O
HO
b, Fmoc-R-OH
c
b, Fmoc-D-OH
ab, Fmoc-R-OH
a
b, Fmoc-G-OH
c
Scheme 1. Synthesis of Fmoc-Tetrapeptides Fmoc-RGDS and Fmoc-GRDS. Solid
phase peptide synthesis reagents: a) Piperidine/DMF(1:4); b) 3 equiv HBTU/HOBt
and 5 equiv iPr2NE in DMF; c) TFA (95%), triisopropylsilane (2.5%), H2O(2.5%).
34
1500 1550 1600 1650 1700 1750 1800
d
c
b
a
Absorb
ance
wavenumber (cm-1)
(a) 3% Fmoc-RGDS
(b) 3% Fmoc-GRDS
(c) 1% Fmoc-RGDS
(d) 1% Fmoc-GRDS
Fig.1. FTIR spectra of Fmoc-RGDS and Fmoc-GRDS measured for 1 wt% and 3
wt% solutions in D2O. Spectra are shifted vertically for convenience.
35
200 220 240 260 280-30
-20
-10
0
10
20
30
(a)
10
-4[
] /
de
g c
m2 d
mol-1
/ nm
1% Fmoc-RGDS
1% Fmoc-GRDS
200 220 240 260 280 300 320 340-5
-4
-3
-2
-1
0
1
2
3
4
5
(b)
10
-4[
] / deg c
m2 d
mol-1
/ nm
0.02% Fmoc-GRDS 0 degrees
0.02% Fmoc-RGDS 0 degrees
0.02% Fmoc-GRDS 90 degrees
0.02% Fmoc-RGDS 90 degrees
Fig.2. CD spectra for solutions of the two Fmoc-tetrapeptides (a) 1 wt%, (b) 0.02
wt%. The spectra in (a) were recorded on a Chirascan spectrometer with the cuvette
in the usual vertical configuration, while those in (b) were recorded on a Jasci J-815
spectrometer with a modified cell holder, enabling sample rotation.
36
200 220 240 260 280 300 320 340-0.010
-0.005
0.000
0.005
0.010
(a)
LD
/
Absorb
ance
/ nm
0.02% Fmoc-GRDS Cuvette 0 degrees
0.02% Fmoc-RGDS Cuvette 0 degrees
0.02% Fmoc-GRDS Cuvette 90 degrees
0.02% Fmoc-RGDS Cuvette 90 degrees
200 220 240 260 280 300 320 340-0.010
-0.005
0.000
0.005
(b)
LD
/
Ab
so
rba
nce
/ nm
0.02% Fmoc-GRDS Couette 3000 rpm
0.02% Fmoc-RGDS Couette 3000 rpm
Fig.3. LD spectra of Fmoc-GRDS and Fmoc-RGDS peptides in water at 0.02 wt%.
Samples were placed in a) in a rectangular 1 mm path length cell, the same as for CD
measurements in Fig.2b and b) in a 0.5 mm path length Couette alignment cell.
37
220 240 260 280 300 320 340-0.010
-0.005
0.000
0.005
0.010
LD
/
Absorb
ance
/ nm
0.2% Fmoc-GRDS Couette 3000 rpm
0.2% Fmoc-RGDS Couette 3000 rpm
Fig. 4. LD spectra of Fmoc-GRDS and Fmoc-RGDS peptides in water at 0.2 wt% in a
0.5 mm path length Couette alignment cell.
38
Fig.5. Polarized optical microscope images of Congo red stained solutions (1 wt%
peptide) of (a) Fmoc-RGDS, (b) Fmoc-GRDS. The scale bars represent 100 m.
39
Fig.6. Cryo-TEM images. (a) Fmoc-RGDS (2% wt in water), (b) Fmoc-GRDS (1% wt
in water). The scalebars represent 200 nm.
40
0 1 2 3 4 510
-5
10-4
10-3
10-2
10-1
100
101
102
Fmoc-GRDS
Fmoc-RGDS
Inte
nsity / a
rb. units
q / nm-1
Fig.7. SAXS data (30
oC) for 2 wt% solutions including (red line) cylinder form
factor fits. The data for Fmoc-RGDS has shifted (intensity reduction by a factor of
10) for convenience.
41
(a) (b)
Fig.8. Fibre x-ray diffraction patterns obtained from dried stalks. (a) Fmoc-RGDS, (b)
Fmoc-GRDS.
42
0.1 1 10
100
101
102
G', G
" / P
a
/ rad s-1
G' / Pa
G" / Pa
Fig.9. Frequency sweep of dynamic moduli for a 2 wt% gel of Fmoc-GRDS
(controlled stress = 0.2 Pa).
43
Fig. 10. (a) Starting structures of the four systems investigated considering 21 peptide
molecules. (b) Last snapshot recorded from the 10 ns MD simulations of the p/Fmoc-
RGDS peptide. For clarification, only the backbones (cylinders) and the Fmoc group
(explicit atomic description) have been included in the image.
p/Fmoc-RGDS
a/Fmoc-RGDS
p/Fmoc-GRDS
a/Fmoc-GRDS
(a)
(b)
44
Fig. 11. (a) Probability distribution functions for the average intermolecular distances
for the systems with 7 (left) and 21 (right) peptide molecules. Color code: red for
p/Fmoc-RGDS, green for p/Fmoc-GRDS, blue for a/Fmoc-RGDS and black for
a/Fmoc-GRDS. (b) Comparison of the average relative total internal energy (black),
electrostatic energy (red) and van der Waals energy (blue) for systems with 7 (left)
and 21 (right) peptide molecules. Energies have been calculated per molecule of
peptide. Standard deviations are included in all cases.
100
50
0
-50
-100
-150
-200
-250
-300
-18.2 20.6
-15.7 2.6
-119.4 20.4 -144.2 23.1
-242.5 22.7
-14.5 3.3 -16.0 3.2
-129.6 14.5
-213.7 20.0
-16.5 2.7
-116.6 20.4
-225.3 14.0
En
erg
y (
kca
l·m
ol-1
)
a/Fm
oc-R
GD
S
p/Fm
oc-R
GD
S
a/Fm
oc-G
RD
S
p/Fm
oc-G
RD
S
100
50
0
-50
-100
-150
-200
-250
-300
a/Fm
oc-R
GD
S
p/Fm
oc-R
GD
S
a/Fm
oc-G
RD
S
p/Fm
oc-G
RD
S
-2.3 41.3
-16.2 3.0
-103.6 40.8 -120.9 49.8
-219.3 48.2
-14.3 3.7-12.7 5.2
-135.4 21.3
-213.9 21.4
-14.7 4.8
-114.5 24.4
En
ergy (
kca
l·m
ol-1
)
-234.8 20.9
P(d
)
Intermolecular distance (Å)Intermolecular distance (Å)
P(d
)
(a)
(b)
7 molecules 21 molecules

45
TOC Entry