Embed Size (px)
Citation preview
Semiannual Report Of UST Performance Measures End Of Fiscal Year 2017 (October 1, 2016 – September 30, 2017)
Where does EPA get the performance data?
Twice each year, EPA collects data from states and territories regarding underground storage tank (UST) performance measures and makes the data publicly available. EPA directly provides data on work in Indian country, since the Agency implements the program for those sites. These data include information such as the number of active and closed tanks, releases confirmed, cleanups initiated and completed, facilities in compliance with UST requirements, and inspections. EPA compiles the data and presents it in table format for all states, territories, and Indian country.
What are the UST performance measures?
The most current definitions for the UST performance measures are available on EPA’s website www.epa.gov/ust/ust-performance-measures under Definitions.
What is in the end of fiscal year (FY) 2017 report? Page
UST Corrective Action Measures For End Of FY 2017 Alphabetical By State Within Region 1 National Totals 5
UST National Backlog Graph 6 UST Compliance Measures For End Of FY 2017 7
States With More Stringent SOC Requirements 9 Inspection/Delivery Prohibition Actions For End Of FY 2017 11
How does the UST program’s performance compare with its goals?
FY 2017 UST Program Performance FY 2017 UST Program Goal
Exceeded the FY 2017 goal by completing 8,775 cleanups; missed the Indian country cleanup goal, but completed 21 cleanups in Indian country
Complete 8,600 or more cleanups, including 26 or more in Indian country
Exceeded the FY 2017 goal by achieving a significant operational compliance rate of 71.6 percent
Achieve a significant operational compliance rate of 71.5 percent or higher
Exceeded the FY 2017 goal by reporting 5,678 newly-confirmed releases
Decrease newly-confirmed releases to fewer than 6,285
Missed the FY 2017 goal, but reduced to 12.7 percent the percent of confirmed releases at UST facilities remaining to be cleaned up
Reduce to 12 percent or less the percent of confirmed releases at UST facilities remaining to be cleaned up
What other highlights are included in the end of FY 2017 report?
• There are 555,079 active USTs (at approximately 200,000 sites) which are regulated by EPA’s UST program
• Since the 1984 inception of the UST program, 1,856,451 USTs have been properly closed
Office of Underground Storage Tanks, Washington, D.C. 20460 November 2017 www.epa.gov/ust
• 93,228 on-site inspections at federally-regulated UST facilities were conducted between October 2016 and September 2017; of those: – 92,904 were conducted by states, territories, and third-party inspectors – 324 were conducted by EPA and credentialed tribal inspectors in Indian country
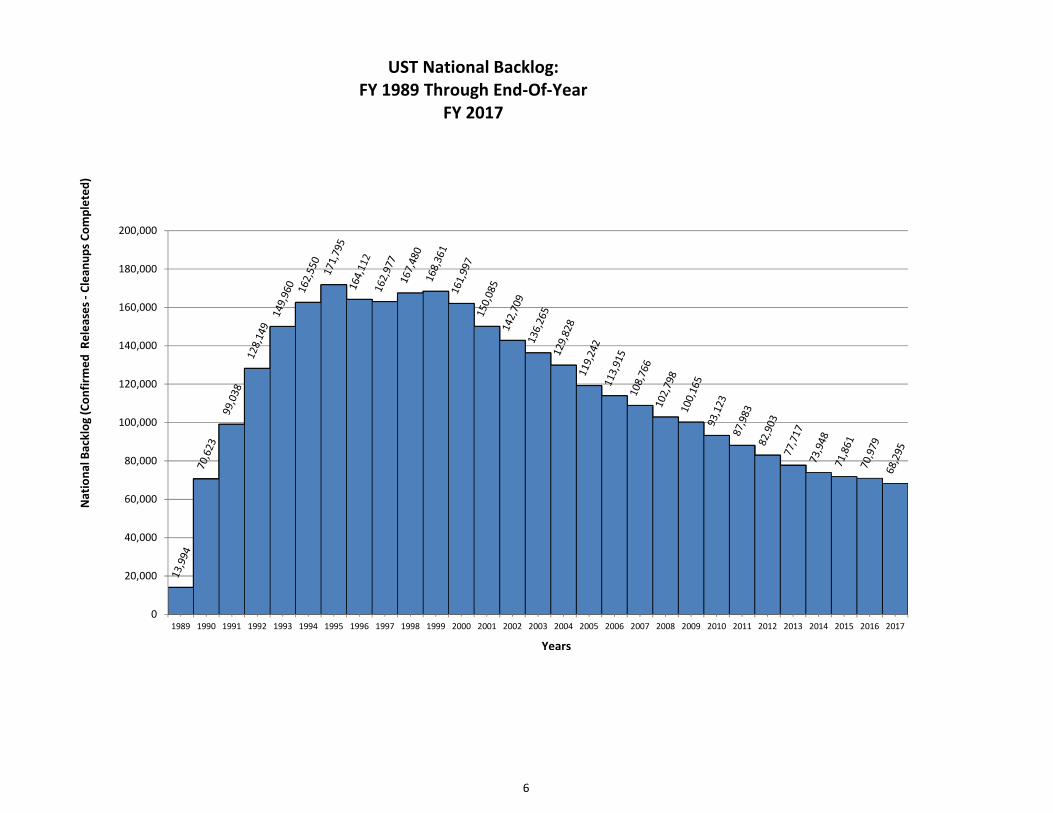
How are EPA and its partners doing at reducing the backlog of UST releases?
Reducing the number of releases remaining to be cleaned up (also known as the backlog) remains a priority for the national UST program. The graphic on page 6 of this report shows that the national UST backlog of releases remaining to be cleaned up has been declining since 2000.
For this reporting period, of the 538,193 releases reported since the beginning of the UST program, 469,898—or 87.3 percent—have been cleaned up. That means 68,295—or 12.7 percent of—confirmed releases at UST facilities remain to be cleaned up. Our data show EPA, states, territories, tribes, and other UST partners are making continued progress in reducing the percent of confirmed releases at UST facilities remaining to be cleaned up.
Where can I find performance data from previous years?
EPA’s website www.epa.gov/ust/ust-performance-measures provides the most current report, as well as historical reports beginning with FY 1988, the first year EPA reported UST data. Reports are listed beginning with the most recent first.
For more information, contact Susan Burnell at [email protected] or 202-564-0766 of EPA’s Office of
Underground Storage Tanks.
Office of Underground Storage Tanks, Washington, D.C. 20460 November 2017 www.epa.gov/ust
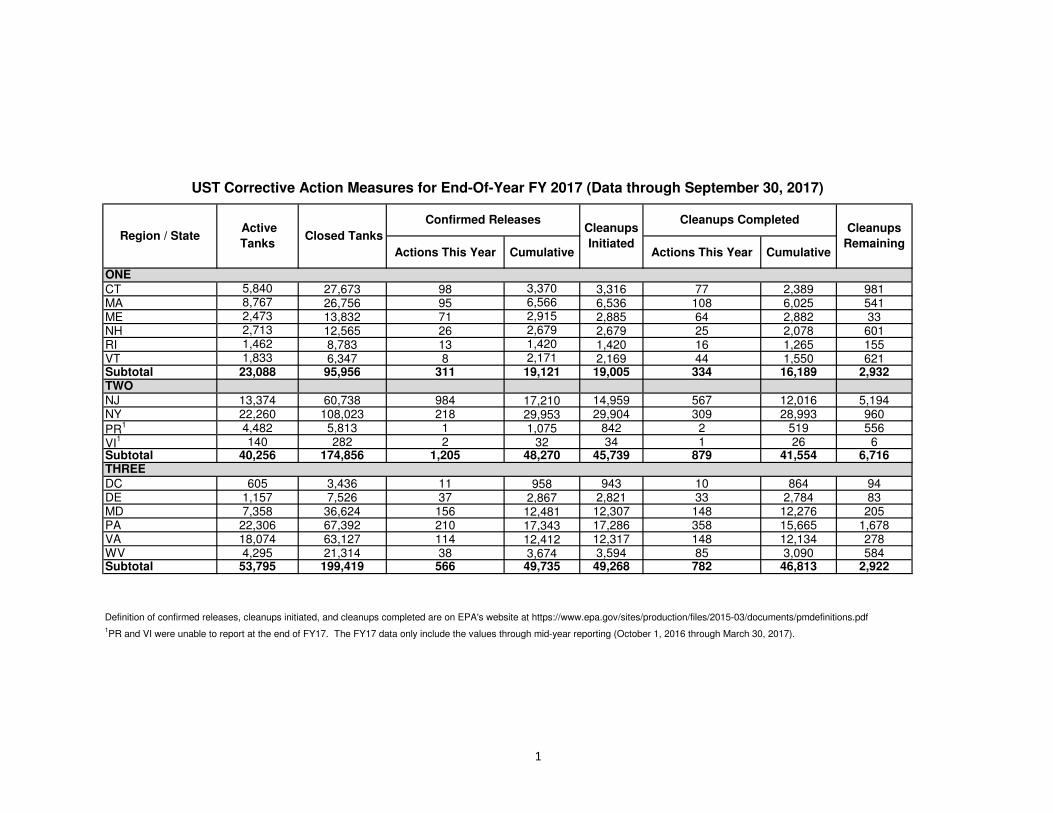
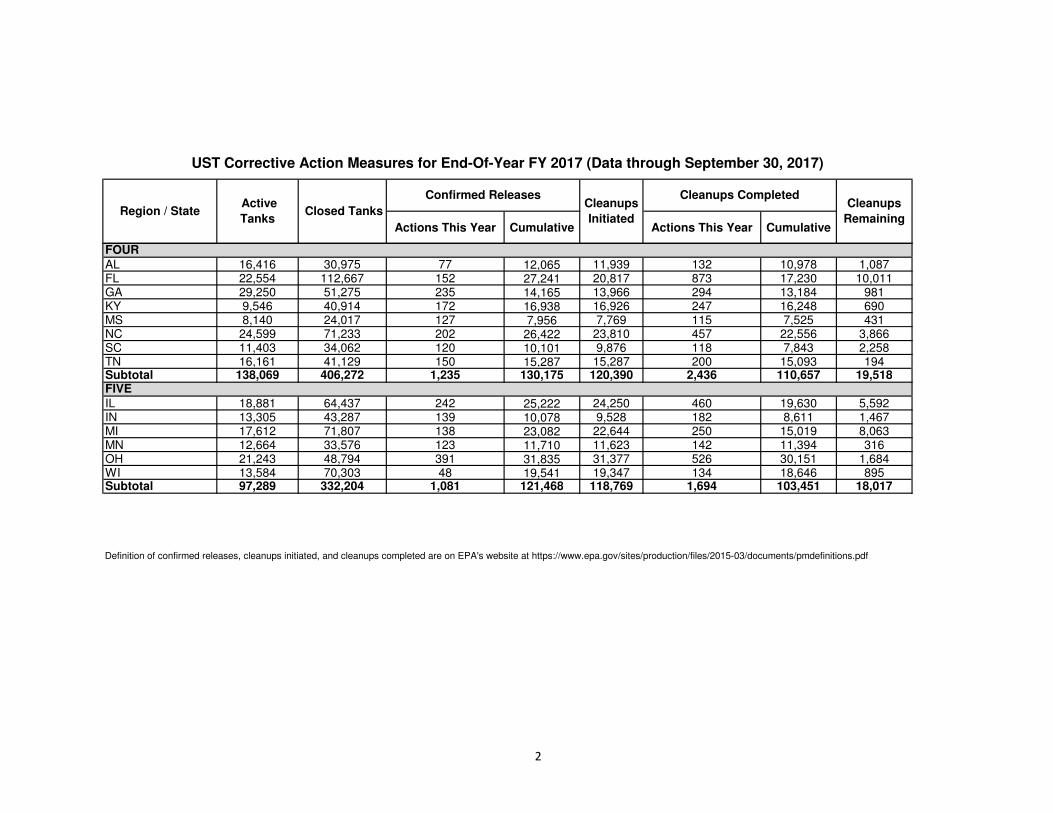
UST Corrective Action Measures for End-Of-Year FY 2017 (Data through September 30, 2017)
Region / State Active
Tanks Closed Tanks
Confirmed Releases Cleanups
Initiated
Cleanups Completed Cleanups
Remaining Actions This Year Cumulative Actions This Year Cumulative
ONE
CT 5,840 27,673 98 3,370 3,316 77 2,389 981 MA 8,767 26,756 95 6,566 6,536 108 6,025 541 ME 2,473 13,832 71 2,915 2,885 64 2,882 33 NH 2,713 12,565 26 2,679 2,679 25 2,078 601 RI 1,462 8,783 13 1,420 1,420 16 1,265 155 VT 1,833 6,347 8 2,171 2,169 44 1,550 621 Subtotal 23,088 95,956 311 19,121 19,005 334 16,189 2,932 TWO
NJ 13,374 60,738 984 17,210 14,959 567 12,016 5,194 NY 22,260 108,023 218 29,953 29,904 309 28,993 960
1PR 4,482 5,813 1 1,075 842 2 519 556
1VI 140 282 2 32 34 1 26 6 Subtotal 40,256 174,856 1,205 48,270 45,739 879 41,554 6,716 THREE
DC 605 3,436 11 958 943 10 864 94 DE 1,157 7,526 37 2,867 2,821 33 2,784 83 MD 7,358 36,624 156 12,481 12,307 148 12,276 205 PA 22,306 67,392 210 17,343 17,286 358 15,665 1,678 VA 18,074 63,127 114 12,412 12,317 148 12,134 278 WV 4,295 21,314 38 3,674 3,594 85 3,090 584 Subtotal 53,795 199,419 566 49,735 49,268 782 46,813 2,922
Definition of confirmed releases, cleanups initiated, and cleanups completed are on EPA's website at https://www.epa.gov/sites/production/files/2015-03/documents/pmdefinitions.pdf
PR and VI were unable to report at the end of FY17. The FY17 data only include the values through mid-year reporting (October 1, 2016 through March 30, 2017).
1
1
UST Corrective Action Measures for End-Of-Year FY 2017 (Data through September 30, 2017)
Region / State Active
Tanks Closed Tanks
Confirmed Releases Cleanups
Initiated
Cleanups Completed Cleanups
Remaining Actions This Year Cumulative Actions This Year Cumulative
FOUR
AL 16,416 30,975 77 12,065 11,939 132 10,978 1,087 FL 22,554 112,667 152 27,241 20,817 873 17,230 10,011 GA 29,250 51,275 235 14,165 13,966 294 13,184 981 KY 9,546 40,914 172 16,938 16,926 247 16,248 690 MS 8,140 24,017 127 7,956 7,769 115 7,525 431 NC 24,599 71,233 202 26,422 23,810 457 22,556 3,866 SC 11,403 34,062 120 10,101 9,876 118 7,843 2,258 TN 16,161 41,129 150 15,287 15,287 200 15,093 194 Subtotal 138,069 406,272 1,235 130,175 120,390 2,436 110,657 19,518 FIVE
IL 18,881 64,437 242 25,222 24,250 460 19,630 5,592 IN 13,305 43,287 139 10,078 9,528 182 8,611 1,467 MI 17,612 71,807 138 23,082 22,644 250 15,019 8,063 MN 12,664 33,576 123 11,710 11,623 142 11,394 316 OH 21,243 48,794 391 31,835 31,377 526 30,151 1,684 WI 13,584 70,303 48 19,541 19,347 134 18,646 895 Subtotal 97,289 332,204 1,081 121,468 118,769 1,694 103,451 18,017
Definition of confirmed releases, cleanups initiated, and cleanups completed are on EPA's website at https://www.epa.gov/sites/production/files/2015-03/documents/pmdefinitions.pdf
2
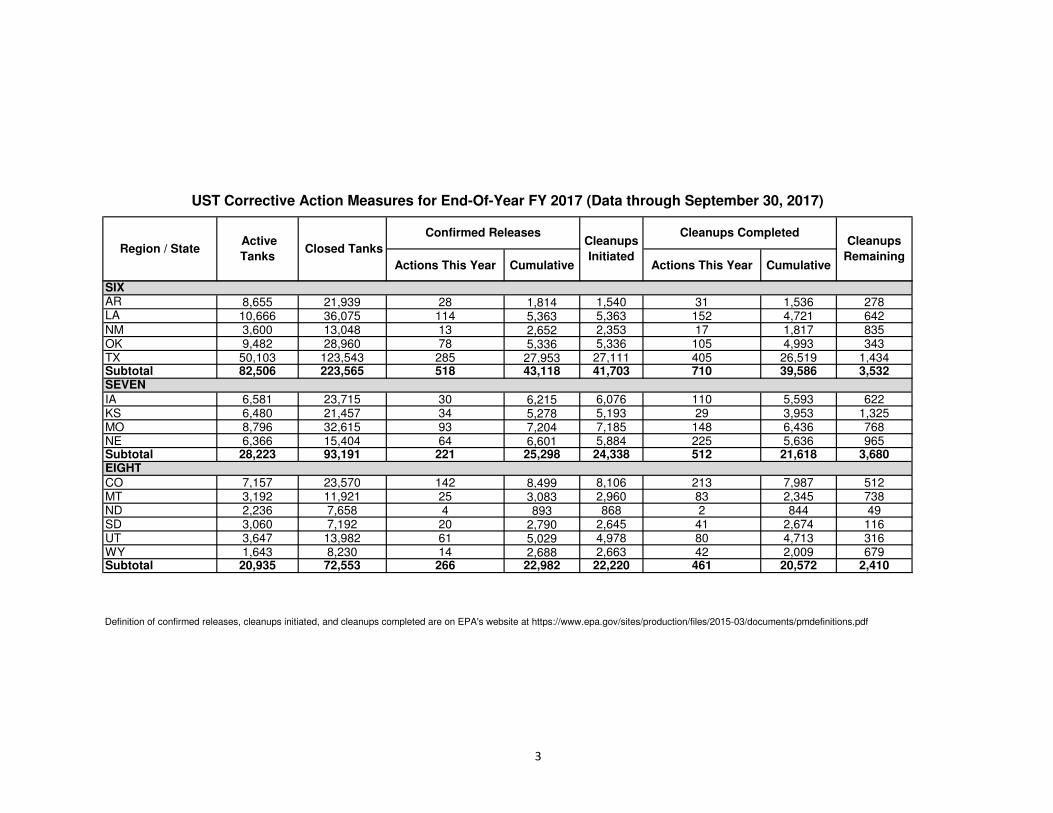
UST Corrective Action Measures for End-Of-Year FY 2017 (Data through September 30, 2017)
Region / State Active
Tanks Closed Tanks
Confirmed Releases Cleanups
Initiated
Cleanups Completed Cleanups
Remaining Actions This Year Cumulative Actions This Year Cumulative
SIX AR 8,655 21,939 28 1,814 1,540 31 1,536 278 LA 10,666 36,075 114 5,363 5,363 152 4,721 642 NM 3,600 13,048 13 2,652 2,353 17 1,817 835 OK 9,482 28,960 78 5,336 5,336 105 4,993 343 TX 50,103 123,543 285 27,953 27,111 405 26,519 1,434 Subtotal 82,506 223,565 518 43,118 41,703 710 39,586 3,532 SEVEN
IA 6,581 23,715 30 6,215 6,076 110 5,593 622 KS 6,480 21,457 34 5,278 5,193 29 3,953 1,325 MO 8,796 32,615 93 7,204 7,185 148 6,436 768 NE 6,366 15,404 64 6,601 5,884 225 5,636 965 Subtotal 28,223 93,191 221 25,298 24,338 512 21,618 3,680 EIGHT
CO 7,157 23,570 142 8,499 8,106 213 7,987 512 MT 3,192 11,921 25 3,083 2,960 83 2,345 738 ND 2,236 7,658 4 893 868 2 844 49 SD 3,060 7,192 20 2,790 2,645 41 2,674 116 UT 3,647 13,982 61 5,029 4,978 80 4,713 316 WY 1,643 8,230 14 2,688 2,663 42 2,009 679 Subtotal 20,935 72,553 266 22,982 22,220 461 20,572 2,410
Definition of confirmed releases, cleanups initiated, and cleanups completed are on EPA's website at https://www.epa.gov/sites/production/files/2015-03/documents/pmdefinitions.pdf
3
State 552,445 1,850,095 5,668 536,781 515,507 8,754 468,749 68,032
Tribal 2,617 6,322 8 1,409 1,293 30 1,138 271
National 555,062 1,856,417 5,676 538,190 516,800 8,784 469,887 68,303
1DNA = Data Not Available.
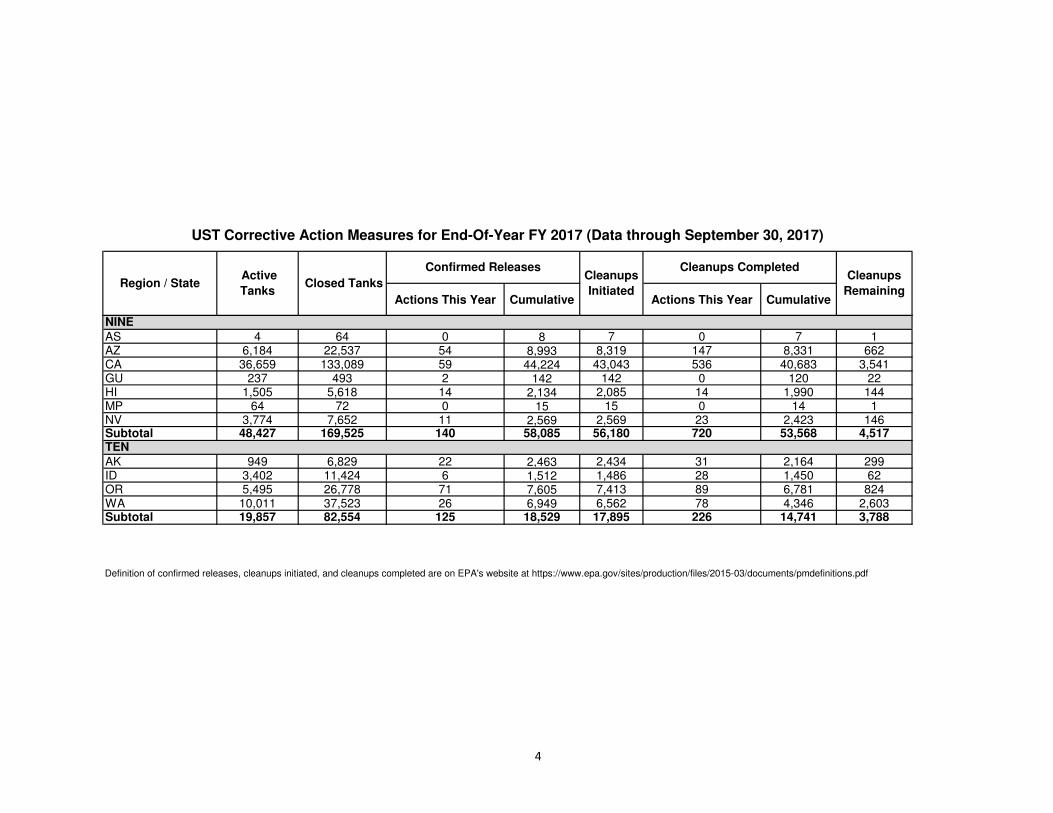
UST Corrective Action Measures for End-Of-Year FY 2017 (Data through September 30, 2017)
Region / State Active
Tanks Closed Tanks
Confirmed Releases Cleanups
Initiated
Cleanups Completed Cleanups
Remaining Actions This Year Cumulative Actions This Year Cumulative
NINE
AS 4 64 0 8 7 0 7 1 AZ 6,184 22,537 54 8,993 8,319 147 8,331 662 CA 36,659 133,089 59 44,224 43,043 536 40,683 3,541 GU 237 493 2 142 142 0 120 22 HI 1,505 5,618 14 2,134 2,085 14 1,990 144 MP 64 72 0 15 15 0 14 1 NV 3,774 7,652 11 2,569 2,569 23 2,423 146 Subtotal 48,427 169,525 140 58,085 56,180 720 53,568 4,517 TEN
AK 949 6,829 22 2,463 2,434 31 2,164 299 ID 3,402 11,424 6 1,512 1,486 28 1,450 62 OR 5,495 26,778 71 7,605 7,413 89 6,781 824 WA 10,011 37,523 26 6,949 6,562 78 4,346 2,603 Subtotal 19,857 82,554 125 18,529 17,895 226 14,741 3,788
Definition of confirmed releases, cleanups initiated, and cleanups completed are on EPA's website at https://www.epa.gov/sites/production/files/2015-03/documents/pmdefinitions.pdf
4
State subtotal from P1-4 552,445 1,850,095 5,668 536,781 515,507 8,754 468,749 68,032 68032
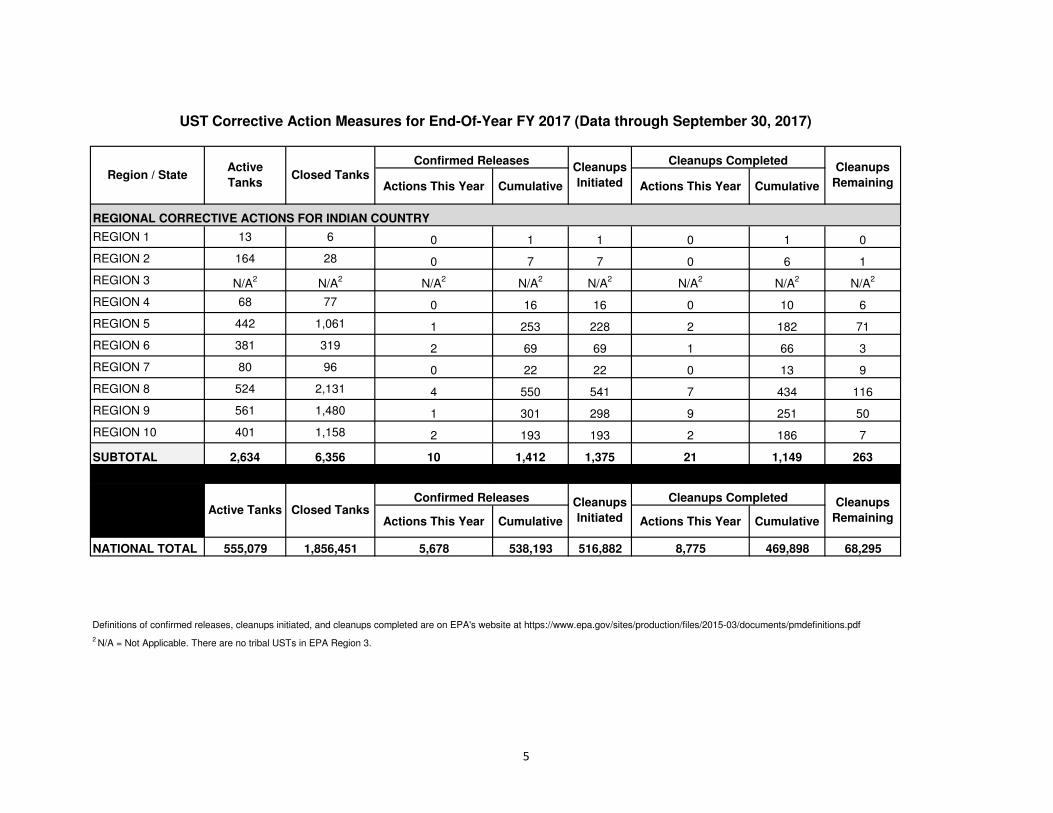
UST Corrective Action Measures for End-Of-Year FY 2017 (Data through September 30, 2017)
Region / State Active
Tanks Closed Tanks
Confirmed Releases Cleanups
Initiated
Cleanups Completed Cleanups
Remaining Actions This Year Cumulative Actions This Year Cumulative
REGIONAL CORRECTIVE ACTIONS FOR INDIAN COUNTRY
REGION 1 13 6 0 1 1 0 1 0
REGION 2 164 28 0 7 7 0 6 1
REGION 3 2N/A
2N/A
2N/A
2N/A
2N/A
2N/A
2N/A
2N/A
REGION 4 68 77 0 16 16 0 10 6
REGION 5 442 1,061 1 253 228 2 182 71
REGION 6 381 319 2 69 69 1 66 3
REGION 7 80 96 0 22 22 0 13 9
REGION 8 524 2,131 4 550 541 7 434 116
REGION 9 561 1,480 1 301 298 9 251 50
REGION 10 401 1,158 2 193 193 2 186 7
SUBTOTAL 2,634 6,356 10 1,412 1,375 21 1,149 263
Active Tanks Closed Tanks Confirmed Releases Cleanups
Initiated
Cleanups Completed Cleanups
Remaining Actions This Year Cumulative Actions This Year Cumulative
NATIONAL TOTAL 555,079 1,856,451 5,678 538,193 516,882 8,775 469,898 68,295
Definitions of confirmed releases, cleanups initiated, and cleanups completed are on EPA's website at https://www.epa.gov/sites/production/files/2015-03/documents/pmdefinitions.pdf
N/A = Not Applicable. There are no tribal USTs in EPA Region 3.
5
2
113915
UST Na ional Backlog:
FY 1989 Through End-Of-Year
FY 2017
Na ionalBack
log(C
onfirm
ed R
ele
ase
s-Cle
anupsCom
ple
ed)
200 000
180 000
160 000
140 000
120 000
100 000
80 000
60 000
40 000
20 000
0 1989 1990 1991 1992 1993 1994 1995 1996 1997 1998 1999 2000 2001 2002 2003 2004 2005 2006 2007 2008 2009 2010 2011 2012 2013 2014 2015 2016 2017
Years
6
UST Co pliance Measures for End-Of-Year FY 2017
(October 1, 2016 - Septe ber 30, 2017)
Region / State
% in
Significant
Operational
Compliance
with Release
Prevention
Regulations
% in
Significant
Operational
Compliance
with Release
Detection
Regulations
% of UST
Facilities in
SOC w/UST
Release
Detection and
Release
Prevention
ONE 1
CT 92% 90% 86%
MA 75% 52% 45%
ME 87% 83% 69%
NH 59% 54% 36% 1
RI 64% 50% 43% 1
VT 87% 85% 83%
SUBTOTAL 79% 68% 60%
TWO
NJ 96% 96% 93%
NY 88% 76% 71% 2
PR 73% 72% 72% 2
VI 96% 77% 74%
SUBTOTAL 91% 83% 79%
THREE
DC 97% 92% 91%
DE 99% 99% 99%
MD 88% 92% 82%
PA 80% 81% 69%
VA 85% 76% 69%
WV 87% 84% 76%
SUBTOTAL 84% 82% 72%
Region / State
% in
Significant
Operational
Compliance
with Release
Prevention
Regulations
% in
Significant
Operational
Compliance
with Release
Detection
Regulations
% of UST
Facilities in
SOC w/UST
Release
Detection and
Release
Prevention
FOUR
AL 88% 77% 69%
FL 95% 80% 76%
GA 74% 67% 61%
KY 78% 81% 66%
MS 77% 71% 63%
NC 72% 65% 57%
SC 77% 78% 63%
TN 91% 87% 76%
SUBTOTAL 81% 74% 66%
FIVE 1
IL 77% 70% 63%
IN 90% 90% 88% 1
MI 87% 69% 64%
MN 85% 84% 80%
OH 92% 73% 71% 1
WI 86% 76% 70%
SUBTOTAL 86% 76% 71%
SIX
AR 76% 76% 66%
LA 84% 82% 74%
NM 93% 92% 86%
OK 85% 69% 64%
TX 93% 92% 88%
SUBTOTAL 89% 86% 81%
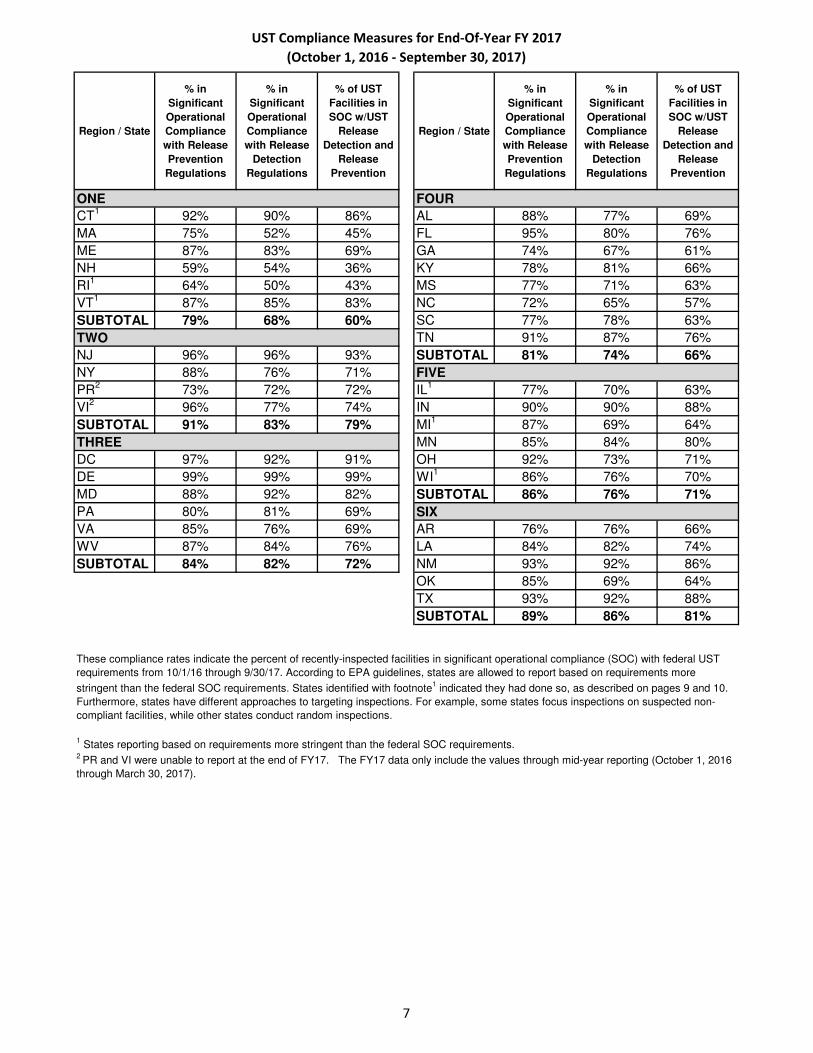
These compliance rates indicate the percent of recently-inspected facilities in significant operational compliance (SOC) with federal UST
requirements from 10/1/16 through 9/30/17. According to EPA guidelines, states are allowed to report based on requirements more
stringent than the federal SOC requirements. States identified with footnote1
indicated they had done so, as described on pages 9 and 10.
Furthermore, states have different approaches to targeting inspections. For example, some states focus inspections on suspected non-
compliant facilities, while other states conduct random inspections.
1 States reporting based on requirements more stringent than the federal SOC requirements.
2 PR and VI were unable to report at the end of FY17. The FY17 data only include the values through mid-year reporting (October 1, 2016
through March 30, 2017).
7
UST Co pliance Measures for End-Of-Year FY 2017
(October 1, 2016 - Septe ber 30, 2017)
Region / State
% in
Significant
Operational
Compliance
with Release
Prevention
Regulations
% in
Significant
Operational
Compliance
with Release
Detection
Regulations
% of UST
Facilities in
SOC w/UST
Release
Detection and
Release
Prevention
SEVEN
IA 82% 71% 61%
KS 58% 89% 52% 1
MO 83% 95% 80% 1
NE 70% 77% 61%
SUBTOTAL 74% 84% 65%
EIGHT
CO 83% 84% 81%
MT 95% 95% 91%
ND 91% 92% 86%
SD 78% 81% 69%
UT 90% 87% 79%
WY 95% 99% 94%
SUBTOTAL 87% 88% 82%
NINE
AS 3
DNA3
DNA3
DNA
AZ 80% 74% 69%
CA 82% 73% 64%
GU 100% 100% 100%
HI 98% 92% 90%
MP 96% 96% 96%
NV 89% 84% 77%
SUBTOTAL 83% 75% 67%
Region / State
% in
Significant
Operational
Compliance
with Release
Prevention
Regulations
% in
Significant
Operational
Compliance
with Release
Detection
Regulations
% of UST
Facilities in
SOC w/UST
Release
Detection and
Release
Prevention
TEN
AK 82% 80% 75% 1
ID 93% 84% 76%
OR 93% 92% 87%
WA 89% 87% 80%
SUBTOTAL 90% 88% 81%
INDIAN COUNTRY
REGION 1 3
DNA3
DNA3
DNA
REGION 2 82% 82% 82%
REGION 3 4
N/A4
N/A4
N/A
REGION 4 100% 78% 78%
REGION 5 73% 64% 59%
REGION 6 95% 93% 88%
REGION 7 0% 0% 0%
REGION 8 67% 81% 60%
REGION 9 94% 79% 77%
REGION 10 84% 84% 75%
SUBTOTAL 83% 80% 72%
NATIONAL TOTAL
TOTAL 84.4% 79.0% 71.6%
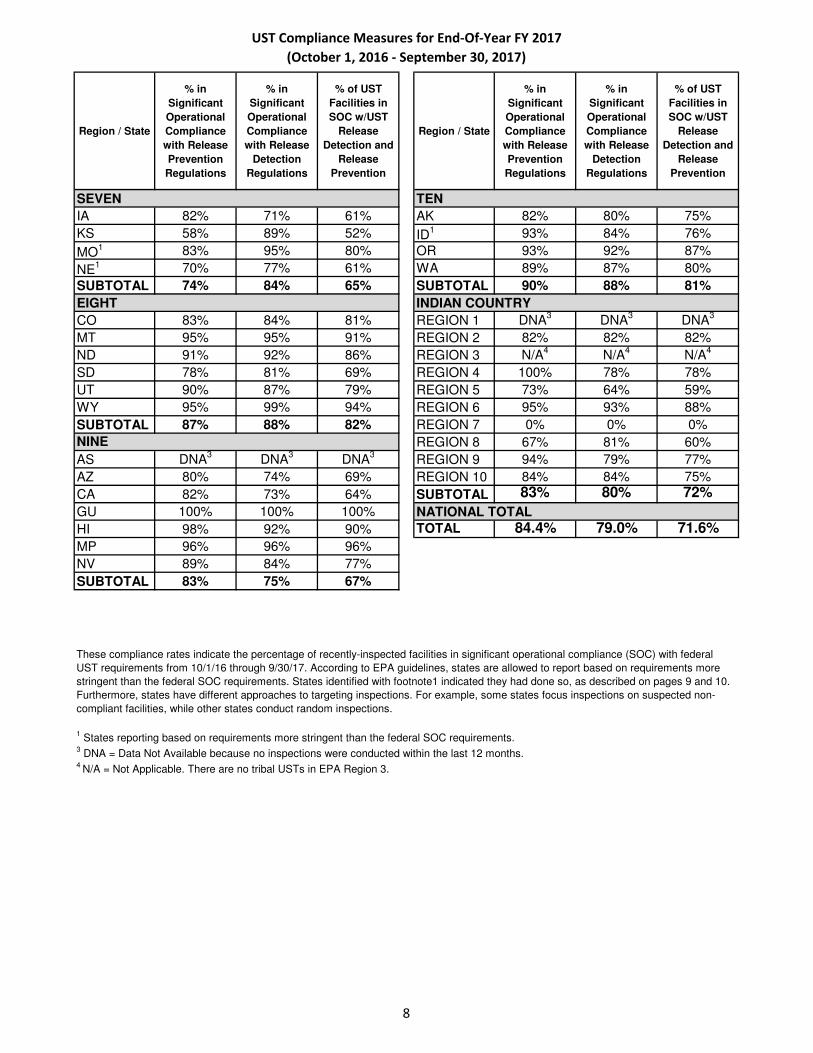
These compliance rates indicate the percentage of recently-inspected facilities in significant operational compliance (SOC) with federal
UST requirements from 10/1/16 through 9/30/17. According to EPA guidelines, states are allowed to report based on requirements more
stringent than the federal SOC requirements. States identified with footnote1 indicated they had done so, as described on pages 9 and 10.
Furthermore, states have different approaches to targeting inspections. For example, some states focus inspections on suspected non-
compliant facilities, while other states conduct random inspections.
1 States reporting based on requirements more stringent than the federal SOC requirements.
3 DNA = Data Not Available because no inspections were conducted within the last 12 months.
4 N/A = Not Applicable. There are no tribal USTs in EPA Region 3.
8
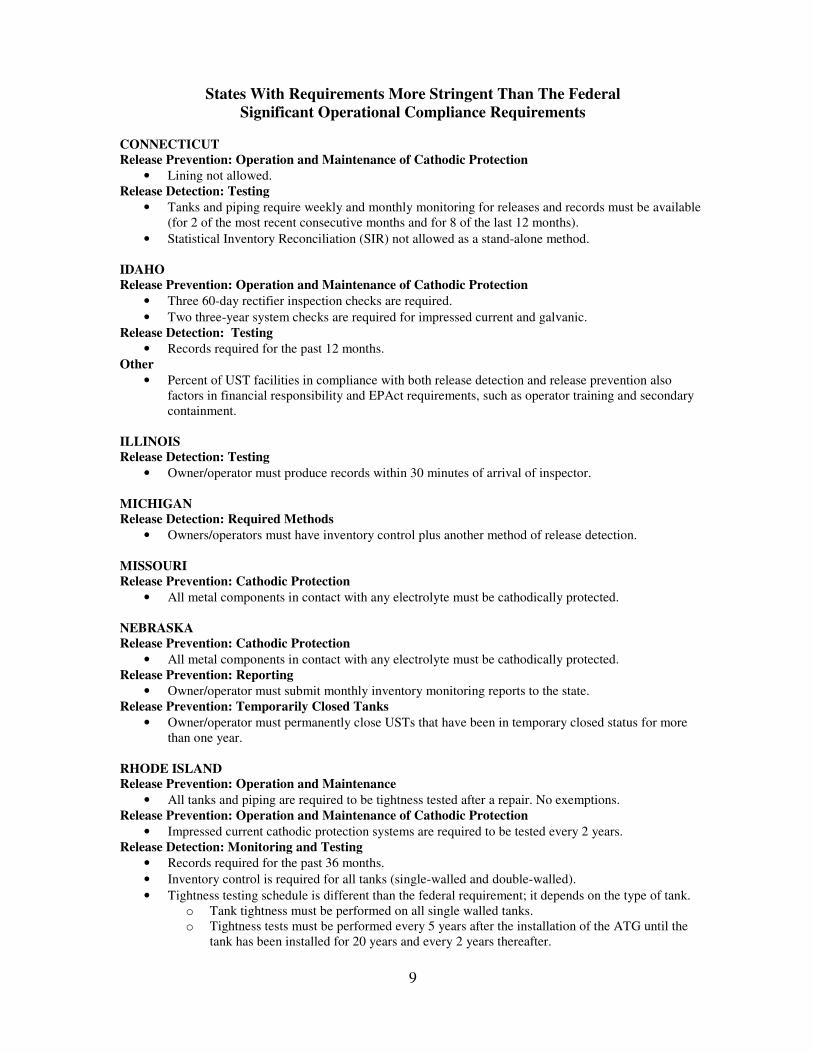
States With Requirements More Stringent Than The Federal
Significant Operational Compliance Requirements
CONNECTICUT
Release Prevention: Operation and Maintenance of Cathodic Protection
• Lining not allowed.
Release Detection: Testing
• Tanks and piping require weekly and monthly monitoring for releases and records must be available
(for 2 of the most recent consecutive months and for 8 of the last 12 months).
• Statistical Inventory Reconciliation (SIR) not allowed as a stand-alone method.
IDAHO
Release Prevention: Operation and Maintenance of Cathodic Protection
• Three 60-day rectifier inspection checks are required.
• Two three-year system checks are required for impressed current and galvanic.
Release Detection: Testing
• Records required for the past 12 months.
Other
• Percent of UST facilities in compliance with both release detection and release prevention also
factors in financial responsibility and EPAct requirements, such as operator training and secondary
containment.
ILLINOIS
Release Detection: Testing
• Owner/operator must produce records within 30 minutes of arrival of inspector.
MICHIGAN
Release Detection: Required Methods
• Owners/operators must have inventory control plus another method of release detection.
MISSOURI
Release Prevention: Cathodic Protection
• All metal components in contact with any electrolyte must be cathodically protected.
NEBRASKA
Release Prevention: Cathodic Protection
• All metal components in contact with any electrolyte must be cathodically protected.
Release Prevention: Reporting
• Owner/operator must submit monthly inventory monitoring reports to the state.
Release Prevention: Temporarily Closed Tanks
• Owner/operator must permanently close USTs that have been in temporary closed status for more
than one year.
RHODE ISLAND
Release Prevention: Operation and Maintenance
• All tanks and piping are required to be tightness tested after a repair. No exemptions.
Release Prevention: Operation and Maintenance of Cathodic Protection
• Impressed current cathodic protection systems are required to be tested every 2 years.
Release Detection: Monitoring and Testing
• Records required for the past 36 months.
• Inventory control is required for all tanks (single-walled and double-walled).
• Tightness testing schedule is different than the federal requirement; it depends on the type of tank.
o Tank tightness must be performed on all single walled tanks.
o Tightness tests must be performed every 5 years after the installation of the ATG until the
tank has been installed for 20 years and every 2 years thereafter.
9
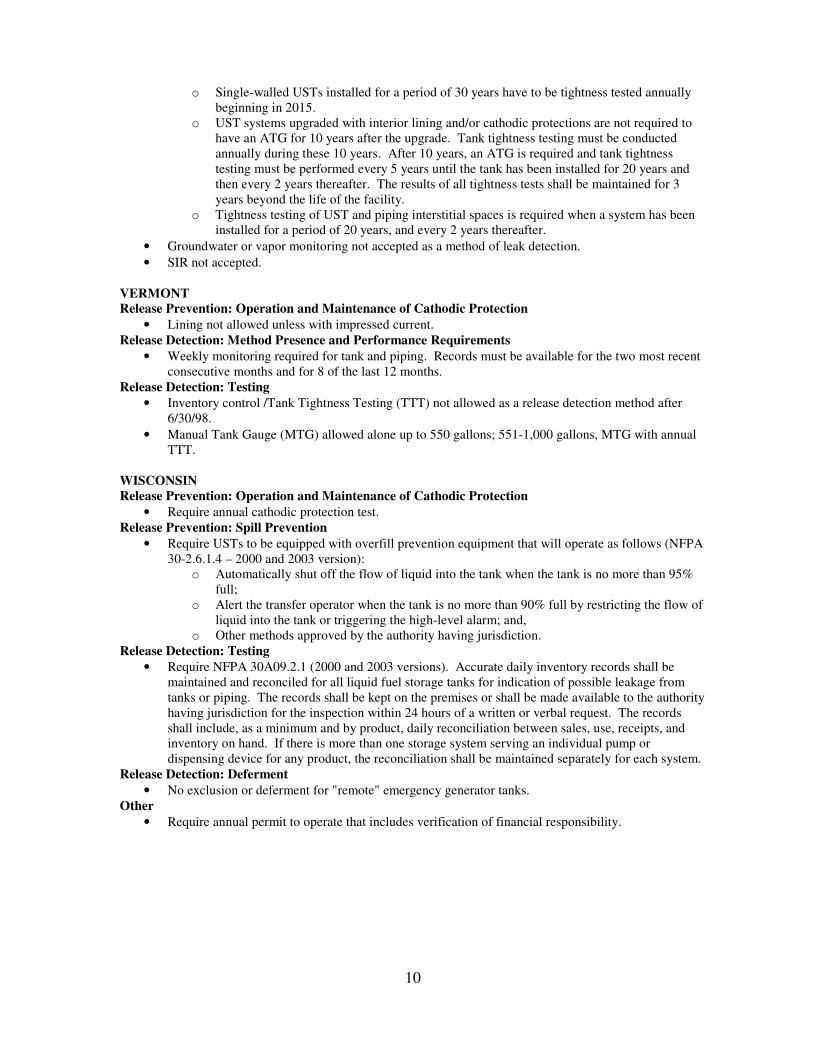
o Single-walled USTs installed for a period of 30 years have to be tightness tested annually
beginning in 2015.
o UST systems upgraded with interior lining and/or cathodic protections are not required to
have an ATG for 10 years after the upgrade. Tank tightness testing must be conducted
annually during these 10 years. After 10 years, an ATG is required and tank tightness
testing must be performed every 5 years until the tank has been installed for 20 years and
then every 2 years thereafter. The results of all tightness tests shall be maintained for 3
years beyond the life of the facility.
o Tightness testing of UST and piping interstitial spaces is required when a system has been
installed for a period of 20 years, and every 2 years thereafter.
• Groundwater or vapor monitoring not accepted as a method of leak detection.
• SIR not accepted.
VERMONT
Release Prevention: Operation and Maintenance of Cathodic Protection
• Lining not allowed unless with impressed current.
Release Detection: Method Presence and Performance Requirements
• Weekly monitoring required for tank and piping. Records must be available for the two most recent
consecutive months and for 8 of the last 12 months.
Release Detection: Testing
• Inventory control /Tank Tightness Testing (TTT) not allowed as a release detection method after
6/30/98.
• Manual Tank Gauge (MTG) allowed alone up to 550 gallons; 551-1,000 gallons, MTG with annual
TTT.
WISCONSIN
Release Prevention: Operation and Maintenance of Cathodic Protection
• Require annual cathodic protection test.
Release Prevention: Spill Prevention
• Require USTs to be equipped with overfill prevention equipment that will operate as follows (NFPA
30-2.6.1.4 – 2000 and 2003 version):
o Automatically shut off the flow of liquid into the tank when the tank is no more than 95%
full;
o Alert the transfer operator when the tank is no more than 90% full by restricting the flow of
liquid into the tank or triggering the high-level alarm; and,
o Other methods approved by the authority having jurisdiction.
Release Detection: Testing
• Require NFPA 30A09.2.1 (2000 and 2003 versions). Accurate daily inventory records shall be
maintained and reconciled for all liquid fuel storage tanks for indication of possible leakage from
tanks or piping. The records shall be kept on the premises or shall be made available to the authority
having jurisdiction for the inspection within 24 hours of a written or verbal request. The records
shall include, as a minimum and by product, daily reconciliation between sales, use, receipts, and
inventory on hand. If there is more than one storage system serving an individual pump or
dispensing device for any product, the reconciliation shall be maintained separately for each system.
Release Detection: Deferment
• No exclusion or deferment for "remote" emergency generator tanks.
Other
• Require annual permit to operate that includes verification of financial responsibility.
10
N/A = Not Applicable. EPA Region 3 does not have any federally recognized tribes.
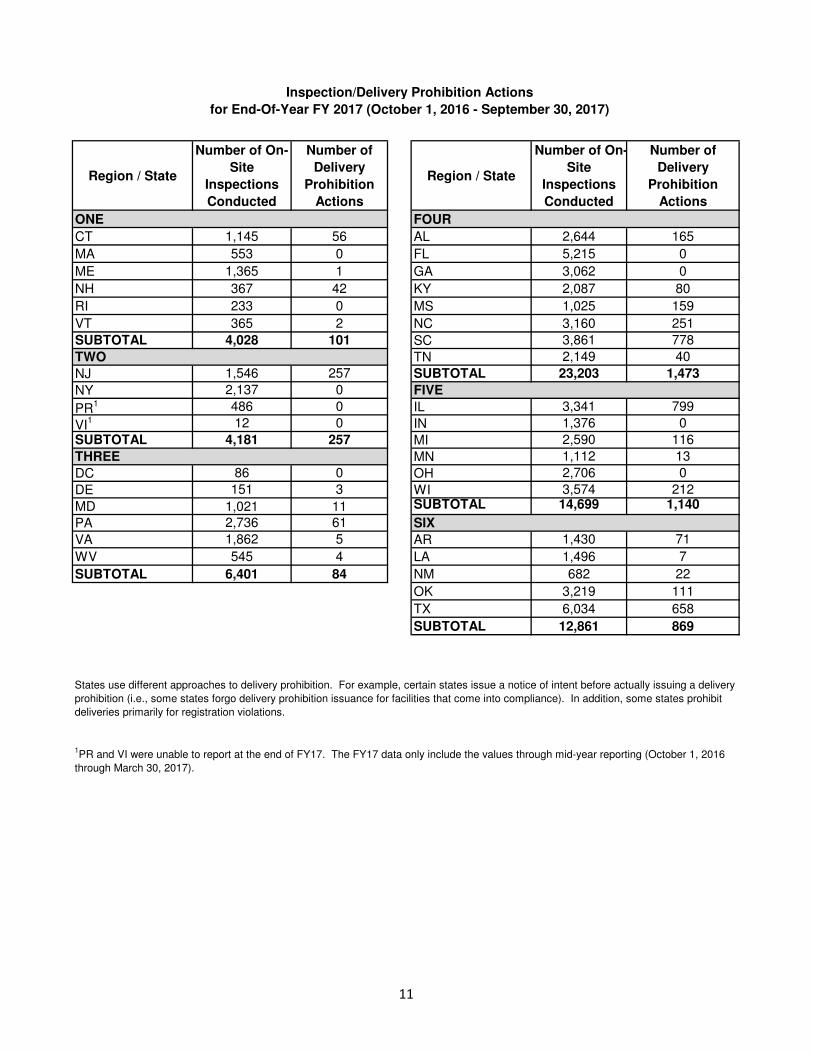
Inspection/Delivery Prohibition Actions
for End-Of-Year FY 2017 (October 1, 2016 - September 30, 2017)
Region / State
Number of On-
Site
Inspections
Conducted
Number of
Delivery
Prohibition
Actions
ONE
CT 1,145 56
MA 553 0
ME 1,365 1
NH 367 42
RI 233 0
VT 365 2
SUBTOTAL 4,028 101
TWO
NJ 1,546 257
NY 2,137 0 1
PR 486 0 1
VI 12 0
SUBTOTAL 4,181 257
THREE
DC 86 0
DE 151 3
MD 1,021 11
PA 2,736 61
VA 1,862 5
WV 545 4
SUBTOTAL 6,401 84
Region / State
Number of On-
Site
Inspections
Conducted
Number of
Delivery
Prohibition
Actions
FOUR
AL 2,644 165
FL 5,215 0
GA 3,062 0
KY 2,087 80
MS 1,025 159
NC 3,160 251
SC 3,861 778
TN 2,149 40
SUBTOTAL 23,203 1,473
FIVE
IL 3,341 799
IN 1,376 0
MI 2,590 116
MN 1,112 13
OH 2,706 0
WI 3,574 212 SUBTOTAL 14,699 1,140
SIX
AR 1,430 71
LA 1,496 7
NM 682 22
OK 3,219 111
TX 6,034 658
SUBTOTAL 12,861 869
States use different approaches to delivery prohibition. For example, certain states issue a notice of intent before actually issuing a delivery
prohibition (i.e., some states forgo delivery prohibition issuance for facilities that come into compliance). In addition, some states prohibit
deliveries primarily for registration violations.
1PR and VI were unable to report at the end of FY17. The FY17 data only include the values through mid-year reporting (October 1, 2016
through March 30, 2017).
11
#'s check -> 93,228 4,276
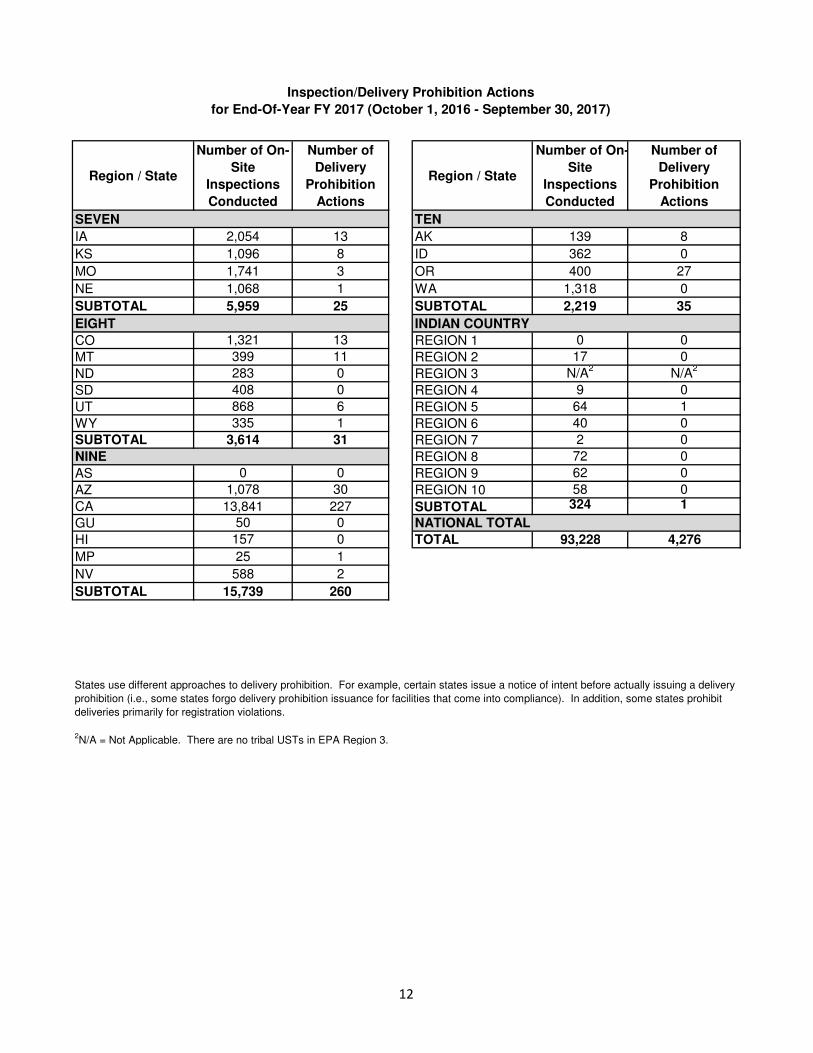
Inspection/Delivery Prohibition Actions
for End-Of-Year FY 2017 (October 1, 2016 - September 30, 2017)
Region / State
Number of On-
Site
Inspections
Conducted
Number of
Delivery
Prohibition
Actions
SEVEN
IA 2,054 13
KS 1,096 8
MO 1,741 3
NE 1,068 1
SUBTOTAL 5,959 25
EIGHT
CO 1,321 13
MT 399 11
ND 283 0
SD 408 0
UT 868 6
WY 335 1
SUBTOTAL 3,614 31
NINE
AS 0 0
AZ 1,078 30
CA 13,841 227
GU 50 0
HI 157 0
MP 25 1
NV 588 2
SUBTOTAL 15,739 260
Region / State
Number of On-
Site
Inspections
Conducted
Number of
Delivery
Prohibition
Actions
TEN
AK 139 8
ID 362 0
OR 400 27
WA 1,318 0
SUBTOTAL 2,219 35
INDIAN COUNTRY
REGION 1 0 0
REGION 2 17 0
REGION 3 2
N/A2
N/A
REGION 4 9 0
REGION 5 64 1
REGION 6 40 0
REGION 7 2 0
REGION 8 72 0
REGION 9 62 0
REGION 10 58 0
SUBTOTAL 324 1
NATIONAL TOTAL
TOTAL 93,228 4,276
States use different approaches to delivery prohibition. For example, certain states issue a notice of intent before actually issuing a delivery
prohibition (i.e., some states forgo delivery prohibition issuance for facilities that come into compliance). In addition, some states prohibit
deliveries primarily for registration violations.
2N/A = Not Applicable. There are no tribal USTs in EPA Region 3.
12