Embed Size (px)
Citation preview
Sensing Location
References
P. Bahl, V. Padmanabhan, "RADAR: An In-Building RF-based User Location and Tracking System" IEEE INFOCOM 2000, vol. 2, pp. 775-784.
Nissanka B. Priyantha, Anit Chakraborty and Hari Balakrishnan, " The Cricket Location-Support System " Proc. 6th ACM MOBICOM, A ugust 2000, pp. 32-43.
Andy Hopper, Pete Steggles, Andy Ward, Paul Webster, " The Anatomy of a Context-Aware Applica tion " Proceedings of the 5th Annual ACM/IEEE International Conference on Mobile Computing and Networking (Mobicom '99), Seattle, Washington, USA, August 1999.
Special Notes: Special thanks goes to MIT for a presentation that has great pictures.
Introduction The proliferation of mobile computing
devices and LANs has fostered a growing interesting in location-aware systems and services.
In these systems the application information and/or interface presented to the user is a function of their physical location.
Introduction
Granularity of location information needed varies from one application to another The “nearest” printer has a coarser
granularity then finding the location of a book in the library.
Possible Applications Navigation Lost child Resource discovery
Introduction
A context-aware system uses in addition to location information, information about the user, state of the physical environment (e.g., temperature), state of the computing system, history human-computer interaction, etc;
Introduction
Location is the most heavily used context.
What about other context? Not used that heavily. Why? Possible reasons:
• Not useful• Not easy to sense
For now, we will focus on location.
Sensing Location
For outdoor use, we have the Global Positioning System (GPS).
GPS basics: GPS determines the distance by measuring the time
it takes a signal to propagate from satellite to receiver
Need to have very good synchronization of clocks Receive signal from three satellites to determine
location Need a fourth satellite to estimate elevation Satellite GPS accuracy is getting reasonable (10-20
meters)
Sensing Location
GPS doesn’t work indoors because the satellite signal is weak or reflected which means lowers accuracy.
Indoor location systems is an active research area.
Ideal location sensor in indoor environments have the following properties: Provide fine-grain spatial information at a
high update rate. Unobtrusive, cheap, scalable and robust.
RADAR
RADAR attempts to use common off-the-shelf components. For example, 802.11b base stations. Basically, RADAR makes use of WLAN technology.
RADAR assumes that the access points (AP)s provide overlapping coverage over area of interest.
The user carries a mobile device which helps in determining location e.g. laptop, palmtop, badge.
RADAR: Method for Location Sensing
RADAR records information about the radio signal as a function of the user’s location.
Off-line Analysis: Use signal information to construct and validate models for signal propagation during off-line analysis.
Real-time Analysis: Infer the location of a user in real time.
RADAR: Method for Location Sensing
Need to be able to measure signal strength (SS) and the signal-to-noise ratio (SNR) (later experiments showed that SNR didn’t seem to matter much).
A base station (bs) records the signal strength (ss) measurement with a time stamp. Basically, it is recording (t,bs,ss).
A driver on the mobile host extracts the signal strength and signal-to-noise information from the network interface card. This can be then be made available to an application.
RADAR: Method for Location Sensing
During the off-line phase, the user indicates his/her current location by clicking on a map of the floor. The user’s coordinates (x,y) and timestamp t are
recorded. User’s orientation is also important:
There is strong signal strength if there is direct line-of-sight to a base station’s antenna.
In the opposite orientation, a person’s body may form an obstruction.
This implies that the direction, d (north,south,east,west) should also be recorded.
Information collected by the mobile host is denoted by (t,x,y,d).
Clocks on the mobile host and the base stations must be synchronized.
RADAR: Method For Location Sensing
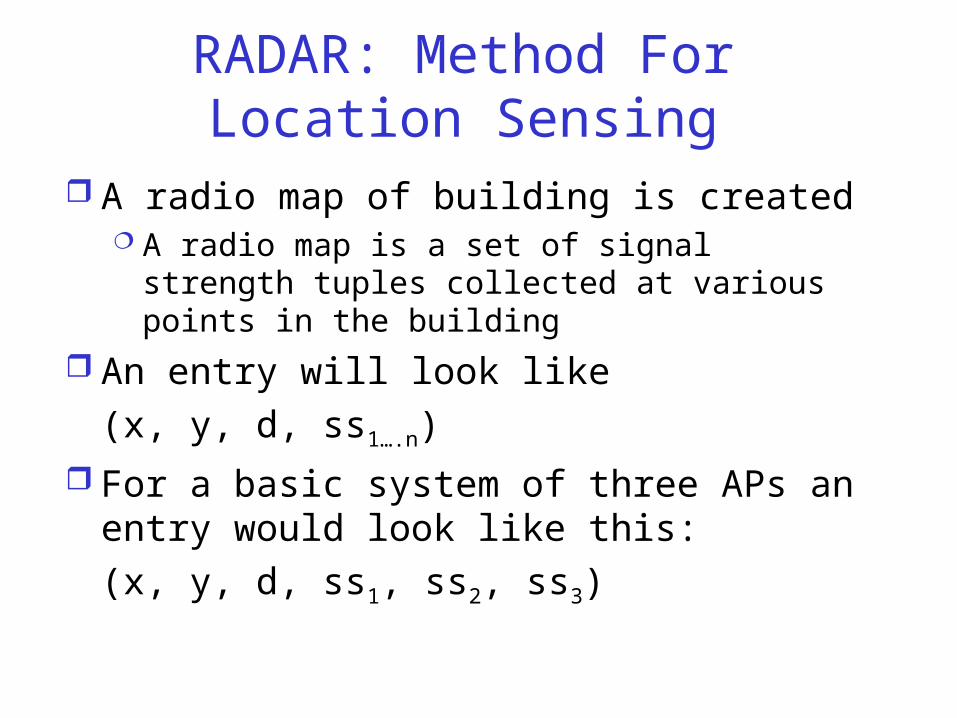
A radio map of building is created A radio map is a set of signal strength
tuples collected at various points in the building
An entry will look like(x, y, d, ss1….n)
For a basic system of three APs an entry would look like this:
(x, y, d, ss1, ss2, ss3)
RADAR: Method for Location Sensing
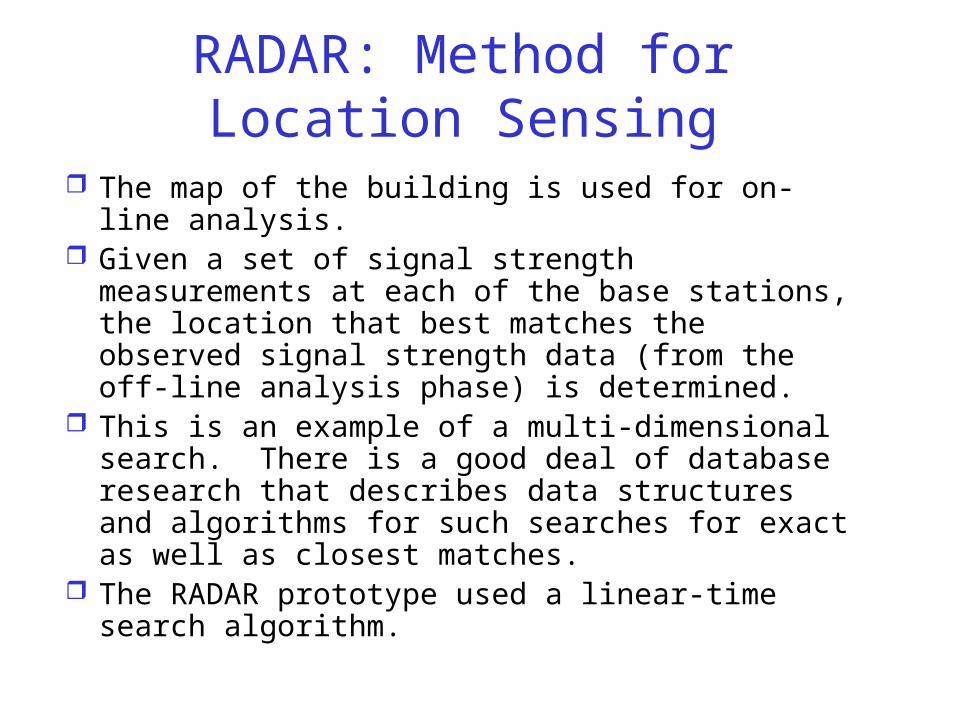
The map of the building is used for on-line analysis.
Given a set of signal strength measurements at each of the base stations, the location that best matches the observed signal strength data (from the off-line analysis phase) is determined.
This is an example of a multi-dimensional search. There is a good deal of database research that describes data structures and algorithms for such searches for exact as well as closest matches.
The RADAR prototype used a linear-time search algorithm.
RADAR: Method for Location Sensing
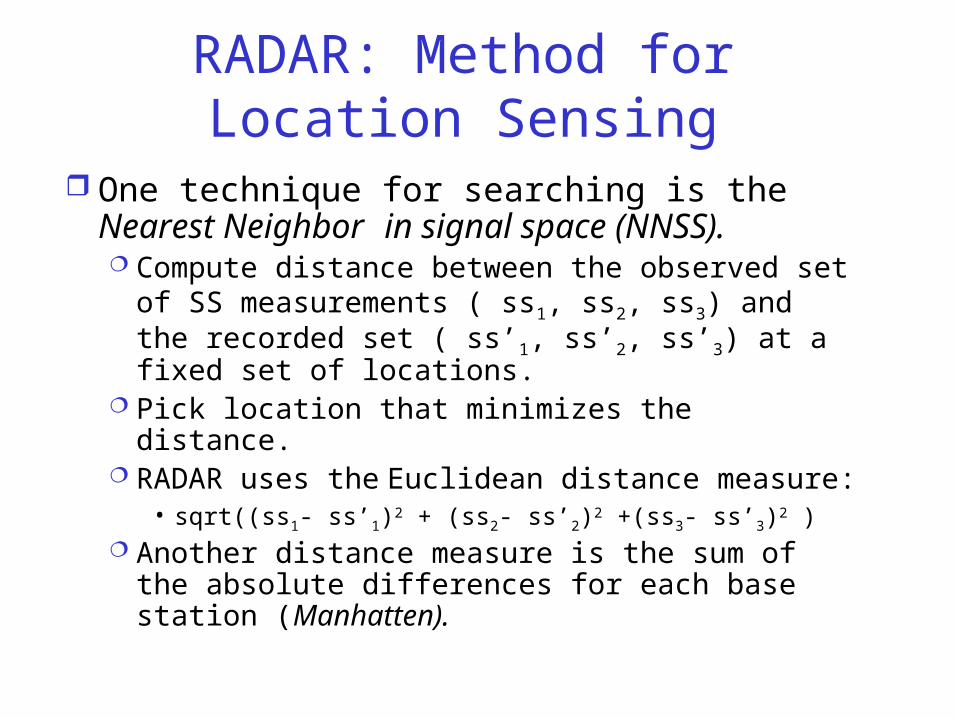
One technique for searching is the Nearest Neighbor in signal space (NNSS). Compute distance between the observed set
of SS measurements ( ss1, ss2, ss3) and the recorded set ( ss’1, ss’2, ss’3) at a fixed set of locations.
Pick location that minimizes the distance. RADAR uses the Euclidean distance measure:
• sqrt((ss1- ss’1)2 + (ss2- ss’2)2 +(ss3- ss’3)2 ) Another distance measure is the sum of the
absolute differences for each base station (Manhatten).
RADAR: Method for Location Sensing
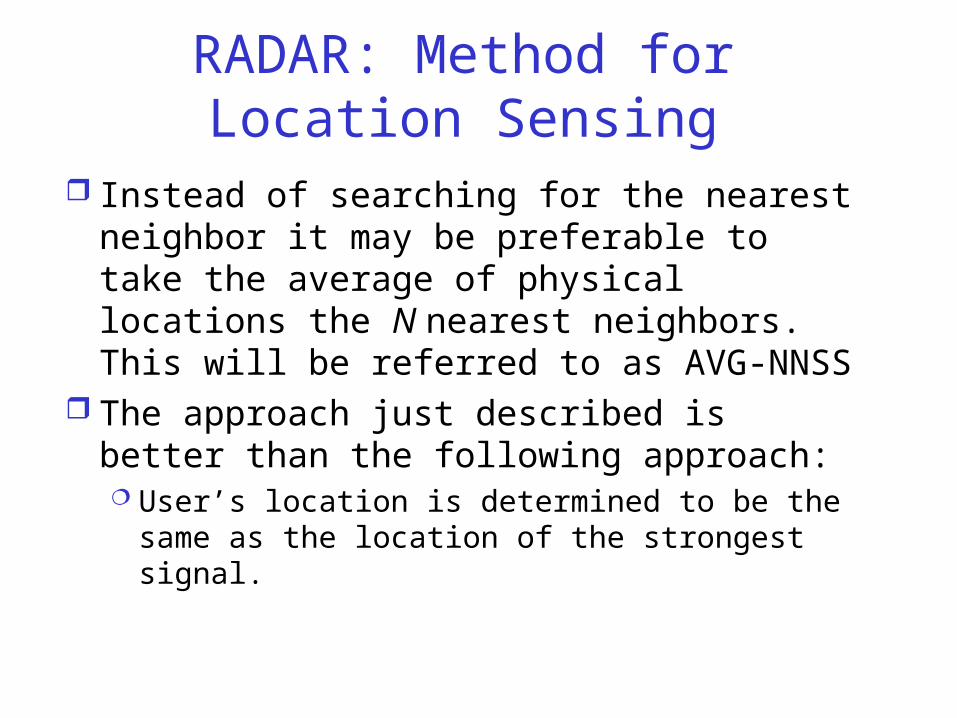
Instead of searching for the nearest neighbor it may be preferable to take the average of physical locations the N nearest neighbors. This will be referred to as AVG-NNSS
The approach just described is better than the following approach: User’s location is determined to be the
same as the location of the strongest signal.
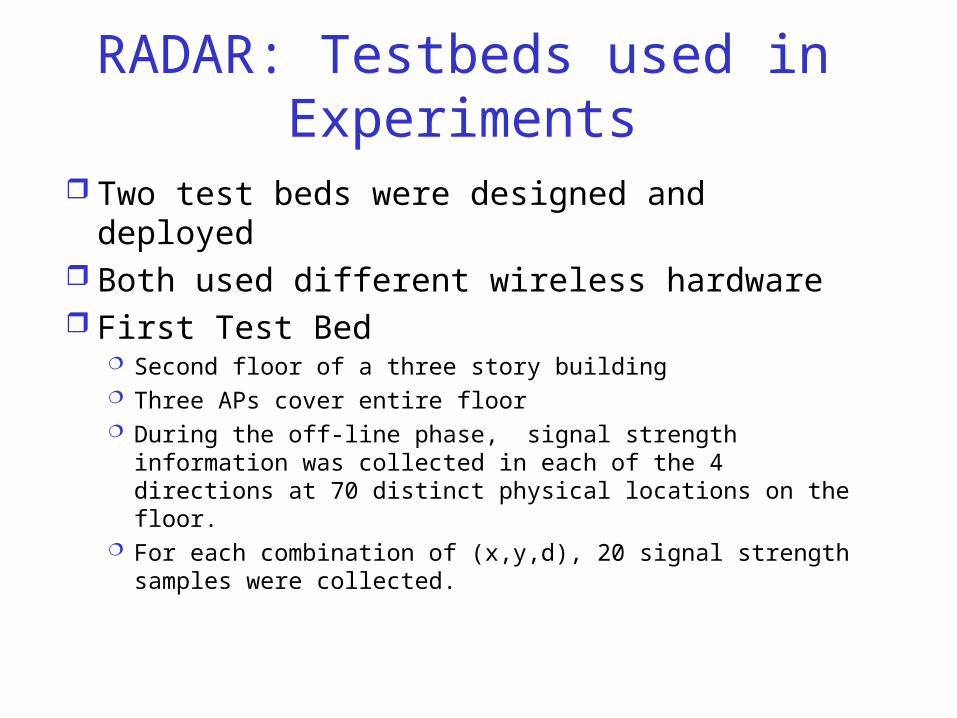
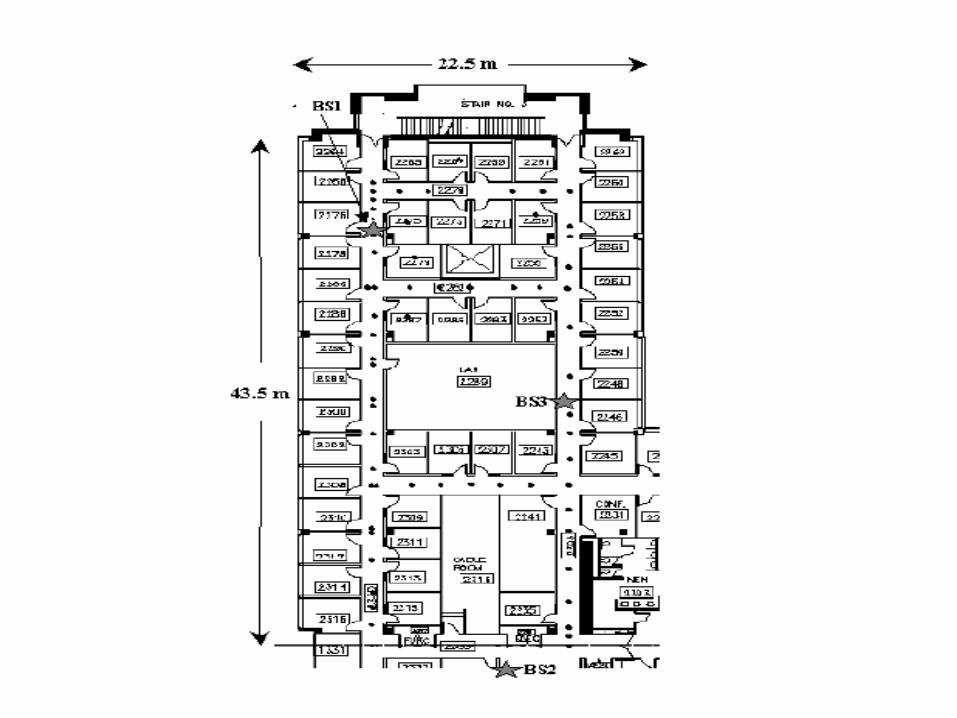
RADAR: Testbeds used in Experiments
Two test beds were designed and deployed
Both used different wireless hardware First Test Bed
Second floor of a three story building Three APs cover entire floor During the off-line phase, signal strength information
was collected in each of the 4 directions at 70 distinct physical locations on the floor.
For each combination of (x,y,d), 20 signal strength samples were collected.
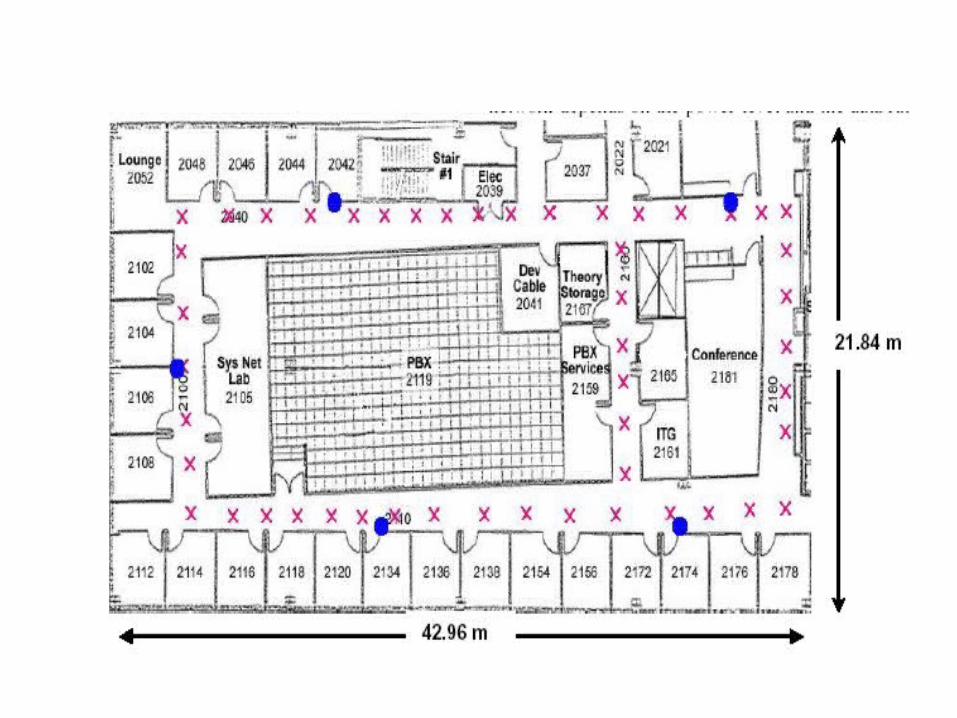
RADAR: Testbeds used in Experiments
Second Test Bed Second floor of a four story building Five wall-mounted APs provide wireless
coverage. The paper focuses on the first test bed.
RADAR: Observations
AVG-NNSS shows some benefit over using NNSS but was not considered very significant. Averaging over a large number of nearest
neighbors accuracy degrades rapidly because points far removed from the true location also are included in the averaging procedure.
Why aren’t the benefits high: Often the nearest neighbors in signal space are not physically distinct as the result of same (x,y) coordinate but different direction.
RADAR: Observations
The more data points the more accurate the location determination. It is interesting to note though that the
accuracy of the location determination is not that different between 40 and 70 points.
Only a small number of samples is needed.
User’s orientation has a significant impact on the signal strength measured at the base stations.
Tracking is possible if the user walks at a uniform pace.
RADAR: Comments
The approach just described seems to estimate user location with a good degree of accuracy (up to 2 to 3 meters).
Problem: Lots of effort is needed to collect samples.
RADAR: Alternative Approach
Use radio propagation Develop a mathematical model of
indoor signal propagation to generate a set of theoretically-computed signal strength data which is akin to the empirically generated data.
Apply the NNSS algorithm The empirical approach works better
when smaller error distances are needed.
RADAR: Comments
RF is hostile Signal propagation dominated by
reflection, diffractions and scattering of radio waves
Multi path fading phenomenon occurs Number of people affects signal
strength Suggestion: Make use of multiple maps
corresponding to different environmental conditions.
RADAR: Comments
Mobile node hears all APs APs operate at different frequencies. Mobile node need to scan all
frequencies Potentially could cause quite a bit of
overhead.
Cricket
The goal of Cricket is to allow applications running on user devices and service nodes (both mobile and non-mobile) to learn their physical location.
It is the decision of applications to determine who should receive the location information.
Goals include preserving user privacy (by not having user tracking) and decentralization.
Cricket uses a combination of RF and ultrasound.
Cricket: System Architecture
Beacons disseminate information about a geographic space to listeners.
A beacon is a small device attached to some location within the geographic space it advertises.
Typically, it is obtained by the “owner” of the location
To obtain information about the space, every mobile and static node has a listener attached to it. Listener infers its its current location from the set of
beacons it hears and informs the device software about this via the API.
Cricket: Determining the Location
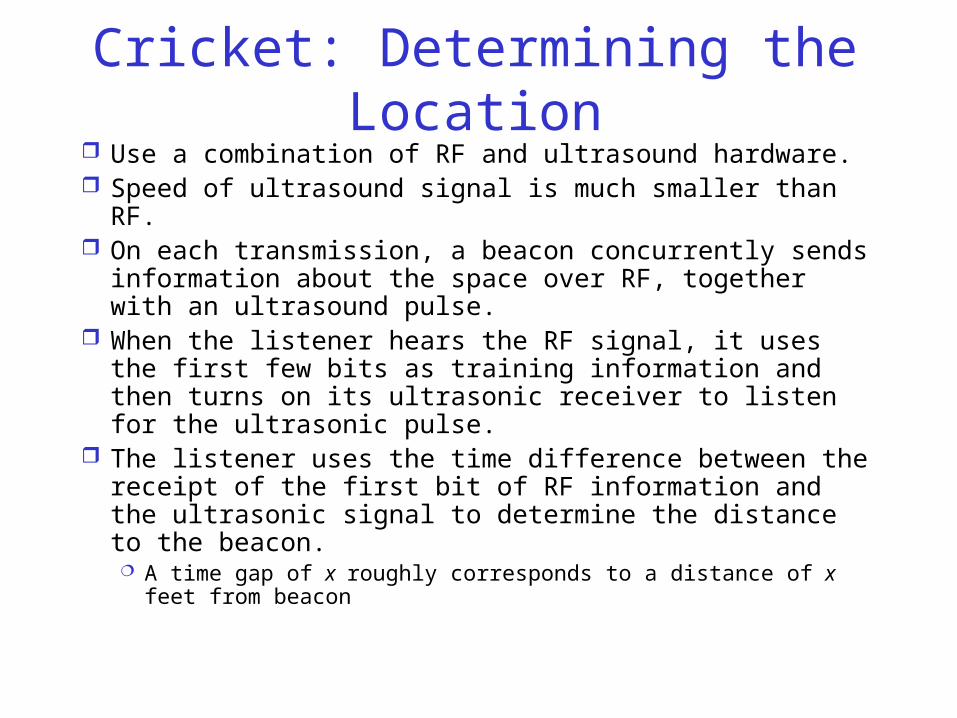
Use a combination of RF and ultrasound hardware. Speed of ultrasound signal is much smaller than RF. On each transmission, a beacon concurrently sends
information about the space over RF, together with an ultrasound pulse.
When the listener hears the RF signal, it uses the first few bits as training information and then turns on its ultrasonic receiver to listen for the ultrasonic pulse.
The listener uses the time difference between the receipt of the first bit of RF information and the ultrasonic signal to determine the distance to the beacon. A time gap of x roughly corresponds to a distance of x feet from
beacon
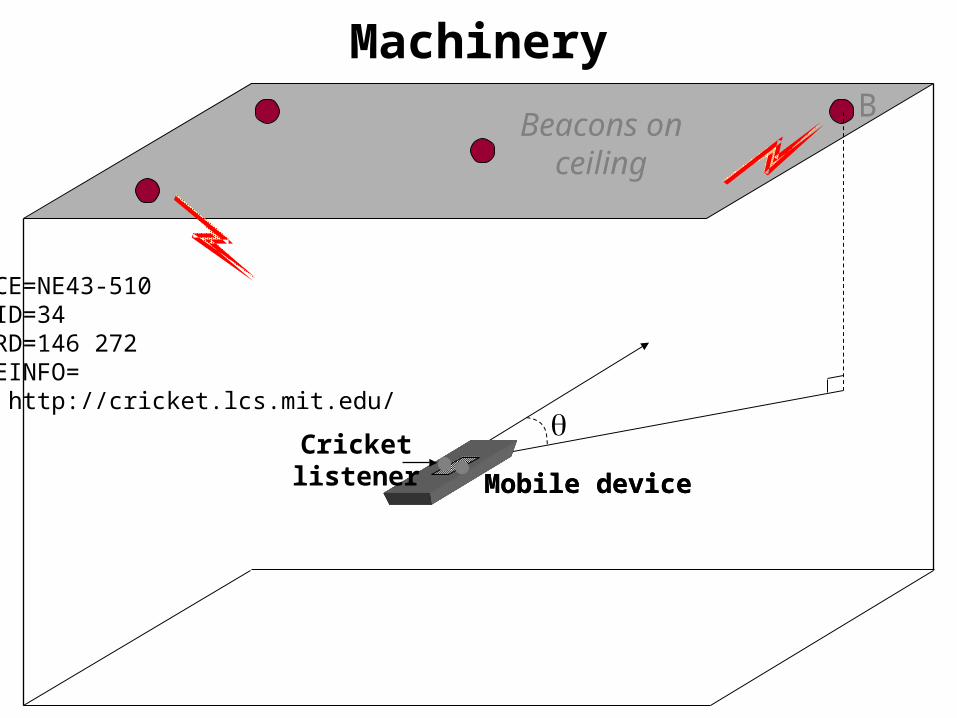
Beacons onceiling
B
SPACE=NE43-510 ID=34COORD=146 272 MOREINFO= http://cricket.lcs.mit.edu/
Machinery
Mobile deviceMobile device
Cricketlistener
Cricket: Reducing Interference
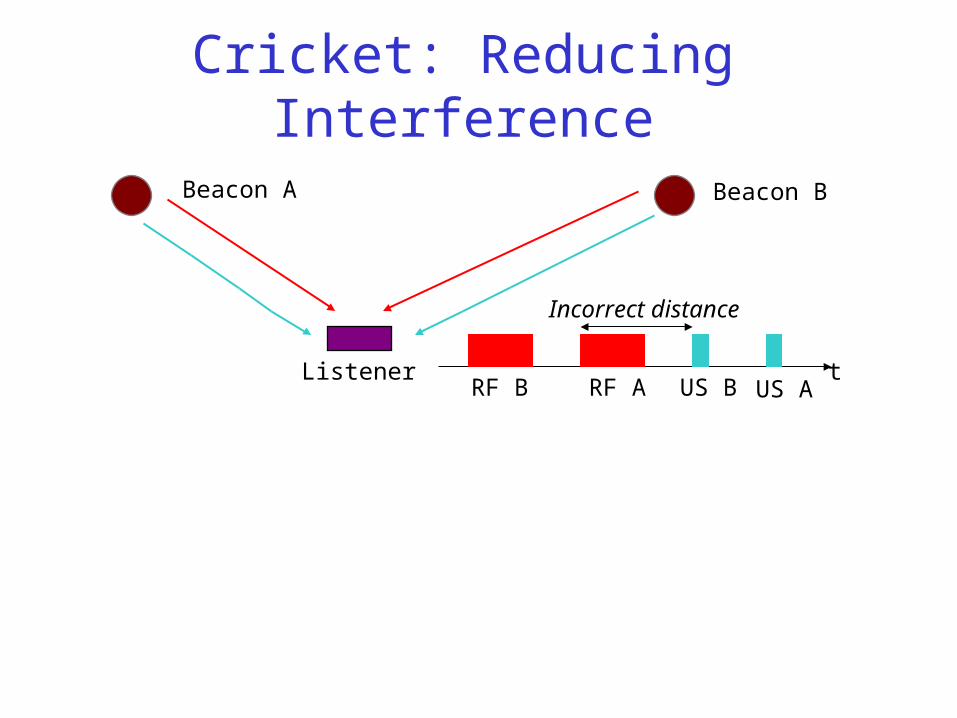
RF transmissions from different beacons may collide. May cause a listener to wrongly correlate
the RF data of one beacon with the ultrasonic signal of another, yielding false results.
Ultrasonic reception suffers from severe multipath effects caused by reflections from walls and other objects.
Cricket: Reducing Interference
Beacon A Beacon B
tRF B RF A US B US A
Incorrect distance
Listener
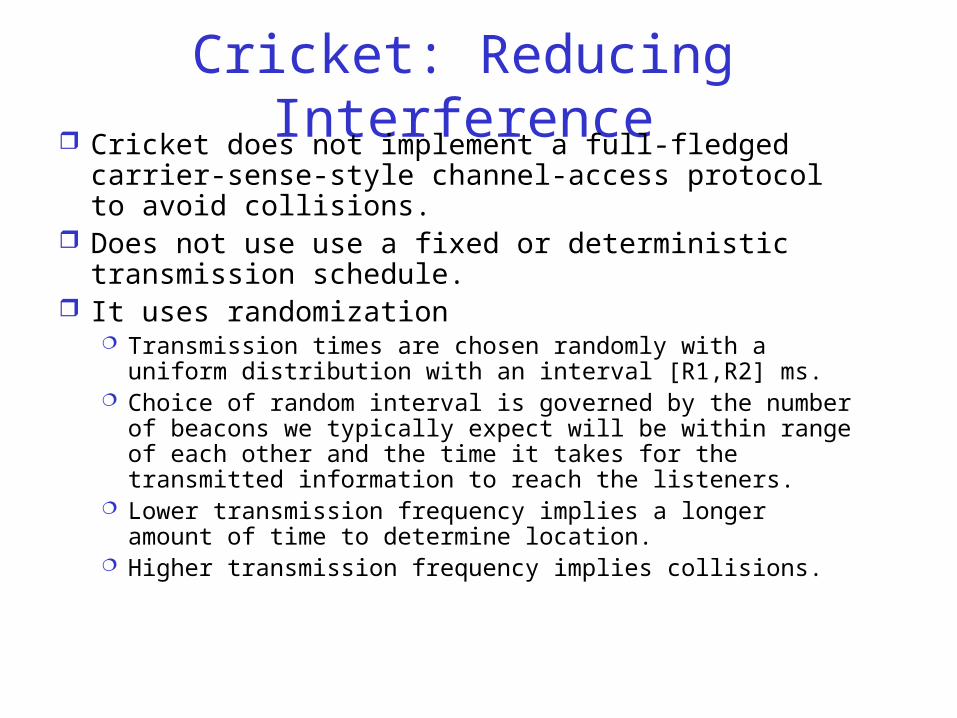
Cricket: Reducing Interference Cricket does not implement a full-fledged
carrier-sense-style channel-access protocol to avoid collisions.
Does not use use a fixed or deterministic transmission schedule.
It uses randomization Transmission times are chosen randomly with a
uniform distribution with an interval [R1,R2] ms. Choice of random interval is governed by the number
of beacons we typically expect will be within range of each other and the time it takes for the transmitted information to reach the listeners.
Lower transmission frequency implies a longer amount of time to determine location.
Higher transmission frequency implies collisions.
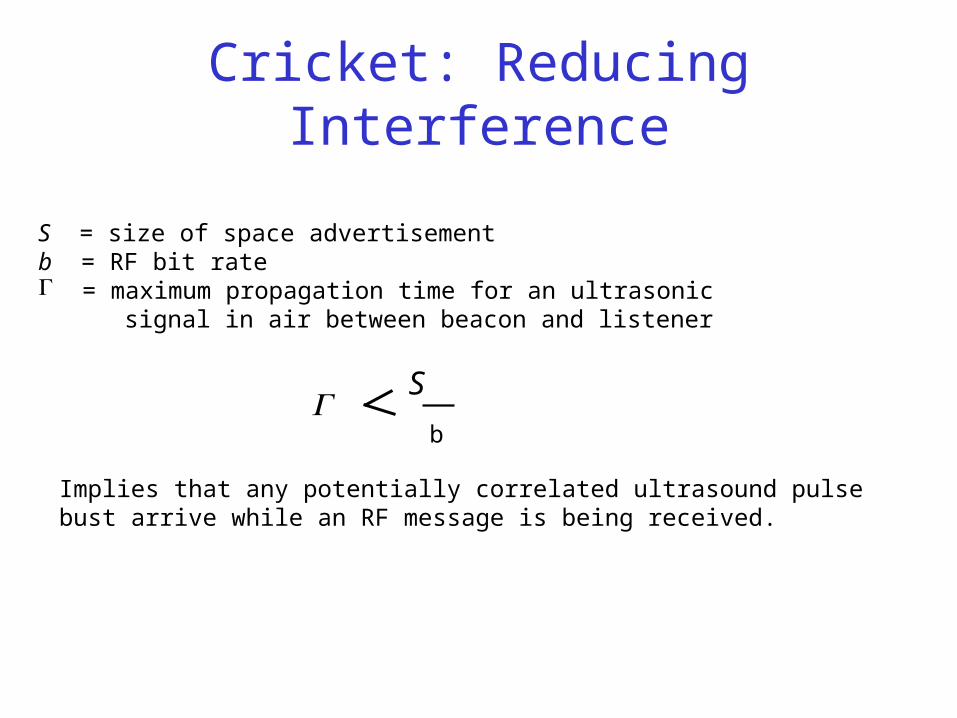
S = size of space advertisementb = RF bit rate = maximum propagation time for an ultrasonic signal in air between beacon and listener
Cricket: Reducing Interference
S
b
Implies that any potentially correlated ultrasound pulsebust arrive while an RF message is being received.
Cricket: Reducing Interference
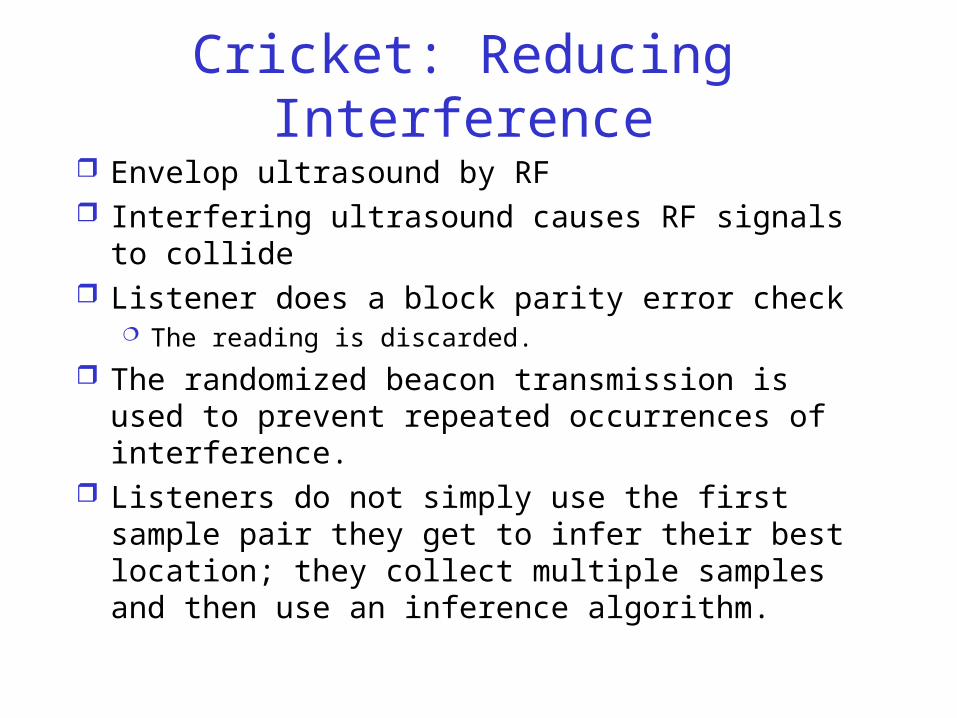
Envelop ultrasound by RF Interfering ultrasound causes RF signals to collide Listener does a block parity error check
The reading is discarded.
The randomized beacon transmission is used to prevent repeated occurrences of interference.
Listeners do not simply use the first sample pair they get to infer their best location; they collect multiple samples and then use an inference algorithm.
Cricket: Beacon Position Inference
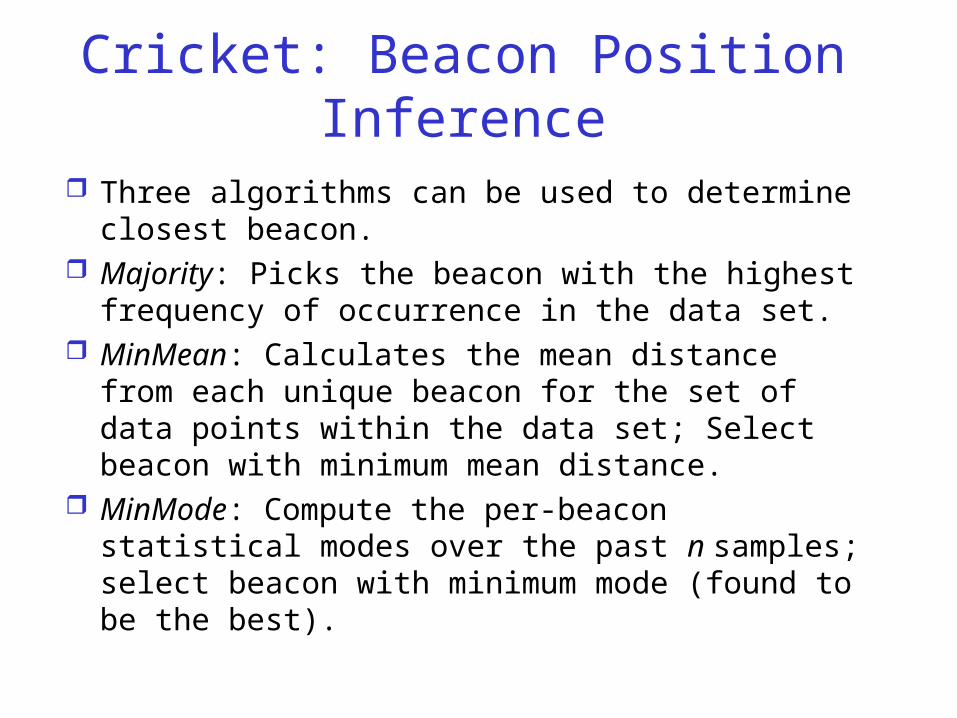
Three algorithms can be used to determine closest beacon.
Majority: Picks the beacon with the highest frequency of occurrence in the data set.
MinMean: Calculates the mean distance from each unique beacon for the set of data points within the data set; Select beacon with minimum mean distance.
MinMode: Compute the per-beacon statistical modes over the past n samples; select beacon with minimum mode (found to be the best).
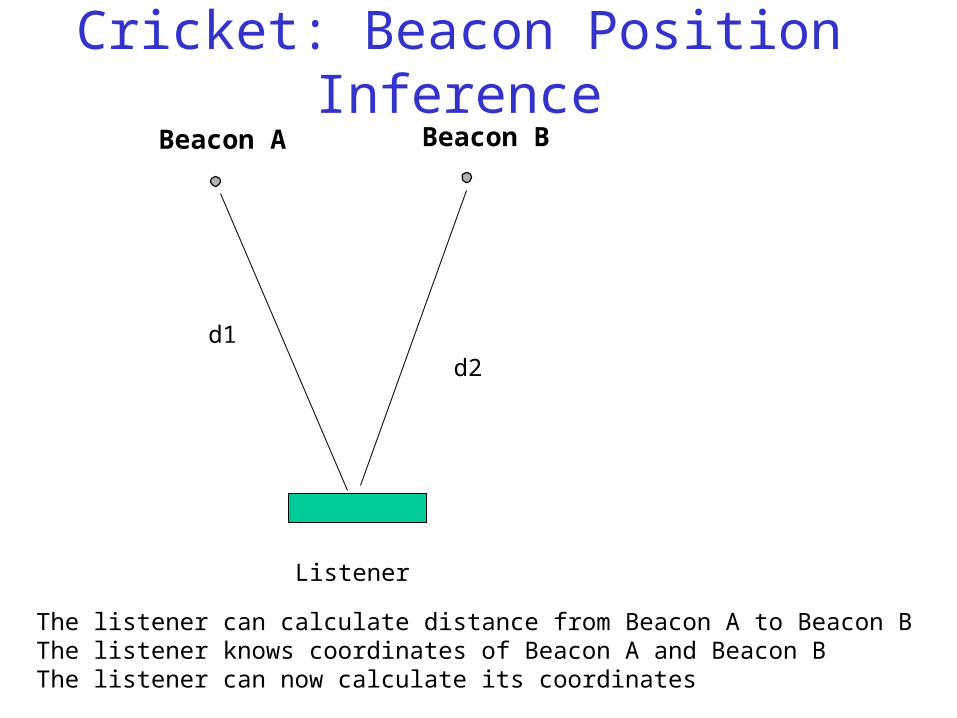
Cricket: Beacon Position Inference
Listener
Beacon BBeacon A
d1d2
The listener can calculate distance from Beacon A to Beacon BThe listener knows coordinates of Beacon A and Beacon BThe listener can now calculate its coordinates
Cricket: Beacon Position Inference
It’s actually a bit more complicated since the user may not be standing still.
Same principles apply but the geometry gets more complicated.
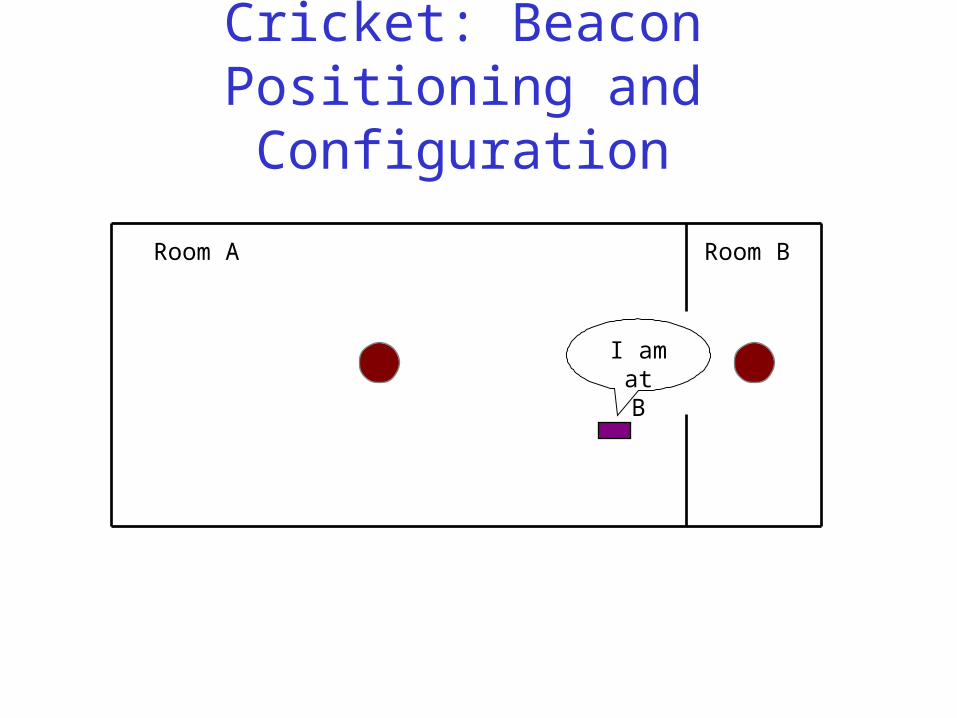
Cricket: Beacon Positioning and Configuration
Positioning of a beacon in a room is important
Consider the positioning shown in the figure on the next page.
Although receiver is in Room A, the listener finds the beacon in Room B to be closer.
Solution: Beacons should be placed at a fixed distance away from the boundary marking the two spaces.
Cricket: Beacon Positioning and Configuration
I am atB
Room A Room B
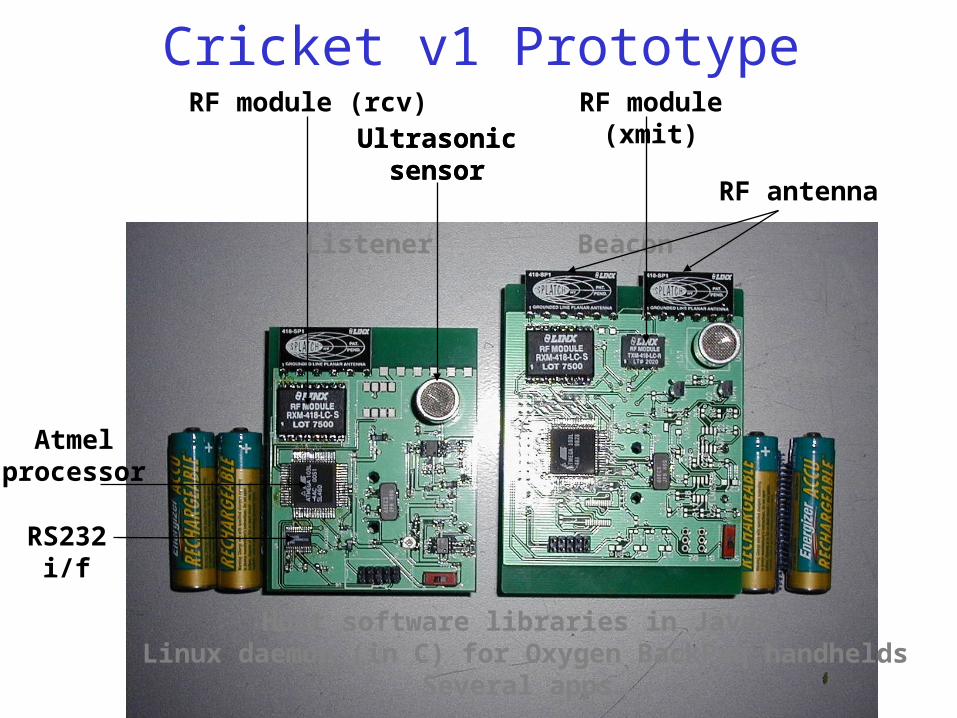
Ultrasonicsensor
RF antenna
Ultrasonicsensor
RF module (rcv)
Atmelprocessor
Listener Beacon
RF module (xmit)
RS232i/f
Cricket v1 Prototype
Host software libraries in Java; Linux daemon (in C) for Oxygen BackPaq handhelds
Several apps…
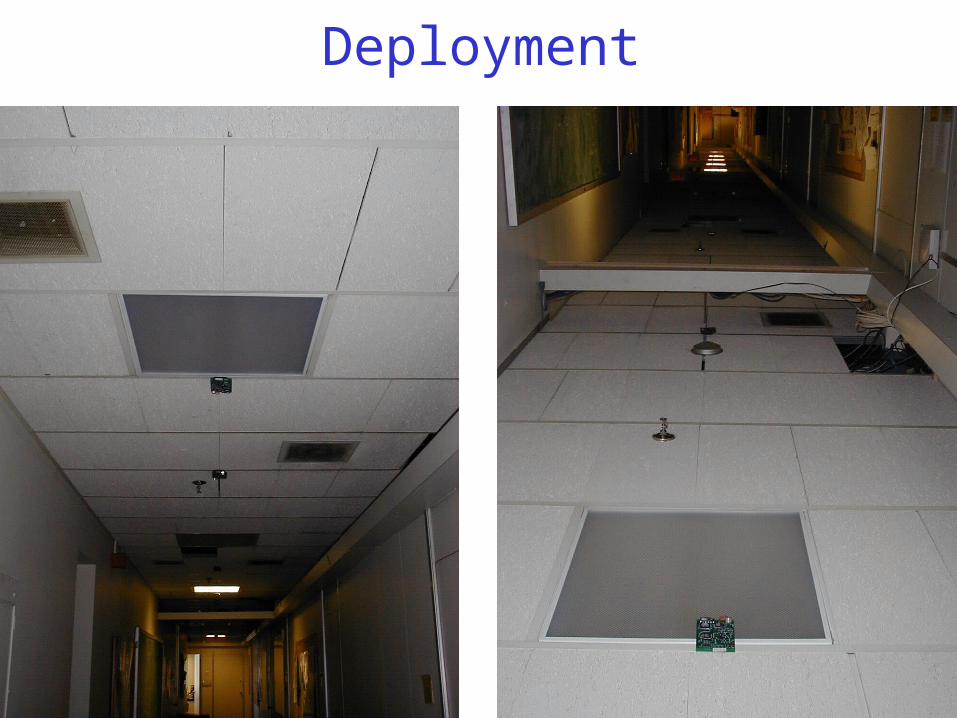
Deployment
Experimental Results
Cricket units were able to correctly identify the room in which they were located in over 95% of cases when stationary.
Achieve a location granularity of 4x4 feet.
Cricket: Comments
Provides privacy Higher power consumption due to
localized computations
Active Bat System: Bat Unit
Radio transceiver, controlling logic and an ultrasonic transducer.
Each bat has a globally unique identifier.
Active Bat System: Ultrasound Receiver Units
Placed at known points on the ceiling of the rooms to be instrumented.
Receivers are connected by a wired daisy-chain network.
Active Bat System: Base Station
Periodically transmits a radio message containing a single identifier (corresponds to a Bat unit).
This causes the corresponding Bat to emit a short unencoded pulse of ultrasound.
Receivers monitor the incoming ultrasound and record the time of arrival for any bat signal.
Active Bat System: Base Station (continued)
Base station transmits at the beginning of a timeslot. Timeslots are long enough so that receivers do not get confused.
It takes 20 ms between bat readings = 50 timeslots per base station per second
Location can be used to measure orientation Attach many bats to the same object. Use the
measurements to infer the orientation Base station can provide Location Quality-of-
Service(LQoS) to allocate time slots to bats based on the expected update frequency Bats carried by people – few times a second Bats attached to workstation – once every few
minutes
Active Bat System: Calculating Location
Using the speed of sound in air, the times of flight of the ultrasound pulse from the Bat to receivers can be converted into corresponding Bat-Receiver distances.
If distances from the Bat to three or more non-collinear receivers can be found, its position may determined.
Active Bat System: Scalability
LQoS allows for a more efficient distribution of timeslots for a set of Bats
Scheduling is dynamic A person is monitored a few times a second A workstation may be monitored once every few
minutes A workstation may be monitored more frequently if a
person walks up to it.
Scheduling can be used for power saving If a base station knows that an object will not be
located for some time, it can command that Bats associated with that object to temporarily enter a low power sleep state.
Active Bat System: Scalability
Set of Bats to be tracked will change over time. If a base station sees no indication from
receivers that a Bat has responded in its timeslots, then it is assumed that the Bat has left the operating space.
When a Bat enters a space, it senses the base station when the base station is broadcasting. It sends a registration message (we are assuming an Aloha protocol).
Active Bat System: Scalability
Bats perform handover when moving from one base station to another (similar to the cellular networks)
Hand off decisions can also be made based on the Bat location
Battery consumption is low, power consumed depends on the update frequency and power state
Active Bat System: Experiments
Test Environment Two rooms and corridor Two base stations and 100 receivers to
cover approximately 280m3.
Active Bat System: Experiments
In 100,000 measurements, 95% of readings had errors of less than 9cm.
15 degree error in 90% of measurements with a 22 cm separation between the Bats.
General Discussion
Which one of these approaches is better? Difficult to compare error rate. RF is not robust; ultrasound systems are better
but only if ceiling mounted. Lots of start-up cost with Active Bats; same
with Cricket but the beacons are independent in Cricket.
RADAR is relatively inexpensive in terms of hardware but extremely time-consuming to do calibiration.
RADAR needs network cards.
General Discussion
All of the techniques discussed are based on a cellular approach. This does not have to be the case.
Biometric approaches possible SMART FLOOR project at Georgia tech
tries to identify persons by their footstep force profiles. Claim: 90% accurate Unobtrusive Works only for people and not things.
General Discussion
Cameras can also be used to track user location.
These systems have line of sight problems such as IR and so far only work well with a small number of persons in a room.
General Discussion
Cricket is decentralized; Active Bats and RADAR are not (although RADAR could be made more decentralized).
Ability of location systems to scale geographically is dominated by installation costs.