Embed Size (px)
Citation preview

SSeennssoorrss && TTrraannssdduucceerrss
Volume 85 Issue 11 November 2007
www.sensorsportal.com ISSN 1726-5479
Editor-in-Chief: professor Sergey Y. Yurish, phone: +34 696067716, fax: +34 93 4011989, e-mail: [email protected]
Editors for Western Europe Meijer, Gerard C.M., Delft University of Technology, The Netherlands Ferrari, Vitorio, UUnniivveerrssiittáá ddii BBrreesscciiaa,, IIttaaly Editors for North America Datskos, Panos G., OOaakk RRiiddggee NNaattiioonnaall LLaabboorraattoorryy,, UUSSAA Fabien, J. Josse, Marquette University, USA Katz, Evgeny, Clarkson University, USA
Editor South America Costa-Felix, Rodrigo, Inmetro, Brazil Editor for Eastern Europe Sachenko, Anatoly, Ternopil State Economic University, Ukraine Editor for Asia Ohyama, Shinji, Tokyo Institute of Technology, Japan
Editorial Advisory Board
Abdul Rahim, Ruzairi, Universiti Teknologi, Malaysia Ahmad, Mohd Noor, Nothern University of Engineering, Malaysia Annamalai, Karthigeyan, National Institute of Advanced Industrial
Science and Technology, Japan Arcega, Francisco, University of Zaragoza, Spain Arguel, Philippe, CNRS, France Ahn, Jae-Pyoung, Korea Institute of Science and Technology, Korea Arndt, Michael, Robert Bosch GmbH, Germany Ascoli, Giorgio, George Mason University, USA Atalay, Selcuk, Inonu University, Turkey Atghiaee, Ahmad, University of Tehran, Iran Augutis, Vygantas, Kaunas University of Technology, Lithuania Avachit, Patil Lalchand, North Maharashtra University, India Ayesh, Aladdin, De Montfort University, UK Bahreyni, Behraad, University of Manitoba, Canada Baoxian, Ye, Zhengzhou University, China Barford, Lee, Agilent Laboratories, USA Barlingay, Ravindra, Priyadarshini College of Engineering and
Architecture, India Basu, Sukumar, Jadavpur University, India Beck, Stephen, University of Sheffield, UK Ben Bouzid, Sihem, Institut National de Recherche Scientifique, Tunisia Binnie, T. David, Napier University, UK Bischoff, Gerlinde, Inst. Analytical Chemistry, Germany Bodas, Dhananjay, IMTEK, Germany Borges Carval, Nuno, Universidade de Aveiro, Portugal Bousbia-Salah, Mounir, University of Annaba, Algeria Bouvet, Marcel, CNRS – UPMC, France Brudzewski, Kazimierz, Warsaw University of Technology, Poland Cai, Chenxin, Nanjing Normal University, China Cai, Qingyun, Hunan University, China Campanella, Luigi, University La Sapienza, Italy Carvalho, Vitor, Minho University, Portugal Cecelja, Franjo, Brunel University, London, UK Cerda Belmonte, Judith, Imperial College London, UK Chakrabarty, Chandan Kumar, Universiti Tenaga Nasional, Malaysia Chakravorty, Dipankar, Association for the Cultivation of Science, India Changhai, Ru, Harbin Engineering University, China Chaudhari, Gajanan, Shri Shivaji Science College, India Chen, Rongshun, National Tsing Hua University, Taiwan Cheng, Kuo-Sheng, National Cheng Kung University, Taiwan Chiriac, Horia, National Institute of Research and Development, Romania Chowdhuri, Arijit, University of Delhi, India Chung, Wen-Yaw, Chung Yuan Christian University, Taiwan Corres, Jesus, Universidad Publica de Navarra, Spain Cortes, Camilo A., Universidad de La Salle, Colombia Courtois, Christian, Universite de Valenciennes, France Cusano, Andrea, University of Sannio, Italy D'Amico, Arnaldo, Università di Tor Vergata, Italy De Stefano, Luca, Institute for Microelectronics and Microsystem, Italy Deshmukh, Kiran, Shri Shivaji Mahavidyalaya, Barshi, India Kang, Moonho, Sunmoon University, Korea South Kaniusas, Eugenijus, Vienna University of Technology, Austria Katake, Anup, Texas A&M University, USA
Dickert, Franz L., Vienna University, Austria Dieguez, Angel, University of Barcelona, Spain Dimitropoulos, Panos, University of Thessaly, Greece Ding Jian, Ning, Jiangsu University, China Djordjevich, Alexandar, City University of Hong Kong, Hong Kong Donato, Nicola, University of Messina, Italy Donato, Patricio, Universidad de Mar del Plata, Argentina Dong, Feng, Tianjin University, China Drljaca, Predrag, Instersema Sensoric SA, Switzerland Dubey, Venketesh, Bournemouth University, UK Enderle, Stefan, University of Ulm and KTB mechatronics GmbH,
Germany Erdem, Gursan K. Arzum, Ege University, Turkey Erkmen, Aydan M., Middle East Technical University, Turkey Estelle, Patrice, Insa Rennes, France Estrada, Horacio, University of North Carolina, USA Faiz, Adil, INSA Lyon, France Fericean, Sorin, Balluff GmbH, Germany Fernandes, Joana M., University of Porto, Portugal Francioso, Luca, CNR-IMM Institute for Microelectronics and
Microsystems, Italy Fu, Weiling, South-Western Hospital, Chongqing, China Gaura, Elena, Coventry University, UK Geng, Yanfeng, China University of Petroleum, China Gole, James, Georgia Institute of Technology, USA Gong, Hao, National University of Singapore, Singapore Gonzalez de la Ros, Juan Jose, University of Cadiz, Spain Granel, Annette, Goteborg University, Sweden Graff, Mason, The University of Texas at Arlington, USA Guan, Shan, Eastman Kodak, USA Guillet, Bruno, University of Caen, France Guo, Zhen, New Jersey Institute of Technology, USA Gupta, Narendra Kumar, Napier University, UK Hadjiloucas, Sillas, The University of Reading, UK Hashsham, Syed, Michigan State University, USA Hernandez, Alvaro, University of Alcala, Spain Hernandez, Wilmar, Universidad Politecnica de Madrid, Spain Homentcovschi, Dorel, SUNY Binghamton, USA Horstman, Tom, U.S. Automation Group, LLC, USA Hsiai, Tzung (John), University of Southern California, USA Huang, Jeng-Sheng, Chung Yuan Christian University, Taiwan Huang, Star, National Tsing Hua University, Taiwan Huang, Wei, PSG Design Center, USA Hui, David, University of New Orleans, USA Jaffrezic-Renault, Nicole, Ecole Centrale de Lyon, France Jaime Calvo-Galleg, Jaime, Universidad de Salamanca, Spain James, Daniel, Griffith University, Australia Janting, Jakob, DELTA Danish Electronics, Denmark Jiang, Liudi, University of Southampton, UK Jiao, Zheng, Shanghai University, China John, Joachim, IMEC, Belgium Kalach, Andrew, Voronezh Institute of Ministry of Interior, Russia Rodriguez, Angel, Universidad Politecnica de Cataluna, Spain Rothberg, Steve, Loughborough University, UK
Kausel, Wilfried, University of Music, Vienna, Austria Kavasoglu, Nese, Mugla University, Turkey Ke, Cathy, Tyndall National Institute, Ireland Khan, Asif, Aligarh Muslim University, Aligarh, India Kim, Min Young, Koh Young Technology, Inc., Korea South Ko, Sang Choon, Electronics and Telecommunications Research Institute,
Korea South Kockar, Hakan, Balikesir University, Turkey Kotulska, Malgorzata, Wroclaw University of Technology, Poland Kratz, Henrik, Uppsala University, Sweden Kumar, Arun, University of South Florida, USA Kumar, Subodh, National Physical Laboratory, India Kung, Chih-Hsien, Chang-Jung Christian University, Taiwan Lacnjevac, Caslav, University of Belgrade, Serbia Laurent, Francis, IMEC , Belgium Lay-Ekuakille, Aime, University of Lecce, Italy Lee, Jang Myung, Pusan National University, Korea South Lee, Jun Su, Amkor Technology, Inc. South Korea Lei, Hua, National Starch and Chemical Company, USA Li, Genxi, Nanjing University, China Li, Hui, Shanghai Jiaotong University, China Li, Xian-Fang, Central South University, China Liang, Yuanchang, University of Washington, USA Liawruangrath, Saisunee, Chiang Mai University, Thailand Liew, Kim Meow, City University of Hong Kong, Hong Kong Lin, Hermann, National Kaohsiung University, Taiwan Lin, Paul, Cleveland State University, USA Linderholm, Pontus, EPFL - Microsystems Laboratory, Switzerland Liu, Aihua, Michigan State University, USA Liu Changgeng, Louisiana State University, USA Liu, Cheng-Hsien, National Tsing Hua University, Taiwan Liu, Songqin, Southeast University, China Lodeiro, Carlos, Universidade NOVA de Lisboa, Portugal Lorenzo, Maria Encarnacio, Universidad Autonoma de Madrid, Spain Lukaszewicz, Jerzy Pawel, Nicholas Copernicus University, Poland Ma, Zhanfang, Northeast Normal University, China Majstorovic, Vidosav, University of Belgrade, Serbia Marquez, Alfredo, Centro de Investigacion en Materiales Avanzados,
Mexico Matay, Ladislav, Slovak Academy of Sciences, Slovakia Mathur, Prafull, National Physical Laboratory, India Maurya, D.K., Institute of Materials Research and Engineering, Singapore Mekid, Samir, University of Manchester, UK Mendes, Paulo, University of Minho, Portugal Mennell, Julie, Northumbria University, UK Mi, Bin, Boston Scientific Corporation, USA Minas, Graca, University of Minho, Portugal Moghavvemi, Mahmoud, University of Malaya, Malaysia Mohammadi, Mohammad-Reza, University of Cambridge, UK Molina Flores, Esteban, Benemirita Universidad Autonoma de Puebla,
Mexico Moradi, Majid, University of Kerman, Iran Morello, Rosario, DIMET, University "Mediterranea" of Reggio Calabria,
Italy Mounir, Ben Ali, University of Sousse, Tunisia Mukhopadhyay, Subhas, Massey University, New Zealand Neelamegam, Periasamy, Sastra Deemed University, India Neshkova, Milka, Bulgarian Academy of Sciences, Bulgaria Oberhammer, Joachim, Royal Institute of Technology, Sweden Ould Lahoucin, University of Guelma, Algeria Pamidighanta, Sayanu, Bharat Electronics Limited (BEL), India Pan, Jisheng, Institute of Materials Research & Engineering, Singapore Park, Joon-Shik, Korea Electronics Technology Institute, Korea South Pereira, Jose Miguel, Instituto Politecnico de Setebal, Portugal Petsev, Dimiter, University of New Mexico, USA Pogacnik, Lea, University of Ljubljana, Slovenia Post, Michael, National Research Council, Canada Prance, Robert, University of Sussex, UK Prasad, Ambika, Gulbarga University, India Prateepasen, Asa, Kingmoungut's University of Technology, Thailand Pullini, Daniele, Centro Ricerche FIAT, Italy Pumera, Martin, National Institute for Materials Science, Japan Radhakrishnan, S. National Chemical Laboratory, Pune, India Rajanna, K., Indian Institute of Science, India Ramadan, Qasem, Institute of Microelectronics, Singapore Rao, Basuthkar, Tata Inst. of Fundamental Research, India Reig, Candid, University of Valencia, Spain Restivo, Maria Teresa, University of Porto, Portugal Rezazadeh, Ghader, Urmia University, Iran
Robert, Michel, University Henri Poincare, France Royo, Santiago, Universitat Politecnica de Catalunya, Spain Sadana, Ajit, University of Mississippi, USA Sandacci, Serghei, Sensor Technology Ltd., UK Sapozhnikova, Ksenia, D.I.Mendeleyev Institute for Metrology, Russia Saxena, Vibha, Bhbha Atomic Research Centre, Mumbai, India Schneider, John K., Ultra-Scan Corporation, USA Seif, Selemani, Alabama A & M University, USA Seifter, Achim, Los Alamos National Laboratory, USA Sengupta, Deepak, Advance Bio-Photonics, India Shearwood, Christopher, Nanyang Technological University, Singapore Shin, Kyuho, Samsung Advanced Institute of Technology, Korea Shmaliy, Yuriy, Kharkiv National University of Radio Electronics,
Ukraine Silva Girao, Pedro, Technical University of Lisbon Portugal Slomovitz, Daniel, UTE, Uruguay Smith, Martin, Open University, UK Soleymanpour, Ahmad, Damghan Basic Science University, Iran Somani, Prakash R., Centre for Materials for Electronics Technology,
India Srinivas, Talabattula, Indian Institute of Science, Bangalore, India Srivastava, Arvind K., Northwestern University Stefan-van Staden, Raluca-Ioana, University of Pretoria, South Africa Sumriddetchka, Sarun, National Electronics and Computer Technology
Center, Thailand Sun, Chengliang, Polytechnic University, Hong-Kong Sun, Dongming, Jilin University, China Sun, Junhua, Beijing University of Aeronautics and Astronautics, China Sun, Zhiqiang, Central South University, China Suri, C. Raman, Institute of Microbial Technology, India Sysoev, Victor, Saratov State Technical University, Russia Szewczyk, Roman, Industrial Research Institute for Automation and
Measurement, Poland Tan, Ooi Kiang, Nanyang Technological University, Singapore, Tang, Dianping, Southwest University, China Tang, Jaw-Luen, National Chung Cheng University, Taiwan Thumbavanam Pad, Kartik, Carnegie Mellon University, USA Tsiantos, Vassilios, Technological Educational Institute of Kaval, Greece Tsigara, Anna, National Hellenic Research Foundation, Greece Twomey, Karen, University College Cork, Ireland Valente, Antonio, University, Vila Real, - U.T.A.D., Portugal Vaseashta, Ashok, Marshall University, USA Vazques, Carmen, Carlos III University in Madrid, Spain Vieira, Manuela, Instituto Superior de Engenharia de Lisboa, Portugal Vigna, Benedetto, STMicroelectronics, Italy Vrba, Radimir, Brno University of Technology, Czech Republic Wandelt, Barbara, Technical University of Lodz, Poland Wang, Jiangping, Xi'an Shiyou University, China Wang, Kedong, Beihang University, China Wang, Liang, Advanced Micro Devices, USA Wang, Mi, University of Leeds, UK Wang, Shinn-Fwu, Ching Yun University, Taiwan Wang, Wei-Chih, University of Washington, USA Wang, Wensheng, University of Pennsylvania, USA Watson, Steven, Center for NanoSpace Technologies Inc., USA Weiping, Yan, Dalian University of Technology, China Wells, Stephen, Southern Company Services, USA Wolkenberg, Andrzej, Institute of Electron Technology, Poland Woods, R. Clive, Louisiana State University, USA Wu, DerHo, National Pingtung University of Science and Technology,
Taiwan Wu, Zhaoyang, Hunan University, China Xiu Tao, Ge, Chuzhou University, China Xu, Tao, University of California, Irvine, USA Yang, Dongfang, National Research Council, Canada Yang, Wuqiang, The University of Manchester, UK Ymeti, Aurel, University of Twente, Netherland Yu, Haihu, Wuhan University of Technology, China Yufera Garcia, Alberto, Seville University, Spain Zagnoni, Michele, University of Southampton, UK Zeni, Luigi, Second University of Naples, Italy Zhong, Haoxiang, Henan Normal University, China Zhang, Minglong, Shanghai University, China Zhang, Qintao, University of California at Berkeley, USA Zhang, Weiping, Shanghai Jiao Tong University, China Zhang, Wenming, Shanghai Jiao Tong University, China Zhou, Zhi-Gang, Tsinghua University, China Zorzano, Luis, Universidad de La Rioja, Spain Zourob, Mohammed, University of Cambridge, UK
Sensors & Transducers Journal (ISSN 1726-5479) is a peer review international journal published monthly online by International Frequency Sensor Association (IFSA). Available in electronic and CD-ROM. Copyright © 2007 by International Frequency Sensor Association. All rights reserved.
SSeennssoorrss && TTrraannssdduucceerrss JJoouurrnnaall
CCoonntteennttss
Volume 85 Issue 11 November 2007
www.sensorsportal.com ISSN 1726-5479
Research Articles
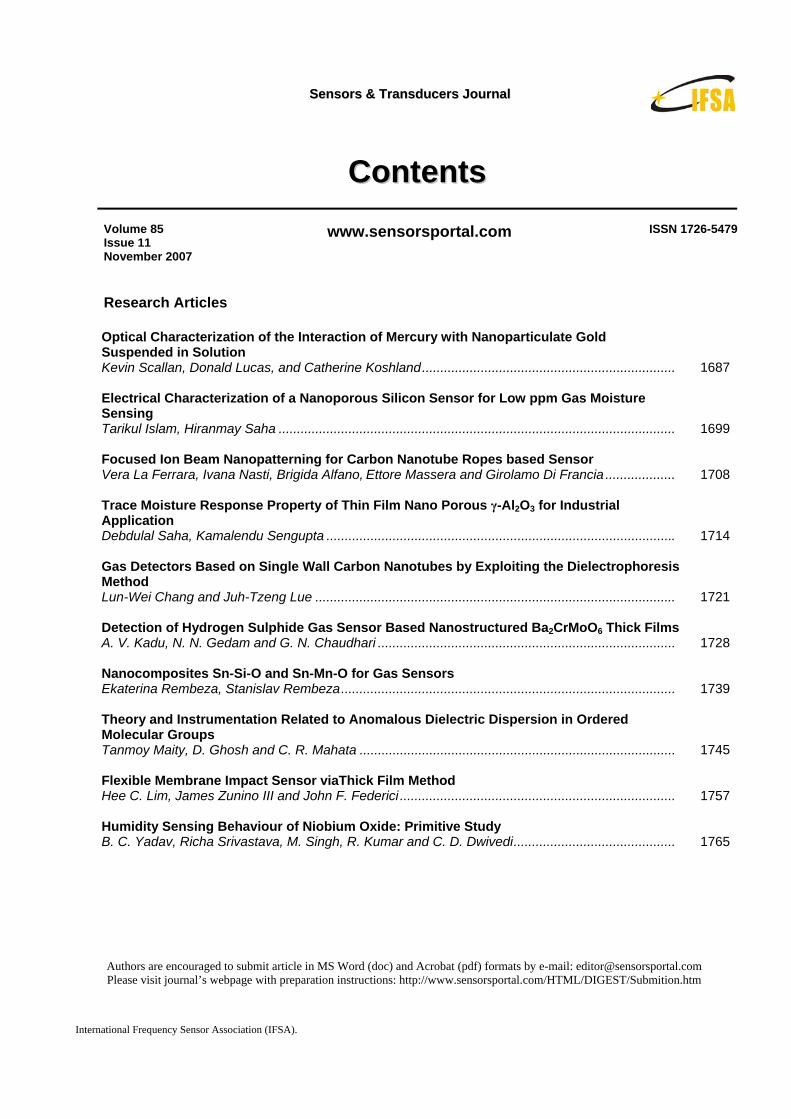
Optical Characterization of the Interaction of Mercury with Nanoparticulate Gold Suspended in Solution Kevin Scallan, Donald Lucas, and Catherine Koshland..................................................................... 1687 Electrical Characterization of a Nanoporous Silicon Sensor for Low ppm Gas Moisture Sensing Tarikul Islam, Hiranmay Saha ............................................................................................................ 1699 Focused Ion Beam Nanopatterning for Carbon Nanotube Ropes based Sensor Vera La Ferrara, Ivana Nasti, Brigida Alfano, Ettore Massera and Girolamo Di Francia ................... 1708 Trace Moisture Response Property of Thin Film Nano Porous γ-Al2O3 for Industrial Application Debdulal Saha, Kamalendu Sengupta ............................................................................................... 1714 Gas Detectors Based on Single Wall Carbon Nanotubes by Exploiting the Dielectrophoresis Method Lun-Wei Chang and Juh-Tzeng Lue .................................................................................................. 1721 Detection of Hydrogen Sulphide Gas Sensor Based Nanostructured Ba2CrMoO6 Thick Films A. V. Kadu, N. N. Gedam and G. N. Chaudhari ................................................................................. 1728 Nanocomposites Sn-Si-O and Sn-Mn-O for Gas Sensors Ekaterina Rembeza, Stanislav Rembeza........................................................................................... 1739 Theory and Instrumentation Related to Anomalous Dielectric Dispersion in Ordered Molecular Groups Tanmoy Maity, D. Ghosh and C. R. Mahata ...................................................................................... 1745 Flexible Membrane Impact Sensor viaThick Film Method Hee C. Lim, James Zunino III and John F. Federici ........................................................................... 1757 Humidity Sensing Behaviour of Niobium Oxide: Primitive Study B. C. Yadav, Richa Srivastava, M. Singh, R. Kumar and C. D. Dwivedi............................................ 1765
Authors are encouraged to submit article in MS Word (doc) and Acrobat (pdf) formats by e-mail: [email protected] Please visit journal’s webpage with preparation instructions: http://www.sensorsportal.com/HTML/DIGEST/Submition.htm
International Frequency Sensor Association (IFSA).
Sensors & Transducers Journal, Vol.85, Issue 11, November 2007, pp. 1687-1698
1687
SSSeeennnsssooorrrsss &&& TTTrrraaannnsssddduuuccceeerrrsss
ISSN 1726-5479© 2007 by IFSA
http://www.sensorsportal.com
Optical Characterization of the Interaction of Mercury with Nanoparticulate Gold Suspended in Solution
1Kevin SCALLAN, 2Donald LUCAS, and 3Catherine KOSHLAND
1Department of Mechanical Engineering, University of California at Berkeley, 2Environmental Energy Technologies Division, Lawrence Berkeley National Laboratory,
3School of Public Health, University of California at Berkeley, Berkeley, CA 94720 Tel: +1-510-486 4134
E-mail: [email protected]
Received: 27 February 2007 /Accepted: 20 November 2007 /Published: 26 November 2007 Abstract: We have demonstrated that the surface plasmon resonance (SPR) wavelength of gold nanoparticles suspended in solution can be modified by exposure to elemental mercury at sub parts per million (ppm) concentrations in nitrogen. Ultraviolet-visible (UV-vis) absorption spectroscopy was used to monitor the wavelength and maximum absorbance of the colloidal solution during and after the exposure process. Transmission electron microscopy (TEM) images revealed modifications to the morphology of the particles (size, shape, and extent of aggregation). The results show that the SPR wavelength is blue-shifted and the absorbance is increased with exposure time. After the exposure, the spectra were observed to relax toward their original position suggesting that the detection medium is regenerative. Copyright © 2007 IFSA. Keywords: Mercury, Gold, Nanoparticle, Surface plasmon resonance 1. Introduction The detection and quantification of mercury are important in many applications including environmental monitoring, waste management, developmental biology, and clinical toxicology. Because of its persistent, bioaccumulative, and toxic (PBT) nature, mercury contamination has emerged as a global concern. Elemental mercury, given its high vapor pressure (1.6 ppm on a mass basis at standard temperature and pressure, [1a]), high diffusivity in air (0.135 ± 0.003 cm2/s, [2]), low water solubility (50 ppb on a mass basis at STP, [3]), and relative stability is difficult to capture, can be transported long distances, and has an atmospheric residence time of between 1-2 years.
Sensors & Transducers Journal, Vol.85, Issue 11, November 2007, pp. 1687-1698
1688
Gaseous (elemental) mercury is the dominant atmospheric species [4, 5]. It is removed from the atmosphere by dry deposition onto surfaces or by wet deposition after oxidation to water-soluble monovalent or divalent mercury. Divalent mercury is more stable and thus more common in the atmosphere, and is typically the primary component in oxic, suboxic, and anoxic aqueous environments [6]. It can be associated with inorganic molecules including chlorine, sulfur, and hydroxyl ions, and organic molecules giving rise to monomethylmercury and dimethylmercury, both of which are highly toxic and can bioaccumulate by up to a factor of 105 in the aquatic food chain [7]. Monomethylmercury is the most significant species in terms of adverse biological effects but typically only represents a small fraction of the total mercury in any medium. However, given that all species of mercury can be converted to the monomethyl compound, a quantitative understanding of the environmental fate of the species is critical to controlling, regulating, and assessing the ecological risk of mercury contamination. In particular, the control and regulation of gaseous or elemental mercury is of fundamental importance. The primary source of elemental mercury is anthropogenic emissions from coal-fired power plants and waste incineration facilities [8]. Recently, new regulation aimed at minimizing the human health effects and environmental hazards caused by mercury pollution has necessitated the need for sensitive, reliable, portable, and inexpensive mercury detectors [9]. Commercial mercury analyzers are primarily based on atomic absorption spectroscopy, atomic fluorescence spectroscopy, or inductively coupled plasma mass spectrometry. These techniques, while sensitive, generally lack portability, are expensive, and often require analyte preconcentration onto the surface of a noble metal. In principle, colorimetric methods have the potential to satisfy the requirements for a simple, real-time, portable continuous mercury emissions analyzer but given that most conventional molecular dyes exhibit relatively low extinction coefficients, the challenge is to identify appropriate binding leuco dyes capable of yielding sufficiently intense absorbing metal/dye complexes [10]. An alternative is to use nonmolecular chromophores such as free-electron metal nanoparticles that display visible extinction coefficients up to several orders of magnitude higher, e.g.: gold, silver, and copper. In this paper, we demonstrate the potential for a sensitive, reliable, portable, inexpensive elemental mercury detector that takes advantage of the visible surface plasmon resonance (SPR) wavelength of gold nanoparticles. We first hypothesized that the SPR phenomenon can be used as an analytical tool to detect and quantify the concentration of elemental mercury adsorbed and/or absorbed to gold nanoparticles suspended in solution. Aqueous suspensions of the gold particles display an intense plasmon absorption band centered at approximately 520 nm that renders the colloidal solution ruby-red in color. Gold nanoparticles were chosen for a number of reasons. First, as is well known in the mining industry, mercury has a high affinity for gold and will readily form an amalgam [11]. Second, gold nanoparticles display a surface plasmon resonance (SPR) band in the visible region at about 520 nm. The exact location of the SPR wavelength is a complex function of particle morphology, the surrounding medium, and any adsorbent species present [12, 13]. By maintaining a constant particle size and shape, and stable surrounding medium, the degree to which a particular adsorbent, for example elemental mercury, is adsorbed by the particles can be directly related to the change in the SPR wavelength. A further advantage of using gold nanoparticles is their very high surface area to volume ratio which minimizes the amount of material required and maximizes the sensitivity. 2. Material and Methods Colloidal gold was procured from British Biocell International (BBI), product code EM.GC5. The particle diameter was 5 nm with coefficient of variation < 15% (0.75 nm) and particle roundness greater than 95%. The particle concentration was calculated to be 5 x 10¹³ particles per ml with a molar absorptivity of 2058 M-1 cm-1 at the SPR peak. The solution was stored in a transparent, polyethylene terephthalate (PETE) container at room temperature and remained stable for the duration
Sensors & Transducers Journal, Vol.85, Issue 11, November 2007, pp. 1687-1698
1689
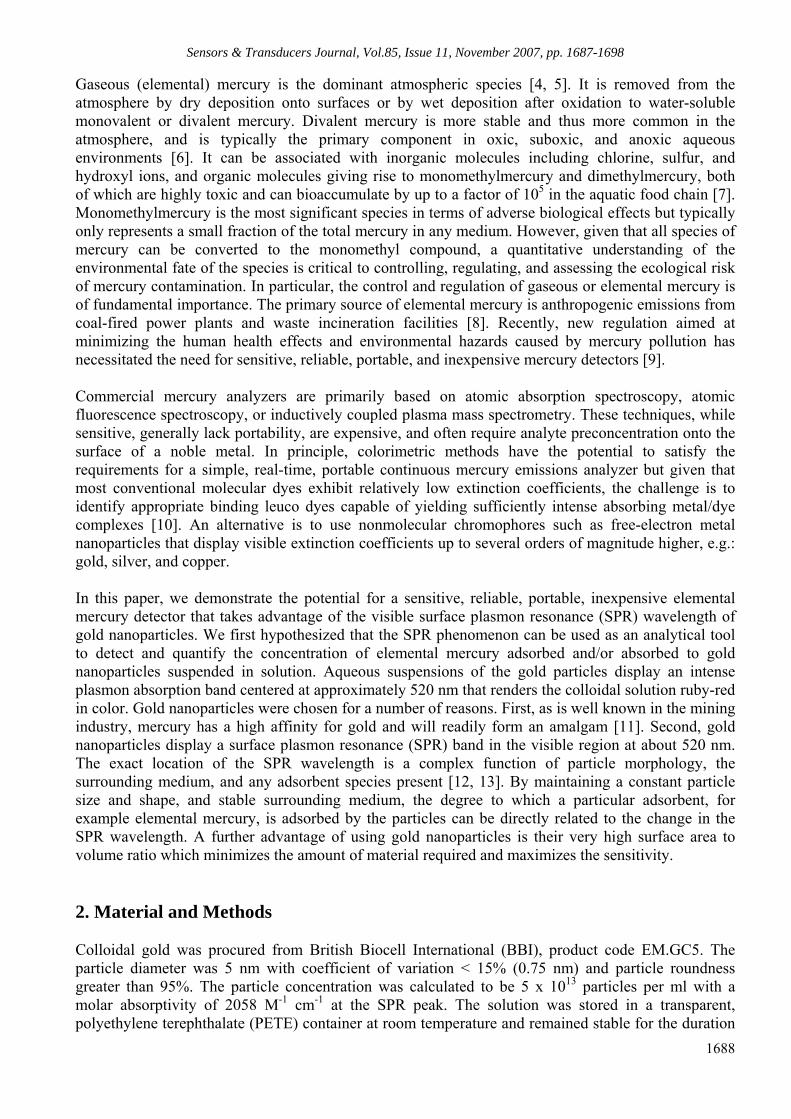
of the experiment. Elemental mercury (99.9999% electronic grade from Aldrich Chem. Co.) was used as the source of mercury vapor. The experimental apparatus is shown in Fig. 1. A bead (1 gram) of elemental mercury was indirectly submerged into a temperature controlled water bath and its vapor pressure controlled by setting the temperature of the bath. The mercury vapor was entrained in a nitrogen (99.999% from Airgas) carrier stream flowing at 140 cubic centimeters per minute (ccm) and was assumed to be in a state of equilibrium. The mercury vapor was exposed to the gold nanoparticles by bubbling the carrier stream through a series of three 4 ml UV-vis cuvettes with a 1 cm path length. Each cuvette contained 3.2 ml of the colloidal gold solution.
Fig. 1. The experimental apparatus consisting of three cuvettes, a water bath to control the temperature, and a bead of elemental mercury. The carrier stream was permitted to escape from the system after the last cuvette
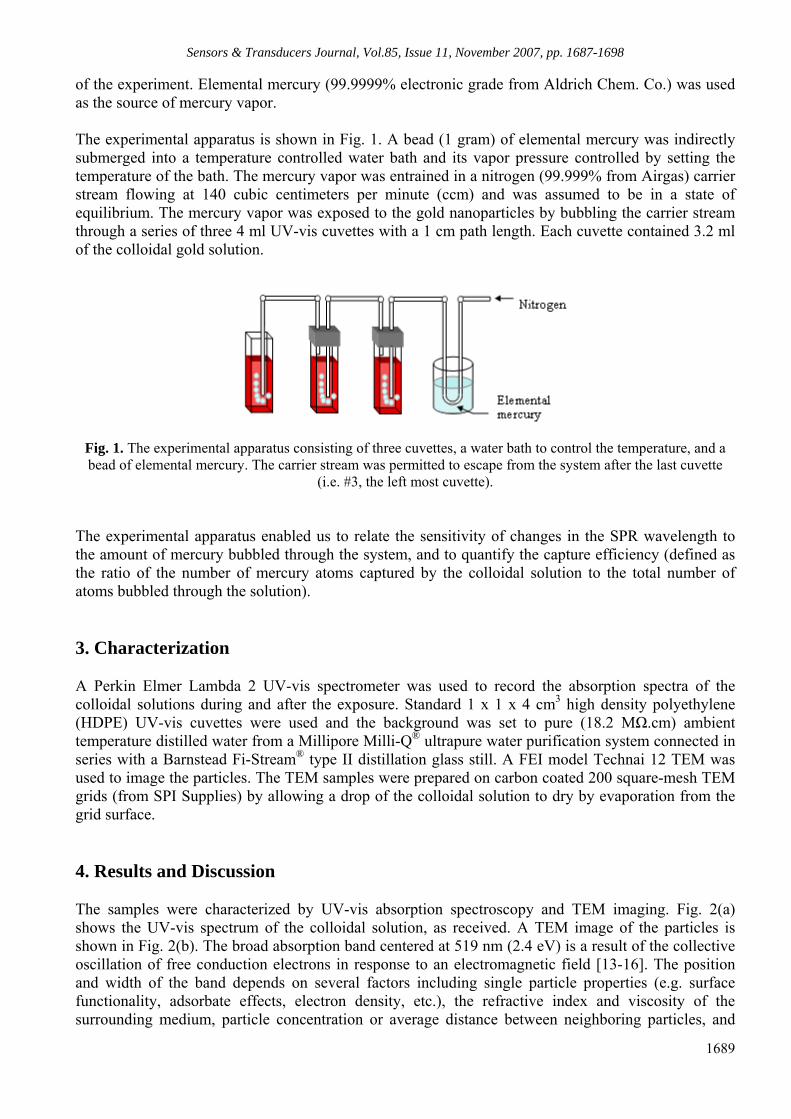
(i.e. #3, the left most cuvette). The experimental apparatus enabled us to relate the sensitivity of changes in the SPR wavelength to the amount of mercury bubbled through the system, and to quantify the capture efficiency (defined as the ratio of the number of mercury atoms captured by the colloidal solution to the total number of atoms bubbled through the solution). 3. Characterization A Perkin Elmer Lambda 2 UV-vis spectrometer was used to record the absorption spectra of the colloidal solutions during and after the exposure. Standard 1 x 1 x 4 cm3 high density polyethylene (HDPE) UV-vis cuvettes were used and the background was set to pure (18.2 MΩ.cm) ambient temperature distilled water from a Millipore Milli-Q® ultrapure water purification system connected in series with a Barnstead Fi-Stream® type II distillation glass still. A FEI model Technai 12 TEM was used to image the particles. The TEM samples were prepared on carbon coated 200 square-mesh TEM grids (from SPI Supplies) by allowing a drop of the colloidal solution to dry by evaporation from the grid surface. 4. Results and Discussion The samples were characterized by UV-vis absorption spectroscopy and TEM imaging. Fig. 2(a) shows the UV-vis spectrum of the colloidal solution, as received. A TEM image of the particles is shown in Fig. 2(b). The broad absorption band centered at 519 nm (2.4 eV) is a result of the collective oscillation of free conduction electrons in response to an electromagnetic field [13-16]. The position and width of the band depends on several factors including single particle properties (e.g. surface functionality, adsorbate effects, electron density, etc.), the refractive index and viscosity of the surrounding medium, particle concentration or average distance between neighboring particles, and
Sensors & Transducers Journal, Vol.85, Issue 11, November 2007, pp. 1687-1698
1690
temperature [12,13]. Provided these variables are known, the position of the resonance band maximum can be used to assess colloidal concentration and particle size in solution [17].
0.0
0.3
0.6
0.9
400 550 700Wavelength [nm]
Abs
orba
nce
(A)
SPR peak at (519 nm, 0.66 A)
(a)
(b)
Fig. 2. (a) UV-vis absorption spectrum of the colloidal gold solution illustrating the SPR peak at 519 nm. The absorbance at the SPR peak is 0.66 A. (b) TEM image of the colloidal particles – the scale bar reads 100 nm.
4.1. The Surface Plasmon Resonance Phenomenon The SPR effect was first described quantitatively by classical electrodynamic (Mie) theory, based on bulk optical properties, by solving Maxwell’s equations with appropriate boundary conditions for small (< 100 nm) spherical particles [18]. For nanoparticles that are small compared to the wavelength of the exciting electromagnetic radiation (2R << λ, 2R < 25 nm for gold [15]) the quasi-static or discrete dipole approximation can be used and the extinction (absorption plus scattering) cross section is given by [13, 14, 19]:
[ ] 2223
29)(
εεεεωεωσ
′′++′′′
=m
mo cV , (1)
where Vo is the spherical particle volume, c is the speed of light, ω is the angular frequency of the exciting radiation, εm the dielectric constant of the surrounding medium (assumed to be frequency independent) and ε′ and ε″ are the real and imaginary parts of the complex dielectric function of the particle material respectively. From (1), Mie theory predicts that the surface plasmon resonance band occurs when ε′≈ -2εm (i.e., at the Fröhlich frequency) provided ε″ is small and only weakly dependent on the frequency. Further, (1) predicts that the position and width of the plasmon band are determined solely by ε″ and are independent of size, except for a varying intensity due to the volume term. In practice, however, a clear size-dependence is observed [13, 14, 20-23]. To account for these findings, basic Mie theory has evolved to include the fundamental assumption that the dielectric function of the nanoparticle material is size dependent (i.e. the intrinsic size-effect). The need to introduce this size-dependence has been proposed to occur for free-electron metal particles when their size becomes smaller than the electronic mean free path in the bulk metal, approximately 20 nm for gold [13]. Using (1) and the bulk optical properties of gold [1b], the UV-vis spectrum of five differently sized colloidal gold particles suspended in water was calculated. The spectra, normalized to
Sensors & Transducers Journal, Vol.85, Issue 11, November 2007, pp. 1687-1698
1691
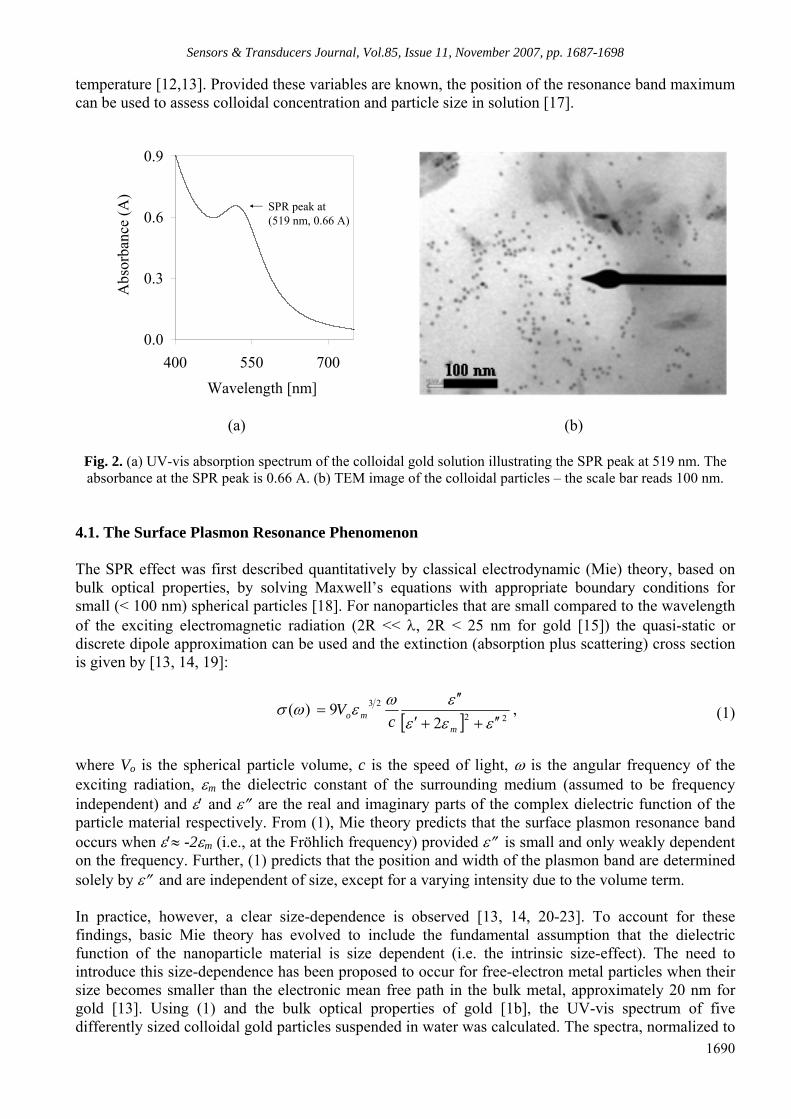
one at the SPR wavelength, are shown in Fig. 3(a). For reasons not fully justified (see [22], p. 162), only the imaginary component of the particle dielectric function was adjusted for size (following the method of Hovel et al. [24]). The result is a 1/R dependence of the plasmon bandwidth on particle size, in agreement with experimental results, and a fixed SPR wavelength. For larger particles, the extinction cross section is also size dependent and is accurately described by the full Mie equation. The size-dependence is a result of changes to the real part of the dielectric component of the particle material. In general, ε′ is an increasing function of frequency; when the particle size is increased the absorption maximum is red-shifted. This is known as the extrinsic size-effect and is used extensively in the sizing of metal particles by optical extinction spectroscopy [22]. Shown in Fig. 3(b) are the normalized extinction cross sections of four differently sized gold nanoparticles suspended in water. The spectra were calculated using the full Mie equation, the numerical code in Bohren & Huffman ([16], Appendix A), and bulk optical properties. Clearly, the plasmon bandwidth increases and the position of the SPR peak red-shifts with increasing particle size. Below 10 nm the spectra were identical, hence the need to introduce the intrinsic size-effect.
0.0
0.3
0.6
0.9
1.2
400 500 600 700 800Wavelength [nm]
Abs
orba
nce
(A)
Radius1, 2, 4, 8, 20 nm
0.0
0.3
0.6
0.9
1.2
400 500 600 700 800Wavelength [nm]
Extin
ctio
nParticle radius10, 30, 40, 50 nm
(a)
(b) Fig. 3. (a) Calculated UV-vis absorption spectra of five different sized colloidal gold particles suspended in water using equation (1). Only the imaginary part of the dielectric function of the particle material was adjusted for size (see Scaffardi et al. 2005). (b) Calculated UV-vis extinction spectra of four different sized colloidal gold particles suspended in water using full Mie theory. Bohren and Huffman [16] also considered the case of small, homogeneous spheres uniformly coated with a mantle of different composition. The effect of the coating was to shift the Fröhlich frequency. The magnitude of the shift was determined to be a function of the real part of the dielectric function of the sphere as well as the kind and amount of coating. For the purpose of this work, it is important to note that the position of the SPR peak is expected to be a function of particle size and single particle properties. 4.2 Experiment The concentration of mercury in the carrier stream was controlled by setting the temperature of the mercury source. Three vapor pressures were considered (a) 0.215 ± 0.035 ppm, (b) 1.6 ± 0.01 ppm, and (c) 81 ± 9 ppm mercury in nitrogen corresponding to a mercury source (water bath) temperature of 0 °C, 20 °C, and 80 °C respectively. The vapor pressures were calculated using data (section 12-131) tabulated in the CRC Handbook of Chemistry and Physics [1] and compared with previously
Sensors & Transducers Journal, Vol.85, Issue 11, November 2007, pp. 1687-1698
1692
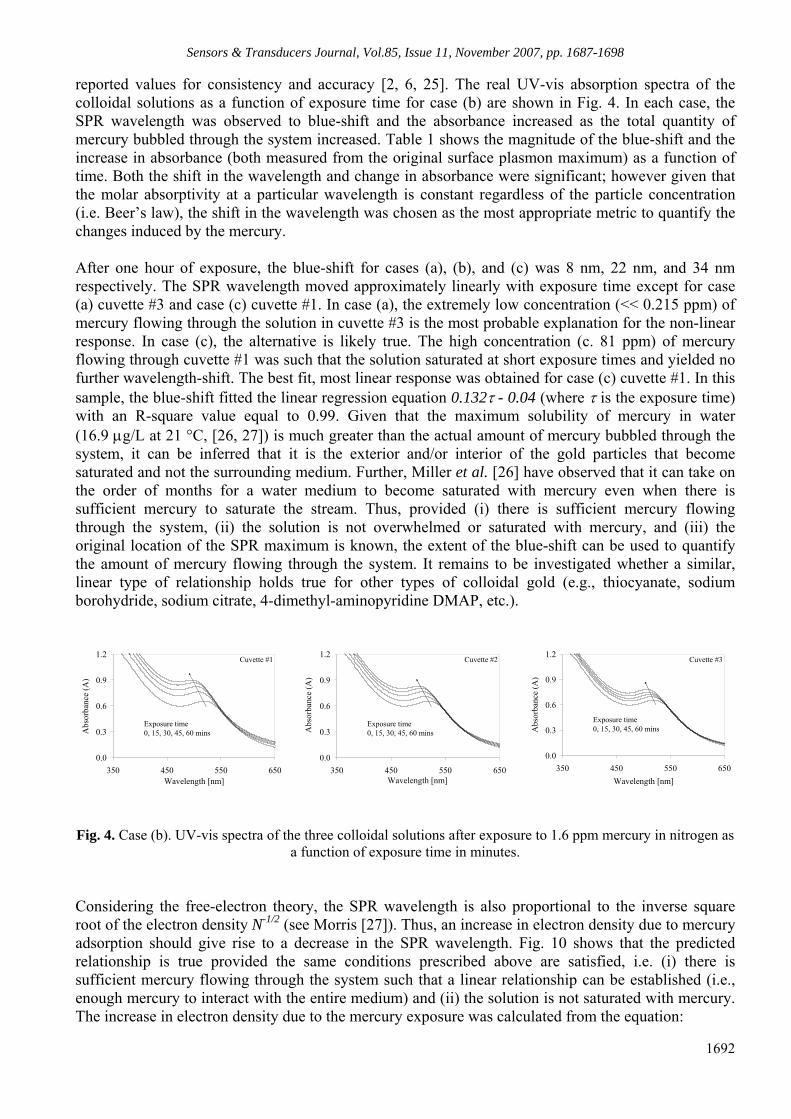
reported values for consistency and accuracy [2, 6, 25]. The real UV-vis absorption spectra of the colloidal solutions as a function of exposure time for case (b) are shown in Fig. 4. In each case, the SPR wavelength was observed to blue-shift and the absorbance increased as the total quantity of mercury bubbled through the system increased. Table 1 shows the magnitude of the blue-shift and the increase in absorbance (both measured from the original surface plasmon maximum) as a function of time. Both the shift in the wavelength and change in absorbance were significant; however given that the molar absorptivity at a particular wavelength is constant regardless of the particle concentration (i.e. Beer’s law), the shift in the wavelength was chosen as the most appropriate metric to quantify the changes induced by the mercury. After one hour of exposure, the blue-shift for cases (a), (b), and (c) was 8 nm, 22 nm, and 34 nm respectively. The SPR wavelength moved approximately linearly with exposure time except for case (a) cuvette #3 and case (c) cuvette #1. In case (a), the extremely low concentration (<< 0.215 ppm) of mercury flowing through the solution in cuvette #3 is the most probable explanation for the non-linear response. In case (c), the alternative is likely true. The high concentration (c. 81 ppm) of mercury flowing through cuvette #1 was such that the solution saturated at short exposure times and yielded no further wavelength-shift. The best fit, most linear response was obtained for case (c) cuvette #1. In this sample, the blue-shift fitted the linear regression equation 0.132τ - 0.04 (where τ is the exposure time) with an R-square value equal to 0.99. Given that the maximum solubility of mercury in water (16.9 µg/L at 21 °C, [26, 27]) is much greater than the actual amount of mercury bubbled through the system, it can be inferred that it is the exterior and/or interior of the gold particles that become saturated and not the surrounding medium. Further, Miller et al. [26] have observed that it can take on the order of months for a water medium to become saturated with mercury even when there is sufficient mercury to saturate the stream. Thus, provided (i) there is sufficient mercury flowing through the system, (ii) the solution is not overwhelmed or saturated with mercury, and (iii) the original location of the SPR maximum is known, the extent of the blue-shift can be used to quantify the amount of mercury flowing through the system. It remains to be investigated whether a similar, linear type of relationship holds true for other types of colloidal gold (e.g., thiocyanate, sodium borohydride, sodium citrate, 4-dimethyl-aminopyridine DMAP, etc.).
0.0
0.3
0.6
0.9
1.2
350 450 550 650Wavelength [nm]
Abs
orba
nce
(A)
Exposure time0, 15, 30, 45, 60 mins
Cuvette #1
0.0
0.3
0.6
0.9
1.2
350 450 550 650Wavelength [nm]
Abs
orba
nce
(A)
Exposure time0, 15, 30, 45, 60 mins
Cuvette #2
0.0
0.3
0.6
0.9
1.2
350 450 550 650Wavelength [nm]
Abs
orba
nce
(A)
Exposure time0, 15, 30, 45, 60 mins
Cuvette #3
Fig. 4. Case (b). UV-vis spectra of the three colloidal solutions after exposure to 1.6 ppm mercury in nitrogen as
a function of exposure time in minutes. Considering the free-electron theory, the SPR wavelength is also proportional to the inverse square root of the electron density N-1/2 (see Morris [27]). Thus, an increase in electron density due to mercury adsorption should give rise to a decrease in the SPR wavelength. Fig. 10 shows that the predicted relationship is true provided the same conditions prescribed above are satisfied, i.e. (i) there is sufficient mercury flowing through the system such that a linear relationship can be established (i.e., enough mercury to interact with the entire medium) and (ii) the solution is not saturated with mercury. The increase in electron density due to the mercury exposure was calculated from the equation:
Sensors & Transducers Journal, Vol.85, Issue 11, November 2007, pp. 1687-1698
1693
Hg
A
MCQNN ⎟
⎠⎞
⎜⎝⎛
×=
υτ)101( 9 , (2)
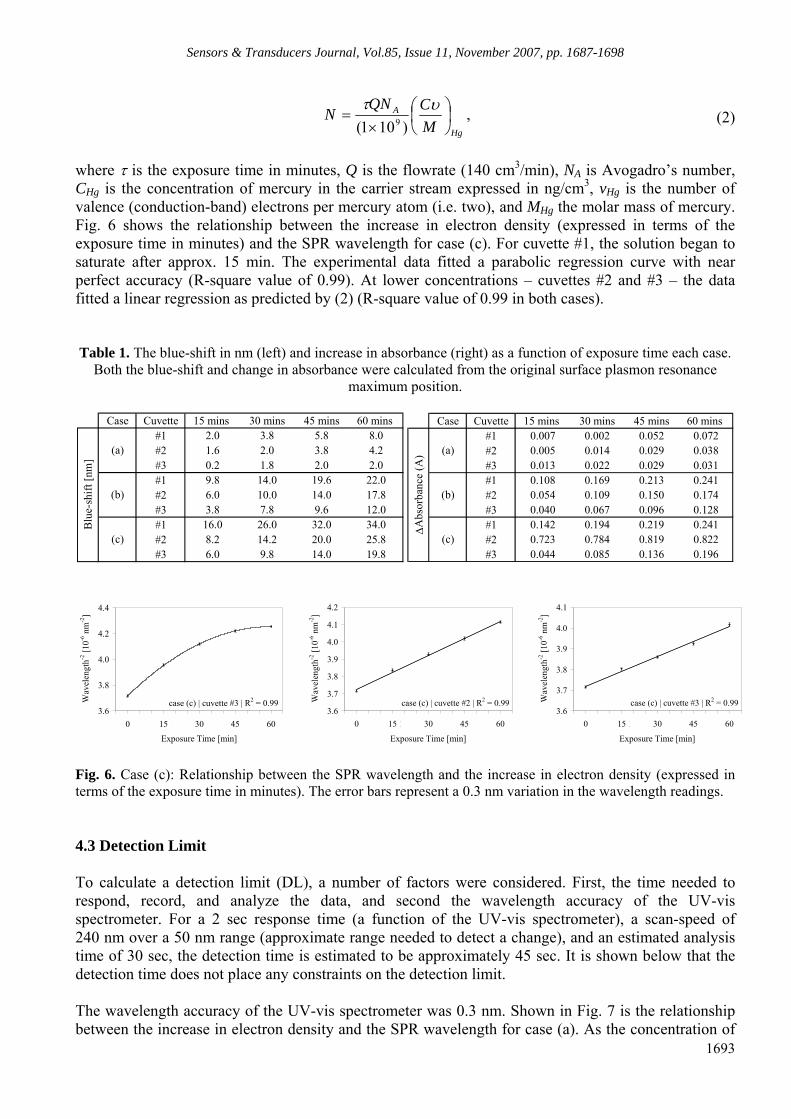
where τ is the exposure time in minutes, Q is the flowrate (140 cm3/min), NA is Avogadro’s number, CHg is the concentration of mercury in the carrier stream expressed in ng/cm3, vHg is the number of valence (conduction-band) electrons per mercury atom (i.e. two), and MHg the molar mass of mercury. Fig. 6 shows the relationship between the increase in electron density (expressed in terms of the exposure time in minutes) and the SPR wavelength for case (c). For cuvette #1, the solution began to saturate after approx. 15 min. The experimental data fitted a parabolic regression curve with near perfect accuracy (R-square value of 0.99). At lower concentrations – cuvettes #2 and #3 – the data fitted a linear regression as predicted by (2) (R-square value of 0.99 in both cases). Table 1. The blue-shift in nm (left) and increase in absorbance (right) as a function of exposure time each case.
Both the blue-shift and change in absorbance were calculated from the original surface plasmon resonance maximum position.
Case Cuvette 15 mins 30 mins 45 mins 60 mins
#1 2.0 3.8 5.8 8.0#2 1.6 2.0 3.8 4.2#3 0.2 1.8 2.0 2.0#1 9.8 14.0 19.6 22.0#2 6.0 10.0 14.0 17.8#3 3.8 7.8 9.6 12.0#1 16.0 26.0 32.0 34.0#2 8.2 14.2 20.0 25.8#3 6.0 9.8 14.0 19.8
Blu
e-sh
ift [n
m]
(a)
(b)
(c)
Case Cuvette 15 mins 30 mins 45 mins 60 mins #1 0.007 0.002 0.052 0.072#2 0.005 0.014 0.029 0.038#3 0.013 0.022 0.029 0.031#1 0.108 0.169 0.213 0.241#2 0.054 0.109 0.150 0.174#3 0.040 0.067 0.096 0.128#1 0.142 0.194 0.219 0.241#2 0.723 0.784 0.819 0.822#3 0.044 0.085 0.136 0.196
∆Abs
orba
nce
(A) (a)
(b)
(c)
case (c) | cuvette #3 | R2 = 0.993.6
3.8
4.0
4.2
4.4
-5 0 5 10 15 20 25 30 35 40 45 50 55 60 65
Exposure Time [min]
Wav
elen
gth-2
[10-6
nm
-2]
case (c) | cuvette #2 | R2 = 0.993.6
3.7
3.8
3.9
4.0
4.1
4.2
-5 0 5 10 15 20 25 30 35 40 45 50 55 60 65
Exposure Time [min]
Wav
elen
gth-2
[10-6
nm
-2]
case (c) | cuvette #3 | R2 = 0.993.6
3.7
3.8
3.9
4.0
4.1
-5 0 5 10 15 20 25 30 35 40 45 50 55 60 65
Exposure Time [min]
Wav
elen
gth-2
[10-6
nm
-2]
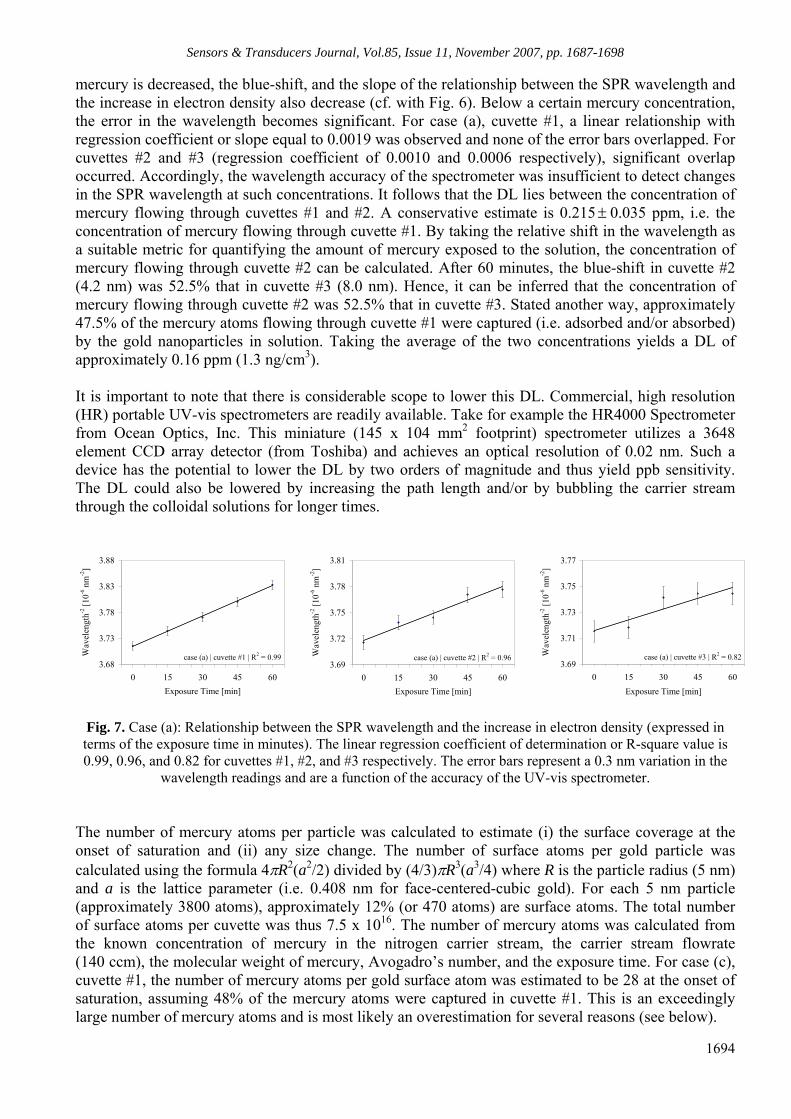
Fig. 6. Case (c): Relationship between the SPR wavelength and the increase in electron density (expressed in terms of the exposure time in minutes). The error bars represent a 0.3 nm variation in the wavelength readings. 4.3 Detection Limit To calculate a detection limit (DL), a number of factors were considered. First, the time needed to respond, record, and analyze the data, and second the wavelength accuracy of the UV-vis spectrometer. For a 2 sec response time (a function of the UV-vis spectrometer), a scan-speed of 240 nm over a 50 nm range (approximate range needed to detect a change), and an estimated analysis time of 30 sec, the detection time is estimated to be approximately 45 sec. It is shown below that the detection time does not place any constraints on the detection limit. The wavelength accuracy of the UV-vis spectrometer was 0.3 nm. Shown in Fig. 7 is the relationship between the increase in electron density and the SPR wavelength for case (a). As the concentration of
Sensors & Transducers Journal, Vol.85, Issue 11, November 2007, pp. 1687-1698
1694
mercury is decreased, the blue-shift, and the slope of the relationship between the SPR wavelength and the increase in electron density also decrease (cf. with Fig. 6). Below a certain mercury concentration, the error in the wavelength becomes significant. For case (a), cuvette #1, a linear relationship with regression coefficient or slope equal to 0.0019 was observed and none of the error bars overlapped. For cuvettes #2 and #3 (regression coefficient of 0.0010 and 0.0006 respectively), significant overlap occurred. Accordingly, the wavelength accuracy of the spectrometer was insufficient to detect changes in the SPR wavelength at such concentrations. It follows that the DL lies between the concentration of mercury flowing through cuvettes #1 and #2. A conservative estimate is 0.215 ± 0.035 ppm, i.e. the concentration of mercury flowing through cuvette #1. By taking the relative shift in the wavelength as a suitable metric for quantifying the amount of mercury exposed to the solution, the concentration of mercury flowing through cuvette #2 can be calculated. After 60 minutes, the blue-shift in cuvette #2 (4.2 nm) was 52.5% that in cuvette #3 (8.0 nm). Hence, it can be inferred that the concentration of mercury flowing through cuvette #2 was 52.5% that in cuvette #3. Stated another way, approximately 47.5% of the mercury atoms flowing through cuvette #1 were captured (i.e. adsorbed and/or absorbed) by the gold nanoparticles in solution. Taking the average of the two concentrations yields a DL of approximately 0.16 ppm (1.3 ng/cm3). It is important to note that there is considerable scope to lower this DL. Commercial, high resolution (HR) portable UV-vis spectrometers are readily available. Take for example the HR4000 Spectrometer from Ocean Optics, Inc. This miniature (145 x 104 mm2 footprint) spectrometer utilizes a 3648 element CCD array detector (from Toshiba) and achieves an optical resolution of 0.02 nm. Such a device has the potential to lower the DL by two orders of magnitude and thus yield ppb sensitivity. The DL could also be lowered by increasing the path length and/or by bubbling the carrier stream through the colloidal solutions for longer times.
case (a) | cuvette #1 | R2 = 0.993.68
3.73
3.78
3.83
3.88
-5 0 5 10 15 20 25 30 35 40 45 50 55 60 65Exposure Time [min]
Wav
elen
gth-2
[10-6
nm
-2]
case (a) | cuvette #2 | R2 = 0.963.69
3.72
3.75
3.78
3.81
-5 0 5 10 15 20 25 30 35 40 45 50 55 60 65Exposure Time [min]
Wav
elen
gth-2
[10-6
nm
-2]
case (a) | cuvette #3 | R2 = 0.823.69
3.71
3.73
3.75
3.77
-5 0 5 10 15 20 25 30 35 40 45 50 55 60 65Exposure Time [min]
Wav
elen
gth-2
[10-6
nm
-2]
Fig. 7. Case (a): Relationship between the SPR wavelength and the increase in electron density (expressed in terms of the exposure time in minutes). The linear regression coefficient of determination or R-square value is 0.99, 0.96, and 0.82 for cuvettes #1, #2, and #3 respectively. The error bars represent a 0.3 nm variation in the
wavelength readings and are a function of the accuracy of the UV-vis spectrometer. The number of mercury atoms per particle was calculated to estimate (i) the surface coverage at the onset of saturation and (ii) any size change. The number of surface atoms per gold particle was calculated using the formula 4πR2(a2/2) divided by (4/3)πR3(a3/4) where R is the particle radius (5 nm) and a is the lattice parameter (i.e. 0.408 nm for face-centered-cubic gold). For each 5 nm particle (approximately 3800 atoms), approximately 12% (or 470 atoms) are surface atoms. The total number of surface atoms per cuvette was thus 7.5 x 10¹⁶. The number of mercury atoms was calculated from the known concentration of mercury in the nitrogen carrier stream, the carrier stream flowrate (140 ccm), the molecular weight of mercury, Avogadro’s number, and the exposure time. For case (c), cuvette #1, the number of mercury atoms per gold surface atom was estimated to be 28 at the onset of saturation, assuming 48% of the mercury atoms were captured in cuvette #1. This is an exceedingly large number of mercury atoms and is most likely an overestimation for several reasons (see below).
Sensors & Transducers Journal, Vol.85, Issue 11, November 2007, pp. 1687-1698
1695
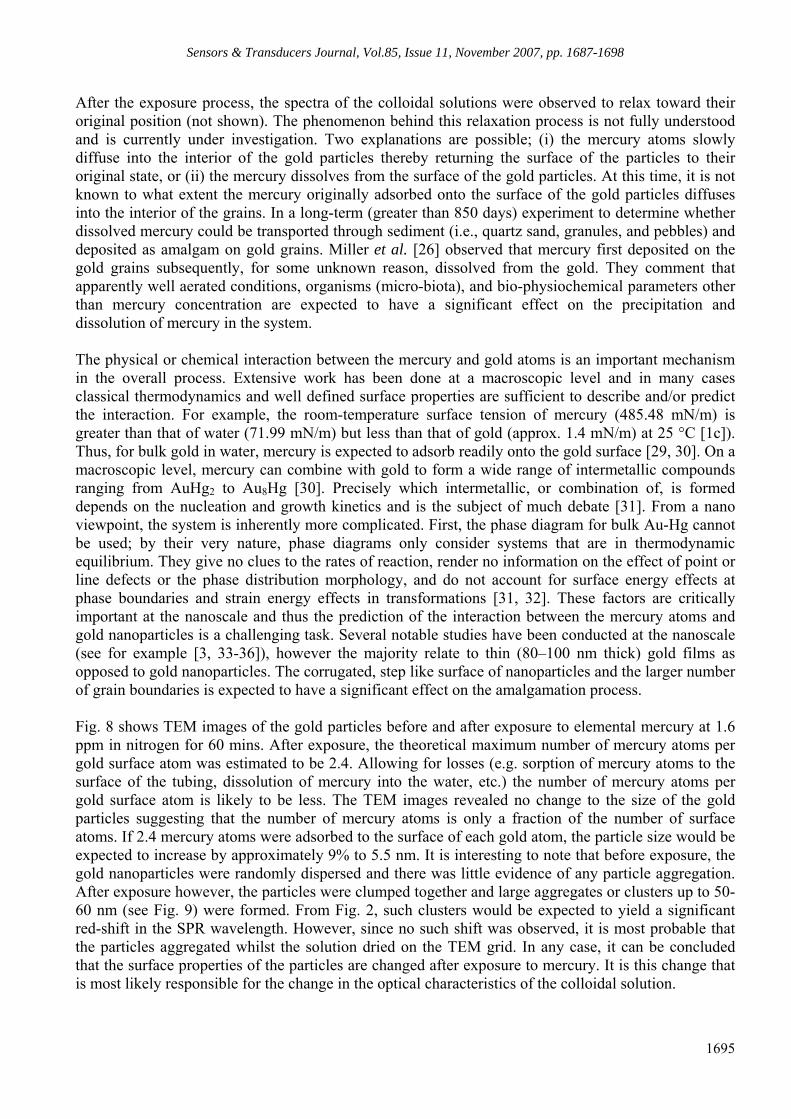
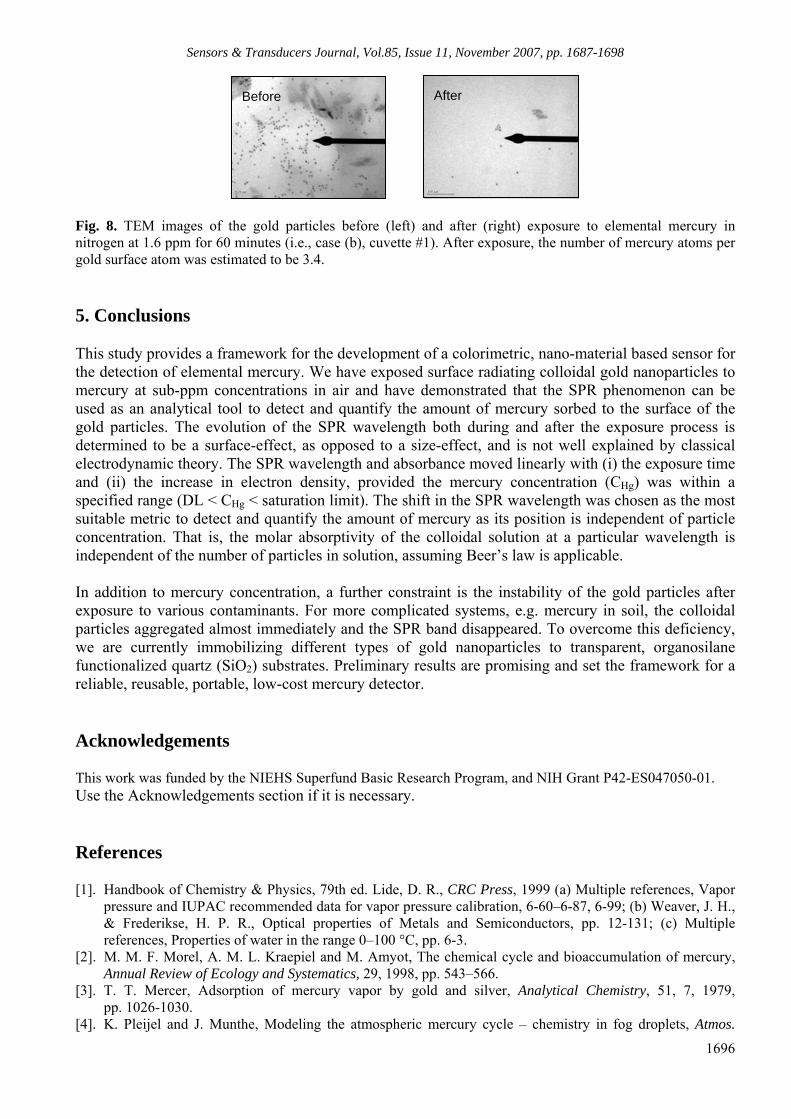
After the exposure process, the spectra of the colloidal solutions were observed to relax toward their original position (not shown). The phenomenon behind this relaxation process is not fully understood and is currently under investigation. Two explanations are possible; (i) the mercury atoms slowly diffuse into the interior of the gold particles thereby returning the surface of the particles to their original state, or (ii) the mercury dissolves from the surface of the gold particles. At this time, it is not known to what extent the mercury originally adsorbed onto the surface of the gold particles diffuses into the interior of the grains. In a long-term (greater than 850 days) experiment to determine whether dissolved mercury could be transported through sediment (i.e., quartz sand, granules, and pebbles) and deposited as amalgam on gold grains. Miller et al. [26] observed that mercury first deposited on the gold grains subsequently, for some unknown reason, dissolved from the gold. They comment that apparently well aerated conditions, organisms (micro-biota), and bio-physiochemical parameters other than mercury concentration are expected to have a significant effect on the precipitation and dissolution of mercury in the system. The physical or chemical interaction between the mercury and gold atoms is an important mechanism in the overall process. Extensive work has been done at a macroscopic level and in many cases classical thermodynamics and well defined surface properties are sufficient to describe and/or predict the interaction. For example, the room-temperature surface tension of mercury (485.48 mN/m) is greater than that of water (71.99 mN/m) but less than that of gold (approx. 1.4 mN/m) at 25 °C [1c]). Thus, for bulk gold in water, mercury is expected to adsorb readily onto the gold surface [29, 30]. On a macroscopic level, mercury can combine with gold to form a wide range of intermetallic compounds ranging from AuHg2 to Au8Hg [30]. Precisely which intermetallic, or combination of, is formed depends on the nucleation and growth kinetics and is the subject of much debate [31]. From a nano viewpoint, the system is inherently more complicated. First, the phase diagram for bulk Au-Hg cannot be used; by their very nature, phase diagrams only consider systems that are in thermodynamic equilibrium. They give no clues to the rates of reaction, render no information on the effect of point or line defects or the phase distribution morphology, and do not account for surface energy effects at phase boundaries and strain energy effects in transformations [31, 32]. These factors are critically important at the nanoscale and thus the prediction of the interaction between the mercury atoms and gold nanoparticles is a challenging task. Several notable studies have been conducted at the nanoscale (see for example [3, 33-36]), however the majority relate to thin (80–100 nm thick) gold films as opposed to gold nanoparticles. The corrugated, step like surface of nanoparticles and the larger number of grain boundaries is expected to have a significant effect on the amalgamation process. Fig. 8 shows TEM images of the gold particles before and after exposure to elemental mercury at 1.6 ppm in nitrogen for 60 mins. After exposure, the theoretical maximum number of mercury atoms per gold surface atom was estimated to be 2.4. Allowing for losses (e.g. sorption of mercury atoms to the surface of the tubing, dissolution of mercury into the water, etc.) the number of mercury atoms per gold surface atom is likely to be less. The TEM images revealed no change to the size of the gold particles suggesting that the number of mercury atoms is only a fraction of the number of surface atoms. If 2.4 mercury atoms were adsorbed to the surface of each gold atom, the particle size would be expected to increase by approximately 9% to 5.5 nm. It is interesting to note that before exposure, the gold nanoparticles were randomly dispersed and there was little evidence of any particle aggregation. After exposure however, the particles were clumped together and large aggregates or clusters up to 50-60 nm (see Fig. 9) were formed. From Fig. 2, such clusters would be expected to yield a significant red-shift in the SPR wavelength. However, since no such shift was observed, it is most probable that the particles aggregated whilst the solution dried on the TEM grid. In any case, it can be concluded that the surface properties of the particles are changed after exposure to mercury. It is this change that is most likely responsible for the change in the optical characteristics of the colloidal solution.
Sensors & Transducers Journal, Vol.85, Issue 11, November 2007, pp. 1687-1698
1696
Fig. 8. TEM images of the gold particles before (left) and after (right) exposure to elemental mercury in nitrogen at 1.6 ppm for 60 minutes (i.e., case (b), cuvette #1). After exposure, the number of mercury atoms per gold surface atom was estimated to be 3.4. 5. Conclusions This study provides a framework for the development of a colorimetric, nano-material based sensor for the detection of elemental mercury. We have exposed surface radiating colloidal gold nanoparticles to mercury at sub-ppm concentrations in air and have demonstrated that the SPR phenomenon can be used as an analytical tool to detect and quantify the amount of mercury sorbed to the surface of the gold particles. The evolution of the SPR wavelength both during and after the exposure process is determined to be a surface-effect, as opposed to a size-effect, and is not well explained by classical electrodynamic theory. The SPR wavelength and absorbance moved linearly with (i) the exposure time and (ii) the increase in electron density, provided the mercury concentration (CHg) was within a specified range (DL < CHg < saturation limit). The shift in the SPR wavelength was chosen as the most suitable metric to detect and quantify the amount of mercury as its position is independent of particle concentration. That is, the molar absorptivity of the colloidal solution at a particular wavelength is independent of the number of particles in solution, assuming Beer’s law is applicable. In addition to mercury concentration, a further constraint is the instability of the gold particles after exposure to various contaminants. For more complicated systems, e.g. mercury in soil, the colloidal particles aggregated almost immediately and the SPR band disappeared. To overcome this deficiency, we are currently immobilizing different types of gold nanoparticles to transparent, organosilane functionalized quartz (SiO2) substrates. Preliminary results are promising and set the framework for a reliable, reusable, portable, low-cost mercury detector. Acknowledgements This work was funded by the NIEHS Superfund Basic Research Program, and NIH Grant P42-ES047050-01. Use the Acknowledgements section if it is necessary. References [1]. Handbook of Chemistry & Physics, 79th ed. Lide, D. R., CRC Press, 1999 (a) Multiple references, Vapor
pressure and IUPAC recommended data for vapor pressure calibration, 6-60–6-87, 6-99; (b) Weaver, J. H., & Frederikse, H. P. R., Optical properties of Metals and Semiconductors, pp. 12-131; (c) Multiple references, Properties of water in the range 0–100 °C, pp. 6-3.
[2]. M. M. F. Morel, A. M. L. Kraepiel and M. Amyot, The chemical cycle and bioaccumulation of mercury, Annual Review of Ecology and Systematics, 29, 1998, pp. 543–566.
[3]. T. T. Mercer, Adsorption of mercury vapor by gold and silver, Analytical Chemistry, 51, 7, 1979, pp. 1026-1030.
[4]. K. Pleijel and J. Munthe, Modeling the atmospheric mercury cycle – chemistry in fog droplets, Atmos.
After
Before
Sensors & Transducers Journal, Vol.85, Issue 11, November 2007, pp. 1687-1698
1697
Environ., 29, 1995, pp. 1441-1457. [5]. Siegneur, C., Wrobel, J., and Constantinou, E., A chemical kinetic mechanism for atmospheric inorganic
mercury, Environmental Science Technology, 28, 1994, pp. 1589-1597. [6]. Loux, N. T., Diel temperature effects on the exchange of elemental mercury between the atmosphere and
underlying waters, Environmental Toxicology and Chemistry, 19, 1999, pp. 1191–1198. [7]. Gilmour, C. C. and Henry, E. A., Mercury methylation in aquatic systems affected by acid deposition,
Environmental Pollution, 71, 2-4, 1991, p. 131. [8]. Carpi, A., Mercury from combustion sources: a review of the chemical species emitted and their transport
in the environment, Water, Air, and Soil Pollution, 98, 1997, pp. 241–254. [9]. EPA, 2005, United States Environmental Protection Agency, US EPA, Clean air mercury rule, introduced
March 15th, 2005. http://epa.gov/air/mercuryrule/, November 2006. [10]. Kim, Y., Johnson, R. C. and Hupp, J. T., Gold nanoparticle-based sensing of “spectroscopically silent”
heavy metal ions, NanoLetters, 1, 4, 2001, pp. 165-167. [11]. Mirsky, V. M., New electroanalytical applications of self-assembled monolayers, Trends in Analytical
Chemistry, 21, 6, 7, 2002, p. 439. [12]. Liz-Marzan, L. M., Nanomaterials: formation and color, Materials Today, Elsevier Ltd,. 2004. [13]. Alvarez, M. M., Khoury, J. T., Schaaff, T. G., Shafigullin, M. N., Vezmar, I., and Whetten, R. L., Optical
absorption spectra of nanocrystal gold molecules, Journal of Physical Chemistry B, 101, 1997, pp. 3706-3712.
[14]. Link, S. and El-Sayed, M. A., Size and temperature dependence of the plasmon asborption of colloidal gold nanoparticles, Journal of Physical Chemistry B, 103, 1999, pp. 4212-4217.
[15]. Kreibig, U. and Vollmer, M., Optical Properties of Metal Clusters, Springer, Berlin, 1995. [16]. Bohren, C. F. and Huffman, D. R., 1983, Adsorption and Scattering of Light by Small Particles, John Wiley
and Sons, New York. [17]. Willner, I., Katz, E., and Shipway, A., Nanoparticle arrays of surfaces for electronic, optical, and sensor
applications, ChemPhysChem., 1, 2000, pp. 18-52. [18]. Mie, G., Beitrage zur optik truber medien, speziell kolliodaler metallösungen, Leipzig, Ann. Phys., 25, 4,
1908, pp. 377–445. [19]. Moriarty, P. Nanostructured materials, Institute of Physics Publishing, Reports on Progress in Physics, 64,
2001, pp. 297-381, PII: S0034-4885(01)04041-6. [20]. Jain, P. K., Seok Lee, K., El-Sayed, I. H., and El-Sayed, M. A., Calculated absorption and scattering
properties of gold nanoparticles of different size, shape, and composition: applications in biological imaging and biomedicine, Journal of Physical Chemistry B, 110, 2006, pp. 7238-7248.
[21]. Muskens, O., Christofilos, D., Del Fatti, N., and Vallee, F., Optical response of a single noble metal nanoparticle, Journal of Optics A: Pure and Applied Optics., 8, 2006, pp. S264-S272.
[22]. Scaffardi, L. B., Pellegri, N., de Sanctis, O., and Tocho, J. O., Sizing gold nanoparticles by extinction spectroscopy, Nanotechnology, 16, 2005, pp. 158-163.
[23]. Henglein, A., Physicochemical properties of small metal particles in solution: “microelectrode” reactions, chemisorption, composite metal particles, and atom-to-metal transition, Journal of Physical Chemistry, 97, 1993, pp. 5457-5471.
[24]. Hovel, H., Fritz, S., Hilger, A., and Kreibig, U., Width of cluster plasmon resonances: bulk dielectric functions and chemical interface damping, Physical Review B, 48, 24, 1993, p. 18179.
[25]. Poindexter, Mercury vapor pressure at low temperatures, Physics Review, 26, 1925, p. 859. [26]. Miller, J. W., Callahan, J. E., and Craig, J. R., Mercury interactions in a simulated gold placer, Applied
Geochemistry, 17, 2002, pp. 21-28. [27]. Morris, T., Novel spectroscopic methods to monitor mercury adsorption to gold and silver surfaces, Ph. D.
Research Seminar, Department of Chemistry, University of Alabama, January 28th, 2003. [28]. Sanemasa, I., The solubility of elemental mercury vapor in water, Bulletin of the Chemical Society of
Japan, 48, 1975, pp. 1795–1798. [29]. Lee, J., Nakamoto, M., and Tanaka, T., Thermodynamic study on the melting of nanometer-sized gold
particles on graphite substrate, Proceeding of the IV International conference/High Temperature Capillarity, Journal of Materials Science, 40, 2005, pp. 2167-2171.
[30]. Veiga, M. and Baker, R., Global Mercury Project, Project EG/GLO/01/G34; Removal of barriers to introduction of cleaner artisanal gold mining and extraction technologies: protocols for environmental and health assessment or mercury released by artisanal and small-scale gold miners, UNIDO, Vienna, 2004.
[31]. Intermetallic Compounds, Intermetallic Compounds: Principles and Practice, v. 1, Editors: Westbrook, J. H. and Fleischer, R. L., Wiley, New York, 1995.
Sensors & Transducers Journal, Vol.85, Issue 11, November 2007, pp. 1687-1698
1698
[32]. Prince, A., Alloy Phase Equilibria, Elsevier, New York, 1966. [33]. Himmelhaus, M., Buck, M., and Grunze, M., Mercury induced reorientation of alkanethiolates adsorbed on
gold, Applied Physics B, 68, 1999, pp. 595-598. [34]. Levlin, M. Ikavalko, E., and Laitinen, T., Adsorption of mercury on gold and silver surfaces, Fresenius
Journal of Analytical Chemistry, 365, 1999, pp. 577-586. [35]. Nowakowski, R., Kobiela, T., Wolfram, Z., and Dus, R., Atomic force microscopy of Au/Hg alloy
formation on thin Au films, Applied Surface Science, 115, 1997, pp. 217-231. [36]. Battistoni, C. Bemporad, E., Galdikas, A., Kaciulis, S., Mattogno, G., Mickevicius, S., and Olevano, V.,
Interaction of mercury vapor with thin flims of gold, Applied Surface Science, 103, 1996, pp. 107-111.
___________________
2007 Copyright ©, International Frequency Sensor Association (IFSA). All rights reserved. (http://www.sensorsportal.com)
SSeennssoorrss && TTrraannssdduucceerrss JJoouurrnnaall
GGuuiiddee ffoorr CCoonnttrriibbuuttoorrss
Aims and Scope Sensors & Transducers Journal (ISSN 1726- 5479) provides an advanced forum for the science and technology of physical, chemical sensors and biosensors. It publishes state-of-the-art reviews, regular research and application specific papers, short notes, letters to Editor and sensors related books reviews as well as academic, practical and commercial information of interest to its readership. Because it is an open access, peer review international journal, papers rapidly published in Sensors & Transducers Journal will receive a very high publicity. The journal is published monthly as twelve issues per annual by International Frequency Association (IFSA). In additional, some special sponsored and conference issues published annually. Topics Covered Contributions are invited on all aspects of research, development and application of the science and technology of sensors, transducers and sensor instrumentations. Topics include, but are not restricted to: • Physical, chemical and biosensors; • Digital, frequency, period, duty-cycle, time interval, PWM, pulse number output sensors and transducers; • Theory, principles, effects, design, standardization and modeling; • Smart sensors and systems; • Sensor instrumentation; • Virtual instruments; • Sensors interfaces, buses and networks; • Signal processing; • Frequency (period, duty-cycle)-to-digital converters, ADC; • Technologies and materials; • Nanosensors; • Microsystems; • Applications. Submission of papers Articles should be written in English. Authors are invited to submit by e-mail [email protected] 6-14 pages article (including abstract, illustrations (color or grayscale), photos and references) in both: MS Word (doc) and Acrobat (pdf) formats. Detailed preparation instructions, paper example and template of manuscript are available from the journal’s webpage: http://www.sensorsportal.com/HTML/DIGEST/Submition.htm Authors must follow the instructions strictly when submitting their manuscripts. Advertising Information Advertising orders and enquires may be sent to [email protected] Please download also our media kit: http://www.sensorsportal.com/DOWNLOADS/Media_Kit_2007.PDF