Embed Size (px)
Citation preview
1
Sentiment Analysis for Hotel Reviews
Vikram Elango and Govindrajan Narayanan [vikrame, govindra]@stanford.edu
Abstract
We consider the problem of classifying a hotel review as a positive or negative and thereby analyzing the sentiment of a customer. Using Hotel review data from Trip Advisor, we find that standard Machine Learning techniques can definitely outperform human-produced sentiment analysis baselines. We will explore wide range of probabilistic models including Naive Bayes (NB), Support vector machine (SVM), Laplace smoothing and Semantic orientation (SO) to classify a review. To extract the frequent words from the reviews we have used Term Frequency (TF) and Inverse Document Frequency (IDF) approach. We conclude by comparing accuracy of different strategic models and discuss about scope for future work. 1. Introduction Travel planning and hotel booking on website has become one of an important commercial use. Sharing on web has become a major tool in expressing customer thoughts about a particular product or Service.
Recent years have seen rapid growth in on-line discussion groups and review sites (e.g.www.tripadvisor.com) where a crucial characteristic of a customer’s review is their sentiment or overall opinion — for example if the review contains words like ‘great’, ‘best’, ‘nice’, ‘good’, ‘awesome’ is probably a positive comment. Whereas if reviews contains words like ‘bad’, ‘poor’, ‘awful’, ‘worse’ is probably a negative review.
However, Trip Advisor’s star rating does not express the exact experience of the customer. Most of the ratings are meaningless, large chunk of reviews fall in the range of 3.5 to 4.5 and very few reviews below or above. We seek to turn words and reviews into quantitative measurements. We extend this model with a supervised sentiment component that is capable of classifying a review as positive or negative with accuracy (Section 4). We also determine the polarity of the review that evaluates the review as recommended or not recommended using semantic orientation. A phrase has a positive semantic orientation when it has good associations (e.g., “excellent, awesome”) and a negative semantic orientation when it has bad associations (e.g., “terrific, bad”). Next step is to assign the given review to a class, positive or negative, based on the average semantic orientation of the phrases extracted from the review. If the average is positive, the prediction is that the review posted is positive. Otherwise, the prediction is that the item is negative.
2. Related Work The model we present in the next section draws inspiration from prior work on both semantic orientation and Unsupervised Classification of Reviews. Semantic orientation may also be used to classify reviews (e.g.: In our case, hotel reviews) as positive or negative [2][Turney 2002]. It is possible to classify a review based on the average semantic orientation of phrases in the review that contain adjectives and
2
adverbs. We expect that there will be value in combining semantic orientation [2] [Turney 2002] with more traditional text classification methods for review classification [Pang et al. 2002].
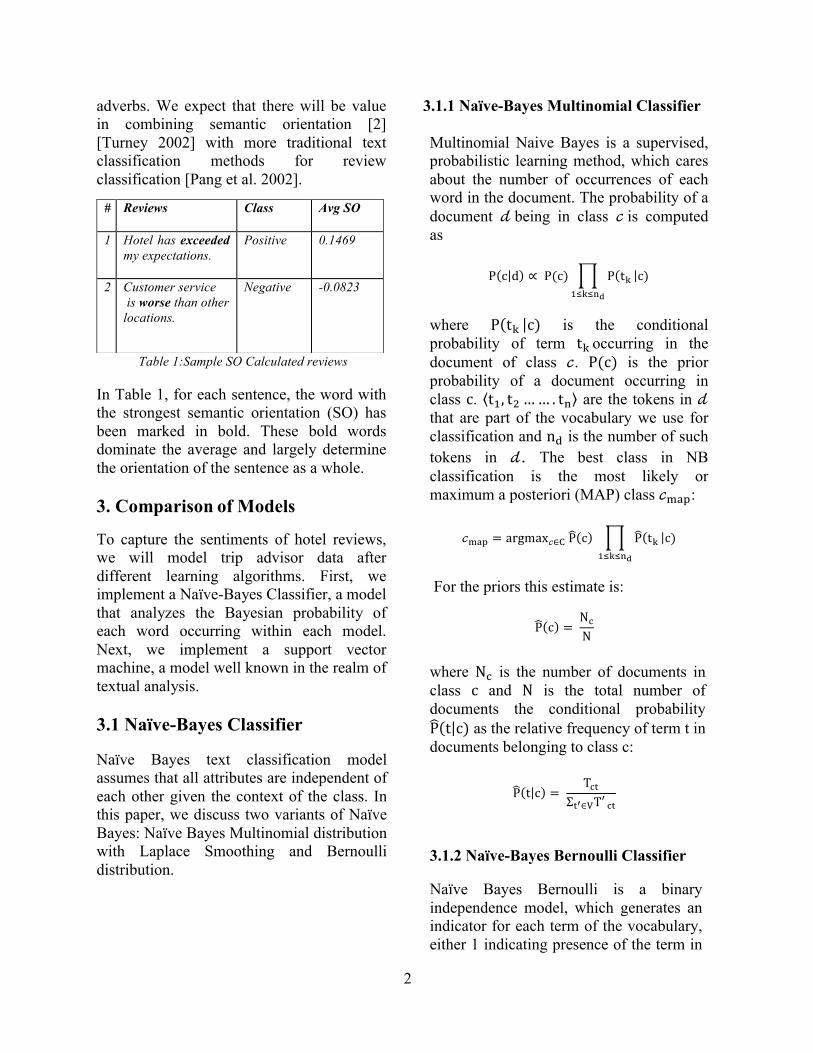
Table 1:Sample SO Calculated reviews
In Table 1, for each sentence, the word with the strongest semantic orientation (SO) has been marked in bold. These bold words dominate the average and largely determine the orientation of the sentence as a whole. 3. Comparison of Models To capture the sentiments of hotel reviews, we will model trip advisor data after different learning algorithms. First, we implement a Naïve-Bayes Classifier, a model that analyzes the Bayesian probability of each word occurring within each model. Next, we implement a support vector machine, a model well known in the realm of textual analysis. 3.1 Naïve-Bayes Classifier Naïve Bayes text classification model assumes that all attributes are independent of each other given the context of the class. In this paper, we discuss two variants of Naïve Bayes: Naïve Bayes Multinomial distribution with Laplace Smoothing and Bernoulli distribution.
3.1.1 Naïve-Bayes Multinomial Classifier Multinomial Naive Bayes is a supervised, probabilistic learning method, which cares about the number of occurrences of each word in the document. The probability of a document 𝒹 being in class 𝒸 is computed as
P c d ∝ P(c) P t! c)!!!!!!
where P t! c) is the conditional probability of term t! occurring in the document of class 𝒸. P(c) is the prior probability of a document occurring in class c. t!, t!…… . t! are the tokens in 𝒹 that are part of the vocabulary we use for classification and n! is the number of such tokens in 𝒹. The best class in NB classification is the most likely or maximum a posteriori (MAP) class 𝒸!"#:
𝒸!"# = argmax𝒸∈! P c P t! c)!!!!!!
For the priors this estimate is:
P c = N!N
where N! is the number of documents in class c and N is the total number of documents the conditional probability P t c) as the relative frequency of term t in documents belonging to class c:
P t c = T!"
Σ!!∈!T′ !"
3.1.2 Naïve-Bayes Bernoulli Classifier
Naïve Bayes Bernoulli is a binary independence model, which generates an indicator for each term of the vocabulary, either 1 indicating presence of the term in
# Reviews
Class Avg SO
1 Hotel has exceeded my expectations.
Positive 0.1469
2 Customer service is worse than other locations.
Negative -0.0823
3
the document or 0 indicating absence. Bernoulli model uses binary occurrence information, ignoring the number of occurrences whereas the multinomial model keeps track of multiple occurrences. It specifies that a review is represented by a vector of binary attributes (i.e. x!… x!… x! indicating which words
appear in the review or not.
𝑝 𝑥 𝑐) = 𝑝 𝑡! 𝑐)!! . (1 − 𝑝 𝑡! 𝑐))(!!!!)!
!!!
This model estimates P t c as the fraction of documents of class c that contain term t. In contrast, the multinomial model (Section 3.2) estimates P t c) as the fraction of tokens or fraction of positions in documents of class 𝒸 that contain term t.
3.2 SVM
Next, we implement a support vector machine (SVM) that uses a linear kernel. There is considerable belief that support vector machines provide one of the best models for predicting textual information. For instance, SVM’s provide strong responses to high-dimensional input spaces, which is the case with text analysis. Also, SVM’s deals well with the fact that document vectors are sparse. 3.3 Semantic Orientation
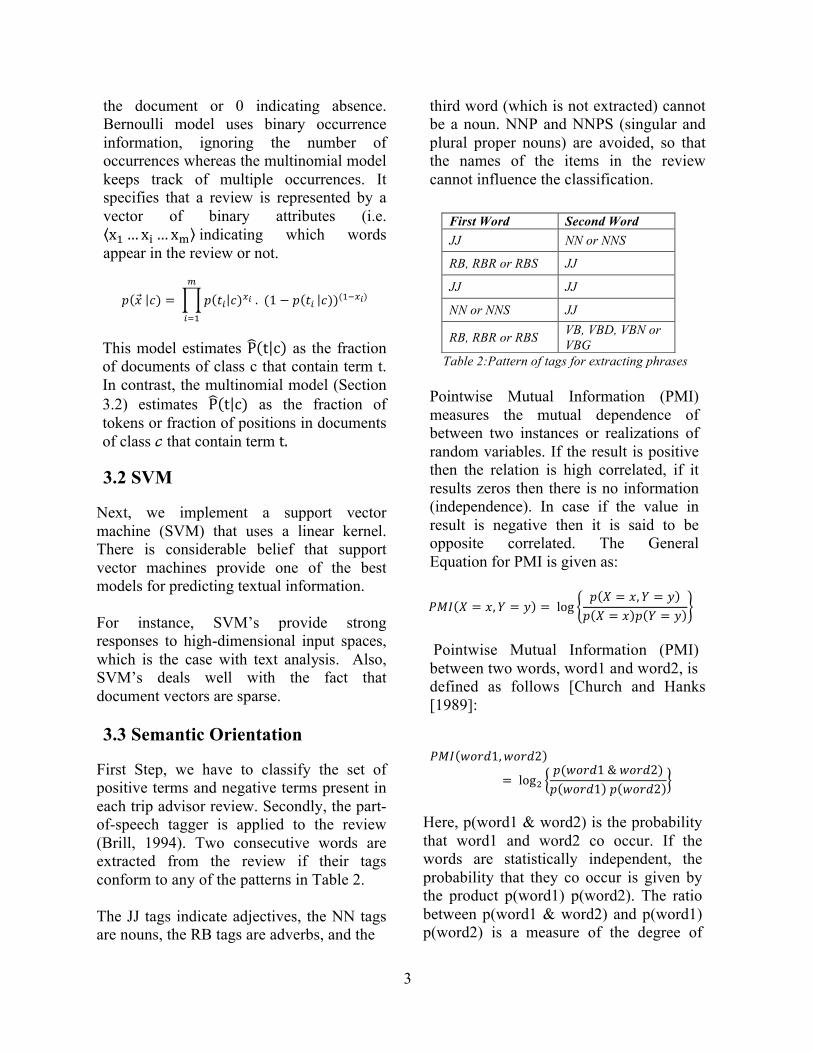
First Step, we have to classify the set of positive terms and negative terms present in each trip advisor review. Secondly, the part- of-speech tagger is applied to the review (Brill, 1994). Two consecutive words are extracted from the review if their tags conform to any of the patterns in Table 2. The JJ tags indicate adjectives, the NN tags are nouns, the RB tags are adverbs, and the
third word (which is not extracted) cannot be a noun. NNP and NNPS (singular and plural proper nouns) are avoided, so that the names of the items in the review cannot influence the classification.
Table 2:Pattern of tags for extracting phrases Pointwise Mutual Information (PMI) measures the mutual dependence of between two instances or realizations of random variables. If the result is positive then the relation is high correlated, if it results zeros then there is no information (independence). In case if the value in result is negative then it is said to be opposite correlated. The General Equation for PMI is given as:
𝑃𝑀𝐼 𝑋 = 𝑥,𝑌 = 𝑦 = log
𝑝 𝑋 = 𝑥,𝑌 = 𝑦𝑝 𝑋 = 𝑥 𝑝 𝑌 = 𝑦
Pointwise Mutual Information (PMI) between two words, word1 and word2, is defined as follows [Church and Hanks [1989]:
𝑃𝑀𝐼 𝑤𝑜𝑟𝑑1,𝑤𝑜𝑟𝑑2
= log!𝑝(𝑤𝑜𝑟𝑑1 & 𝑤𝑜𝑟𝑑2)𝑝 𝑤𝑜𝑟𝑑1 𝑝 𝑤𝑜𝑟𝑑2
Here, p(word1 & word2) is the probability that word1 and word2 co occur. If the words are statistically independent, the probability that they co occur is given by the product p(word1) p(word2). The ratio between p(word1 & word2) and p(word1) p(word2) is a measure of the degree of
First Word Second Word JJ NN or NNS
RB, RBR or RBS JJ
JJ JJ
NN or NNS JJ
RB, RBR or RBS VB, VBD, VBN or VBG
4
statistical dependence between the words. The log of the ratio corresponds to a form of correlation, which is positive when the words tend to co-occur and negative when the presence of one word makes it likely that the other word is absent. Semantic Orientation (SO) of a phrase, phrase, is calculated here as follows:
𝑆𝑂 − 𝑃𝑀𝐼 !"#$ = 𝑃𝑀𝐼 𝑤𝑜𝑟𝑑, 𝑝𝑤𝑜𝑟𝑑!"#$% ! !"#$%&
− 𝑃𝑀𝐼 𝑤𝑜𝑟𝑑, 𝑛𝑤𝑜𝑟𝑑!"#$% ! !"#$%&
The reference words “pword” and “nword” were chosen because, in the review rating system, it is common to define one star as “negative” and five stars as “positive ” review. SO is positive when word phrase is more strongly associated with pword and negative when word phrase is more strongly associated with negative.
3.4 Extracting Frequent Words
Frequent words are extracted from reviews using tf!,! (Term Frequency), idf! (Inverse Document Frequency), which denotes how important a word is to a document.
tf_idf!,! = tf!,! ∗ idf! Term Frequency is simplest approach is to assign the weight to be equal to the number of occurrences of term t in document d
tf!,! = # of word appear in a documenttotal # of words in a document
Inverse frequency is measure of whether the term is common or rare across all documents. We define the inverse document frequency of a term t as follows:
𝑖𝑑𝑓! = log𝑁𝑑𝑓!
4. Experiment
4.1 Trip Advisor Dataset
We included 8000 trip advisor reviews for performing sentiment analysis. We built a vocabulary list of 4750 words. In the preprocessing steps we filtered stopping words from original vocabulary list. Additionally we have eliminated emoticons like :-), :-( and other punctuations from the reviews considering the complexity.
4.2 Feature Selection F-Score is a measure of accuracy. It requires precision p and recall r, derived from confusion matrix to compute the measure. We use this score as a feature selection criteria. Precision p is calculated as (TP)/(TP+FP). Recall is computed as (TP)/(TP+FN). F-Score for every feature word is measured as
𝐹1 𝑀𝑒𝑎𝑠𝑢𝑟𝑒 = 2 𝑃𝑟𝑒𝑐𝑖𝑠𝑖𝑜𝑛 ∗ 𝑅𝑒𝑐𝑎𝑙𝑙𝑃𝑟𝑒𝑐𝑖𝑠𝑖𝑜𝑛 + 𝑅𝑒𝑐𝑎𝑙𝑙
We select features with high F-Score and apply the training models. Observations show 70% of F-Scores fluctuated between 0.7821 and 0.8104. We dropped all the features with F-Score less than 0.75 and observed better results. 4.3 Naïve Bayes and SVM Results We have evaluated our Sentiment Analysis classifier on the trip advisor hotel Review dataset[7] and we were able to observe following accuracy in prediction from baseline (Table 3). Naïve Bayes model performed well on smaller datasets. We also observed accuracy increased from 76.17% to 79.12% proportional to increase in the size of the dataset. After we evaluated the same experiment on SVM, we observed
5
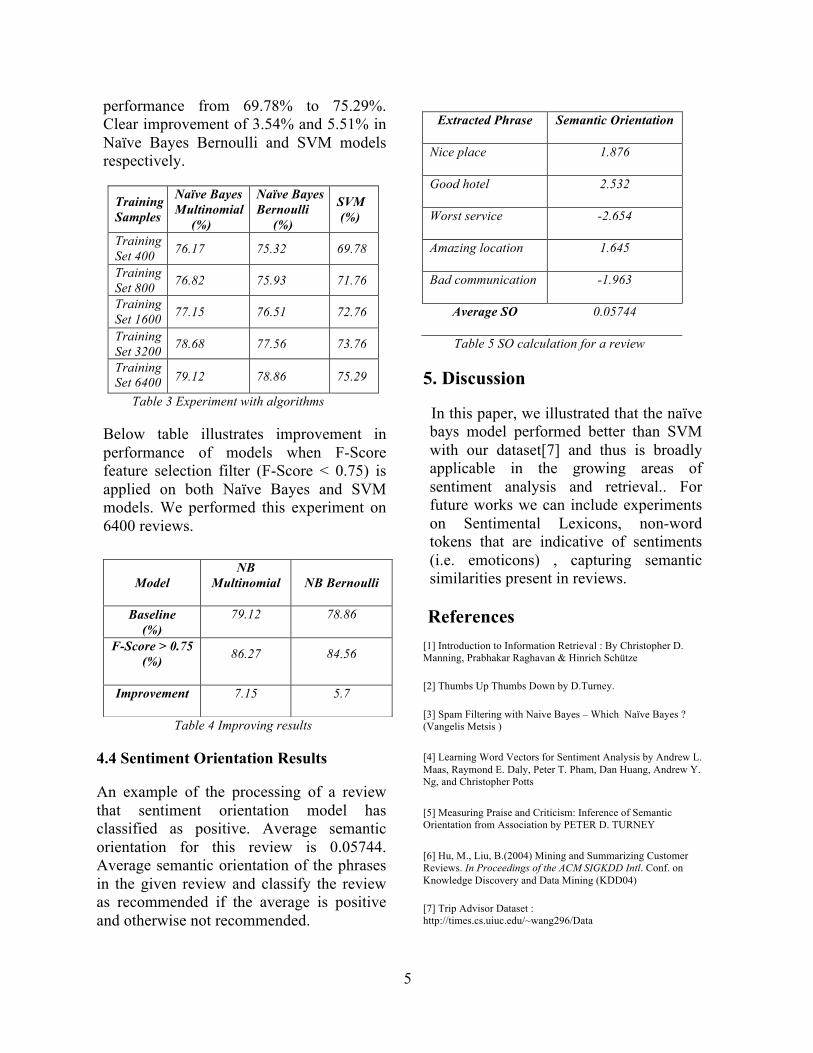
performance from 69.78% to 75.29%. Clear improvement of 3.54% and 5.51% in Naïve Bayes Bernoulli and SVM models respectively.
Training Samples
Naïve Bayes Multinomial (%)
Naïve Bayes Bernoulli (%)
SVM (%)
Training Set 400 76.17 75.32 69.78
Training Set 800 76.82 75.93 71.76
Training Set 1600 77.15 76.51 72.76
Training Set 3200 78.68 77.56 73.76
Training Set 6400 79.12 78.86 75.29
Table 3 Experiment with algorithms
Below table illustrates improvement in performance of models when F-Score feature selection filter (F-Score < 0.75) is applied on both Naïve Bayes and SVM models. We performed this experiment on 6400 reviews.
Table 4 Improving results
4.4 Sentiment Orientation Results An example of the processing of a review that sentiment orientation model has classified as positive. Average semantic orientation for this review is 0.05744. Average semantic orientation of the phrases in the given review and classify the review as recommended if the average is positive and otherwise not recommended.
Extracted Phrase Semantic Orientation
Nice place 1.876
Good hotel 2.532
Worst service -2.654
Amazing location 1.645
Bad communication -1.963
Average SO 0.05744
Table 5 SO calculation for a review
5. Discussion
In this paper, we illustrated that the naïve bays model performed better than SVM with our dataset[7] and thus is broadly applicable in the growing areas of sentiment analysis and retrieval.. For future works we can include experiments on Sentimental Lexicons, non-word tokens that are indicative of sentiments (i.e. emoticons) , capturing semantic similarities present in reviews.
References [1] Introduction to Information Retrieval : By Christopher D. Manning, Prabhakar Raghavan & Hinrich Schütze
[2] Thumbs Up Thumbs Down by D.Turney.
[3] Spam Filtering with Naive Bayes – Which Naïve Bayes ? (Vangelis Metsis )
[4] Learning Word Vectors for Sentiment Analysis by Andrew L. Maas, Raymond E. Daly, Peter T. Pham, Dan Huang, Andrew Y. Ng, and Christopher Potts
[5] Measuring Praise and Criticism: Inference of Semantic Orientation from Association by PETER D. TURNEY
[6] Hu, M., Liu, B.(2004) Mining and Summarizing Customer Reviews. In Proceedings of the ACM SIGKDD Intl. Conf. on Knowledge Discovery and Data Mining (KDD04)
[7] Trip Advisor Dataset : http://times.cs.uiuc.edu/~wang296/Data
Model NB
Multinomial
NB Bernoulli
Baseline
(%) 79.12 78.86
F-Score > 0.75 (%) 86.27 84.56
Improvement 7.15 5.7