Embed Size (px)
Citation preview

SERVANT LEADERSHIP AND ORGANISATIONAL
COMMITMENT AMONG CIMB BANK
EXECUTIVES IN PENANG, MALAYSIA
LIM SI WEI
SCHOOL OF BUSINESS AND ADMINISTRATION
WAWASAN OPEN UNIVERSITY
2012

1
NAME Lim Si Wei
DEGREE Commonwealth Executive Master of Business Administration
SUPERVISOR Dr Nasina Mat Desa
TITLE Servant Leadership and Organisational Commitment among CIMB
Bank Executives in Penang, Malaysia
DATE June 2012
INSTITUTION Wawasan Open University (WOU)
Final Project Report submitted in partial fulfilment
of the requirements for the award of
Commonwealth Executive Master of Business Administration (CeMBA)
of
Wawasan Open University
Penang, Malaysia
ii
ACKNOWLEDGEMENTS
I would like to take this opportunity to express my appreciation for the guidance and
support provided by my project supervisor, Dr Nasina Mat Desa. Her constructive
criticism and advice have proved invaluable. Without her encouragement, this research
project would not be a complete one. No words of thanks can adequately express the
depth of my gratitude.
This research project would not complete without the co-operation provided by the
respondents. I would like to acknowledge to all of the participating respondents who
spent time answering the questionnaires.
I also wish to thank my parents and family members for their support. Their
understanding and emotional support have brought me to this success.
Finally, I would like to thank my MBA course mates and friends for their support. Their
personal and professional guidance have assisted me to complete this research smoothly.

iii
CERTIFICATE OF ORIGINALITY
This is to certify that the research project, Servant Leadership and Organisational
Commitment among CIMB Bank Executives in Penang, Malaysia is an original work of
the student and is being submitted in partial fulfilment of the requirements for the award
of Commonwealth Executive Master of Business Administration (CeMBA) of
Wawasan Open University (WOU). This report has not been submitted earlier either to
this University or to any other University/Institution for the fulfilment of the
requirement of a course of study.
Declaration made by Student:
_______________________
Lim Si Wei
041100051
1 June 2012
Declaration confirmed by Project Supervisor:
____________________
Dr Nasina Mat Desa
TU00431
1 June 2012
iv
PLAGIARISM STATEMENT
I, Lim Si Wei, hereby declare that the attached report is all my own work and all
references contained within it have been correctly cited, the original authors
acknowledged and it contains no plagiarism.
After the completion of the project report, I have scanned the report through
TURNITIN software for plagiarism. The plagiarism report received from the plagiarism
detection software indicated that the work is very likely to be original and that I am
satisfied that I had not plagiarised any substantive part of the report.
Declaration made by Student
___________________________
Lim Si Wei
041100051
1 June 2012
v
TABLE OF CONTENTS
Page
TITLE PAGE I
ACKNOWLEDGEMENTS ii
CERTIFICATE OF ORIGINALITY iii
PLAGIARISM STATEMENT iv
TABLE OF CONTENTS v
LIST OF TABLES xiv
LIST OF FIGURES xx
ABSTRACT xxiv
CHAPTER 1: INTRODUCTION
1.1 Background 1
1.2 Problem Statement 6
1.3 Research Objectives 9
1.4 Research Questions 11
1.5 Significance of Research 12
1.6 Definitions of Key Terms 13
1.6.1 Servant Leadership 14

vi
1.6.1.1 Altruistic Calling 14
1.6.1.2 Emotional Healing 14
1.6.1.3 Wisdom 15
1.6.1.4 Persuasive Mapping 15
1.6.1.5 Organisational Stewardship 15
1.6.2 Organisational Commitment 15
1.6.2.1 Affective Commitment 16
1.6.2.2 Continuance Commitment 16
1.6.2.3 Normative Commitment 16
1.6.3 Executive Staff 16
1.6.4 CIMB Bank 16
1.7 Organisation of Remaining Chapters 17
CHAPTER 2: LITERATURE REVIEW
2.1 Introduction 18
2.2 Organisational Commitment 18
2.2.1 Affective Commitment 19
2.2.2 Continuance Commitment 20
2.2.3 Normative Commitment 22

vii
2.3 Servant Leadership 23
2.3.1 Altruistic Calling 26
2.3.2 Emotional Healing 26
2.3.3 Wisdom 27
2.3.4 Persuasive Mapping 27
2.3.5 Organisational Stewardship 28
2.4 Servant Leadership and Organisational Commitment 28
2.5 Theoretical Framework 30
2.6 Hypotheses Development 31
2.6.1 The Relationship between Altruistic Calling and
Affective Commitment
31
2.6.2 The Relationship between Altruistic Calling and
Continuance Commitment
32
2.6.3 The Relationship between Altruistic Calling and
Normative Commitment
32
2.6.4 The Relationship between Emotional Healing and
Affective Commitment
32
2.6.5 The Relationship between Emotional Healing and
Continuance Commitment
33
2.6.6 The Relationship between Emotional Healing and 33

viii
Normative Commitment
2.6.7 The Relationship between Wisdom and Affective
Commitment
33
2.6.8 The Relationship between Wisdom and
Continuance Commitment
34
2.6.9 The Relationship between Wisdom and Normative
Commitment
34
2.6.10 The Relationship between Persuasive Mapping and
Affective Commitment
34
2.6.11 The Relationship between Persuasive Mapping and
Continuance Commitment
35
2.6.12 The Relationship between Persuasive Mapping and
Normative Commitment
35
2.6.13 The Relationship between Organisational
Stewardship and Affective Commitment
36
2.6.14 The Relationship between Organisational
Stewardship and Continuance Commitment
36
2.6.15 The Relationship between Organisational
Stewardship and Normative Commitment
37
2.7 Summary 37

ix
CHAPTER 3: RESEARCH METHODOLOGY
3.1 Introduction 38
3.2 Research Design 38
3.3 Population and Sampling Frame 38
3.4 Sampling Techniques 39
3.5 Questionnaire Design 41
3.6 Questionnaire Measurement 41
3.6.1 Independent Variables 43
3.6.2 Dependent Variables 43
3.7 Data Collection Method 44
3.8 Statistical Techniques 44
3.8.1 Descriptive Analysis 45
3.8.2 Factor Analysis 45
3.8.3 Reliability Analysis 46
3.8.4 Correlation Analysis 46
3.8.5 Multiple Regression Analysis 47
3.9 Summary 50

x
CHAPTER 4: ANALYSIS OF RESULTS
4.1 Introduction 52
4.2 Overview of Data Collected 52
4.3 Demographic Profiles of Respondents 53
4.4 Factor Analysis 55
4.4.1 Factor Analysis on the Independent Variables 55
4.4.2 Factor Analysis on the Dependent Variables 58
4.5 Reliability Analysis 59
4.6 Descriptive Statistics 61
4.7 Correlation Analysis 63
4.8 Multiple Regression Analysis 65
4.8.1 Multiple Regression Analysis on Affective
Commitment
67
4.8.2 Multiple Regression Analysis on Continuance
Commitment
68
4.8.3 Multiple Regression Analysis on Normative
Commitment
70
4.9 Summary 71
xi
CHAPTER 5: FINDINGS AND CONCLUSION
5.1 Introduction 74
5.2 Recapitulation of the Study‟s Findings 74
5.3 Discussion 77
5.3.1 The Relationship between Servant Leadership and
Affective Commitment
77
5.3.2 The Relationship between Servant Leadership and
Continuance Commitment
80
5.3.3 The Relationship between Servant Leadership and
Normative Commitment
81
5.4 Implications of the Study 83
5.4.1 Theoretical Implications 83
5.4.2 Managerial Implications 85
5.5 Limitations of the Study and Suggestions for Future Research 87
5.6 Conclusion 89
REFERENCES 91
xii
APPENDICES
Appendix A Questionnaire with Cover Letter 103
Appendix B Coding of Variables in SPSS 109
Appendix C SPSS Analyses Outputs 110
Appendix C1 Demographic Profiles of Respondents 110
Appendix C2 Factor Analysis on the Independent Variables 117
Appendix C3 Factor Analysis on the Dependent Variables 125
Appendix C4 Reliability Analysis on Altruistic Calling 130
Appendix C5 Reliability Analysis on Emotional Healing 131
Appendix C6 Reliability Analysis on Wisdom 132
Appendix C7 Reliability Analysis on Persuasive Mapping 133
Appendix C8 Reliability Analysis on Organisational Stewardship 134
Appendix C9 Reliability Analysis on Affective Commitment 135
Appendix C10 Reliability Analysis on Continuance Commitment 136
Appendix C11 Reliability Analysis on Normative Commitment 137
Appendix C12 Descriptive Statistics 138
Appendix C13 Correlation Analysis 139
Appendix C14 Multiple Regression Analysis on Affective
Commitment
140

xiii
Appendix C15 Multiple Regression Analysis on Continuance
Commitment
145
Appendix C16 Multiple Regression Analysis on Normative
Commitment
150

xiv
LIST OF TABLES
Table No. Title of Tables Page
Table 3.1 Distribution of Questionnaires to CIMB Bank 40
Table 3.2 Layout of Items in the Questionnaire 42
Table 4.1 Breakdown of Questionnaires Collected 53
Table 4.2 Demographic Profiles of Respondents 54
Table 4.3 Rotated Factors and Factor Loadings for Independent
Variables
56
Table 4.4 Rotated Factors and Factor Loadings for Dependent
Variables
58
Table 4.5 Reliability Coefficients of the Study Variables 60
Table 4.6 Descriptive Statistics of the Study Variables 62
Table 4.7 Pearson‟s Correlation Analysis of the Study Variables 63
Table 4.8 Multiple Regression Results for Affective Commitment 67
Table 4.9 Multiple Regression Results for Continuance
Commitment
69
Table 4.10 Multiple Regression Results for Normative Commitment 70
Table 4.11 Summary of All Hypotheses Results 72
Table B.1 Coding of Variables in SPSS 109

xv
Table C1.1 Statistics of Demographic Profiles of Respondents 110
Table C1.2 Frequency of Gender Distribution of Respondents 111
Table C1.3 Frequency of Age Distribution of Respondents 111
Table C1.4 Frequency of Educational Level of Respondents 111
Table C1.5 Frequency of Position Level of Respondents 111
Table C1.6 Frequency of Organisational Tenure of Respondents 112
Table C1.7 Frequency of Working Duration of Respondents with
Current Supervisor
112
Table C1.8 Frequency of Gender of Supervisors 112
Table C2.1 KMO Value and Bartlett's Test of Sphericity of
Independent Variables
117
Table C2.2 Correlation Matrix between Altruistic Calling and Other
Independent Variables
117
Table C2.3 Correlation Matrix between Emotional Healing and
Other Independent Variables
118
Table C2.4 Correlation Matrix between Wisdom and Other
Independent Variables
119
Table C2.5 Correlation Matrix between Persuasive Mapping and
Other Independent Variables
120
Table C2.6 Correlation Matrix between Organisational Stewardship
and Other Independent Variables
121
xvi
Table C2.7 Total Variance Explained of Independent Variables 122
Table C2.8 Rotated Component Matrix of Independent Variables 124
Table C3.1 KMO and Bartlett‟s Test of Spericity of Dependent
Variables
125
Table C3.2 Correlation Matrix between Affective Commitment and
Other Dependent Variables
125
Table C3.3 Correlation Matrix between Continuance Commitment
and Other Dependent Variables
126
Table C3.4 Correlation Matrix between Normative Commitment and
Other Dependent Variables
126
Table C3.5 Total Variance Explained of Dependent Variables 127
Table C3.6 Rotated Component Matrix of Dependent Variables 129
Table C4.1 Reliability Statistics of Altruistic Calling 130
Table C4.2 Item Statistics of Altruistic Calling 130
Table C4.3 Inter-item Correlation Matrix of Altruistic Calling 130
Table C4.4 Item-total Statistics of Altruistic Calling 130
Table C4.5 Scale Statistics of Altruistic Calling 139
Table C5.1 Reliability Statistics of Emotional Healing 131
Table C5.2 Item Statistics of Emotional Healing 131
Table C5.3 Inter-item Correlation Matrix of Emotional Healing 131

xvii
Table C5.4 Item-total Statistics of Emotional Healing 131
Table C5.5 Scale Statistics of Emotional Healing 131
Table C6.1 Reliability Statistics of Wisdom 132
Table C6.2 Item Statistics of Wisdom 132
Table C6.3 Inter-item Correlation Matrix of Wisdom 132
Table C6.4 Item-total Statistics of Wisdom 132
Table C6.5 Scale Statistics of Wisdom 132
Table C7.1 Reliability Statistics of Persuasive Mapping 133
Table C7.2 Item Statistics of Persuasive Mapping 133
Table C7.3 Inter-item Correlation Matrix of Persuasive Mapping 133
Table C7.4 Item-total Statistics of Persuasive Mapping 133
Table C7.5 Scale Statistics of Persuasive Mapping 133
Table C8.1 Reliability Statistics of Organisational Stewardship 134
Table C8.2 Item Statistics of Organisational Stewardship 134
Table C8.3 Inter-item Correlation Matrix of Organisational
Stewardship
134
Table C8.4 Item-total Statistics of Organisational Stewardship 134
Table C8.5 Scale Statistics of Organisational Stewardship 134
Table C9.1 Reliability Statistics of Affective Commitment 135
xviii
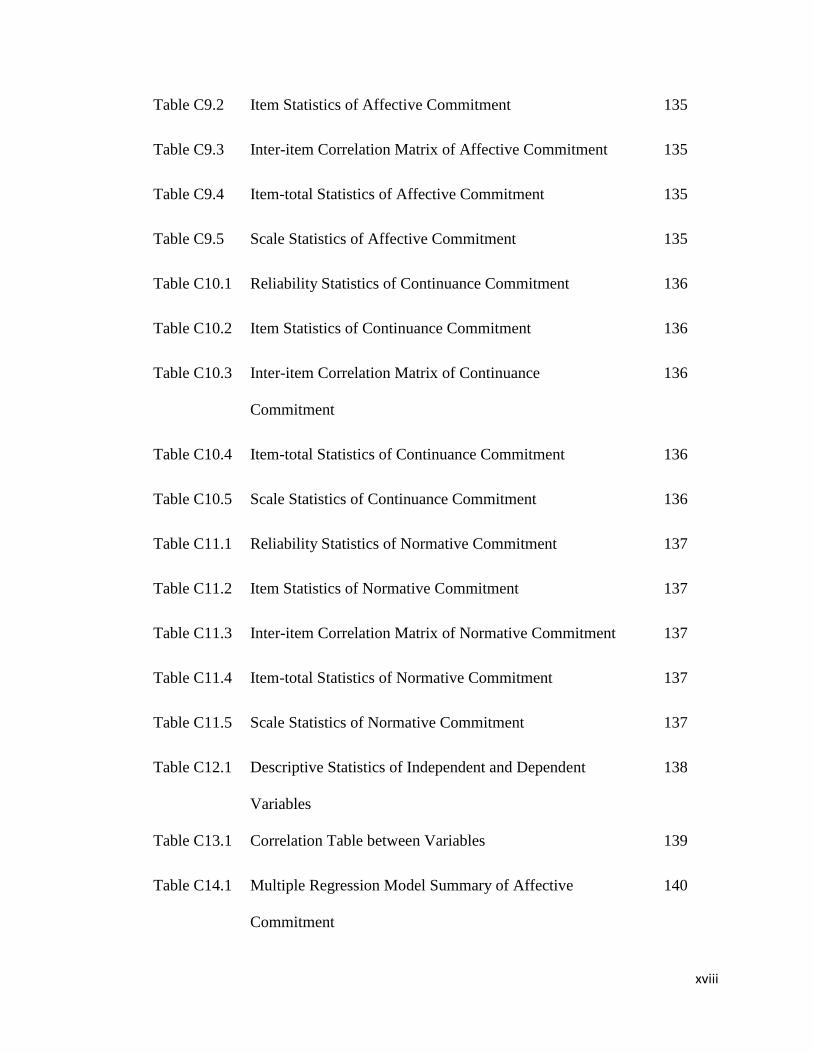
Table C9.2 Item Statistics of Affective Commitment 135
Table C9.3 Inter-item Correlation Matrix of Affective Commitment 135
Table C9.4 Item-total Statistics of Affective Commitment 135
Table C9.5 Scale Statistics of Affective Commitment 135
Table C10.1 Reliability Statistics of Continuance Commitment 136
Table C10.2 Item Statistics of Continuance Commitment 136
Table C10.3 Inter-item Correlation Matrix of Continuance
Commitment
136
Table C10.4 Item-total Statistics of Continuance Commitment 136
Table C10.5 Scale Statistics of Continuance Commitment 136
Table C11.1 Reliability Statistics of Normative Commitment 137
Table C11.2 Item Statistics of Normative Commitment 137
Table C11.3 Inter-item Correlation Matrix of Normative Commitment 137
Table C11.4 Item-total Statistics of Normative Commitment 137
Table C11.5 Scale Statistics of Normative Commitment 137
Table C12.1 Descriptive Statistics of Independent and Dependent
Variables
138
Table C13.1 Correlation Table between Variables 139
Table C14.1 Multiple Regression Model Summary of Affective
Commitment
140
xix
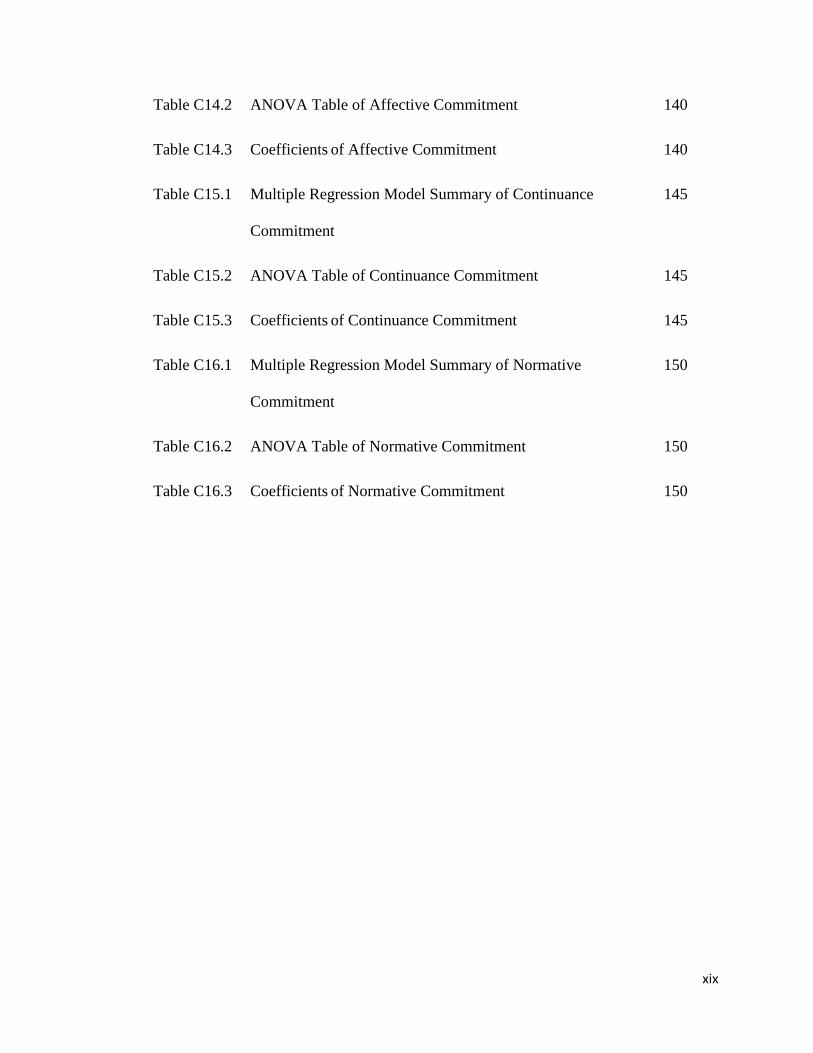
Table C14.2 ANOVA Table of Affective Commitment 140
Table C14.3 Coefficients of Affective Commitment 140
Table C15.1 Multiple Regression Model Summary of Continuance
Commitment
145
Table C15.2 ANOVA Table of Continuance Commitment 145
Table C15.3 Coefficients of Continuance Commitment 145
Table C16.1 Multiple Regression Model Summary of Normative
Commitment
150
Table C16.2 ANOVA Table of Normative Commitment 150
Table C16.3 Coefficients of Normative Commitment 150

xx
LIST OF FIGURES
Figure No. Title of Figure Page
Figure 2.1 Theoretical Framework: The relationship between
Servant Leadership and Organisational Commitment
31
Figure C1.1 Frequency Chart of Gender Distribution of
Respondents
113
Figure C1.2 Frequency Chart of Age Distribution of Respondents 113
Figure C1.3 Frequency Chart of Educational Level of Respondents 114
Figure C1.4 Frequency Chart of Position Level of Respondents 114
Figure C1.5 Frequency Chart of Organisational Tenure of
Respondents
115
Figure C1.6 Frequency Chart of Working Duration of Respondents
with Current Supervisor
115
Figure C1.7 Frequency Chart of Supervisor‟s Gender 116
Figure C2.1 Scree Plot of Independent Variables 123
Figure C3.1 Scree Plot of Dependent Variables 128
Figure C14.1 Histogram of Frequency against Regression
Standardised Residual for Affective Commitment
141
Figure C14.2 Normal P-P Plot of Regression Standardised Residual
for Affective Commitment
141
xxi
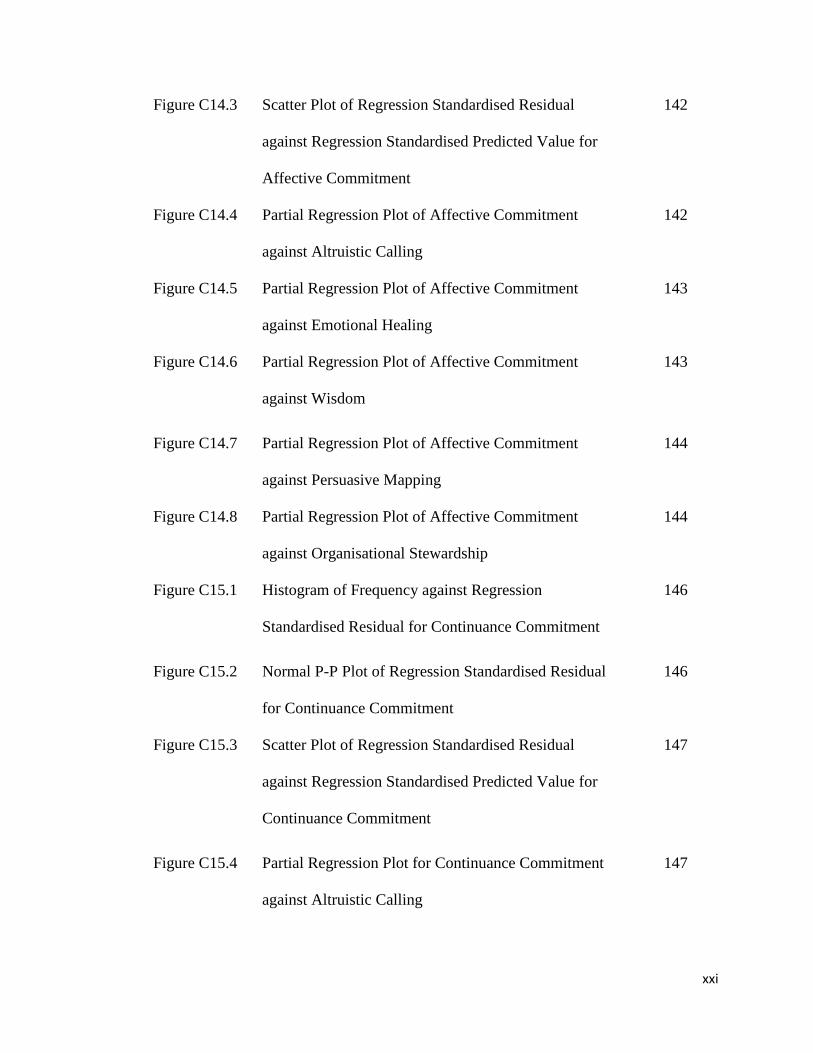
Figure C14.3 Scatter Plot of Regression Standardised Residual
against Regression Standardised Predicted Value for
Affective Commitment
142
Figure C14.4 Partial Regression Plot of Affective Commitment
against Altruistic Calling
142
Figure C14.5 Partial Regression Plot of Affective Commitment
against Emotional Healing
143
Figure C14.6 Partial Regression Plot of Affective Commitment
against Wisdom
143
Figure C14.7 Partial Regression Plot of Affective Commitment
against Persuasive Mapping
144
Figure C14.8 Partial Regression Plot of Affective Commitment
against Organisational Stewardship
144
Figure C15.1 Histogram of Frequency against Regression
Standardised Residual for Continuance Commitment
146
Figure C15.2 Normal P-P Plot of Regression Standardised Residual
for Continuance Commitment
146
Figure C15.3 Scatter Plot of Regression Standardised Residual
against Regression Standardised Predicted Value for
Continuance Commitment
147
Figure C15.4 Partial Regression Plot for Continuance Commitment
against Altruistic Calling
147

xxii
Figure C15.5 Partial Regression Plot for Continuance Commitment
against Emotional Healing
148
Figure C15.6 Partial Regression Plot for Continuance Commitment
against Wisdom
148
Figure C15.7 Partial Regression Plot for Continuance Commitment
against Persuasive Mapping
149
Figure C15.8 Partial Regression Plot for Continuance Commitment
against Organisational Stewardship
149
Figure C16.1 Histogram of Frequency against Regression
Standardised Residual for Normative Commitment
151
Figure C16.2 Normal P-P Plot of Regression Standardised Residual
for Normative Commitment
151
Figure C16.3 Scatter Plot of Regression Standardised Residual
against Regression Standardised Predicted Value for
Normative Commitment
152
Figure C16.4 Partial Regression Plot of Normative Commitment
against Altruistic Calling
152
Figure C16.5 Partial Regression Plot of Normative Commitment
against Emotional Healing
153
Figure C16.6 Partial Regression Plot of Normative Commitment
against Wisdom
153
Figure C16.7 Partial Regression Plot of Normative Commitment
against Persuasive Mapping
154

xxiii
Figure C16.8 Partial Regression Plot of Normative Commitment
against Organisational Stewardship
154

xxiv
NAME Lim Si Wei
DEGREE Commonwealth Executive Master of Business Administration
SUPERVISOR Dr Nasina Mat Desa
TITLE Servant Leadership and Organisational Commitment among
CIMB Bank Executives in Penang, Malaysia
DATE June 2012
Abstract
This research examined the relationship between servant leadership (altruistic calling,
emotional healing, wisdom, persuasive mapping and organisational stewardship) and
organisational commitment (affective commitment, continuance commitment and
normative commitment) among executive staff in CIMB Banks in Penang, Malaysia.
Fifteen hypotheses were tested in this study. A total of 160 questionnaires were
distributed to the executive staff from ten branches of CIMB Bank in the North East
region of Penang Island over a period of three weeks from the end of March to the
middle of April. 107 questionnaires were usable yielded a response rate of 67%. The
collected data were analysed using factor analysis, reliability analysis, descriptive
analysis, correlational analysis and multiple regression analysis. The results revealed
that emotional healing was significantly positively related to continuance commitment
and normative commitment. It was also showed that altruistic calling was significantly
positively related to normative commitment while wisdom was found to be significantly
positively related to affective commitment.
xxv
This study provided some theoretical and practical implications. Theoretically, this
study provides new insights to the literature on the relationship between servant
leadership and organisational commitment among CIMB Bank executives in the North
East region of Penang Island. It also provides insights of the commitment profile and
perceived servant leadership profiles to the management team. This may serve as
guidance for the management team to improvise the leadership training programme for
their managers. Limitations and suggestions for future studies were discussed. This
study highlighted the importance of having a right leader to manage their employee to
achieve greater organisational commitment. It underlies the managerial responsibility
for timely and committed organisational intervention, which in turn would augur well
for the retention of valuable human resources.

1
CHAPTER 1
INTRODUCTION
1.1 Background
Organisational commitment is a psychological state that is characterised by the
employees‟ relationship with the organisation and the decision of the employees to
continue membership in the organisation (Meyer & Allen, 1997). It is a reflection of a
desire, a need, or an obligation to maintain membership with the organisation.
Organisational commitment has important role in the study of organisational behaviour.
It has powerful implications on organisations and their members. Various studies have
shown the relationship between organisational commitment and attitudes and
behaviours at the workplace (Porter et al., 1974; Angle & Perry, 1981). Organisational
commitment has been shown to relate to employee behaviours, job satisfaction and
performance effectiveness (Bateman & Strasser, 1984). Turnover rate and absenteeism
are lower in organisation with stronger organisational commitment (Kyei-Poku, 1996).
Besides that, productivity is higher in organisation with stronger organisational
commitment as well (Shore & Martin, 1989). Organisational commitment is vital in
ensuring the sustainability of an organisation. Organisations with stronger
organisational commitment are able to respond and adapt faster to environmental
changes. Therefore, study of organisational commitment is important.
Organisational commitment is vital for the survival of all organisations and has been
studied in various types of organisations, such as hospital (Welsh & LaVan, 1981),

2
manufacturing organisation (Allen & Meyer, 1990), bank (Kyei-Poku, 1996), university
(Allen & Meyer, 1990) and banking (Kyei-Poku, 1996; Panchanatham et al, 2011;
Nasirul Islam, 2006; Pandey, 2009; Riaz et al., 2011). Among various industries,
organisational commitment has obtained much concern from the banking industry. The
study of organisational commitment in banking industry has been carried out in a few
countries, such as Canada (Kyei-Poku, 1996), India (Panchanatham et al., 2011),
Bangladesh (Nasirul Islam, 2006); Nepal (Pandey, 2009) and Pakistan (Riaz et al.,
2011). Organisational commitment is an important issue in the ever dynamic and
challenging banking industry.
Researchers put in a lot of effort on the study of organisational commitment in banking
industry following the global trend of mergers and acquisitions in the banking and
financial sector. The increasing of mergers and acquisitions in the international banking
and financial sector is partly due to globalisation, a force that is dramatically changing
how companies compete and succeed. It is believed that the mergers and acquisition
organisations may gain competitive advantage through the synergistic effect of the
integration and combination of business units (Kyei-Poku, 1996). However, evidence
showed that mergers and acquisition organisations do not live up to their potential and
in some cases perform even less than market average (Kyei-Poku, 1996). One of the
main reasons for failure of mergers is the overlook of the importance of human resource
by corporate leaders (Cartwright & Cooper, 1993a). Human resource related issues such
as job satisfaction, organisational commitment, performance and motivation have been
shown to be related to of the failure of merger and acquisition organisations (Kyei-Poku,
3
1996). The attitudes and behaviours of employees are important determinants of the
sustainability of merger and acquisition organisations. Lower morale among employees
following merger results in reduced organisational commitment and influences the
effectiveness of the new organisation (Weber, 1996). Increasing organisational
commitment among employees may reduce the failure rates of mergers. Committed
employees put forth extra effort in their work, serve as positive public-relations
representatives outside the organisation, and go above and beyond the norm in doing the
little things that help the organisation function effectively (Niehoff et al., 2001).
Therefore, strategies on improving organisational commitment following mergers and
acquisitions are vital for the survival of the organisations.
One of the factors that affect organisational commitment is leadership style.
Appropriate leadership styles may enhance organisational commitment (Drury, 2004;
Lok & Crawford, 2004; Lee & Ahmad, 2009). Employees that have good relationship
with their immediate work group have higher levels of commitment (Meyer & Allen,
1997). Koopman (1991) showed that leadership styles affect employees. Employees
who favour their manager‟s style favour the organisation more. The degree of employee
commitment is strongly related to the overall management culture and style driven by
top management team (Nierhoff et al., 1990). Employees who feel that they are cared
for by their organisation and managers have higher levels of commitment (Eisenberger
et al., 1990). They are more conscious about their responsibilities, have greater
involvement in the organisation and are more innovative (Eisenberger et al., 1990).
4
Therefore, cultivation of appropriate leadership style among managers may enhance
organisational commitment of employees.
Various leadership styles have been shown to have positive relationship with
organisational commitment. Among them, servant leadership has been chosen for this
study. The positive relationship between servant leadership and organisational
commitment has been proven by Liden et al. (2008). Servant leadership has been found
to be positively related to trust, organisational citizenship behaviours, procedural justice,
extra effort, organisational commitment, follower need fulfilment, turnover and a
promotional mindset (Searle, 2011). Positive changes made by servant leaders may lead
to greater positive outcome to the organisation. Organisations such as Southwest
Airlines and Synovus Financial Corporation gained competitive advantage after
incorporating servant leadership into their management philosophy (Washington et al.,
2006). They were listed in Fortune‟s January 2000 „Top 10 Best companies to Work for
In America‟ (Washington et al., 2006). This shows that servant leadership focused
companies are able to attract their employees‟ interest to remain membership with the
organisations. Other organisations that have been practicing servant leadership include
The Toro Company, Synovus Financial Corporation, ServiceMaster Company, The
Men‟s Warehouse, Southwest Airlines and Starbucks, are practicing servant leadership
(Hill, 2008; Washington et al., 2006).
In Malaysia, CIMB Bank is one of the organisations that incorporate servant leadership
into their management philosophy. The management team seeks to develop leaders who
5
are able to build covenantal relationship with their subordinates and show mutual
commitment between both parties by cultivating the „carefrontational‟ culture (CIMB,
2010). This is in accordance with the philosophy of servant leadership at which servant
leaders are perceived as honest, trustworthy and respectful by their subordinates (Hill,
2008). They cultivate their subordinates into wiser, freer, more autonomous and
independent individuals (Searle, 2011). The strong engagement between servant leaders
and subordinates may help to improve the overall organisational commitment and
performance. Therefore, various strategies that enhance the qualities of servant
leadership among the managers have been implemented. With the enhancement of
leadership qualities among managers, organisational commitment may be strengthened
(Drury, 2004; Lok & Crawford, 2004; Lee & Ahmad, 2009).
The management team of CIMB Bank understands the importance of human resource
management in ensuring the sustainability of the organisation. Various strategies have
been implemented to improve the human resource management, such as the move of the
Group Corporate Communications to Group Corporate Resources at the beginning of
2011(CIMB, 2010). Furthermore, in conjunction with the philosophy of the
organisation of the development of people, the Commerce Leadership Institute has been
launched to strengthen the leadership capabilities of the employee (CIMB, 2010). The
qualities of servant leaders are incorporated into the philosophy of the programs.
Although the management team of CIMB Banks sees the importance of servant
leadership, the effectiveness of the implementation of servant leadership on
organisational commitment in CIMB Banks has not been studied. This study, therefore,

6
may provide guidance for CIMB Bank to strategise and implement servant leadership
into the leadership development program.
1.2 Problem statement
Banking industry situated in an ever dynamic and challenging environment. Banking
organisations have to constantly innovate and re-invent themselves to maintain
sustainability. To improve competitiveness of Malaysia banking industry in the
increasing globalised environment, Malaysia government encouraged the banking
industry to consolidate more rapidly by introducing the Financial Sector Master Plan in
2001. In response to the government-initiated banking consolidation plan, the CIMB
Regional Universal Bank was launched by the CIMB Group in 2006 following the 3-
way merger of Commerce International Merchant Bankers, Bumiputra-Commerce Bank
and Southern Bank (CIMB Group, 2010).
A merger is a significant event over the life of an organisation, and it has impact on the
organisational performance. Although the aim of mergers and acquisition is to improve
the competitiveness of the organisations, failures have been reported (Kyei-Poku, 1996).
Decrease in organisational commitment has been identified as one of the determinants
of failure of mergers (Davy et al., 1988). Morale among employees of merger and
acquisition organisations has been shown to reduce after mergers. Staff turnover was
increased and productivity was reduced (Armstrong-Stassen et al., 2001). Reduce in
organisation commitment and effectiveness of new organisation has been reported

7
(Weber, 1996). Therefore, improving attitudes and behaviours of employees is vital in
ensuring the success of merger and acquisition organisations.
Human resource management plays a vital role in ensuring the sustainability of merger
and acquisition organisations. Overlook of the importance of human resource
management is related to reduce of organisational commitment following mergers
(Cartwright & Cooper, 1993a). Strategies that enhance human resource management,
such as appropriate leadership styles may enhance organisational commitment (Drury,
2004; Lok & Crawford, 2004; Lee & Ahmad, 2009). As suggested by the social
cognitive theory, person, environment and behaviour continuously influence each other.
Management culture and leadership styles driven by top management team have been
shown to be related to the degree of employee commitment (Nierhoff et al., 1990).
Organisational commitment is improved if the employees favour the leadership style of
their managers. Furthermore, leader-member exchange theory also suggests that work
behaviour of subordinates is influenced by leadership style. High qualities of exchanges
such as higher level of trust, interaction, support and rewards ensure intimate
relationship between managers and followers (Lee & Ahmad, 2009). Level of
commitment is higher among employees who feel that they are cared for by their
organisations and managers (Eisenberger et al., 1990). Therefore, covenantal
relationship between managers and followers may be built by incorporating appropriate
leadership styles. Organisational commitment may be improved.
8
The management team of CIMB Bank is aware of the importance of human resource
management in merger and acquisition organisations. Strategies such as the move of the
Group Corporate Communications to Group Corporate Resources have been
implemented to nurture appropriate working attitudes and behaviours among the
employees (CIMB, 2010). Furthermore, in conjunction with the philosophy of the
organisation of the development of people, the Commerce Leadership Institute has been
launched. The institute aims to strengthen the leadership capabilities of the employee
(CIMB, 2010). The management team seeks to improve organisational commitment by
enhancing the leadership qualities among managers.
The philosophy of the „carefrontational‟ culture cultivated by the management team of
CIMB Bank is most compatible with the leadership qualities of servant leadership.
CIMB Bank seeks to develop leaders who are able to show mutual commitment
between with their followers by building covenantal relationship with them (CIMB,
2010). Strong manager-follower relationship may be built through the practice of
servant leadership. Servant leaders are perceived as honest, trustworthy and respectful
by their subordinates (Hill, 2008). They cultivate their subordinates into wiser, freer,
more autonomous and independent individuals (Searle, 2011). Intimate relationship
may be developed between servant leaders and their followers. The strong engagement
between them may help to improve the overall organisational commitment and
performance, which is the ultimate aim of the management of CIMB Bank to improve
leadership qualities among the managers.
9
Although the management team of CIMB Bank has implemented various strategies to
enhance organisational commitment by incorporating the qualities of servant leadership
into the philosophy of human resource management, the effectiveness of the strategies
have not been studied at the local setting. The relationship between leadership and
organisational commitment has been looked at by some researchers (Lok & Crawford,
2004; Darvish & Rezaei, 2011; Brown, 2003). Some of them were carried out in Asian
countries (Lee & Ahmad, 2008; Dhawan & Mulla, 2011). However, most of the studies
were carried out in the Western countries (Drury, 2004; Hoveida et al., 2011; Hill,
2008). Although the results of these studies showed positive relationship between
servant leadership and organisational commitment, the relationship between the
variables may be different in Malaysia due to cultural difference across countries.
Therefore, the purpose of this study is to understand the relationship between servant
leadership and organisational commitment in Malaysia. By understanding the
relationship, CIMB bank will be able to improvise their leadership training for their
managers and identify which dimensions of servant leadership will have the greatest
impact on CIMB‟s employees‟ organisational commitment.
1.3 Research Objective
The purposes of this study are:
1) To explore the relationship between altruistic calling and affective
commitment
2) To explore the relationship between altruistic calling and continuance
commitment

10
3) To explore the relationship between altruistic calling and normative
commitment
4) To explore the relationship between emotional healing and affective
commitment
5) To explore the relationship between emotional healing and continuance
commitment
6) To explore the relationship between emotional healing and normative
commitment
7) To explore the relationship between wisdom and affective commitment
8) To explore the relationship between wisdom and continuance commitment
9) To explore the relationship between wisdom and normative commitment
10) To explore the relationship between persuasive mapping and affective
commitment
11) To explore the relationship between persuasive mapping and continuance
commitment
12) To explore the relationship between persuasive mapping and normative
commitment
13) To explore the relationship between organisational stewardship and affective
commitment
14) To explore the relationship between organisational stewardship and
continuance commitment
15) To explore the relationship between organisational stewardship and
normative commitment

11
1.4 Research Question
This study attempts to answer to following questions:
1) Does altruistic calling have significant effect on affective commitment?
2) Does altruistic calling have significant effect on continuance commitment?
3) Does altruistic calling have significant effect on normative commitment?
4) Does emotional healing have significant effect on affective commitment?
5) Does emotional healing have significant effect on continuance commitment?
6) Does emotional healing have significant effect on normative commitment?
7) Does wisdom have significant effect on affective commitment?
8) Does wisdom have significant effect on continuance commitment?
9) Does wisdom have significant effect on normative commitment?
10) Does persuasive mapping have significant effect on affective commitment?
11) Does persuasive mapping have significant effect on continuance
commitment?
12) Does persuasive mapping have significant effect on normative commitment?
13) Does organisational stewardship have significant effect on affective
commitment?
14) Does organisational stewardship have significant effect on continuance
commitment?
15) Does organisational stewardship have significant effect on normative
commitment?

12
1.5 Significance of the Study
This study may help the academic world to have a better understanding of the
relationship between servant leadership and organisational commitment in Malaysia.
The relationship between leadership and organisational commitment has been carried
out by some researchers in Western and Asian countries (Brown, 2003; Lok &
Crawford, 2004; Lee & Ahmad, 2008; Darvish & Rezaei, 2011; Dhawan & Mulla,
2011). However, the studies of relationship between servant leadership and
organisational commitment are limited (Drury, 2004; Hill, 2008; Hoveida et. al., 2011).
Furthermore, these studies were studied in Western countries. Limited studies have
been carried out in Malaysia. As suggested by the Hofstede cultural difference across
countries, the relationship between variables may be different in Malaysia. This
research may show the applicability of servant leadership in Malaysia.
Besides that, this study may provide an insight into the relationship between the
individual dimensions of the servant leadership proposed by Barbuto and Wheeler
(2006) and the Three Component Model proposed by Allen and Meyer (1991).
Development of new hypotheses for future study may be facilitated.
There are various reasons why the banking industry, specifically CIMB Banks in
Penang is chosen as the subject of this study.

13
Firstly, the banking industry in Malaysia is experiencing consolidation. As stated in the
problem statement, attitudes and behaviours of employees are the key determinant of
the success of merger and acquisition organisations Kyei-Poku, 1996). Study of the
organisational commitment may benefit the employers by providing insights into the
commitment profiles of the employees in the banking industry.
Being a product of merger, the management team of CIMB Bank understands the
significance of human resource management to the sustainability of the organisation.
Although various efforts have been done to improve human resource management,
appropriateness of the strategies has not been studied. Hence, this study may provide an
insight to the CIMB Bank management team on the commitment profiles of their
employees. Furthermore, the dimension of servant leadership that has the greatest
impact on organisational commitment of CIMB Bank employees may be identified. The
management team may use this study as a guidance to strategise and implement servant
leadership into leadership training program.
In conclusion, carrying out a research on the employees of CIMB Bank is vital for the
management team to review and enhance their leadership training for their managers.
1.6 Definition of Key Term
The definitions of the key terms used in this study are shown below:

14
1.6.1 Servant leadership
According to Greenleaf (1977), servant leaders are leaders who put others‟ interest at
the highest priority and offer altruism as the foundation to serve others. For the purpose
of this study, the definition of Barbuto and Wheeler (2002) was utilised. Servant
leadership is composed of five important dimensions: altruistic calling, emotional
healing, wisdom, persuasive mapping and organisational stewardship.
1.6.1.1 Altruistic Calling
Altruistic calling is defined as “the desire of servant leaders to make positive difference
in others‟ lives. Leaders who emphasise on altruistic calling will put others‟ interests
ahead of their own and will diligently work to meet followers‟ need.”
1.6.1.2 Emotional Healing
Emotional healing is defined as “the ability in fostering spiritual recovery from hardship
or trauma”. The emotional healing power of servant leader is facilitated by their ability
to take empathetic actions toward their followers‟ needs, desires, and problems
(Barbuto & Wheeler, 2006). This ability enables servant leaders to be skilled at
cultivating relationships and environments that encourage others to share their concerns,
ideas, dreams, problems, and promotes emotional healing (Barbuto & Wheeler, 2006).
15
1.6.1.3 Wisdom
Wisdom is described as “a combination of awareness of surroundings and anticipation
of consequences”. Leaders high in wisdom are aware of their surroundings and able to
anticipate the consequences and implications of their observations.
1.6.1.4 Persuasive Mapping
Persuasive mapping is described as “the description of the extent that leaders use sound
reasoning and mental frameworks”. Leaders high in persuasive mapping are skilled at
visualising greater possibilities and making these possibilities seem exciting and
motivating for followers (Barbuto & Wheeler, 2006; Graham, 1991).
1.6.1.5 Organisational Stewardship
Organisational stewardship refers to the ability of servant leader to satisfy the needs of
multiple stakeholders, and prepare their organisations and its members to make positive
contributions to the surrounding community, environment and society.
1.6.2 Organisational Commitment
This study utilises the definition described by Meyer and Allen (1991): “organisational
commitment is a psychological state that is characterised by the employees‟ relationship
with the organisation and the decision of the employees to continue membership in the
organisation”. The three components of organisational commitment are discussed in this
study: affective commitment, continuance commitment and normative commitment.
16
1.6.2.1 Affective Commitment
Affective commitment refers to the employee‟s emotional attachment to, identification
with, and involvement in the organisation. Employees with strong affective
commitment stay with the organisation because they want to do so.
1.6.2.2 Continuance Commitment
Continuance commitment refers to an awareness of the cost associated with leaving the
organisation. Employees with high continuance commitment stay with the organisation
because they need to do so.
1.6.2.3 Normative Commitment
Normative commitment reflects a feeling of obligation to continue employment.
Employees with high level of normative commitment feel that they ought to remain
with the organisation.
1.6.3 Executive Staff
For the purpose of this study, executive staff refers to an individual employee Grade 34
to Grade 36 working with the CIMB Bank.
1.6.4 CIMB Bank
CIMB bank is a bank under the umbrella of CIMB Group, which is a regional universal
bank operating in ASEAN. CIMB Bank represents CIMB Group‟s consumer bank and
17
corporate banking franchise in Malaysia, Singapore and Cambodia. In this study, only
the CIMB Commercial Banks in the North East region of Penang Island are included.
1.7 Organisation of Remaining Chapters
There are five chapters in this study. Chapter one describes the background of the study,
problem statement, research objectives, research questions and significance of the study.
Chapter two reviews related researches that have been carried out previously. A
theoretical framework was developed and fifteen hypotheses were formulated.
Chapter three describes the methodology used in this study. Research design, variables
and measurements, data collection method and data analysis techniques were discussed
in this chapter.
The goodness of measurements used and the results of the statistical analyses from
SPSS are provided in Chapter four.
The final chapter, chapter five presents the research findings, discussions and the
implications of the study. Limitations of the study and suggestions for future research
were presented.

18
CHAPTER 2
LITERATURE REVIEW
2.1 Introduction
This chapter discusses the overview of literature on organisational commitment
(affective commitment, continuance commitment and normative commitment) and
servant leadership (altruistic calling, emotional healing, wisdom, persuasive mapping
and organisational stewardship). The theoretical framework and hypotheses were
developed based on the literature reviewed.
2.2 Organisation Commitment
Organisational commitment has been widely studied in the field of organisational
behaviour, human resource management and organisational psychology (Abdul Karim
& Mohammd Noor, 2006). It has been found to be related to attitudes and behaviours at
the workplace (Porter et al., 1974, Angle & Perry, 1981). Organisational commitment
has been shown to be positively related to organisational performance and job
satisfaction; and negatively related to turnover rate (Bateman & Strasser, 1984; Shore &
Martin, 1989; Kyei-Poku, 1996).
Meyer and Allen (1991) reviewed organisational commitment theories and researches
and proposed a new model of commitment called the three-component model of
organisational commitment. They concluded that commitment is a psychological state
with three components that reflects a desire, a need, and an obligation to maintain
19
employment in an organisation. The three components are termed as affective
commitment, continuance commitment and normative commitment.
Affective commitment is related to the emotional attachment to, identification with and
involvement of an individual with the organisation. Continuance commitment refers to
the perceived cost of leaving an organisation. Individuals who are normatively
committed to the organisation stay with the organisation due to the feeling of obligation
to continue employment. The three components are related but distinguishable from
each other (Meyer et al., 2002). An individual may experience the three components to
different degrees.
The three-component model of organisational commitment has been studied and tested
by various researchers and received empirical support (Eisinga et al., 2010; Abdul
Karim & Mohammad Noor, 2006; Jaros, 2002; Culpepper, 2000; Md Zain & Gill, 1999;
Hackett et al., 1994). The cross-cultural generalizability of the three-component model
in Malaysia has been proven (Md Zain & Gill, 1999). Hence, the three component
model of organisational commitment proposed by Meyer and Allen is used in this study.
2.2.1 Affective Commitment
Allen and Meyer (1991) derived affective commitment as a component of the three-
component model of organisational commitment from the definitions of commitment
described by other researchers. Kanter (1968) described commitment as “the attachment
20
of an individual‟s fund of affectivity and emotion to the group”. Other researchers such
as Buchanan (1974) and Mowday et al. (1979) have also used commitment to describe
an affective orientation towards the organisation (Meyer & Allen, 1991). Meyer and
Allen (1991) defined affective commitment as “employee‟s emotional attachment to,
identification with, and involvement in the organisation”.
Affective commitment creates favourable intentions that help to preserve and reinforce
relationship (Evanschitzky et al., 2006). It has an important role in long term
relationship. Employees who are affectively committed to the organisation feel proud
and have the desire for affiliation with the organisation. They are keen to maintain
organisational membership and willing to help the organisation to achieve its goals
(Porter et al., 1974). Employees who are high in affective commitment show positive
work-related behaviours. Employees with higher affective commitment showed lower
withdrawal behaviours (Rhoades et al., 2001). Besides that, better performance and
organisational citizenship behaviour have been reported as well (Meyer et al., 2002).
2.2.2 Continuance Commitment
The second component of organisational commitment originated from Becker‟s side
bets theory. Becker (1960) described continuance commitment as engagement in the
relationship resulting from the perceived lost of accumulated side bets as a result of
termination of the relationship. Meyer and Allen (1991) defined continuance
commitment as an awareness of the costs associated with leaving the organisation.
21
The cost of leaving may appear in many forms, such as time and effort spent on
acquiring of non-transferable investments. Examples of non-transferable investments
include non-transferable skills, seniority privileges, retirement benefit or pension,
relationship with colleagues, uproot of family, availability of alternatives, or things that
are unique to the organisation and meaningful to the employees (Reichers, 1985; Meyer
& Allen, 1991). The level of continuance commitment is high when the cost of leaving
is high. However, the perception of cost differs between individuals. For example, the
attractiveness of external employment opportunities are diminished by certain
investments or side-bets made by employees. Therefore, the measurement of
continuance commitment is subjective to the perception of individual.
The relationship between continuance commitment and work-related behaviours
depends on the implication of that behaviour for employment because continued
employment is a necessity for individual with high continuance commitment. Some
researchers suggested that continuance commitment is unrelated, or related negatively
to work-related behaviours such as attendance, performance and organisational
citizenship behaviour (Becker & Kernan, 2003; Meyer & Allen, 2002). However, it has
been shown that continuance commitment is positively related to employee turnover
(Vandenberghe et al., 2011). Employees with higher continuance commitment showed
lower turnover rates.
22
2.2.3 Normative Commitment
Normative commitment is the least researched component of the three-component
model of organisational commitment (Kyei-Poku, 1996). The concept of normative
commitment was originally introduced by Wiener (1982) who viewed normative
commitment as “the totality of internalized normative pressures to act in a way that
meets organizational goals and interests”. Meyer and Allen (1991) supported this type
of commitment and they defined normative commitment as “a feeling of obligation”.
Normative commitment is present in many scenarios such as marriage, family and
religion. When it comes to an employee‟s commitment to their work place they often
feel an obligation to the organization (Wiener, 1982). Normative commitment may be
promoted by certain organisation policies such as nepotism-hiring policies that favour
the employees‟ family members and offer scholarship for university students (Meyer &
Allen, 1997). The investment that the organisation put in for the employees may cause
them to feel an obligation to serve for the organisation until the debt is repaid (Meyer &
Allen, 1991).
The potential disadvantage of normative commitment is such that it may only last until
the „debt‟ is regarded as paid (Meyer & Allen 1991) and it is subject to be lost later on.
If normative commitment is the dominating form of commitment, it will potentially
only last as long as the internal or external pressure is present or until the “debt”
remains unpaid. Therefore, the right composition of the three dimensions of
commitment is important in ensuring strong commitment profiles.
23
2.3 Servant Leadership
The concept of leader to work as a servant has been discussed for a long time. In the
sixth century, an ancient Chinese sage named Lao-tzu proposed that leadership is a
service, and roles of leaders are to guide, assist, develop and strengthen their followers
(Ching & Ching, 1995). In the academic world, the concept of servant leadership was
introduced by Robert Greenleaf (1977). According to him, servant leaders put others‟
interest at the highest priority and offer altruism as the foundation to serve others.
Servant leaders facilitate, foster and cultivate lasting evolutionary growth in their
followers (Van Dierendonck & Patterson, 2010). They recognise the needs and concern
of multiple stakeholders, and seek to address these needs through moral altruistic acts of
service (Searle, 2011). Servant leaders are follower-focused. Their main aim is to serve
others and fulfil the needs of others (Parolini et al., 2009). Their nature of serving others
helps to produce an environment of cohesion, concern and trust (Van Dierendonck &
Patterson, 2010).
Despite the early introduction of the concept of servant leadership by Greenleaf in 1977,
no consensual framework of servant leadership has emerged. Various characteristics of
servant leadership that focus on conceptually similar constructs have been proposed by
researchers throughout the years. According to Graham (1991), servant leader is
someone who is humble, fosters follower autonomy and focuses on the common good.
Servant leaders act as a good model for the followers and inspire the followers to act
morally.
24
A few years later, Spears (1995) identified ten themes of servant leaders that have been
continuously described by Greenleaf in his literature. These themes are empathy,
listening, healing, persuasion, awareness, conceptualisation, stewardship, foresight,
building community and commitment towards the growth of people (Barbuto &
Wheeler, 2006). Although Spears‟ work best described the characteristics of servant
leaders, it did not connect or distinguish itself from other concepts of leadership
(Barbuto & Wheeler, 2006). Improvement on the description of the characteristics of
servant leadership is required for comparison with other leadership styles.
Farling et al. (1999) proposed another model of servant leadership which consisted of
five variables: vision, influence, credibility, trust and service. They believed that these
five variables may improve the level of performance and self-actualisation of leaders
and followers (Searle, 2011). However, this model did not provide clear explanation of
the difference of servant leadership from other leadership concepts, such as
transformational leadership.
On the other hand, Russell and Stone (2002) believed that values and core beliefs are
antecedents to servant leadership. They have identified nine functional attributes from
literature review: vision, honesty, integrity, trust, service, modelling, pioneering,
appreciations of others and empowerment. Besides that, they also proposed eleven
attributes of servant leadership: communication, competence, visibility, credibility,
stewardship, influence, encouragement, delegation, persuasion, listening and teaching

25
(Searle, 2011). They found that values and core beliefs are the important for servant
leadership.
Variations in the descriptions of characteristics of servant leaders lead to difficulty in
precise conceptualisation of servant leadership (Bowman, 1997). Measurement of
servant leadership is difficult due to lack of consensus at the operational level.
Empirical testing of various characteristics of servant leadership has been refined by
researcher (Searle, 2011). Seven different measurements of servant leadership have
been developed. The measurements are: organisational leadership assessment (Laub,
1999), servant leadership profile (Page & Wong, 2000), one dimensional measure
(Ehrhart, 2004), servant leadership assessment instrument (Dennis & Bocarnea, 2005),
servant leadership questionnaire (Barbuto & Wheeler, 2006), servant leadership
behaviour scale (Sendjaya et al., 2008) and servant leadership assessment (Liden et al.,
2008). In this study, the servant leadership questionnaire developed by Barbuto and
Wheeler (2006) was chosen because the study was carried out in a more psychometric
way as compared to other studies.
Barbuto and Wheeler (2006) used the ten characteristics of servant leadership as
described by Spears (1995) in the development of their questionnaire. Besides that, they
improved Spears‟ description by adding one additional dimension termed calling,
because they realised that Greenleaf had repeatedly written about it. Questionnaire
items were created to measure the eleven characteristics. Validity was obtained through
literature and expert panel. Samples were collected from 80 elected officials and 388

26
raters. Exploratory factor analyses on the rater sample have resulted to five dimensions
(altruistic calling, emotional healing, wisdom, persuasive mapping and organisational
stewardship) are important in servant leadership. Confirmatory factor analysis carried
out on the leader sample also supported the five dimension structure. The use of both
exploratory and confirmatory factor analysis enhanced the reliability of the
measurement. Discriminate and convergent validity were used for this study as well. It
was more psychometric compared to the other measurements. Therefore, this study
utilised Barbuto and Wheeler‟s construct. The following describes the five dimensions.
2.3.1 Altruistic Calling
Altruistic calling is the desire to make positive changes in other‟s life (Barbuto &
Wheeler, 2006). Greenleaf (1970) stated that the motivation of leaders start with a
conscious choice to serve others. Leaders who are high in altruistic calling put the
followers‟ interest ahead and engage in acts of kindness that bring advantages to their
followers (Searle, 2011; Barbuto & Wheeler, 2006). They work to meet the followers‟
needs and facilitate the positive development of individuals, organisations, communities
and societies (Searle, 2011). The selfless and sacrificial acts of altruistic calling help
servant leaders to gain respect and loyalty from their followers. Altruistic calling is the
fundamental to servant leadership.
2.3.2 Emotional Healing
Emotional healing describes the willingness and skill of a leader to help the followers to
recover emotionally from hardship, setbacks and trauma (Barbuto & Wheeler, 2006).
27
Leaders with emotional healing ability are usually great listeners and empathetic
towards the desire, need and problems of their followers. Mutual trust is built and both
parties are encouraged to share their ideas, dreams, problems and concerns (Barbuto &
Wheeler, 2006; Searle, 2011). Leaders with the ability to provide emotional healing are
able to promote emotional stability among their followers (Dacher, 1999; Weymes,
2003). Emotional healing is a powerful skill in enhancing the relationship between
leaders and followers.
2.3.3 Wisdom
Wisdom is defined as the awareness of surroundings and ability to anticipate the
consequences and implications of their observations (Barbuto & Wheeler, 2006).
Leaders high in wisdom are alert and good at picking up cues from the environment.
They understand the interplay between their immediate context and the larger
surrounding environment (Barbuto & Wheeler, 2006). The observant and anticipatory
characteristics in leaders who are high in wisdom enable them to respond to changes
fast and take timely actions. Leaders high in wisdom are entrusted by their followers to
lead them through the changes of the organisation and its environment.
2.3.4 Persuasive Mapping
Persuasive mapping associates with the ability of leaders to use sound reasoning and
mental frameworks (Barbuto & Wheeler, 2006). Leaders high in persuasive mapping
are good at delineating issues and visualise possibilities. They are skilful at imparting
28
knowledge in a meaningful and relevant way for their followers. They are able to
influence others by providing compelling reasons and make the possibilities seem
exciting and motivating (Graham, 1991). This special ability enables individuals and
organisations to be creative and see greater possibility beyond normality (Barbuto &
Wheeler, 2006).
2.3.5 Organisational Stewardship
Organisational stewardship describes the commitment of a leader to prepare the
organisation to make positive contribution to the surrounding society, community and
environment (Barbuto & Wheeler, 2006). Leaders who practice organisational
stewardship are interested in satisfying the needs of multiple stakeholders and foster
social responsibility activities. They are committed to improve the well-being of the
community (Mahembe, 2010). It has been shown that pro-social and altruistic behaviour
are able to exert positive effects on observers (Batson et al., 2002). Hence, servant
leader who practice organisational stewardship are able to instil a sense of community
spirit in an organisation (Barbuto & Wheeler, 2006). Organisations are built to be
communities.
2.4 Servant Leadership and Organisational Commitment
The relationship between leadership and organisational commitment has been shown to
be positive by previous studies (Decotis & Summers, 1987; Eisenberger et al., 1990;
Nierhoff et al., 1990; Koopman, 1991; Meyer & Allen, 1997). The overall management
style driven by top management team is strongly related to the degree of employee
commitment (Nierhoff et al., 1990). Employees that have a good relationship with their
29
immediate work group have higher levels of commitment (Meyer & Allen, 1997).
Employees who favour their manager‟s style also favour the organisation more.
Eisenberger et al. (1990) showed that employees who feel that they are cared for by
their managers are more innovative and committed to the organisation. Therefore,
organisational commitment may be enhanced by practicing appropriate leadership style.
Servant leadership is positively related to important individual level behaviours. It has
been shown to be a possible antecedent to positive behaviours (Searle, 2011). Servant
leaders significantly influence followers through service itself (Stone et al., 2004). The
relationship between servant leadership and organisational commitment has been
proven to be positive (Liden et al., 2008). Organisational commitment, community
citizenship behaviour and in-role performance have been shown to be positively related
to servant leadership (Liden et al., 2008). A study of 501 full time sales people carried
out by Jaramillo et al. (2009) reported that servant leadership related to person
organisation fit, organisational commitment and turnover intention. Promotion of
servant leadership style in an organisation may help to enhance organisational
commitment.
Barbuto and Wheeler (2006) stated that servant leaders are altruistic, able to heal
emotionally, wise, persuasive and committed to make positive changes to surrounding
community. The values of empathy, integrity and competency of servant leaders foster
followers‟ trust (Washington et al. 2006). Trust resulting from leaders‟ value of
integrity provides a basis for followers to support their leader with enthusiasm and

30
confidence (Russell, 2001). This results in positive work experience that may enhance
organisational commitment (Meyer & Allen, 1997). Organisational commitment may be
fostered through development of covenantal relationship between servant leaders and
their followers.
Besides that, servant leaders inspire courage and hope in their followers by living out
convictions, giving encouragement and facilitating a positive outlook (Kouzes & Posner,
1993). They may foster positive follower attitude of commitment (Liden et al., 2008).
They lead their followers to see the greater possibilities beyond normality. More
satisfied and committed followers may be developed (Parolini et al., 2009). Therefore,
cultivation of servant leadership among managers may help to promote organisational
commitment.
In summary, the positive relationship between servant leadership and organisational
commitment has been proven by previous studies (Liden et al., 2008). The relationship
between each component of servant leadership and organisational commitment will be
studied in detail in this research.
2.5 Theoretical Framework
The aim of this study is to investigate whether servant leadership (altruistic calling,
emotional healing, wisdom, persuasive mapping and organisational stewardship) is
significantly related to organisational commitment (affective commitment, continuance

31
commitment and normative commitment). The theoretical framework of this study is
shown in Figure 2.1.
Figure 2.1
Theoretical framework: The Relationship between Servant Leadership and
Organisational Commitment
Independent Variables Dependent Variables
2.6 Hypotheses Development
2.6.1 The relationship between altruistic calling and affective commitment
The importance of organisational commitment has been highlighted in the review above.
The selfless and sacrificial acts of leaders high in altruistic calling help them to gain
respect and loyalty from the followers (Barbuto & Wheeler, 2006). Therefore, it is
suggested that altruistic calling is positively related to affective commitment. The
following hypothesis is proposed:
H1: Altruistic calling is positively related to affective commitment.
Servant leadership
Altruistic calling
Emotional healing
Wisdom
Persuasive mapping
Organisational
stewardship
Organisational commitment
Affective commitment
Continuance
commitment
Normative commitment

32
2.6.2 The relationship between altruistic calling and continuance commitment
Leaders high with altruistic calling are willing to sacrifice self-interest for the benefits
of others (Barbuto & Wheeler, 2006). This is valuable for followers. The fear of losing
a leader who is high in altruistic calling may be perceived as a potential cost of leaving
the organisation. Therefore, it is proposed that altruistic calling is positively related to
continuance commitment. The following hypothesis is proposed:
H2: Altruistic calling is positively related to continuance commitment.
2.6.3 The relationship between altruistic calling and normative commitment
Leaders high in altruistic calling have a desire to make positive changes in others lives
(Barbuto & Wheeler, 2006). Followers who have benefited from the altruistic acts of
the leaders may feel obliged to stay with the organisation. Therefore, altruistic calling
may have positive relationship with normative commitment. The following hypothesis
is proposed:
H3: Altruistic calling is positively related to normative commitment.
2.6.4 The relationship between emotional healing and affective commitment
Leaders with the ability of emotional healing have been shown to be able to provide
emotional stability and support to the entire organisation (Dacher, 1999; Weymes,
2003). Supervisory consideration and organisational support provided by leaders with
emotional healing power may enhance affective commitment (Allen & Meyer, 1991).
The following hypothesis is developed:
H4: Emotional healing is positively related to affective commitment.

33
2.6.5 The relationship between emotional healing and continuance commitment
Leaders with emotional healing ability are committed to assist others in spiritual
recovery from trauma and hardship (Spears, 1995; Barbuto & Wheeler, 2006). The
loyalty towards and the fear of losing a caring and empathetic leader may deter an
employee from leaving the organisation. It is believed that emotional healing is
positively related to continuance commitment. Therefore, the following hypothesis is
proposed:
H5: Emotional healing is positively related to continuance commitment.
2.6.6 The relationship between emotional healing and normative commitment
Emotional healing ability of servant leaders enables them to build trust and covenantal
relationship with the followers. Followers may feel obliged to work with the leader and
remain in the organisation. It is believed that emotional healing is positively related to
normative commitment. The following hypothesis is proposed:
H6: Emotional healing is positively related to normative commitment.
2.6.7 The relationship between wisdom and affective commitment
Servant leaders who are wisdom are able to monitor surrounding and make the best
possible decision (Greenleaf, 1970; Bierly et al., 2000). The ability of servant leaders to
identify changes of surroundings and make altruistic choices enables them to be
entrusted by their followers. They are believed to be able to lead the followers through
difficult situations and challenges. It is believed that wisdom is positively related to
affective commitment. The following hypothesis is proposed:
34
H7: Wisdom is positively related to affective commitment.
2.6.8 The relationship between wisdom and continuance commitment
Leaders high in wisdom are adept at picking up cues from the environment (Barbuto &
Wheeler, 2006). They are able to see the greater picture of the future and lead the
followers through challenges. Losing an observant and anticipatory leader may be
perceived as a cost of leaving the organisation. It is believed that wisdom has positive
relationship with continuance commitment. The following hypothesis is proposed:
H8: Wisdom is positively related to continuance commitment.
2.6.9 The relationship between wisdom and normative commitment
Servant leaders who are wisdom are aware of the changes in the surroundings and
anticipate consequences of actions (Mahembe, 2010). They are able to lead their
followers through changes and obstacles in the working environment. Followers may be
obliged to remain in the organisation in receipt of the special favour provided by servant
leaders (Meyer & Allen, 1991). The following hypothesis is proposed:
H9: Wisdom is positively related to normative commitment.
2.6.10 The relationship between persuasive mapping and affective
commitment
Servant leaders who practice persuasive mapping are good at mapping issues and
conceptualise possibilities (Barbuto & Wheeler, 2006). They use sound reasons to
persuade followers to act and grow with the organisation. The process may make the

35
followers to feel proud and emotionally attached to the leaders and the organisations.
The following hypothesis is proposed:
H10: Persuasive mapping is positively related to affective commitment.
2.6.11 The relationship between persuasive mapping and continuance
commitment
Leaders good at persuasive mapping are able to construct and conceptualise knowledge
in a meaningful and relevant way for followers (Barbuto & wheeler, 2006). They lead
their followers to visualise the future of the organisation and offer compelling reasons
to show that leaving the organisation is a non-transferable cost (Barbuto & Gifford,
2010). It is believed that persuasive mapping is positively related to continuance
commitment. Therefore, the following hypothesis is proposed:
H11: Persuasive mapping is positively related to continuance commitment.
2.6.12 The relationship between persuasive mapping and normative
commitment
Servant leaders who are good at persuasive mapping encourage their followers to work
for the future of the organisation (Barbuto & Wheeler, 2006). Followers feel morally
obliged to leaders who are able to help them grow and explore greater possibility
beyond normality. The relationship between persuasive mapping and normative
commitment has been shown in previous studies. The following hypothesis is developed:
H12: Persuasive mapping is positively related to normative commitment.
36
2.6.13 The relationship between organisational stewardship and affective
commitment
Leaders who foster social responsibility activities enhance the contribution of the
organisation to the surrounding community, society and environment (Barbuto &
Wheeler, 2006). They are able to cultivate community spirit in the workplace
(Mahambe, 2010). Emotional attachment of followers towards the organisation in
enhanced. It is believed that organisational stewardship is positively related to affective
commitment. The following hypothesis is proposed:
H13: Organisational stewardship is positively related to affective
commitment.
2.6.14 The relationship between organisational stewardship and
continuance commitment
Servant leaders who practice organisational stewardship take care of the well-being of
the community (Barbuto & Wheeler, 2006). They prepare their followers to contribute
to the community and strengthen the relationship between employees and the local
community indirectly. Disruption of personal relationship that is perceived as a non-
transferable investment is a potential cost of leaving the organisation (Reichers, 1985).
It is believed that organisational stewardship is positively related to continuance
commitment. The following hypothesis is proposed:
H14: Organisational stewardship is positively related to continuance
commitment.

37
2.6.15 The relationship between organisational stewardship and normative
commitment
Leaders who practice organisational stewardship are committed to make positive
changes in the status quo of the community (Mahembe, 2010). Pro-social behaviours
practiced by them may exert positive effect on the followers (Batson et al., 2002). They
may feel morally obliged to follow the leaders who make great contributions to the local
community. It is believed that organisational stewardship is positively related to
normative commitment. The following hypothesis is proposed:
H15: Wisdom is positively related to normative commitment.
2.7 Summary
This chapter gives an overview of the organisational commitment and the three
associated dimensions: affective commitment, continuance commitment and normative
commitment. The concepts of servant leadership including its five dimensions (altruistic
calling, emotional healing, wisdom, persuasive mapping and organisational stewardship)
are d
38
CHAPTER 3
RESEARCH METHODOLOGY
3.1 Introduction
This chapter discusses the research methodology. The research design, variables and
measurement, data collection method and data analysis techniques are covered in detail.
3.2 Research Design
This research employs a cross-sectional correlational method, which is a quantitative
research method. The relationship between the independent and dependent variables as
stated in the theoretical framework and hypotheses was tested. Self-administered
questionnaires accompanied by cover letter were distributed and collected within the
sampling frame. The data were gathered over three weeks starting from the end of
March to the middle of April 2012. All of the data collected are the original answers
given by respondents.
3.3 Population and Sampling Frame
The population of this study consisted of executive staff grade 34 to grade 36 working
in the CIMB Bank in Penang. The sampling frame was the executive staff from grade
34 to grade 36 working in the CIMB Bank. The unit of analysis for this study was the
individual bank executive staff.

39
3.4 Sampling Techniques
Questionnaires were distributed to the CIMB Banks in Penang using probability
sampling method at the first stage and non-probability sampling method at the second
stage. According to Sekaran (2003), probability sampling is the least bias sampling
method as each element of the population is given equal chance to be selected. The
types of probability sampling include simple random sampling, systematic sampling,
stratified random sampling and cluster sampling. On the other hand, non-probability
sampling is not conducted according to probability (Sekaran, 2003). However, this is
the only way to collect data, as described below.
At the first stage, CIMB Banks in the North East region of Penang Island were chosen
using cluster sampling method. Cluster sampling involves division of target population
into clusters at which samples are then drawn from the clusters (Sekaran & Bougie,
2010). It is less expensive and offers more heterogeneity within groups and more
homogeneity among groups (Sekaran & Bougie, 2010). From the CIMB Bank official
website, there are 28 CIMB Banks in Penang state. The clusters were divided according
to the five administrative districts in the state of Penang: North East region of Penang
Island, South West region of Penang Island, North Seberang Perai, Central Seberang
Perai and South Seberang Perai. The CIMB Banks in the North East region of Penang
Island were selected. There are 12 CIMB Banks located in the North East Penang Island
region. Out of the 12 branches, only 10 agreed to participate in the survey.

40
At the second stage, the questionnaires were distributed to all of the participating CIMB
Banks using convenience sampling method. This is because the participating branches
refused to disclose the name list of the employees to protect employee confidentiality.
The questionnaires were distributed by representatives from each branch. The
researcher has no control over the distribution of questionnaires within each branch. A
total of 160 questionnaires were distributed to the 10 branches. The breakdown of the
distribution of questionnaire for each branch is shown in Table 3.1 below.
Table 3.1
Distribution of Questionnaires to CIMB Bank
No. CIMB Bank Branches Number of Questionnaires Distributed
1. Branch A 15
2. Branch B 18
3. Branch C 16
4. Branch D 20
5. Branch E 15
6. Branch F 17
7. Branch G 20
8. Branch H 22
9. Branch I 10
10. Branch J 7
Total 160
\
41
3.5 Questionnaire Design
In this study, a five-page questionnaire which consisted of 48 close-ended questions
was employed. There were three parts in this questionnaire, part A, B and C. Part A
covered 7 questions that gather the background information of the respondents.
Part B covered 23 questions that measure the five dimensions of servant leadership.
There were four items that measured altruistic calling, four items that measured
emotional healing, five items that measured wisdom, five items that measured
persuasive mapping and five items that measured organisational stewardship.
Part C covered 18 questions that measured the three components of organisational
commitment. Each of the components (affective commitment, continuance commitment
and normative commitment) was covered by six items.
The questionnaire was composed in English language and had a cover letter that
described the purpose of the study. The cover letter and the questionnaire used for the
study are shown in Appendix A.
3.6 Questionnaire Measurement
All of the measuring scales for the questionnaire were adopted from previous studies to
ensure validity and reliability, as shown in the Table 3.2. The questions for
demographic background were developed by the researcher. All of the scales for the
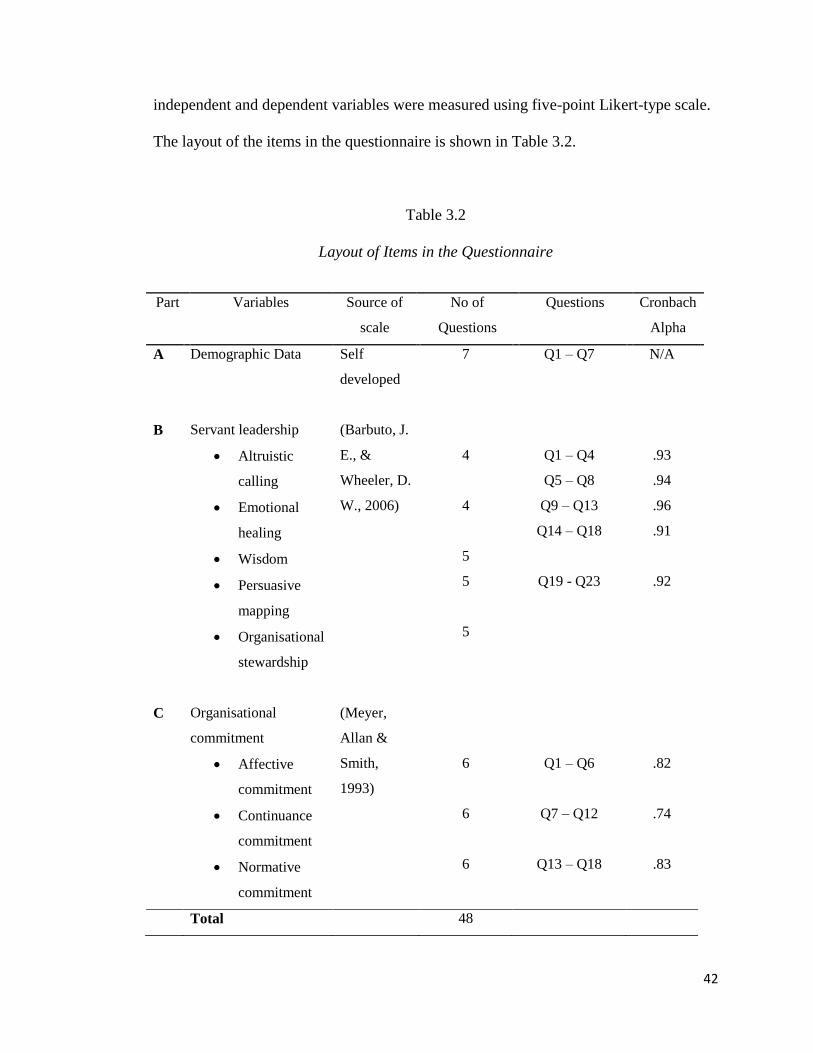
42
independent and dependent variables were measured using five-point Likert-type scale.
The layout of the items in the questionnaire is shown in Table 3.2.
Table 3.2
Layout of Items in the Questionnaire
Part Variables Source of
scale
No of
Questions
Questions Cronbach
Alpha
A Demographic Data Self
developed
7 Q1 – Q7 N/A
B Servant leadership
Altruistic
calling
Emotional
healing
Wisdom
Persuasive
mapping
Organisational
stewardship
(Barbuto, J.
E., &
Wheeler, D.
W., 2006)
4
4
5
5
5
Q1 – Q4
Q5 – Q8
Q9 – Q13
Q14 – Q18
Q19 - Q23
.93
.94
.96
.91
.92
C Organisational
commitment
Affective
commitment
Continuance
commitment
Normative
commitment
(Meyer,
Allan &
Smith,
1993)
6
6
6
Q1 – Q6
Q7 – Q12
Q13 – Q18
.82
.74
.83
Total 48

43
3.6.1 Independent Variables
As shown in the theoretical framework in Figure 2.1, the independent variable in this
study was servant leadership that consisted of five dimensions: altruistic calling,
emotional healing, wisdom, persuasive mapping and organisational stewardship.
The measurement developed by Barbuto and Wheeler (2006) was used for this study.
The survey consists of twenty three items which measure the five dimensions of servant
leadership (altruistic calling, emotional healing, wisdom, persuasive mapping and
organisational stewardship). These items were measured using the five-point Likert-
type scale. The scale is from (1) “never” to (5) “always”. The Cronbach alpha for
altruistic calling is .93, .94 for emotional healing, .96 for wisdom, .91 for persuasive
mapping and .92 for organisational stewardship.
3.6.2 Dependent Variable
The dependent variable for this study was the organisational commitment. The
questions were covered in Section C and were adopted from Meyer and Allen (1993)
Organisational Commitment Questionnaire. The questionnaire consisted of eighteen
questions that covered three components of organisational commitment that is affective
commitment, continuance commitment and normative commitment. The items were
measure using five-point Likert-type scale. The scale ranged from (1) “strongly disagree”
to (5) “strongly agree”. The Cronbach alpha for affective commitment is .82, .74 for
continuance commitment and .83 for normative commitment.
44
3.7 Data Collection Method
Primary data were collected using structured questionnaires. Each set of questionnaire
accompanied by a brief cover letter was distributed to respondents. The questionnaires
were distributed through the representative (branch manager) of each CIMB branch.
Personal visits and phone calls were made to the CIMB Bank to ask for permission for
distribution of questionnaires. Out of the twelve CIMB Bank in the North East Penang
Island, two branches refused the request because the employees were busy and did not
have time to answer the questionnaire. The other branches allowed the distribution of
questionnaire. The questionnaires were distributed and collected by the representative
(branch manager) from the bank on the researcher‟s behalf. Reminders to the
representatives (branch managers) were made by phone call and personal visit before
collection of questionnaires. Some empty and partially completed survey forms were
returned. The overall process went on smoothly. The process of distribution and
collection of questionnaires was completed within three weeks from the end of March
to the middle of April.
3.8 Statistical Techniques
The data analysis was carried out with the Statistical Package for Social Science (SPSS)
programme, version 15.0. Data processing steps that were carried out include coding,
editing, data reliability testing, correlation analysis and multiple regression analysis.
The data analysis techniques that have been used for this study are discussed below.

45
3.8.1 Descriptive Analysis
The respondents‟ demographic details (gender, age, educational level, position level,
working experience, working experience with current supervisor and gender of current
supervisor) were analysed using descriptive statistics to obtain the frequencies and
percentage. Furthermore, the mean and standard deviation were computed for the
independent variables (altruistic calling, emotional healing, wisdom, persuasive
mapping and organisational stewardship) and the dependent variables (affective
commitment, continuance commitment and normative commitment).
3.8.2 Factor Analysis
Factor analysis is a data reduction technique. It summarises large set of variables using
a smaller set of factors or components. It was performed with minimum loss of
information (Sekaran, 2003). In this study, principal components factor analysis with
varimax rotation was conducted to simplify the columns of the factor matrix.
The extraction technique employed was the principal components analysis because it
provided an empirical summary of the data set (Tabachnick & Fidell, 2007).
The factor analyses were verified using the Bartlett Test of Sphericity and Kaiser
Meyer-Olkin (KMO) value for the overall test and each individual value in the anti-
correlation matrix. Barlett Test of Sphericity should be significant (p < .50) for the
factor analysis to be considered appropriate (Hair et al., 1998). The minimum
acceptable value for KMO was .50. The items below .50 were dropped from the data

46
analysis. The acceptable values for the measure of sampling adequacy (MSA) for each
item was .50 and above.
After testing the assumptions and correlation between factors, the number of factors to
be extracted may be determined by using the priori criterion. Items were loaded
according to the factors. Igbaria et al. (1995) suggested loading of .60 or higher on a
specific factor and loading of not higher than .36 on other factors. Based on the loadings,
the items were regrouped into the variables accordingly.
3.8.3 Reliability Analysis
After factor analysis was done, reliability analysis was carried out to check for internal
consistency. Cronbach alpha coefficient was chosen as the indicator because it is the
most widely used measure of reliability (Hair et al., 2010).
The reliability is better when the value for Cronbach alpha is higher (Sekaran & Bougie,
2010). The minimum value of acceptability for Conbach alpha value is between 0.60
and 0.70 (Hair et al., 2010).
3.8.4 Correlation Analysis
Correlational analysis was carried out to determine the degree of relationship between
the variables. Pearson‟s correlation coefficient was used for this study. When there is
perfect positive relationship between two variables, the correlation coefficient equals to
47
+1. When there is no relationship, the correlation coefficient equals to 0, and when there
is perfect negative relationship, the correlation coefficient equals to -1 (Keller, 2009).
3.8.5 Multiple Regression Analysis
Multiple regression analysis was performed to determine whether the independent and
dependent variables are correlated and also the degree of the correlation. This analysis
may be employed to predict the relationship between one dependent variable and a few
independent variables (Hair et al., 2010).
Multiple regression analysis is appropriate when the independent and dependent
variables are metric data (Hair et al., 2010). For this study, the dependent and
independent variables are metric data, therefore appropriate for analysis with multiple
regression analysis.
Before the application of multiple regression analysis, the assumptions must be tested
and the corrective actions must be taken (Hair et al., 2010). The assumptions that were
tested are normality of the error term distribution; linearity of the relationship; constant
variance of the error term; independence of the error terms; multicollinearity and
singularity; and outliers.
a. Normality of the Error Term Distribution
Multiple regression may be applied when all the variables are normally distributed
(Jason & Waters, 2002). Normal distribution may be checked by looking at the shape of
48
histogram. Bell-shaped histogram indicates normal distribution. Besides that, normal
probability plot may help to check normality as well (Hair et al., 2010). The residual
line that closely follows the diagonal line indicates a normal distribution.
b. Linearity of the Relationship
The relationship between variables can only be accurately estimated by multiple
regression analysis if the relationship is linear. This means that the relationship between
the two variables is a straight line (Tabachnick & Fidell, 2007). Therefore, checking of
linearity between variables is essential. The relationship may be assessed by checking
the scatter plot and the partial regression plot. The scatter plot shows the relationship
between two variables while the partial regression plot shows the effect of effect of
adding an additional variable to the model. The partial regression plot may help to
assess the linearity of the relationship of one single independent variable to the
dependent variable. The relationship is linear when the plot is oval-shaped (Tabachnick
& Fidell, 2007).
c. Constant Variance of the Error Term (Homoscedasticity)
The third assumption is that the variance of errors is the same across all levels of the
independent variables. This may be termed as homoscedasticity. According to
Tabachnick and Fidell (2007), slight differ of the variance of errors among the
independent variables has little effect on significance tests. However, it may lead to
serious distortion of findings and weaken the analysis when heteroscedasticity is
marked.

49
Homoscedasticity may be assessed by looking at the scatter plot. A homoscedatic
relationship would give an oval-shaped of scatter plot. Besides that, homoscedasticity
may also be assessed by plotting the residuals against the predicted dependent variable
(Hair et al., 2010). The variance is homoscedatic when there is no pattern in the plot.
d. Independence of the Error Terms (Autocorrelation)
The fourth assumption is the independence of the error terms. This means that the errors
of prediction are independent of one another (Tabachnick & Fidell, 2007). Error terms
that are correlated over time are said to be autocorrelated (Keller, 2009). The
assumption is violated when there is autocorrelation.
Autocorrelation may be assessed by plotting the residuals against any possible
sequencing variables over time (Hair et al., 2010). Constant pattern in the residuals
indicate the presence of autocorrelation. The second way to access autocorrelation is by
carrying out the Durbin-Watson test. Durbin-Watson values that range between 1.40
and 2.50 indicate the absence of serious autocorrelation problem (Yasin et al., 2009).
e. Multicollinearity and Singularity
Multicollinearity refers to the situation in which the independent variables are highly
linearly related. Singularity refers to the perfect correlation among the independent
variables. The assessment of tolerance value and variance inflation factor (VIF) may be
used to detect multicollinearity. A tolerance value of more than .10 and a VIF value of
50
less than 10 for each of the variables indicate the absence of serious problem with
multicollinearity (Hair et al., 2010).
f. Outliers
Outliers are results that deviate markedly from the other results in the sample. They
may give serious impact to the regression solution (Coakes et al., 2009). Outliers are
advised to be deleted or modified to reduce their influence (Coakes et al., 2009).
The hypotheses may be tested by looking at the standardised coefficients (β) and the
coefficient of determination (R2). The standardised coefficients show the relative
predictive power (Hair et al. 2010). The coefficient of determination measures the
proportion of the variance of the dependent variable that is explained by the
independent variables (Hair et al, 2010). The explanatory power of the regression
equation is higher when the value of R2
is higher.
3.9 Summary
This study was a cross-sectional, correlational study that examines the relationship
between servant leadership and organisational commitment. Data were collected using
structured questionnaires. The validity and reliability of the measurement scales used in
the questionnaire were assured as they were taken from authoritative academic
researchers. Questionnaires were distributed using probability and non-probability
sampling method.

51
Data analyses were carried out using SPSS 15.0. Descriptive statistics, factor analysis,
reliability analysis, correlation analysis and multiple regression analysis were run by
using the software.
52
CHAPTER 4
ANALYSIS OF RESULTS
4.1 Introduction
This chapter presents the results of data analysis. The respondents‟ demographic profile
was presented in table form. The independent and dependent data were analysed using
stepwise statistical analyses such as factor analysis, reliability analysis, descriptive
statistics, correlation analysis and multiple regression analysis. Finally, the results of the
hypothesis testing were presented.
4.2 Overview of Data Collected
A total of 160 questionnaires were distributed to ten CIMB Banks in North East region
of Penang Island. 111 questionnaires were collected back, which gave a response rate of
69%. Out of the 111 questionnaires, 4 were incompletely filled. They were excluded
from the sample. Therefore, only 107 questionnaires were used for data analysis, which
gave a final response rate of 67%. The breakdown of the questionnaires collected from
each bank is shown in Table 4.1.
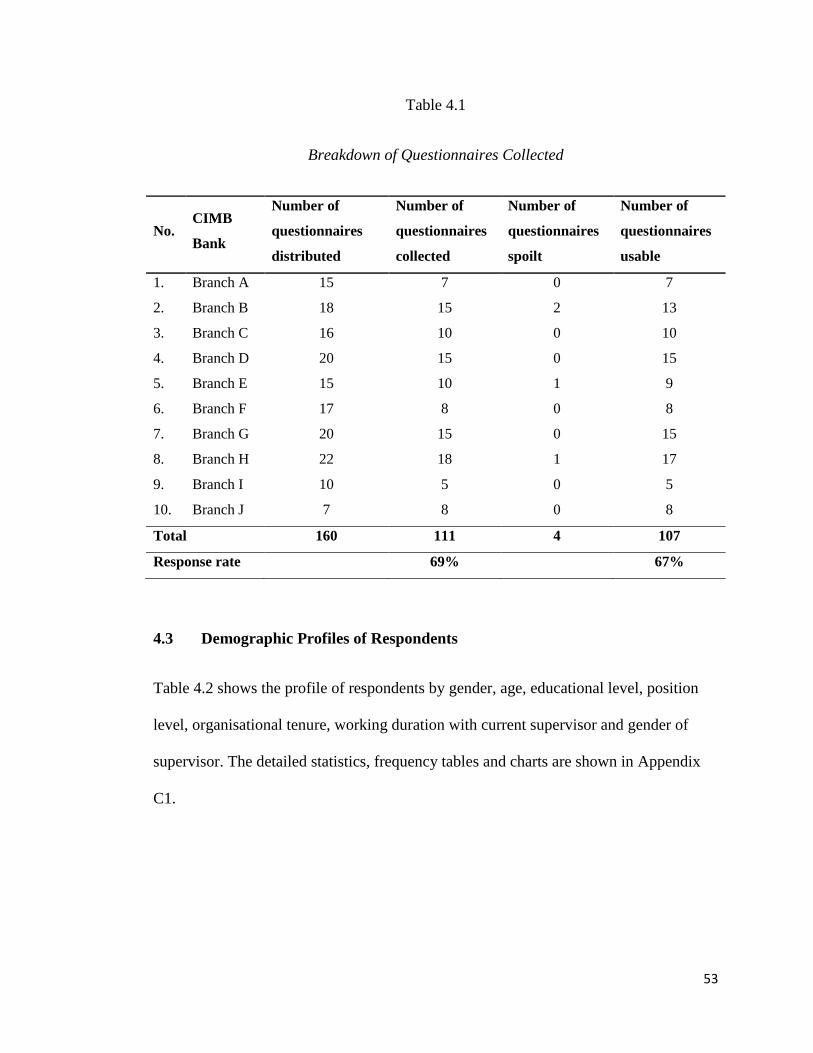
53
Table 4.1
Breakdown of Questionnaires Collected
No. CIMB
Bank
Number of
questionnaires
distributed
Number of
questionnaires
collected
Number of
questionnaires
spoilt
Number of
questionnaires
usable
1. Branch A 15 7 0 7
2. Branch B 18 15 2 13
3. Branch C 16 10 0 10
4. Branch D 20 15 0 15
5. Branch E 15 10 1 9
6. Branch F 17 8 0 8
7. Branch G 20 15 0 15
8. Branch H 22 18 1 17
9. Branch I 10 5 0 5
10. Branch J 7 8 0 8
Total 160 111 4 107
Response rate 69% 67%
4.3 Demographic Profiles of Respondents
Table 4.2 shows the profile of respondents by gender, age, educational level, position
level, organisational tenure, working duration with current supervisor and gender of
supervisor. The detailed statistics, frequency tables and charts are shown in Appendix
C1.
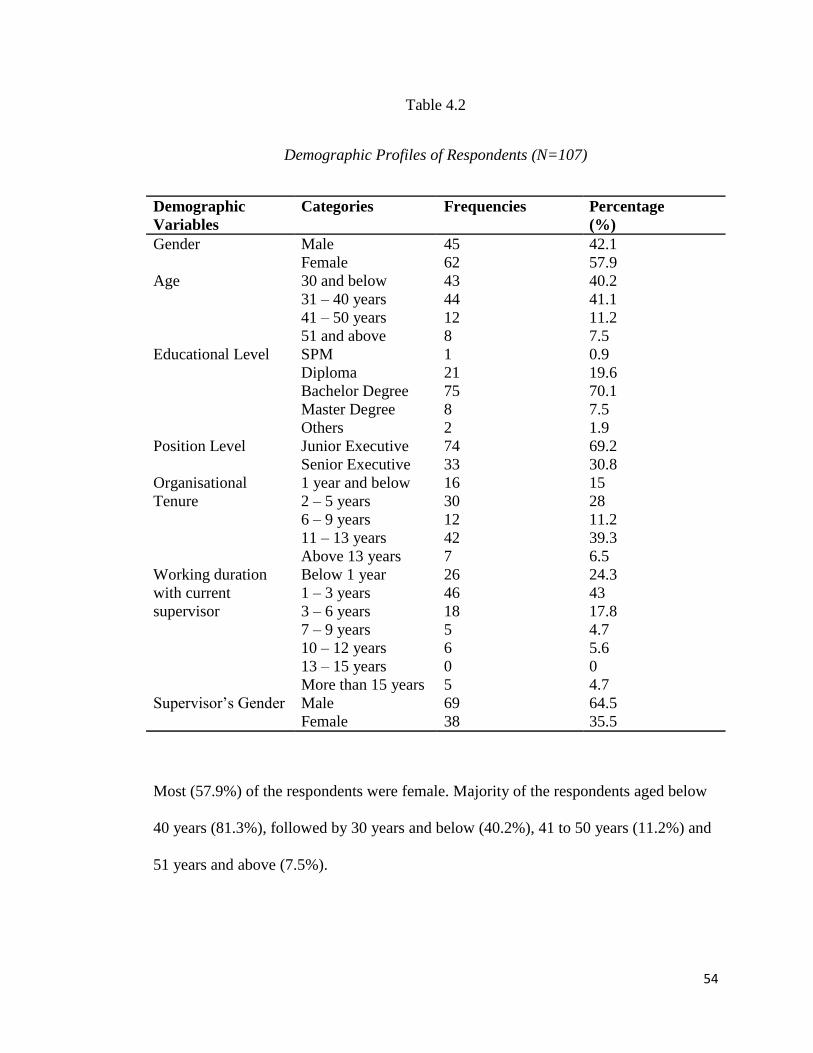
54
Table 4.2
Demographic Profiles of Respondents (N=107)
Demographic
Variables
Categories Frequencies Percentage
(%)
Gender Male 45 42.1
Female 62 57.9
Age 30 and below 43 40.2
31 – 40 years 44 41.1
41 – 50 years 12 11.2
51 and above 8 7.5
Educational Level SPM 1 0.9
Diploma 21 19.6
Bachelor Degree 75 70.1
Master Degree 8 7.5
Others 2 1.9
Position Level Junior Executive 74 69.2
Senior Executive 33 30.8
Organisational
Tenure
1 year and below 16 15
2 – 5 years 30 28
6 – 9 years 12 11.2
11 – 13 years 42 39.3
Above 13 years 7 6.5
Working duration
with current
supervisor
Below 1 year 26 24.3
1 – 3 years 46 43
3 – 6 years 18 17.8
7 – 9 years 5 4.7
10 – 12 years 6 5.6
13 – 15 years 0 0
More than 15 years 5 4.7
Supervisor‟s Gender Male 69 64.5
Female 38 35.5
Most (57.9%) of the respondents were female. Majority of the respondents aged below
40 years (81.3%), followed by 30 years and below (40.2%), 41 to 50 years (11.2%) and
51 years and above (7.5%).
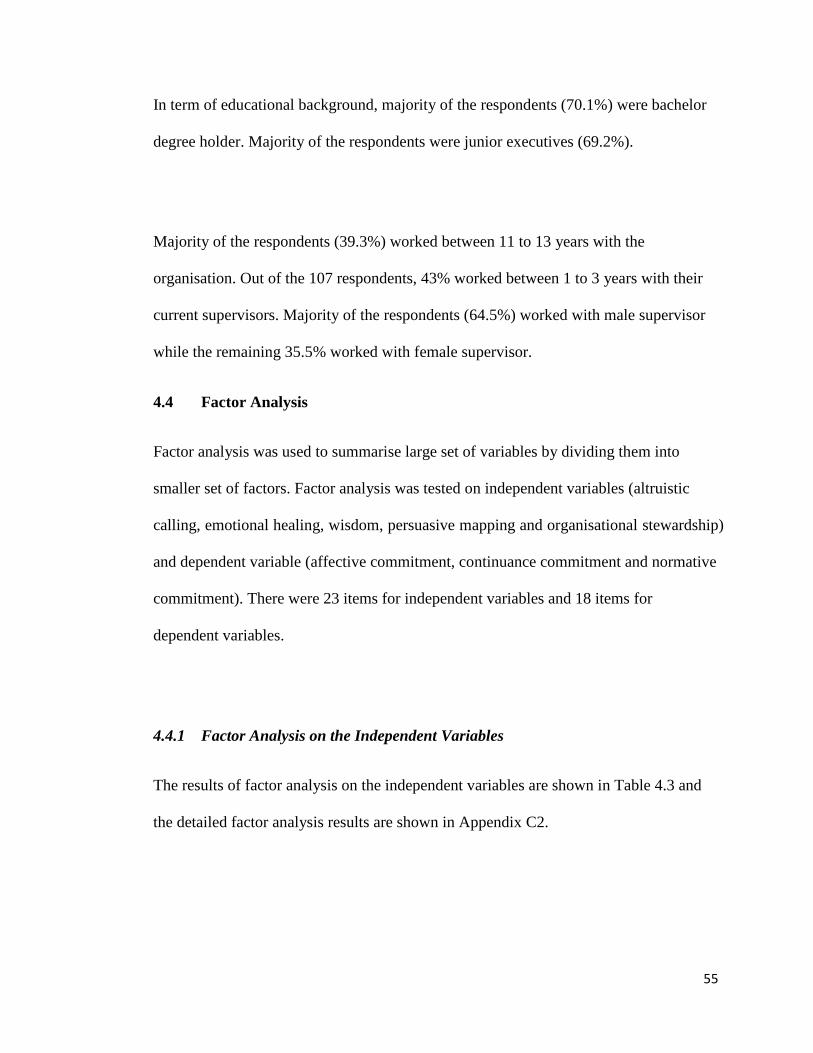
55
In term of educational background, majority of the respondents (70.1%) were bachelor
degree holder. Majority of the respondents were junior executives (69.2%).
Majority of the respondents (39.3%) worked between 11 to 13 years with the
organisation. Out of the 107 respondents, 43% worked between 1 to 3 years with their
current supervisors. Majority of the respondents (64.5%) worked with male supervisor
while the remaining 35.5% worked with female supervisor.
4.4 Factor Analysis
Factor analysis was used to summarise large set of variables by dividing them into
smaller set of factors. Factor analysis was tested on independent variables (altruistic
calling, emotional healing, wisdom, persuasive mapping and organisational stewardship)
and dependent variable (affective commitment, continuance commitment and normative
commitment). There were 23 items for independent variables and 18 items for
dependent variables.
4.4.1 Factor Analysis on the Independent Variables
The results of factor analysis on the independent variables are shown in Table 4.3 and
the detailed factor analysis results are shown in Appendix C2.

56
The Kaiser-Meyer-Olkin (KMO) measure of sampling adequacy for the overall test
was .89. The KMO value should be above .50 for a satisfactory factor analysis to
proceed (Hinton et. al., 2004). Therefore, the KMO value for the test is more than
satisfactory and the factor analysis may be carried out.
The Bartlett‟s Test of Sphericity was significant (p < .01). Four factors were extracted
from the analysis with total variance explained of 71.33%. Item with loadings of less
than .50 is considered as poor loading. One item from altruistic calling, AC1, was
dropped from further analysis due to poor loading ( .47). The other items were retained.
Six items were loaded into the first and second factors respectively and five items were
loaded into the third and fourth factors respectively.
Table 4.3
Rotated Factors and Factor Loadings for Independent Variables
Items Components
1 2 3 4
EH3 My supervisor is talented at helping me to
heal emotionally. .89
EH4 My supervisor is one that could help me
mend my hard feelings. .87
EH2 My supervisor is good at helping me with
my emotional issues. .82
EH1 My supervisor is one I would turn to if I
had a personal trauma. .78
AC4 My supervisor goes above and beyond the
call of duty to meet my needs. .63 .39 .31
AC3 My supervisor sacrifices his/her own
interests to meet my needs. .61 .37 .43
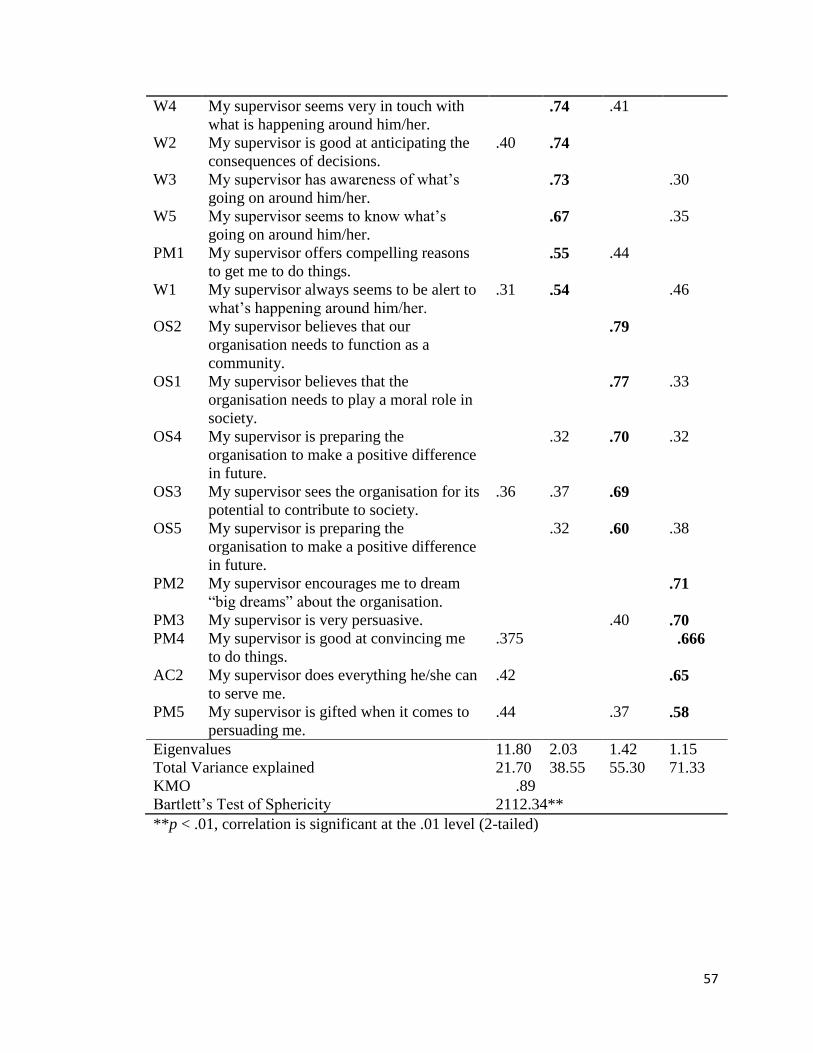
57
W4 My supervisor seems very in touch with
what is happening around him/her.
.74 .41
W2 My supervisor is good at anticipating the
consequences of decisions.
.40 .74
W3 My supervisor has awareness of what‟s
going on around him/her.
.73 .30
W5 My supervisor seems to know what‟s
going on around him/her.
.67 .35
PM1 My supervisor offers compelling reasons
to get me to do things.
.55 .44
W1 My supervisor always seems to be alert to
what‟s happening around him/her.
.31 .54 .46
OS2 My supervisor believes that our
organisation needs to function as a
community.
.79
OS1 My supervisor believes that the
organisation needs to play a moral role in
society.
.77 .33
OS4 My supervisor is preparing the
organisation to make a positive difference
in future.
.32 .70 .32
OS3 My supervisor sees the organisation for its
potential to contribute to society.
.36 .37 .69
OS5 My supervisor is preparing the
organisation to make a positive difference
in future.
.32 .60 .38
PM2 My supervisor encourages me to dream
“big dreams” about the organisation.
.71
PM3 My supervisor is very persuasive. .40 .70
PM4 My supervisor is good at convincing me
to do things.
.375 .666
AC2 My supervisor does everything he/she can
to serve me.
.42 .65
PM5 My supervisor is gifted when it comes to
persuading me.
.44 .37 .58
Eigenvalues 11.80 2.03 1.42 1.15
Total Variance explained 21.70 38.55 55.30 71.33
KMO .89
Bartlett‟s Test of Sphericity 2112.34**
**p < .01, correlation is significant at the .01 level (2-tailed)

58
4.4.2 Factor Analysis on the Dependent Variables
Factor analysis was performed on dependent variables. The KMO value was .73 with
significant Bartlett‟s Test of Sphericity (p < .1). Five factors were extracted from the
analysis and the total variance explained was 63.97%. Seven items were extracted into
the first factor, four items were extracted into the second factor, three items were
extracted into the third factor, one item was extracted into the fourth factor and two
items were extracted into the fifth factor. One item, NC1, with loading of less than .50
was dropped from further analysis.
The results of the factor analysis on the dependent variables are shown in Table 4.4.
The detailed factor analysis results are shown in Appendix C3.
Table 4.4
Rotated Factors and Factor Loadings for Dependent Variables
Items Components
1 2 3 4 5
A1 I would be very happy to spend the
rest of my life with this organisation. .79
NC6 I owe a great deal to my organisation. .79
A2 I really feel as if this organisation‟s
problems are my own. .74
NC3 I would feel guilty if I left this
organisation now. .73
NC5 I would not leave my organisation
right now because I have a sense of
obligation to the people in it.
.69 .49
NC4 This organisation deserved my
loyalty. .64 .34
A6 This organisation has a great deal of
personal meaning for me. .57 .34
59
CC3 Too much of my life would be
disrupted if I decided I wanted to
leave my organisation now.
.80
CC2 It would be very hard for me to leave
my organisation right now, even if I
wanted to.
.66
CC4 I feel that I have too few options to
consider leaving this organisation.
.62 .31
NC2 Even if it were to my advantage, I do
not feel it would be right to leave my
organisation now.
.40 .58
A5 I do not feel like part of the family at
my organisation.
.85
A4 I do not feel emotionally attached to
this organisation.
.82
A3 I do not feel a strong sense of
belonging to my organisation.
.35 .67
CC1 Right now, staying with my
organisation is a matter of necessity as
much as desire.
.79
CC5 If I had not already put so much of
myself into this organisation, I might
consider working elsewhere.
.67
CC6 One of the few negative consequences
of leaving this organisation would be
the scarcity of available alternatives.
.42 .56
Eigenvalues 5.22 2.30 1.72 1.27 1.00
Total Variance explained 21.87 15.11 12.13 7.45 7.41
KMO .73
Bartlett‟s Test of Sphericity 753.10**
**p < .01, correlation is significant at the .01 level (2-tailed)
4.5 Reliability Analysis
After factor analysis, reliability analysis was performed to the items in their respective
variables. According to Hair et al. (2010), the minimum acceptable level of Cronbach‟s
alpha value is between .60 and .70. All of the reliability coefficients for the independent
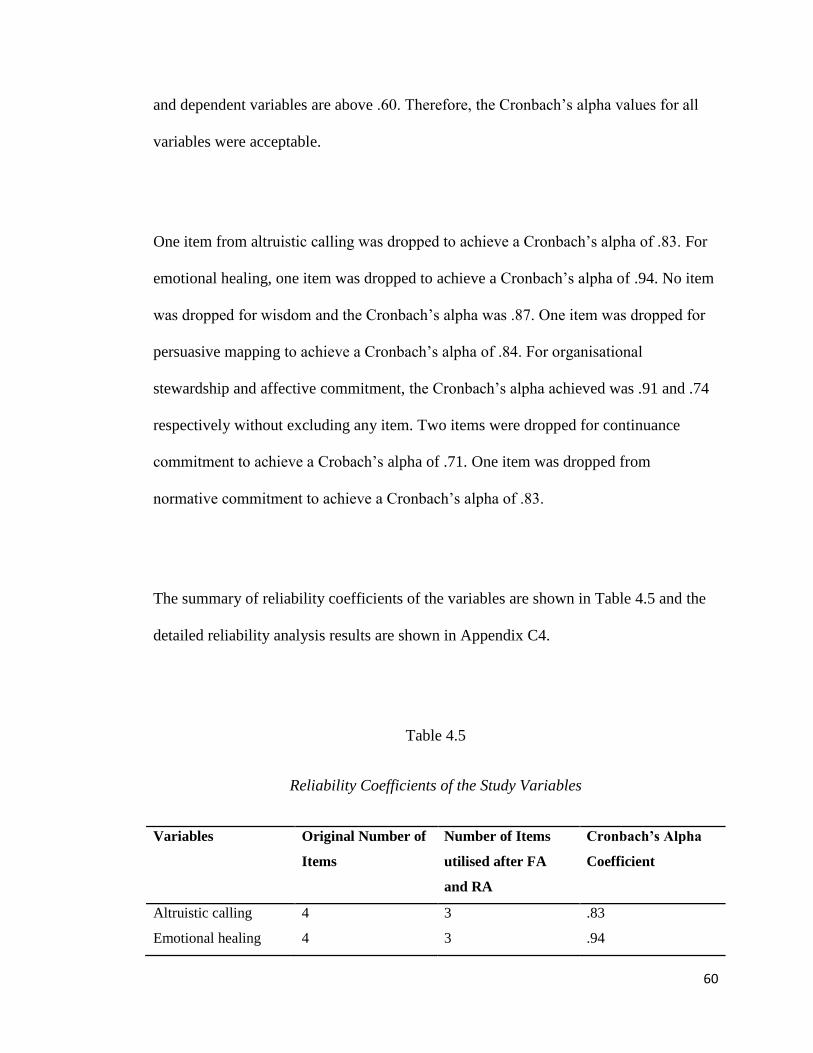
60
and dependent variables are above .60. Therefore, the Cronbach‟s alpha values for all
variables were acceptable.
One item from altruistic calling was dropped to achieve a Cronbach‟s alpha of .83. For
emotional healing, one item was dropped to achieve a Cronbach‟s alpha of .94. No item
was dropped for wisdom and the Cronbach‟s alpha was .87. One item was dropped for
persuasive mapping to achieve a Cronbach‟s alpha of .84. For organisational
stewardship and affective commitment, the Cronbach‟s alpha achieved was .91 and .74
respectively without excluding any item. Two items were dropped for continuance
commitment to achieve a Crobach‟s alpha of .71. One item was dropped from
normative commitment to achieve a Cronbach‟s alpha of .83.
The summary of reliability coefficients of the variables are shown in Table 4.5 and the
detailed reliability analysis results are shown in Appendix C4.
Table 4.5
Reliability Coefficients of the Study Variables
Variables Original Number of
Items
Number of Items
utilised after FA
and RA
Cronbach’s Alpha
Coefficient
Altruistic calling 4 3 .83
Emotional healing 4 3 .94
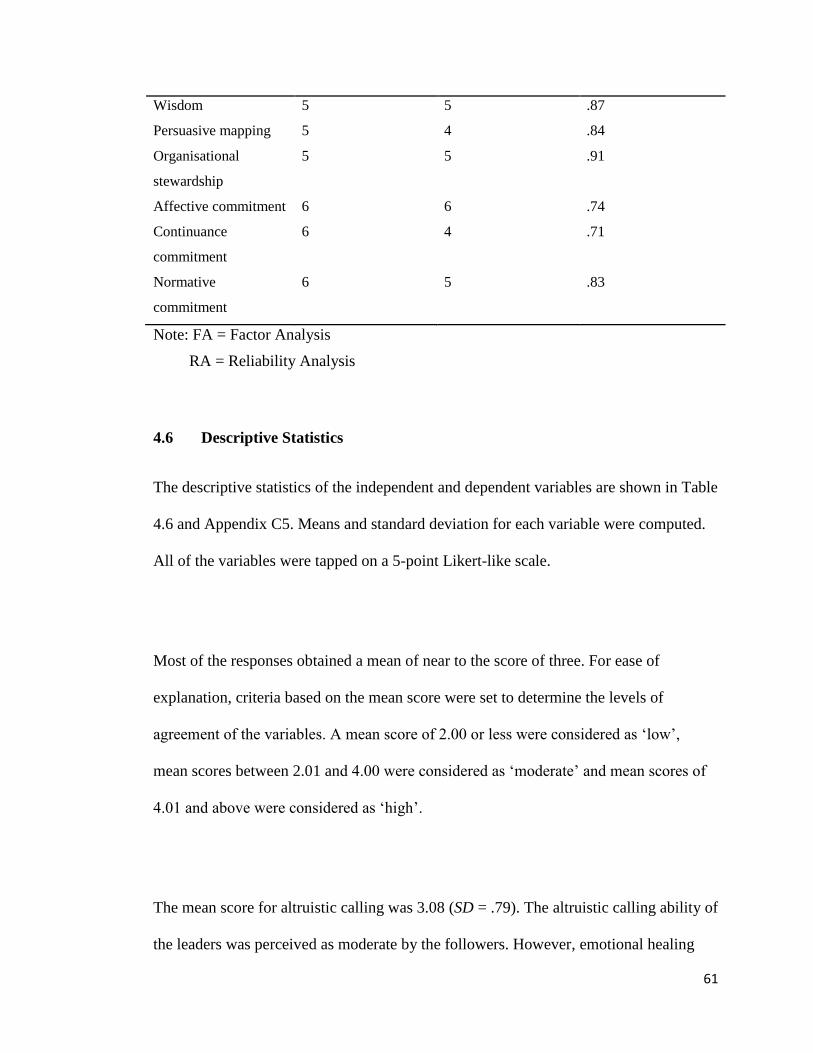
61
Wisdom 5 5 .87
Persuasive mapping 5 4 .84
Organisational
stewardship
5 5 .91
Affective commitment 6 6 .74
Continuance
commitment
6 4 .71
Normative
commitment
6 5 .83
Note: FA = Factor Analysis
RA = Reliability Analysis
4.6 Descriptive Statistics
The descriptive statistics of the independent and dependent variables are shown in Table
4.6 and Appendix C5. Means and standard deviation for each variable were computed.
All of the variables were tapped on a 5-point Likert-like scale.
Most of the responses obtained a mean of near to the score of three. For ease of
explanation, criteria based on the mean score were set to determine the levels of
agreement of the variables. A mean score of 2.00 or less were considered as „low‟,
mean scores between 2.01 and 4.00 were considered as „moderate‟ and mean scores of
4.01 and above were considered as „high‟.
The mean score for altruistic calling was 3.08 (SD = .79). The altruistic calling ability of
the leaders was perceived as moderate by the followers. However, emotional healing
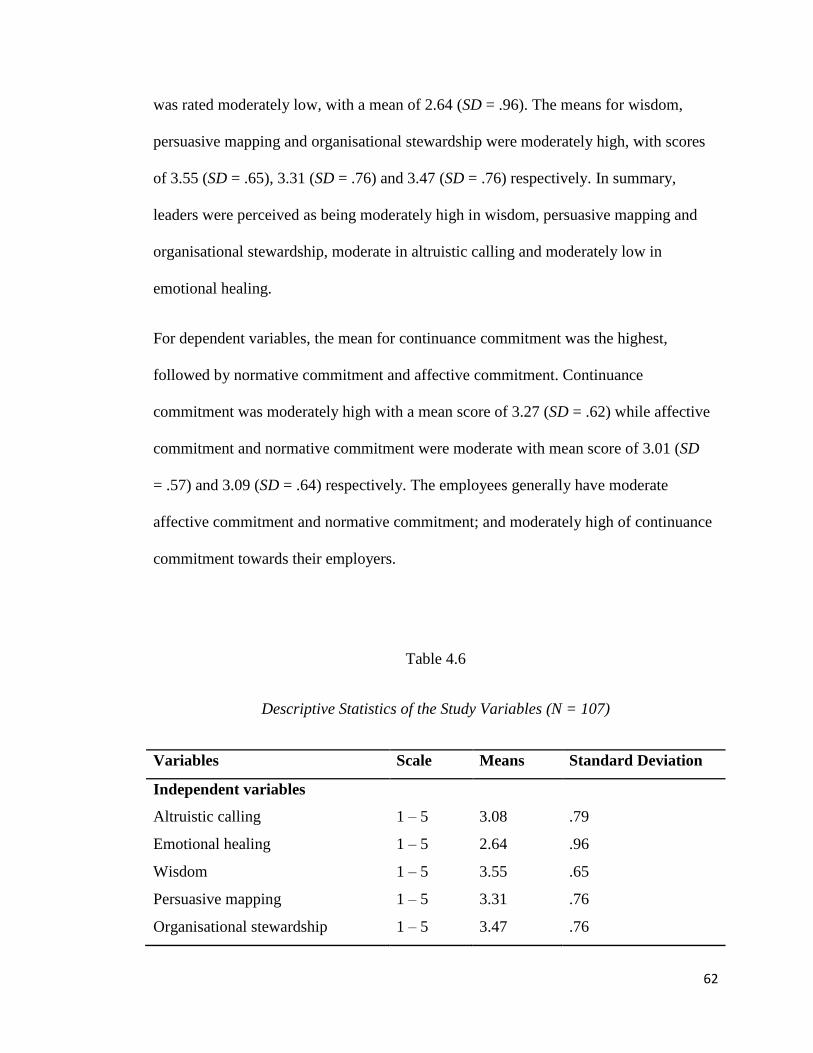
62
was rated moderately low, with a mean of 2.64 (SD = .96). The means for wisdom,
persuasive mapping and organisational stewardship were moderately high, with scores
of 3.55 (SD = .65), 3.31 (SD = .76) and 3.47 (SD = .76) respectively. In summary,
leaders were perceived as being moderately high in wisdom, persuasive mapping and
organisational stewardship, moderate in altruistic calling and moderately low in
emotional healing.
For dependent variables, the mean for continuance commitment was the highest,
followed by normative commitment and affective commitment. Continuance
commitment was moderately high with a mean score of 3.27 (SD = .62) while affective
commitment and normative commitment were moderate with mean score of 3.01 (SD
= .57) and 3.09 (SD = .64) respectively. The employees generally have moderate
affective commitment and normative commitment; and moderately high of continuance
commitment towards their employers.
Table 4.6
Descriptive Statistics of the Study Variables (N = 107)
Variables Scale Means Standard Deviation
Independent variables
Altruistic calling 1 – 5 3.08 .79
Emotional healing 1 – 5 2.64 .96
Wisdom 1 – 5 3.55 .65
Persuasive mapping 1 – 5 3.31 .76
Organisational stewardship 1 – 5 3.47 .76
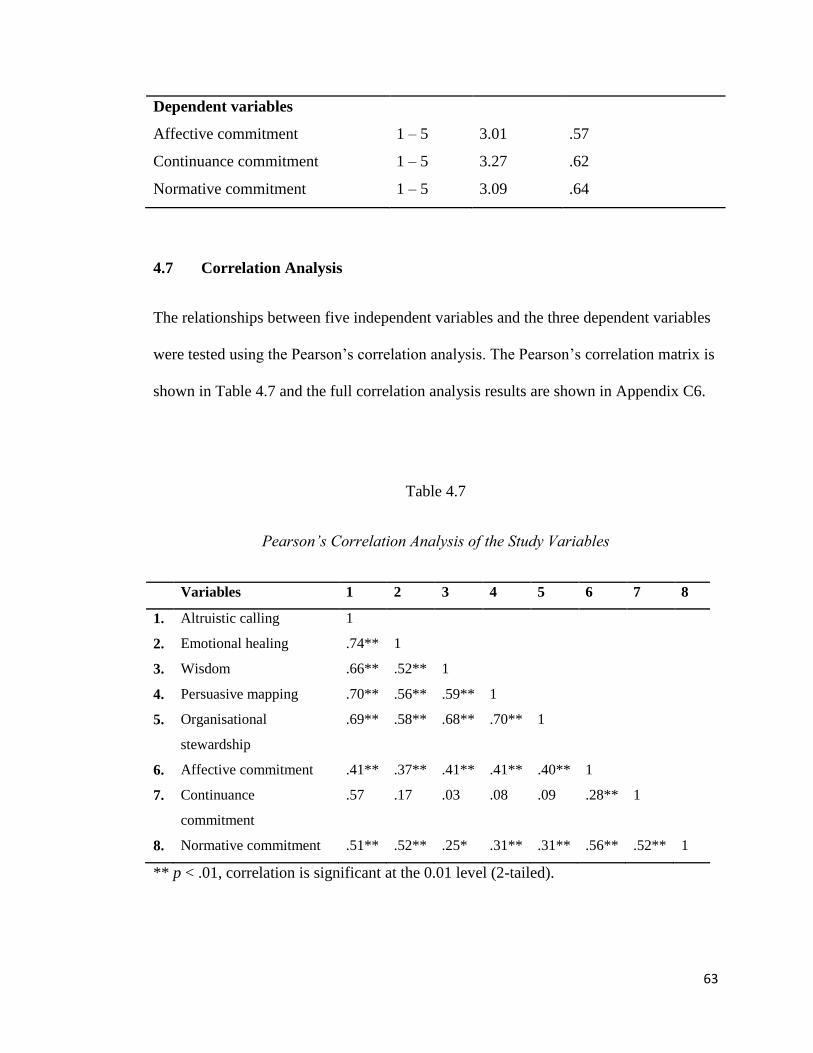
63
Dependent variables
Affective commitment 1 – 5 3.01 .57
Continuance commitment 1 – 5 3.27 .62
Normative commitment 1 – 5 3.09 .64
4.7 Correlation Analysis
The relationships between five independent variables and the three dependent variables
were tested using the Pearson‟s correlation analysis. The Pearson‟s correlation matrix is
shown in Table 4.7 and the full correlation analysis results are shown in Appendix C6.
Table 4.7
Pearson’s Correlation Analysis of the Study Variables
Variables 1 2 3 4 5 6 7 8
1. Altruistic calling 1
2. Emotional healing .74** 1
3. Wisdom .66** .52** 1
4. Persuasive mapping .70** .56** .59** 1
5. Organisational
stewardship
.69** .58** .68** .70** 1
6. Affective commitment .41** .37** .41** .41** .40** 1
7. Continuance
commitment
.57 .17 .03 .08 .09 .28** 1
8. Normative commitment .51** .52** .25* .31** .31** .56** .52** 1
** p < .01, correlation is significant at the 0.01 level (2-tailed).
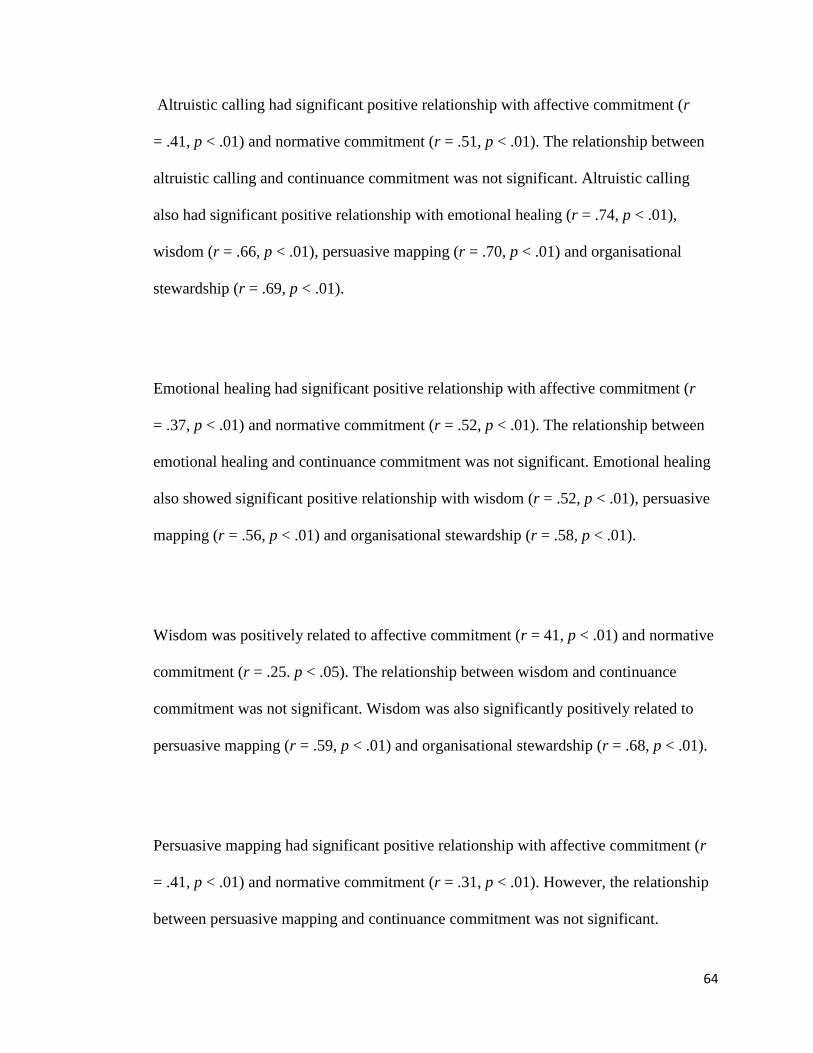
64
Altruistic calling had significant positive relationship with affective commitment (r
= .41, p < .01) and normative commitment (r = .51, p < .01). The relationship between
altruistic calling and continuance commitment was not significant. Altruistic calling
also had significant positive relationship with emotional healing (r = .74, p < .01),
wisdom (r = .66, p < .01), persuasive mapping (r = .70, p < .01) and organisational
stewardship (r = .69, p < .01).
Emotional healing had significant positive relationship with affective commitment (r
= .37, p < .01) and normative commitment (r = .52, p < .01). The relationship between
emotional healing and continuance commitment was not significant. Emotional healing
also showed significant positive relationship with wisdom (r = .52, p < .01), persuasive
mapping (r = .56, p < .01) and organisational stewardship (r = .58, p < .01).
Wisdom was positively related to affective commitment (r = 41, p < .01) and normative
commitment (r = .25. p < .05). The relationship between wisdom and continuance
commitment was not significant. Wisdom was also significantly positively related to
persuasive mapping (r = .59, p < .01) and organisational stewardship (r = .68, p < .01).
Persuasive mapping had significant positive relationship with affective commitment (r
= .41, p < .01) and normative commitment (r = .31, p < .01). However, the relationship
between persuasive mapping and continuance commitment was not significant.

65
Persuasive mapping was also positively related to organisational stewardship (r = .70, p
< .01).
Organisational stewardship had significant positive relationship with affective
commitment (r = .40, p < .01) and normative commitment (r = .31, p < .01). The
relationship between organisational stewardship and continuance commitment was not
significant.
Affective commitment was positively related to continuance commitment (r = .28, p
< .01) and normative commitment (r = .56, p < .01). Lastly, Continuance commitment
was significantly related to normative commitment (r = .52, p < .01).
4.8 Multiple Regression Analysis
Multiple regression analysis was used to test the influence of the independent variables
(altruistic calling, emotional healing, wisdom, persuasive mapping and organisational
stewardship) on the dependent variables (affective commitment, continuance
commitment and normative commitment). This analysis was carried out to support or
not to support the developed hypotheses. The standardised coefficient beta (β) and
coefficient of determination (R2) were used to determine the statistical importance of
the relationship. The detail results of the multiple analyses are shown in Appendix C7.
66
The four assumptions (normality of the error term distribution, linearity of the
relationship, constant variance of the error term, independence of the error terms,
multicollinearity and outliers) were tested before the application of multiple regression
analysis.
Normality was checked from the P-P plots. All of the points laid in a reasonably straight
diagonal line from bottom left to top right. This suggested the absence of major
deviations from normality (Pallant, 2007). Scatter plots were checked for linearity of
relationship and homoscedasticity. The residuals were roughly rectangularly distributed
with most of the scores concentrated in the centre, along the zero point. This suggested
the absence of violations (Pallant, 2007). No multicollinearity was found as the
tolerance levels and VIF values for the entire regression models were more than .10 and
less than 10 respectively. The Durbin-Watson values for all of the regression models
were between 1.50 and 2.50 indicated the absence of autocorrelation problem.
However, one outlier was detected when the multiple regression analysis was analysed
for affective commitment. The outlier was deleted and the multiple regression analysis
was repeated.

67
4.8.1 Multiple Regression Analysis on Affective Commitment
The summary of multiple regression results for affective commitment is shown in Table
4.8 and the detail results are shown in Appendix C7.
The R2 value showed that 29% of the variance for affective commitment was explained
by altruistic calling, emotional healing, wisdom, persuasive mapping and organisational
stewardship. This means that 71% of the variance was explained by other variables that
have not been explored in this study.
Table 4.8
Multiple Regression Results for Affective Commitment
Model Standardised
Coefficients
t Sig. Collinearity
Statistics
Beta (β) Tolerance VIF
(Constant) 5.22 .00
Altruistic Calling .08 .54 .59 .30 3.32
Emotional Healing .13 1.07 .29 .45 2.21
Wisdom .23* 1.92 .06 .48 2.08
Persuasive Mapping .14 1.04 .30 .42 2.38
Organisational Stewardship .05 .40 .69 .38 2.62
R .54
R2 .29
Adjusted R2 .25
F Change 8.04***
Durbin-Watson 2.09
*p < .10, **p < .05, ***p < .01
68
F ratio provides information about the relationship of the means between the two groups.
If the F ratio is significant, the combination of the independent variables predicts the
dependent variable significantly (Leech et al., 2008). This means that the model is a
good fit (Hair et al., 2010). Table 4.8 shows that the F ratio for affective commitment
was significant (F = 8.04, p < .01). This means that the combined effect of altruistic
calling, emotional healing, wisdom, persuasive mapping and organisational stewardship
was good at predicting affective commitment.
For individual predictor, only wisdom was found to be significantly and positively
related to affective commitment (β = .23, p < .10). Altruistic calling (β = .08, p > .10),
emotional healing (β = .13, p > .10), persuasive mapping (β = .14, p > .10) and
organisational stewardship (β = .05, p > .10) were insignificant predictors of affective
commitment. H7 was supported and H1, H4, H10 and H13 were not supported
4.8.2 Multiple Regression Analysis on Continuance Commitment
The summary of multiple regression results for continuance commitment is shown in
Table 4.9 and the detail results are shown in Appendix C7.
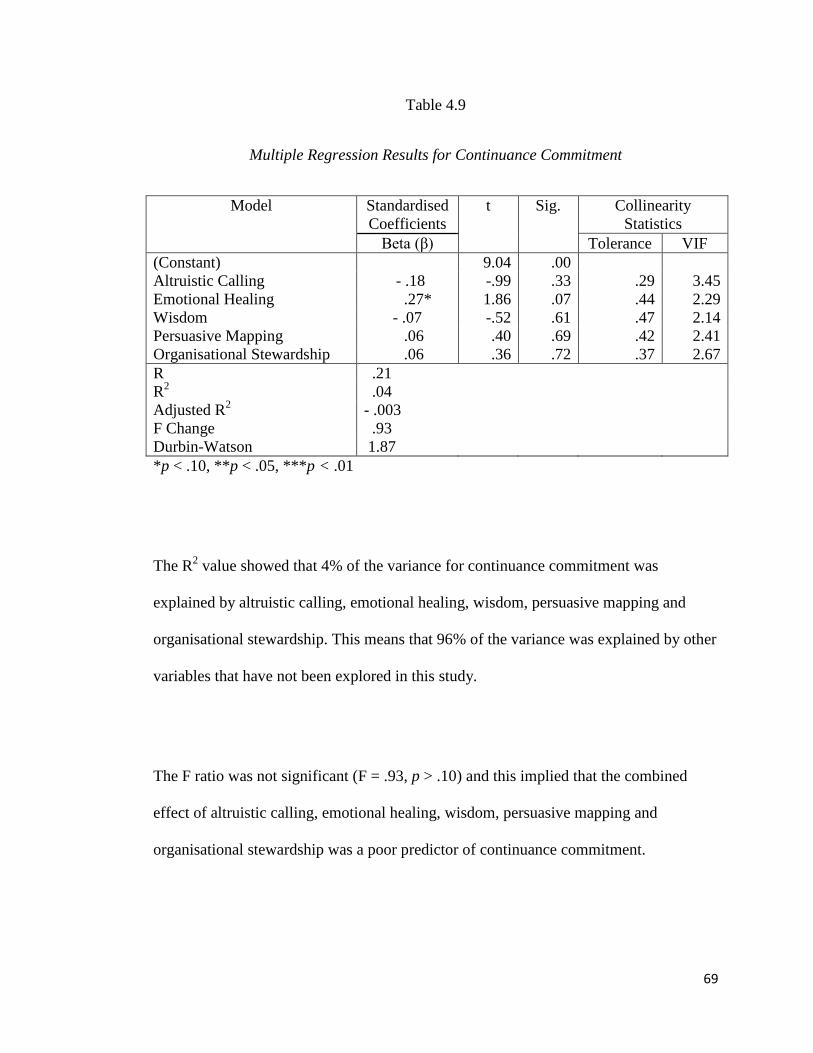
69
Table 4.9
Multiple Regression Results for Continuance Commitment
Model Standardised
Coefficients
t Sig. Collinearity
Statistics
Beta (β) Tolerance VIF
(Constant) 9.04 .00
Altruistic Calling - .18 -.99 .33 .29 3.45
Emotional Healing .27* 1.86 .07 .44 2.29
Wisdom - .07 -.52 .61 .47 2.14
Persuasive Mapping .06 .40 .69 .42 2.41
Organisational Stewardship .06 .36 .72 .37 2.67
R .21
R2 .04
Adjusted R2 - .003
F Change .93
Durbin-Watson 1.87
*p < .10, **p < .05, ***p < .01
The R2 value showed that 4% of the variance for continuance commitment was
explained by altruistic calling, emotional healing, wisdom, persuasive mapping and
organisational stewardship. This means that 96% of the variance was explained by other
variables that have not been explored in this study.
The F ratio was not significant (F = .93, p > .10) and this implied that the combined
effect of altruistic calling, emotional healing, wisdom, persuasive mapping and
organisational stewardship was a poor predictor of continuance commitment.

70
For individual predictor, emotional healing was a significant positive predictor of
continuance commitment (β = .27, p < .10). Altruistic calling (β = -.18, p > .10),
wisdom (β = .07, p > .10), persuasive mapping (β = .06, p > .10) and organisational
commitment (β = .06, p > .10) were found to be poor predictors of continuance
commitment. Hence, H5 was supported while H2, H8, H11 and H14 were not supported.
4.8.3 Multiple Regression Analysis on Normative Commitment
The summary of multiple regression results for normative commitment is shown in
Table 4.10 and the detail results are shown in Appendix C7.
Table 4.10
Multiple Regression Results for Normative Commitment
Model Standardised
Coefficients
t Sig. Collinearity Statistics
Beta (β) Tolerance VIF
(Constant) 7.23 .00
Altruistic Calling .40** 2.61 .01 .29 3.45
Emotional Healing .35** 2.83 .01 .44 2.29
Wisdom - .13 - 1.11 .27 .47 2.14
Persuasive Mapping - .05 - .41 .69 .42 2.41
Organisational Stewardship - .04 - .32 .75 .37 2.67
R .57
R2 .32
Adjusted R2 .29
F Change 9.58***
Durbin-Watson 2.22
*p < .10, **p < .05, ***p < .01

71
The R2 value showed that 32% of the variance for normative commitment was
explained by altruistic calling, emotional healing, wisdom, persuasive mapping and
organisational stewardship. This means that 68% of the variance was explained by other
variables that have not been explored in this study
The F ratio was significant (F = 9.58, p < .01) and showed that the combined effect of
altruistic calling, emotional healing, wisdom, persuasive mapping and organisational
stewardship was good at predicting normative commitment.
For the individual predictor, altruistic calling (β = .40, p < .05) and emotional healing (β
= .35, p < .05) were found to be significant predictors of normative commitment. Both
of them were positively related to normative commitment. However, wisdom (β = - .13,
p > .10), persuasive mapping (β = -.05, p > .10) and organisational stewardship (β = -.04,
p > .10) were found to be insignificant predictors. Hence, only altruistic calling and
emotional healing were found to be positive predictors of normative commitment. As a
result, H3 and H6 were supported while H9, H12 and H15 were not supported.
4.9 Summary
Factor analysis, reliability analysis, descriptive analysis, correlation analysis and
multiple regression analysis were performed to analyse the collected data step by step.

72
Correlation analyses showed that the relationship between the independent variables
and dependent variables were positive. Besides that, the relationship between the five
dimensions of the independent variables and the three dimensions of the dependent
variables were positive as well.
The multiple regression analyses revealed that the combined effect of all of the
independent variables was good predictor of affective commitment and normative
commitment. However, the combined effect of all of the independent variables was not
a significant predictor of continuance commitment. The multiple regression analysis of
individual predictor showed that wisdom was a significant predictor of affective
commitment while emotional healing was a significant predictor of continuance
commitment and normative commitment. Altruistic calling was found to be a significant
predictor of normative commitment.
In summary, only H3, H5, H6 and H7 were supported and all the other hypotheses (H1,
H2, H4, H8, H9, H10, H11, H12, H13, H14 and H15) were not supported. The
summary of all of the hypotheses results is shown in Table 4.11.
Table 4.11
Summary of All Hypotheses Results
Hypotheses Results
H1 Altruistic calling is positively related to affective Not supported
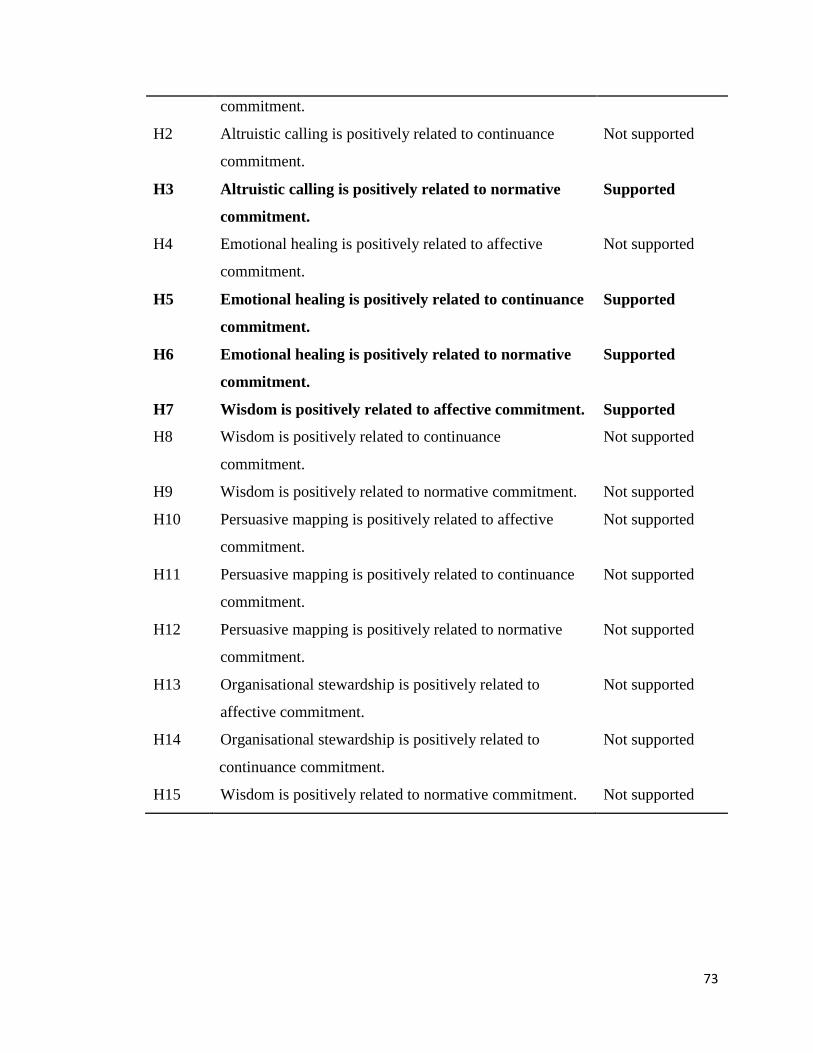
73
commitment.
H2 Altruistic calling is positively related to continuance
commitment.
Not supported
H3 Altruistic calling is positively related to normative
commitment.
Supported
H4 Emotional healing is positively related to affective
commitment.
Not supported
H5 Emotional healing is positively related to continuance
commitment.
Supported
H6 Emotional healing is positively related to normative
commitment.
Supported
H7 Wisdom is positively related to affective commitment. Supported
H8 Wisdom is positively related to continuance
commitment.
Not supported
H9 Wisdom is positively related to normative commitment. Not supported
H10 Persuasive mapping is positively related to affective
commitment.
Not supported
H11 Persuasive mapping is positively related to continuance
commitment.
Not supported
H12 Persuasive mapping is positively related to normative
commitment.
Not supported
H13 Organisational stewardship is positively related to
affective commitment.
Not supported
H14 Organisational stewardship is positively related to
continuance commitment.
Not supported
H15 Wisdom is positively related to normative commitment. Not supported

74
CHAPTER 5
FINDINGS AND CONCLUSION
5.1 Introduction
This final chapter discusses the results of the research. The theoretical and practical
implications of the results are included. Besides that, the limitation of the study and
recommendation for future research are provided. At the end of the report, the
conclusions for the whole research are provided.
5.2 Recapitulation of Study
This study was developed following the realisation of the importance of organisational
commitment in the banking industry. It may provide the practical implications for the
management team of CIMB Bank to understand the commitment profiles of the
employees and strategise to improvise leadership training for their employees.
Furthermore, it may fill up the theoretical gaps in the literature.
The main objective of this research is to study the relationship between servant
leadership and organisational commitment among executive staff in CIMB Banks in
Penang, Malaysia. The independent variables for this study are the servant leadership,
which is composed of five dimensions: altruistic calling, emotional healing, wisdom,
persuasive mapping and organisational commitment. The dependent variables are the
three components of organisational commitment; affective commitment, continuance
75
commitment and normative commitment. Theoretical framework was developed after
reviewing the literature and fifteen hypotheses were proposed.
This study adopted the cross-sectional, correlational research method. Structured
questionnaires were distributed and collected within three weeks, which was between
the end of March and middle of April 2012. Out of the 160 questionnaires distributed to
ten branches of CIMB Banks in the North East region of Penang Island, 107 (67%)
were usable for data analysis. The collected data were analysed using the Statistical
Package for Social Science (SPSS) programme, version 15.0. The statistical analyses
used were factor analysis, reliability analysis, descriptive analysis, correlation analysis
and multiple regression analysis.
Analysis of the demographic profiles showed that the respondents spread evenly
between the two genders, with the males took up of 42.1% of the respondents and
female 57.9%. Majority of the respondents were aged below 40 years old, bachelor
degree holders, junior executives, and working for the organisation between 11 to 13
years. Most of them had been working with their current supervisor between 1 to 3
years and 64.5% of the supervisors were male.
Factor analysis of the independent variables showed .89 of Kaiser-Meyer-Olkin (KMO)
value with significant Bartlett‟s Test of Sphericity. Four factors were extracted from the
76
analysis with a total variance explained of 71.33%. One item was dropped from further
analysis due to loading of less than .50.
Factor analysis of the dependent variables showed .73 of KMO value with significant
Bartlett‟s Test of Sphericity. Five factors were extracted from the analysis with a total
variance explained of 63.97% and one item was dropped from further analysis due to
loading of less than .50.
Reliability analysis showed that the Cronbach‟s alpha coefficients for all variables were
above .60, which were above the recommended value. Therefore, all of the Cronbach‟s
alpha values were accepted.
Correlation analysis showed that all of the independent variables (altruistic calling,
emotional healing, wisdom, persuasive mapping and organisational stewardship) had
positive and significant relationship with affective commitment and normative
commitment. However, their relationships with continuance commitment were not
significant.
Multiple regression analysis showed that emotional healing had significant positive
influence on continuance commitment (β = .27; p < .10) and normative commitment (β
= .35; p < .05). Altruistic calling had significant positive influence on normative
77
commitment (β = .40; p < .05) and wisdom had significant positive influence on
affective commitment (β = .23; p < .10).
Out of the fifteen hypotheses developed, four were supported. Explanations of the
findings are discussed in the following section.
5.3 Discussion
The relationship between the findings and the proposed hypotheses are discussed in
below.
5.3.1 The relationship between servant leadership and affective commitment
In the past studies, the relationship between leaders and followers has been proposed to
be related to affective commitment (Withey, 1988; Meyer et. al, 1989; Meyer & Allen,
1991). Herzberg‟s two-factor theory suggested that positive leader-follower relationship
may be a hygiene factor that satisfies followers‟ needs and makes them comfortable in
the organisation. In other words, servant leaders who put others interest at the highest
priority enhance the hygiene factor and affective commitment of the followers.
Basically, the results of this study suggested that wisdom was the only significant
individual predictor of affective commitment. Leaders with strong wisdom ability are
78
aware with the surrounding and able to anticipate the consequences and implications of
their observation (Barbuto & Wheeler, 2006). They are also able to promote positive
working experience among the followers. This is consistent with the findings of Meyer
and Allen (1991) that showed that positive work experience positively related to
affective commitment.
One interesting finding of this study was that altruistic calling did not relate to affective
commitment significantly. Leaders who show the ability of altruistic calling have the
desire to make positive difference in others‟ lives (Barbuto & Wheeler, 2006). The
study of Ahiauzu and Asawo (2010) showed that altruism leads to higher affective
commitment. However, this study was carried out in manufacturing industry in Nigeria.
The differences across country and industry may answer for the contradicting results
between two studies. Organisational cultural differences such as whether the
organisation is internally driven or externally driven; means oriented or goal oriented;
easy going work discipline or strict work discipline may have an effect on the
relationship between leadership style and organisational commitment (Hofstede).
Therefore, the relationship between altruistic calling and affective commitment were
different between both studies.
Besides that, emotional healing was found to be poor predictor of affective commitment.
Daches (1999) and Weymes (2003) suggested that emotional healing may promote
emotional stability and support the organisation. Covenantal relationship and trust are

79
built through the healing process. Affective attachment between both parties may be
enhanced. However, the findings of this study did not show similar relationship. This
may be due to cultural difference in Malaysia. According to the Hosftede national
culture dimension, Malaysia is a country high in power distance. This means that the
ideal boss is a benevolent autocrat. The followers rarely seek for emotional support
from the leaders. This is consistent with the results of the descriptive analyses that
showed that the mean score for emotional healing was moderately low, with a mean of
2.64 (SD = .96). Leaders were perceived of having moderately low of emotional healing
ability and followers rarely seek for emotional support from the leaders. Therefore,
emotional healing does not have significant effect on affective commitment.
The multiple regression analyses showed that persuasive mapping and organisational
stewardship were poor predictors of affective commitment, although Pearson‟s
correlation analysis showed positive relationship between the variables. This showed
that although the independent sub-variables related to affective commitment, their
individual influence on affective commitment was not significant. Although persuasive
mapping and organisational stewardship may enhance emotional attachment of
followers towards the organisation, the effect might be too low to impose significant
effect on affective commitment. They only exert their effects when they were used in
combination with other dimensions of servant leadership.

80
5.3.2 The relationship between servant leadership and continuance commitment
Continuance commitment associates with the cost of leaving an organisation (Meyer &
Allen, 1991). The findings of this study suggested that the combined effect of servant
leadership had no significant relationship with continuance commitment. All of the
individual predictors except emotional healing were not significantly related to
continuance commitment. The R2 value obtained from multiple regression analysis
showed that only 4% of the variance for continuance commitment was explained by
altruistic calling, emotional healing, wisdom, persuasive mapping and organisational
stewardship. Hence, the influence of servant leadership on continuance commitment
was too small to be significant.
Leaving a servant leader might not be perceived as a significant cost by the followers.
Descriptive analyses showed that continuance commitment scored highest (3.27 (SD
= .62)) compared to affective commitment (3.01 (SD = .57)) and normative
commitment (3.09 (SD = .64)). There may be other factors such as lack of alternatives
and losing of attractive benefits that have stronger relationship with continuance
commitment.
Employees whose primary bond with the organisation is continuance commitment
remain in the organisation because they need to do so (Meyer & Allen, 1991). Whithey
(1988) showed that continuance commitment correlated more highly with availability of
alternatives, measure of sunk cost and skill specificity. Compared to affective
81
commitment and normative commitment, the relationship between servant leadership
and continuance commitment is weaker.
The results of this study showed that emotional healing was the only significant
predictor of continuance commitment. It has been suggested that the ability to provide
emotional healing may provide support to the entire organisation (Barbuto & Gifford,
2010). The ability of servant leaders to foster emotional healing among the followers
may be perceived as a significant cost of leaving the organisation. Therefore, emotional
healing was shown to be a significant predictor of continuance commitment although
the combination effect of servant leadership did not have such relationship with
continuance commitment.
5.3.3 The relationship between servant leadership and normative commitment
Normative commitment associates with the obligation to remain in an organisation
(Meyer & Allen, 1991). The findings of this study showed that the combined effect of
various dimensions of servant leadership (altruistic calling, emotional healing, wisdom,
persuasive mapping and organisational stewardship) was significant predictor of
normative commitment.
Normative commitment arises from the feeling of obligation that is built up from the
internalisation of normative pressures (Wiener, 1982). The feeling of obligation may
82
begin with observation of role models (Meyer & Allen, 1991). Servant leader whose
principal aim is to serve the needs of the others may act as a good model for the
followers. Normative commitment may be enhanced through the service of role
modelling.
Besides that, normative commitment is enhanced through the building of trust between
servant leaders and their followers. Ozag (2006) reported the positive relationship
between trust and normative commitment in his study. The nature of serving others
among servant leaders produces an environment of cohesion, concern and trust (Van
Dierendonck & Patterson, 2010). Therefore, servant leadership may be the positive
predictor of normative commitment.
For the individual predictors, altruistic calling and emotional healing were found to be
significant positive predictor of normative commitment. Altruistic calling is the
fundamental to serve others and facilitate positive development of individuals,
organisations, communities and societies (Searle, 2011). Leaders high in altruistic
calling put the followers‟ interest ahead and engage in acts of kindness that bring
advantages to their followers (Searle, 2011; Barbuto & Wheeler, 2006). The selfless and
sacrificial acts of altruistic calling help servant leaders to gain respect and loyalty from
followers. The receipt of special favour or help from the leader may oblige the follower
to remain with the organisation even in the availability of attractive alternatives (Meyer
& Allen, 1991). Hence, normative commitment is promoted.
83
Similarly, emotional healing enhances mutual trust between servant leader and follower.
Covenantal relationship is built when they share ideas, dreams, problems and concerns.
Therefore, normative commitment is enhanced through the building of trust between
both parties (Ozag, 2006).
The multiple regression analyses showed that wisdom, persuasive mapping and
organisational stewardship neither positive predictor nor negative predictor of
organisational commitment. Although correlation analyses showed that all of them have
positive relationship with normative commitment, the multiple regression analyses
showed that their effects were not significant. This may be because their individual
influences were too small to act as significant predictor of normative commitment
although their combinative effect was significant.
5.4 Implications of the study
This section discusses the theoretical and practical implications of the study.
5.4.1 Theoretical implications
Limited study has been carried out on the relationship between servant leadership and
organisational commitment (Liden et al., 2008). The servant leadership measurement
proposed by Barbuto and Wheeler (2006) is rather new and rarely used in the study of
84
organisational commitment. Therefore, this study may provide new insights to literature
in this field.
The results showed that servant leadership is significant predictor of affective
commitment and normative commitment, but insignificant predictor of continuance
commitment. This is in congruent with previous study (Searle, 2011). Although servant
leadership has been proven to be poor predictor of continuance commitment, rejection
of the relationship between the two should not be called before further studies have
been carried out. This is to avoid the careless rejection of a relevant factor.
This research studied the relationship between the individual dimension of servant
leadership (altruistic calling, emotional healing, wisdom, persuasive mapping and
organisational stewardship) and the individual components of organisational
commitment (affective commitment, continuance commitment and normative
commitment). The results showed that only some of the dimensions of servant
leadership were significant predictors of organisational commitment. It was found that
emotional healing had significant positive relationship with continuance commitment
and normative commitment, altruistic calling had significant positive relationship with
normative commitment and wisdom had significant positive relationship with affective
commitment. Persuasive mapping and organisational stewardship were not found to
have significant relationship with any component of the organisational commitment.
This showed that the individual dimensions of servant leadership were too weak to be
85
significant predictors of organisational commitment. They may only show their effects
when they are utilised as a group.
Finally, this study provided insights to the relationship between servant leadership and
organisational commitment in Malaysia. This is the first similar study in Malaysia and
may provide new insights to the literature in this field. As this is a rather new in the area,
it may serve as a reference for future studies.
5.4.2 Managerial implications
The results of this study provided some insights to the management team of CIMB
Bank. The results showed that servant leadership may only exert its influence on
organisational commitment when all of the dimensions were used in combination. The
individual dimensions were too weak to exert significant effect. Altruistic calling,
wisdom and emotional healing were shown to exert significant effect on their own.
Therefore, leadership training must be provided in a full spectrum of all of the
dimensions of servant leadership. At the same time, concentration on altruistic calling,
emotional healing and wisdom is required. This is to ensure that optimal effects are
obtained from the leadership training programme organised by the Commerce
Leadership Institute.

86
Besides that, this study provides an insight into the perceived servant leadership profiles.
Results showed that the leaders had moderately high of altruistic calling, wisdom,
persuasive mapping and organisational commitment. Emotional healing ability was
moderately low. This may provide a hint to the management team that improvement on
the emotional healing ability is required. Leadership training programmes should aim at
producing leaders who are great listeners and empathetic towards the needs and
problems of their followers. This is vital for the organisation because emotional healing
is a significant predictor of continuance commitment and normative commitment.
Commitment profiles of the executive staff were provided by this study. It was shown
that the executive staffs had moderately high level of commitment towards the
organisation. Although this is considered good among mergers and acquisition
organisations, it is worth for the management team to look into factors that affect
organisational commitment and try to strengthen commitment profiles of the staffs.
Furthermore, continuance commitment was the component with the highest rating. This
means that employees were bonded to the organisation due to lack of alternatives.
Commitment scores may reduce when better alternatives are available in the industry.
Therefore, the management team may strengthen the commitment profiles of the
employees by implementing leadership training programmes that aim at cultivating
servant leaders who are high in altruistic calling, emotional healing and wisdom.

87
Finally, the results also showed that there are other variables that were not explored in
this study. Factors that have been found to relate to organisational commitment include
organisational culture, job satisfaction, job involvement and occupational commitment
(Meyer et. al., 2002). Further study on the other factors that affect organisational
commitment is required. This may ensure the improvement of the commitment profiles
of the employees.
5.5 Limitations of the study and suggestions for future research
There are several limitations for this study. Improvements are suggested for future
studies.
Due to time constraint, the study was carried out over a period of three weeks from the
end of March to the middle of April 2012. The relationship between servant leadership
and organisational commitment was studied over a particular time point only. However,
the relationship between the variables may be better studied if the research was
conducted over different time points. This may produce results for comparison between
different time points. Therefore, longitudinal study is recommended for future study.
Besides that, the respondents for this study were from the CIMB Banks in the North
East region of Penang Island. It may not be able to represent the entire workforce of
CIMB Banks in Malaysia. Therefore, future study should include respondents from
88
other states in Malaysia. This is to ensure that the results may be generalised for the
CIMB Bank workforce in Malaysia.
This research involved self-report measure where the questionnaires were collected via
representatives in the banks. It has been reported that self-report measures are opened to
response bias which may affect the results of the study (Donaldson & Grant-Vallone,
2002). Respondents may provide socially desirable response as they believe that that
their leaders may gain access to their response. Therefore, envelope with returned
address may be provided with questionnaires to ensure respondents about the
confidentiality of their answers. This may help to reduce bias responses.
The results of this study showed that servant leadership contributed 29% to affective
commitment, 4% to continuance commitment and 32% to normative commitment.
There are other variables that have not been explored in this study. Future study may
explore the other contributing factors to organisational commitment.
For the purpose of managerial implication, future study may involve other leadership
styles for comparison. This may help the management team to identify leadership style
that contributes more to organisational commitment. The results may be used as
guidance for the management team to strategise leadership training programme.

89
5.6 Conclusion
In summary, the purpose of this study was to explore the relationship between servant
leadership and organisational commitment. The study was designed to answer all the
research questions.
The results of this study demonstrated that the combination effect of the various
dimensions of servant leadership was the positive predictor of affective commitment
and normative commitment. For the individual dimension of servant leadership, only
wisdom was found to be positive predictors of affective commitment and emotional
healing was positive predictor of continuance commitment. Altruistic calling and
emotional healing were positive predictors of normative commitment. It is hoped that
the results may help the management team of CIMB Bank to understand the
commitment profiles and the perceived leadership styles of the employees. It may be
used by the management team of CIMB Bank to strategise on their leadership training
programme.
This research is among the first few studies that explore the relationship between
servant leadership and organisational commitment in Malaysia. It is hoped that this
study may provide new insights into the relationship between the variables.
90
Overall, the findings of the study expand our understanding of the relationship between
servant leadership and organisational commitment. The results of this study may
enhance the understanding of the commitment profiles of the bank employees. The
management team may use the results to improvise on the leadership training
programmes by strengthening the dimensions of servant leaders that showed significant
positive relationship with organisational commitment, such as altruistic calling,
emotional healing and wisdom.
91
REFERENCE
Abdul Karim, N. H. & Mohammd Noor, N. H. N. N. 2006. Evaluating the psychometric
properties of Allen and Meyer‟s organizational commitment scale: A cross
cultural application among Malaysian Academic Librarians. Malaysian Journal
of Library & Information Science. 11(1): 89-101.
Ahiauzu, A & Asawo, S. P. 2010. Altruistic love culture and workers‟ commitment in
the Nigerian Manufacturing Industry: A study in workplace spirituality. Journal
of Management Policy and Practice. 11(5): 97-106.
Allen, N. J. & Meyer, J. P. 1990. The measurement and antecedents of affective,
continuance and normative commitment to the organization. Journal of
Occupational Psychology. 63: 1-18.
Anderson, N., & Schalk, R. 1998. The psychological contract in retrospect and prospect.
Journal of Organizational Behaviour. 19: 637-647.
Angle, H. L., & Perry, J. L. 1981. An empirical assessment of organization commitment
and organizational effectiveness. Administrative Science Quarterly. 26: 1-13.
Armstrong-Stassen. 2001. The impact of hospital amalgamation on the job attitudes of
nurses. Canadian Journal of Administrative Sciences. 18:149–162.
Barbuto, J. E., & Gifford, G. T. 2010. Examining gender differences of servant
leadership: An analysis of the agentic and communal properties of the servant
leadership questionnaire. Journal of Leadership Education. 9(2): 4-21.
Barbuto, J. E., & Wheeler, D. W. 2006. Scale development and construct clarification
of servant leadership. Group & Organization Management. 31(3): 300-326.
Bateman, T. & Strasser, S. 1984. A longitudinal analysis of the antecedents of
organizational commitment. Academy of Management Journal. 21: 95-112.

92
Batson, C. D. 2002. Empathy, attitudes, and action: Can feeling for a member of a
stigmatized group motivate one to help the group? Personality and Social
Psychology Bulletin. 28:1656-1666.
Baugh, S. & Roberts, R. 1994. Professional and organizational commitment among
engineers: conflicting or complementing? Engineering Management, 41. 2: 108-
114.
Becker, T.E. 1960. Notes on the concept of commitment. American Journal of
Sociology. 66: 32-40.
Becker, T. E. & Kernan, M. C. 2003. Matching commitment to supervisors and
organisations to in-role and extra-role performance. Human Performance. 16(4):
327-348.
Benkhoff, B. 1997. Disentangling organizational commitment: The changes of the OCQ
for research and policy. Personnel Review. 26(1): 114-20.
Bierly, P. E. et al. 2000. Organisational learning, knowledge and wisdom. Journal of
Organizational Change Management. 13: 595-618.
Bowman, M. A. 1997. Popular approaches to leadership. In P. G. Northhouse,
Leadership. Thousand Oaks, CA: Sage.
Brown, B. B. 2003. Employees‟ organizational commitment and their perception of
supervisors‟ relations-oriented and task-oriented leadership behaviours. Ph. D
diss. State University.
Buchanan, B. 1974. Building organizational commitment: The socialization of
managers in work organizations. Administrative Science Quarterly. 18: 533-546.
Cartwright, S., & Cooper, C.L. 1993a. The psychological impact of mergers and
acquisition on the individual: a study of building society managers. Human
Relations. 46: 327-347.
93
Ching, T. T., & Ching, H. H. 1995. The complete works of Lao Tzu. A new enlightening
translation and elucidation. Los Angelos, CA: SevenStar Communications.
CIMB Group Holdings Berhad. 2010. Corporate responsibility report 2010. Kuala
Lumpur: CIMB Group Holdings Berhad.
Coakes S. J. et al. 2009. SPSS: Analysis Without Anguish Using SPSS Version 16.0 for
Windows. Jacaranda: John Wiley.
Culpepper, R. A. 2000. A test of revised scales for the Meyer and Allen (1991) Three-
component commitment construct. Educational and Psychological
Measurement. 60(4): 604-616.
Dacher, E. S. 1999. Loving openness and the healing relationship. Advances in Mind-
Body Medicine. 15(1): 32-43.
Darvish, H., Rezaei, F. 2011. The impact of authentic leadership on job satisfaction and
team commitment. Management & Marketing Challenges for the Knowledge
Society. 6(3): 421-436.
Davy, J. A. 1988. After the Merger: Dealing with People‟s Uncertainty. Training and
Development Journal. Nov.: 57-61.
DeCotis, T. & Summers, T. 1987. A path analysis of a model of the antecedents and
consequences of organizational commitment. Human Relations. 40: 445- 470.
Dennis, R. S., & Bocarnea, M. 2005. Development of the servant leadership assessment
instrument. Leadership and Organization Development Journal. 25(8): 600-615.
Dhawan, V., Mulla, Z. R. 2011. The role of pay and leadership in developing
organizational commitment. South Asian Journal of Management. 18(2): 60-73.
Donaldson, S. I. & Grant-Vallone, E. J. 2002. Understanding self-report bias in
organisational behaviour research. Journal of Business and Psychology. 17(2):
245-261.
94
Drury, S. 2004. Employee perceptions of servant leadership: Comparisons by level and
with job satisfaction and organizational commitment. Ph. D diss. Regent
University.
Ehrhart, M. G. 2004. Leadership and procedural justice climate as antecedents of unit
level organizational citizenship behavior. Personnel Psychology. 57: 61 – 94.
Eisenberger, R. Et al. 1990. Perceived Organizational Support and Employee Diligence,
Commitment, and Innovation. Journal of Applied Psychology. 75(1): 51-59.
Eisinga et. al. 2010. Assessing cross-national invariance of the three-component model
of organizational commitment: A six-country study of European university
faculty. Cross-cultural Research. 44(4): 341-373.
Evanschitsky, H. et al. 2006. The relative strength of affective commitment in securing
loyalty in service relationships. Journal of Business Research. 59(12): 1207-
1213.
Falbe, C. M., & Yukl, G. 1992. Consequences for managers using single influence
tactics and combinations of tactics. Academy of Management Journal. 35:638-
653.
Farling, M. L. Et al. 1999. Servant leadership: Setting the stage for empirical research.
The Journal of Leadership Studies. 6 (1/2): 50-72.
Graham, J. W. 1991. Servant-leadership in organizations: Inspirational and moral.
Leadership Quarterly. 2 (2): 105-119.
Greenleaf, R. K. 1977. Servant leadership. Mahwah, NJ: Paulist Press.
Hackett, R. D. et al. 1994. Further assessments of Meyer and Allen‟s (1991) three-
component model of organizational commitment. Journal of Applied
Psychology. 79(1): 15-23.
Hair, J. E. et al. 1998. Multivariate data analysis. 5th
ed. New Jersey: The Prentice-Hall
International.

95
Hall, D. T. et al.1970. Personal factors in organizational identification. Administrative
Science Quarterly. 15: 176-190.
Hartmann, L.C., & Bambacas, M. 2000. Organizational commitment: A multi method
scale analysis and test of effects. International Journal of Organizational
Analysis. 8: 89-108.
Hill, V. A. 2008. Employee satisfaction and organizational commitment: A mixed
methods investigation of the effects of servant leadership. Ph. D diss. Capella
University.
Hinton, P. R. et al. 2004. SPSS Explained. Sussex: Routledge.
Hofstede, G. Malaysia national culture dimensions. http://geert-
hofstede.com/malaysia.html (assessed May 1, 2012)
Hoveida, R. H. et al. 2011. A study on the relationship among Servant Leadership (SL)
and the Organizational Commitment (OC): A case study. Interdisciplinary
Journal of Contemporary Research In Business. 3(3): 499-508.
Igbaria, M. et al. 1996. A motivational model of microcomputer usage. Journal of
Management Information Systems.13(1):127.
Jason, O. & Waters, E. 2002. Four assumptions of multiple regression that researchers
should always test. Practical Assessment Research & Evaluation. 8 (2).
http://PAREonline.net/getvn.asp?v=8&n=2 (assessed April 14, 2012).
Jaramillo, F. et al. 2009. Examining the impact of servant leadership on salesperson‟s
turnover intention. Journal of Personal Selling and Sales Management. 29(4):
351-366.
Jaros, S. J. 2002. An assessment of Meyer and Allen‟s (1991) three-component model
of organizational commitment and turnover intentions. Journal of Vocational
Behaviour. 51(3): 319-337.

96
Kanter, R. M. 1968. Commitment and social organization: A study of commitment
mechanisms in Utopian communities. American Sociological Review. 33: 499-
517.
Keller, G. 2009. Managerial Statistics. 8th
Ed. Ohio: South-Western Cengage Learning.
Koopman, P.L. 1991. Between control and commitment: Management and change as
the art of balancing. Leadership and OD Journal. 12: 3-7.
Kouzes, J.M. and Posner, B.Z. 1993. Credibility: How leaders gain and lose it, why
people demand it. San Francisco: Jossey-Bass.
Kyei-Poku, I. A. 1996. Satisfaction with a merger, its impact on organizational
commitment and turnover intentions: Canadian evidence. PhD Diss. Carleton
University.
Laschinger, H. 2001. The impact of workplace commitment, organizational trust on
staff nurses‟ work satisfaction and organizational commitment. Health Care
Management Review. 26( 3): 7-24.
Laub, J. 1999. Assessing the servant organization: Development of the servant
organizational leadership (SOLA) instrument. Dissertation Abstracts
International. 60(02): 308.
Leech et al. 2008. SPSS for intermediate statistics: Use and interpretation. 3rd
ed. New
York: Lawrence Erlbaum Associates.
Lee, H. Y., Ahmad, k. Z. 2009. The moderating effects of organsational culture on the
relationships between leadership behaviour and organizational commitment and
between organizational commitment and job satisfaction and performance.
Leadership & Organization Development Journal. 30(1): 53-86.
Leow, K. L. & Khong, K. W. 2009. Organizational commitment: The study of
organizational justice and leader member exchange among auditors in Malaysia.
International Journals of Business and Information. 4(2): 161-198.

97
Liden, R. C., et al.2008. Servant leadership: Development of a multidimensional
measure and multi-level assessment. Leadership Quarterly. 19: 161-177.
Lok, P, Crawford, J. 2004. The effect of organizational culture and leadership style on
job satisfaction and organizational commitment: A cross-national comparison.
Journal of Management Development. 23(4): 321-338.
Mahembe, B. 2010. The relationship between servant leadership, team commitment,
team citizenship behaviour and team effectiveness: An exploratory study. Ph. D
diss. University of Stellenbosch.
Malaysia. CIMB Group. 2010. History.
http://www.cimb.com/index.php?ch=g2_au&pg=g2_au_content&ac=14&tpt=ci
mb_group (accessed February 15, 2012)
Malaysia. The Prime Minister‟s CSR Awards. 2010. 2009 Honouree: CIMB –
Transforming mindsets.
http://www.anugerahcsrmalaysia.org/2010/03/11/transforming-mindsets/
(accessed February 14, 2012)
Marsh, R. M. & Mannari, H. 1977. Organizational commitment and turnover: A
predictive study. Administrative Science Quarterly. 22: 57-75.
Md Zain, A. Y. & Gill, R. 1999. A psychometric assessment of the Malay version of
Meyer and Allen‟s organizational commitment measure. Malaysian
Management Review.
Meyer, J. P. et al. 2002. Affective, continuance, and normative commitment to the
organization: A meta-analysis of antecedents, correlates and consequences.
Journal of Vocational Behaviour. 61: 20-52.
Meyer, J.P. et al.1989. Organizational Commitment and Job Performance: It's the
Nature of the commitment that counts. Journal of Applied Psychology. 74: 152-
56.
Meyer, J.P., & Allen, N.J. 1997. Commitment in the Work Place: Theory Research and
Application. London, UK: Sage.

98
Meyer, J. P., & Allen, N. J. 1991. A three-component conceptualization of
organizational commitment. Human Resource Management Review. 1: 61–89.
Meyer, J. P. Allen, N. J. & Smith, C. A. 1993. Commitment to Organizations and
Occupations: Extension and Test of a Three-Component Conceptualization.
Journal of Applied Psychology. 78(4): 538-552.
Meyer, J.P. & Herscovitch, L. 2001. Commitment in the workplace: Toward a general
model. Human Resource Management Review. 11: 299-326.
Morrow, P. 1993. The theory and measurement of work commitment. Greenwich, CT.:
JAL.
Mowday, R. T. et al. 1982. Employee-organization linkages: The psychology of
commitment, absenteeism and turnover. New York: Academic Press.
Mowday, R. T et al. 1979. The measurement of organizational commitment. Journal of
Vocational Behaviour. 14: 224-227.
Nasirul Islam, M. 2006. A relational study on organizational commitment, career
satisfaction, job involvement, job security and job satisfaction in the context of
Social Investment Bank Limited (SIBL). Ph. D diss., Independent University.
National culture – Malaysia. 2012. Geert Hofstede.http://geert-
hofstede.com/malaysia.html (accessed February 6, 2012)
Niehoff, B. et al. 2001. The influence of empowerment and job enrichment on
employee loyalty in a downsizing environment. Group & Organization
Management. 26: 93-113.
Niehoff, B.P., Enz, C.A., & Grover, R.A. 1990. The impact of top-management actions
on employee attitudes and perceptions. Group & Organization Studies. 15(3):
337- 352.
Nunnally, J. C. 1978. Psychometric theory. 2nd
edition. New York: MsGraw-Hill.
O'Reilly, C.A., III, & Chatman, J. 1986. Organizational commitment and psychological
attachment: The effects of compliance, identification, and internalization on
prosocial behaviour. Journal of Applied Psychology. 71: 492-499.

99
Ozag, D. 2006. The relationship between the trust, hope and normative and continuance
commitment of merger survivors. Journal of Management Development. 25(9):
870-883.
Page, D., & Wong, T. P. 2000. A conceptual framework for measuring servant
leadership. In S. Adjibolosoo (Ed.), The human factor in shaping the course of
history and development. Boston, MA: University Press of America.
Pallant, J. 2007. SPSS survival manual: A step-by-step guide to data analysis using
SPSS for Windows (Version 15). 3rd
Ed. Crows Nest: Allen & Unwin.
Panchanatham, K. R. S. et al. 2011. Factors influencing organizational commitment of
banking sector employees. Journal of Economics and Behavioural Studies. 2(1):
19-25.
Pandey, D. 2009. Mentoring, organizational commitment and turnover intentions: A
study on Nepalese banking organization. Nepalese Economic Review. 1(2).
http://www.ner.com.np/vol-1/issue-2/48-mentoring-organizational-commitment-
and-turnover-intentions-a-study-on-nepalese-banking-organization.html
(assessed February 15, 2012)
Parolini, J. et al., 2009. Distinguishing between transformational and servant leadership.
Leadership & Organization Development Journal. 30(3): 274-291.
Porter, L.W. et al. .1974. Organizational commitment, job-satisfaction, and turnover
among psychiatric technicians. Journal of Applied Psychology. 59: 603-609.
Reichers, A. 1985. A review and reconceptialitzion of organizational commitment. The
Academy of Management Review. 10(3): 465-476.
Rhoades, L. et al., 2001. Affective commitment to the organisation: The contribution of
perceived organisational support. Journal of Applied Psychology. 86(5): 825-
836.
Riaz T. et al. 2011. Impact of transformational leadership style on affective employees‟
commitment: An empirical study of banking sector in Islamabad (Pakistan).
100
Riketta, M. 2002. Attitudinal organizational commitment and job performance: A meta-
analysis. Journal of Organizational Behaviour. 23: 257-66.
Russell, R. F., & Stone, A. G. 2002. A review of servant leadership attributes:
Developing a practical model. Leadership & Organization Development Journal.
23(3): 145-157.
Russell, R.F. 2001. The role of values in servant leadership. Leadership & Organization
Development Journal. 22(2): 76-85.
Searle, T. P. 2011. A multilevel examination of proactive work behaviours: Contextual
and individual differences as antecedents. Ph. D diss., University of Nebraska.
Searle, T. P., & Barbuto, J. E. 2011. Servant leadership, hope, and organizational
virtuousness: A framework exploring the positive micro and macro behaviours
and its performance impact. Journal of Leadership and Organizational Studies.
18(1), 107-117.
Sendjaya, S. 2008. Defining and measuring servant leadership behaviour in
organizations. Journal of Management Studies. 45(2): 402-424.
Sekaran, U. & Bougie, R. 2010. Research Methods for Business: A Skill Building
Approach. 5th
Ed. West Sussex: John Wiley & Sons.
Sekaran, U. 2003. Research methods for business. 4th
edition. United States of America:
John Wiley & Sons, Inc.
Sendjaya, S., Pekerti, A. 2010. Servant leadership as antecedent of trust in organizations.
Leadership & Organization Development Journal. 31(7): 643-663.
Shore, L. M. & Martin, H. J. 1989. Job satisfaction and organizational commitment in
relation to work performance and turnover intentions. Human Relations. 42(7):
625-648.
Singh, V., & Vinnicombe, S. 1998. What does "commitment" really mean? Views of
UK and Swedish engineering managers. Personnel Review. 29(2): 228-258.
101
Snell, S. A. & Dean, J. W. Jr. 1992. Integrated manufacturing and human resource
management: A human capital perspective. Academy of Management Journal.
35: 467-504.
Spears, L. C. 1995. Servant-leadership and the Greenleaf legacy. In L. Spears,
Reflections on Leadership. New York: John Wiley & Sons.
Steers, R. 1975. Problems in the measurement of organizational effectiveness.
Administrative Science Quarterly 20: 546-558.
Stone, G.A., Russell, R.F. and Patterson, K. 2004. Transformational versus servant
leadership: A difference in leader focus. Leadership & Organization
Development Journal. 25(3/4): 349-59.
Tabachnick, B.G. & Fidell, L.S. 2007. Using Multivariate Statistics. 5th
ed, Boston:
Allyn & Bacon Pearson.
Trice, H. & Beyer, J. 1993. The Culture of Work Organization, Prentice-Hall,
Englewood Cliffs, NJ.
Van Dierendonck, D., & Patterson, K. (2010). Servant leadership developments in
theory and research. New York: Palgrave Macmillian.
Vandenberghe, C. Et al., 2011. Continuance commitment and turnover: Examining the
moderating role of negative affectivity and risk aversion. Journal of
Occupational and Organisational Psychology. 84(2): 403-424.
Walumbwa, F. O., Hartnell, C. A., & Oke, A. 2010. Servant leadership, procedural
justice climate, service climate, employee attitudes, and organizational
citizenship behaviour: A cross-level investigation. Journal of Applied
Psychology. 95 (3): 517-529.
Washington, R. R, et al. 2006. Individual differences in servant leadership: The roles of
values and personality. Leadership & Organization Development Journal. 27(8):
700-716.

102
Weber, Y. 1996. Corporate cultural fit and performance in mergers and acquisitions.
Human Relations. 49: 1181-1193.
Welsh, H. P. & LaVan, H. 1981. Inter-relationships between organizational
commitment and job characteristics, job satisfaction, professional behaviour,
and organizational climate. Human Relations. 34: 1079-1089.
Weymes, E. 2003. Relationships not leadership sustain successful organizations.
Journal of Change Management. 3: 319-332.
Whithey, M. 1988. Antecedents of value based and economic organizational
commitment. Proceedings of the annual meeting of the administrative sciences
association of Canada-organizational behaviour division. 9: 124-133.
Wiener, Y. 1982.Commitment in organizations: A normative view. Academic
Management Review. 7: 418-428.
Yasin, N.M. et al. 2009. The mediating effects of attitude towards parallel imports in
consumer personality-purchase intention linkage. Jurnal Pengurusan. 28: 103-
123.

APPENDICES


103
APPENDIX A: QUESTIONNAIRE WITH COVER LETTER
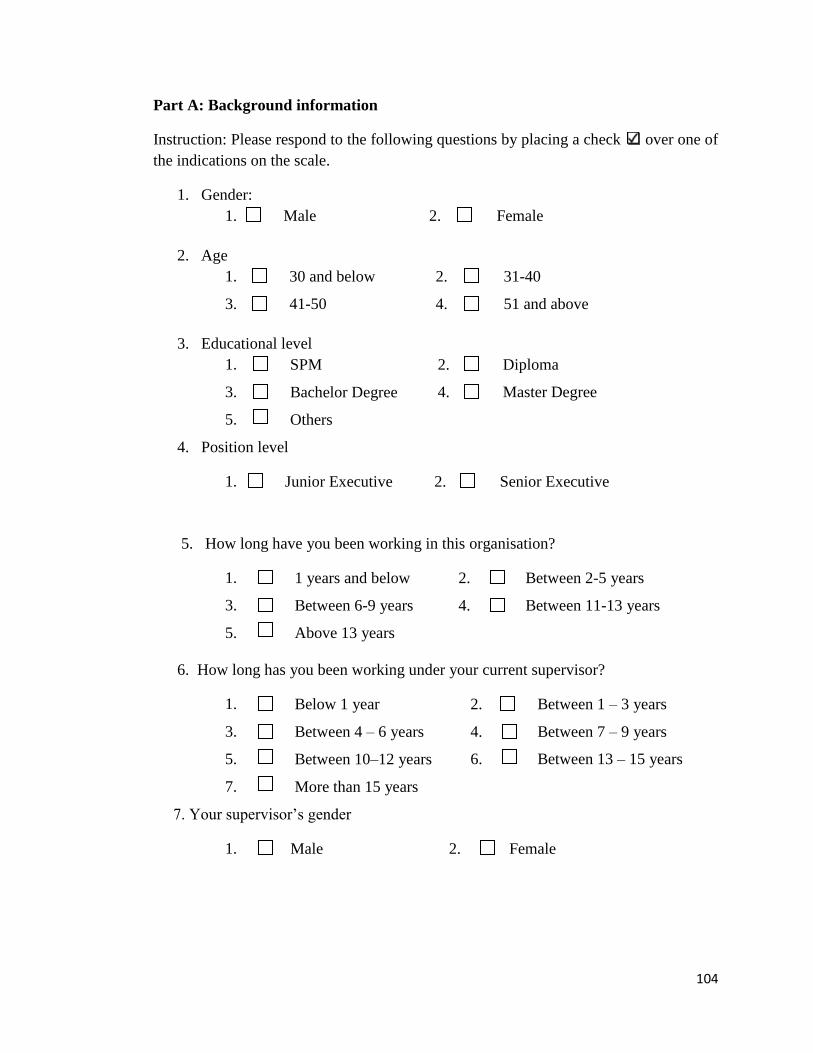
104
Part A: Background information
Instruction: Please respond to the following questions by placing a check over one of
the indications on the scale.
1. Gender:
1. Male 2. Female
2. Age
1. 30 and below 2. 31-40
3. 41-50 4. 51 and above
3. Educational level
1. SPM 2. Diploma
3. Bachelor Degree 4. Master Degree
5. Others
4. Position level
1. Junior Executive 2. Senior Executive
5. How long have you been working in this organisation?
1. 1 years and below 2. Between 2-5 years
3. Between 6-9 years 4. Between 11-13 years
5. Above 13 years
6. How long has you been working under your current supervisor?
1. Below 1 year 2. Between 1 – 3 years
3. Between 4 – 6 years 4. Between 7 – 9 years
5. Between 10–12 years 6. Between 13 – 15 years
7. More than 15 years
7. Your supervisor‟s gender
1. Male 2. Female
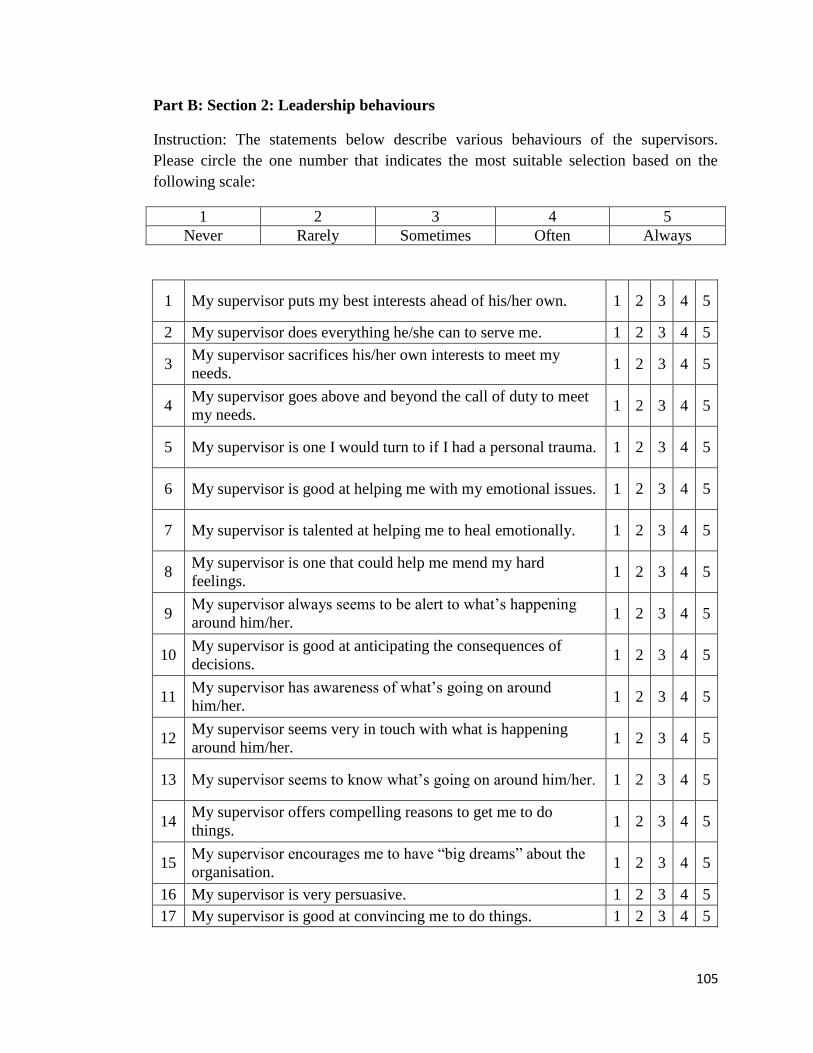
105
Part B: Section 2: Leadership behaviours
Instruction: The statements below describe various behaviours of the supervisors.
Please circle the one number that indicates the most suitable selection based on the
following scale:
1 2 3 4 5
Never Rarely Sometimes Often Always
1 My supervisor puts my best interests ahead of his/her own. 1 2 3 4 5
2 My supervisor does everything he/she can to serve me. 1 2 3 4 5
3 My supervisor sacrifices his/her own interests to meet my
needs. 1 2 3 4 5
4 My supervisor goes above and beyond the call of duty to meet
my needs. 1 2 3 4 5
5 My supervisor is one I would turn to if I had a personal trauma. 1 2 3 4 5
6 My supervisor is good at helping me with my emotional issues. 1 2 3 4 5
7 My supervisor is talented at helping me to heal emotionally. 1 2 3 4 5
8 My supervisor is one that could help me mend my hard
feelings. 1 2 3 4 5
9 My supervisor always seems to be alert to what‟s happening
around him/her. 1 2 3 4 5
10 My supervisor is good at anticipating the consequences of
decisions. 1 2 3 4 5
11 My supervisor has awareness of what‟s going on around
him/her. 1 2 3 4 5
12 My supervisor seems very in touch with what is happening
around him/her. 1 2 3 4 5
13 My supervisor seems to know what‟s going on around him/her. 1 2 3 4 5
14 My supervisor offers compelling reasons to get me to do
things. 1 2 3 4 5
15 My supervisor encourages me to have “big dreams” about the
organisation. 1 2 3 4 5
16 My supervisor is very persuasive. 1 2 3 4 5
17 My supervisor is good at convincing me to do things. 1 2 3 4 5

106
18 My supervisor is gifted when it comes to persuading me. 1 2 3 4 5
19 My supervisor believes that the organisation needs to play a
moral role in society. 1 2 3 4 5
20 My supervisor believes that our organisation needs to function
as a community. 1 2 3 4 5
21 My supervisor sees the organisation for its potential to
contribute to society. 1 2 3 4 5
22 My supervisor encourages me to have a community spirit in the
workplace. 1 2 3 4 5
23 My supervisor is preparing the organisation to make a positive
difference in future. 1 2 3 4 5

107
Part C: Organisational Commitment
Instruction: The statements below describe various aspects of your commitment towards
your organisation. Please circle the one number that indicates the most suitable
selection based on the following scale:
1 2 3 4 5
Strongly
Disagree Disagree Neutral Agree Strongly Agree
1 I would be very happy to spend the rest of my life with this
organisation. 1 2 3 4 5
2 I really feel as if this organisation's problems are my own. 1 2 3 4 5
3 I do not feel a strong sense of belonging to my organisation. 1 2 3 4 5
4 I do not feel emotionally attached to this organisation. 1 2 3 4 5
5 I do not feel like part of the family at my organisation. 1 2 3 4 5
6 This organisation has a great deal of personal meaning for
me. 1 2 3 4 5
7 Right now, staying with my organisation is a matter of
necessity as much as desire. 1 2 3 4 5
8 It would be very hard for me to leave my organisation right
now, even if I wanted to. 1 2 3 4 5
9 Too much of my life would be disrupted if I decided I
wanted to leave my organisation now. 1 2 3 4 5
10 I feel that I have too few options to consider leaving this
organisation. 1 2 3 4 5
11 If I had not already put so much of myself into this
organisation, I might consider working elsewhere. 1 2 3 4 5
12 One of the few negative consequences of leaving this
organisation would be the scarcity of available alternatives. 1 2 3 4 5
13 I do not feel any obligation to remain with my current
employer. 1 2 3 4 5
14 Even if it were to my advantage, I do not feel it would be
right to leave my organisation now. 1 2 3 4 5

108
15 I would feel guilty if I left this organisation now. 1 2 3 4 5
16 This organisation deserved my loyalty. 1 2 3 4 5
17 I would not leave my organisation right now because I have a
sense of obligation to the people in it. 1 2 3 4 5
18 I owe a great deal to my organisation. 1 2 3 4 5
End of Survey
Thank you
Your cooperation is highly appreciated in completing this questionnaire.

109
APPENDIX B: CODING OF VARIABLES IN SPSS
Table B.1: Coding of Variables in SPSS
No. Variables Code
1. Altruistic Calling AC
2. Emotional Healing EH
3. Wisdom W
4. Persuasive Mapping PM
5. Organisational Stewardship OS
6. Affective Commitment A
7. Continuance Commitment CC
8. Normative Commitment NC

110
APPENDIX C: SPSS ANALYSES OUTPUTS
APPENDIX C1: DEMOGRAPHIC PROFILES OF RESPONDENTS
Table C1.1: Statistics of Demographic Profiles of Respondents
Gender Age
Educational
level
Position
level
N Valid 107 107 107 107
Missing 0 0 0 0
Mean 1.58 1.86 2.90 1.31
Std. Error of Mean .048 .087 .059 .0045
Median 2.00 2.00 3.00 1.00
Mode 2 2 3 1
Std. Deviation .496 .895 .613 .464
Variance .246 .801 .376 .215
Range 1 3 4 1
Minimum 1 1 1 1
Maximum 2 4 5 2
Organisation
al tenure
Working
duration
with
supervisor
Supervisor‟s
gender
N Valid 107 107 107
Missing 0 0 0
Mean 3.27 2.43 1.36
Std. Error of Mean .152 .141 .046
Median 3.00 2.00 1.00
Mode 5 2 1
Std. Deviation 1.570 1.454 .481
Variance 2.464 2.115 .231
Range 4 6 1
Minimum 1 1 1
Maximum 5 7 2
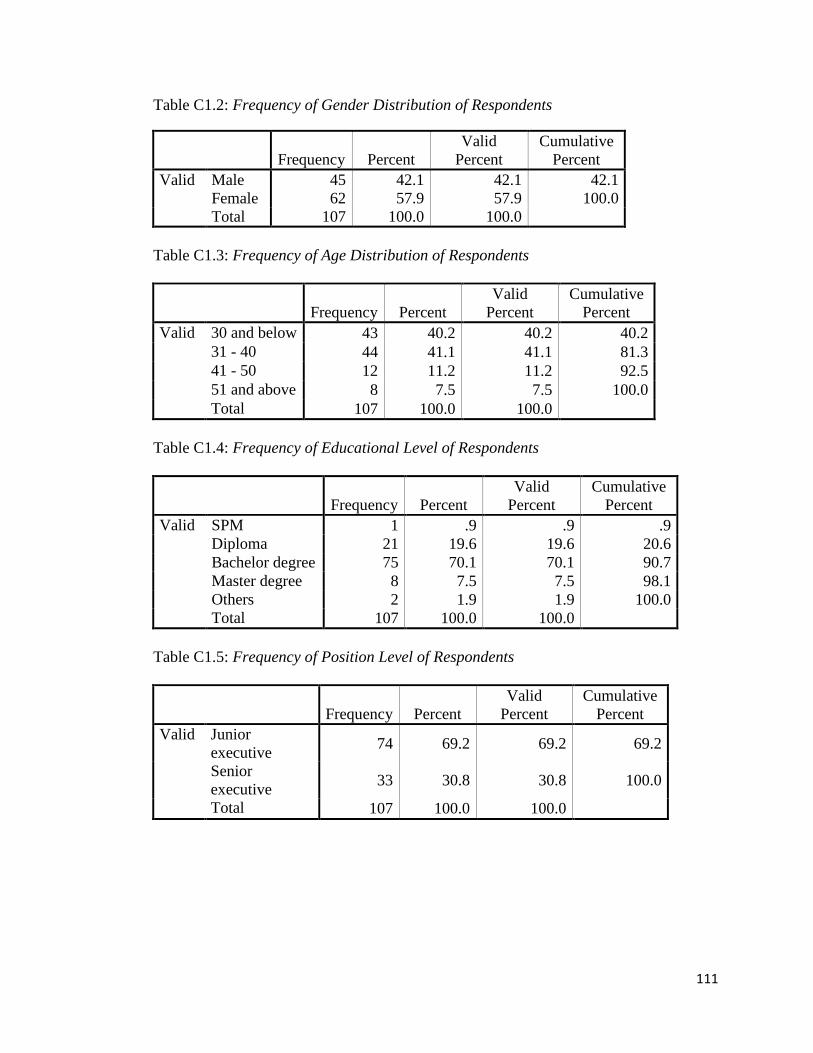
111
Table C1.2: Frequency of Gender Distribution of Respondents
Frequency Percent
Valid
Percent
Cumulative
Percent
Valid Male 45 42.1 42.1 42.1
Female 62 57.9 57.9 100.0
Total 107 100.0 100.0
Table C1.3: Frequency of Age Distribution of Respondents
Frequency Percent
Valid
Percent
Cumulative
Percent
Valid 30 and below 43 40.2 40.2 40.2
31 - 40 44 41.1 41.1 81.3
41 - 50 12 11.2 11.2 92.5
51 and above 8 7.5 7.5 100.0
Total 107 100.0 100.0
Table C1.4: Frequency of Educational Level of Respondents
Frequency Percent
Valid
Percent
Cumulative
Percent
Valid SPM 1 .9 .9 .9
Diploma 21 19.6 19.6 20.6
Bachelor degree 75 70.1 70.1 90.7
Master degree 8 7.5 7.5 98.1
Others 2 1.9 1.9 100.0
Total 107 100.0 100.0
Table C1.5: Frequency of Position Level of Respondents
Frequency Percent
Valid
Percent
Cumulative
Percent
Valid Junior
executive 74 69.2 69.2 69.2
Senior
executive 33 30.8 30.8 100.0
Total 107 100.0 100.0
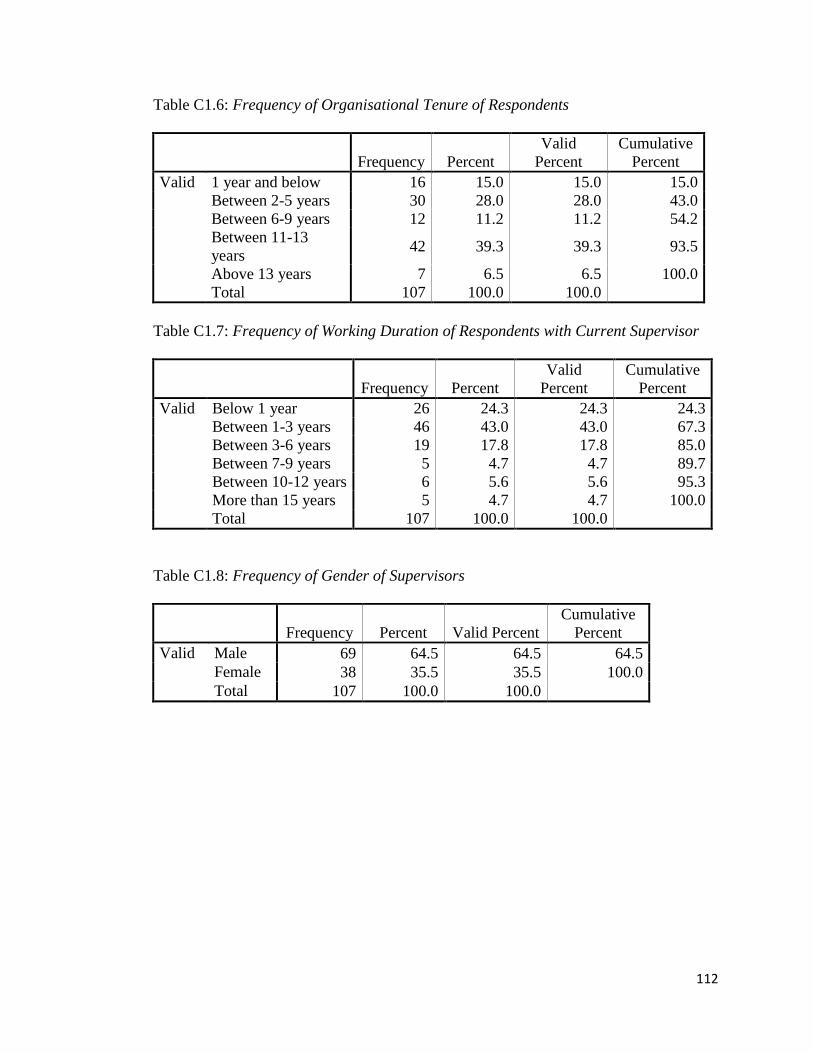
112
Table C1.6: Frequency of Organisational Tenure of Respondents
Frequency Percent
Valid
Percent
Cumulative
Percent
Valid 1 year and below 16 15.0 15.0 15.0
Between 2-5 years 30 28.0 28.0 43.0
Between 6-9 years 12 11.2 11.2 54.2
Between 11-13
years 42 39.3 39.3 93.5
Above 13 years 7 6.5 6.5 100.0
Total 107 100.0 100.0
Table C1.7: Frequency of Working Duration of Respondents with Current Supervisor
Frequency Percent
Valid
Percent
Cumulative
Percent
Valid Below 1 year 26 24.3 24.3 24.3
Between 1-3 years 46 43.0 43.0 67.3
Between 3-6 years 19 17.8 17.8 85.0
Between 7-9 years 5 4.7 4.7 89.7
Between 10-12 years 6 5.6 5.6 95.3
More than 15 years 5 4.7 4.7 100.0
Total 107 100.0 100.0
Table C1.8: Frequency of Gender of Supervisors
Frequency Percent Valid Percent
Cumulative
Percent
Valid Male 69 64.5 64.5 64.5
Female 38 35.5 35.5 100.0
Total 107 100.0 100.0
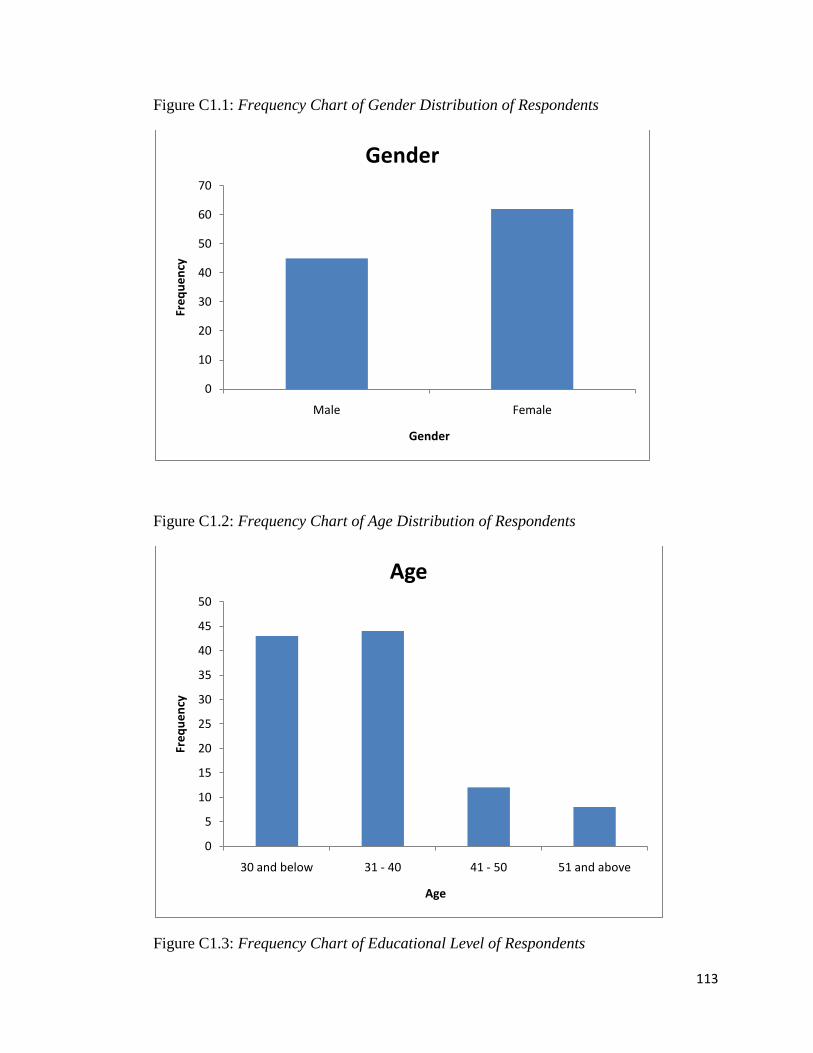
113
Figure C1.1: Frequency Chart of Gender Distribution of Respondents
Figure C1.2: Frequency Chart of Age Distribution of Respondents
Figure C1.3: Frequency Chart of Educational Level of Respondents
0
10
20
30
40
50
60
70
Male Female
Fre
qu
en
cy
Gender
Gender
0
5
10
15
20
25
30
35
40
45
50
30 and below 31 - 40 41 - 50 51 and above
Fre
qu
en
cy
Age
Age
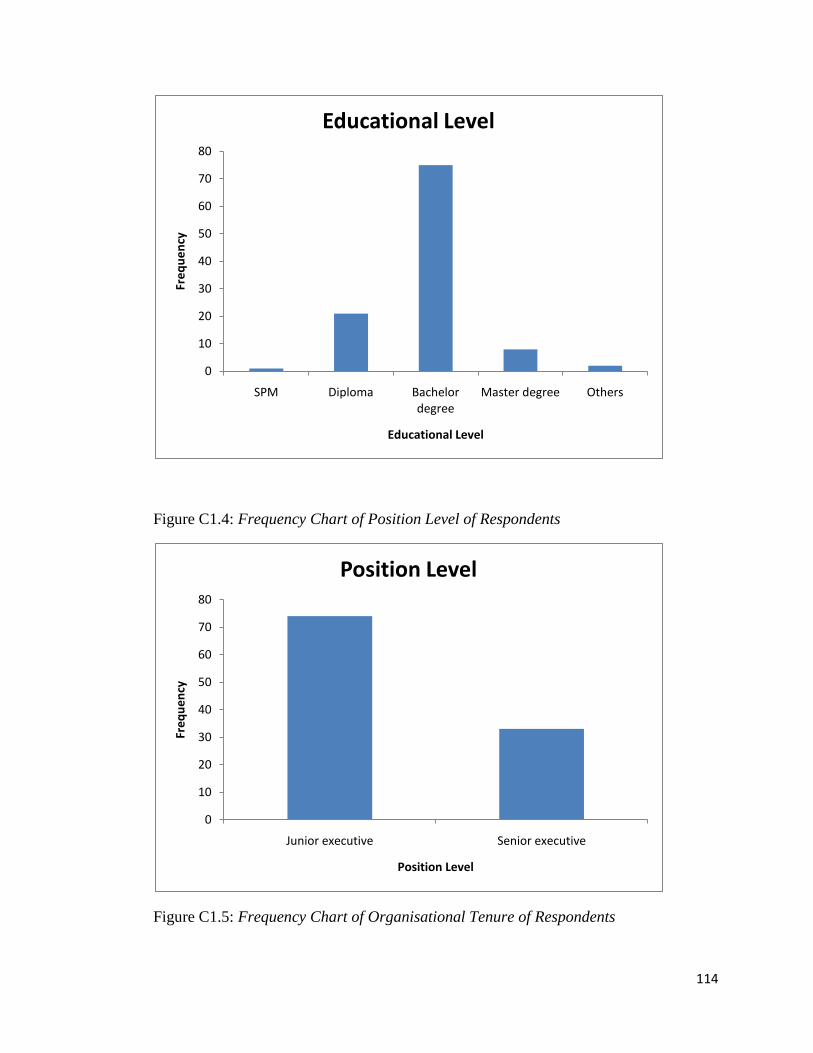
114
Figure C1.4: Frequency Chart of Position Level of Respondents
Figure C1.5: Frequency Chart of Organisational Tenure of Respondents
0
10
20
30
40
50
60
70
80
SPM Diploma Bachelor degree
Master degree Others
Fre
qu
en
cy
Educational Level
Educational Level
0
10
20
30
40
50
60
70
80
Junior executive Senior executive
Fre
qu
en
cy
Position Level
Position Level

115
Figure C1.6: Frequency Chart of Working Duration of Respondents with Current
Supervisor
Figure C1.7: Frequency Chart of Supervisor’s Gender
0
5
10
15
20
25
30
35
40
45
1 year and below
2-5 years 6-9 years 11-13 years Above 13 years
Fre
qu
en
cy
Organization Tenure
Organization Tenure
0
5
10
15
20
25
30
35
40
45
50
Below 1 year 1-3 years 3-6 years 7-9 years 10-12 years More than 15 years
Fre
qu
en
cy
Working Duration with Current Supervisor
Working Duration with Current Supervisor

116
APPENDIX C2: FACTOR ANALYSIS ON THE INDEPENDENT VARIABLES
0
10
20
30
40
50
60
70
80
Male Female
Fre
qu
en
cy
Supervisor's Gender
Supervisor's Gender

117
Table C2.1: KMO Value and Bartlett's Test of Sphericity of Independent Variables
Kaiser-Meyer-Olkin Measure of
Sampling Adequacy. .892
Bartlett's Test of
Sphericity
Approx. Chi-
Square
2112.33
6
df 253
Sig. .000
Table C2.2: Correlation Matrix between Altruistic Calling and Other Independent
Variables
AC1 AC2 AC3 AC4
Correlation AC1 1.000 .724 .663 .637
AC2 .724 1.000 .621 .499
AC3 .663 .621 1.000 .720
AC4 .637 .499 .720 1.000
EH1 .464 .374 .529 .668
EH2 .492 .544 .576 .652
EH3 .523 .533 .673 .659
EH4 .572 .516 .641 .694
W1 .384 .464 .494 .480
W2 .476 .381 .609 .581
W3 .457 .397 .342 .447
W4 .399 .286 .311 .438
W5 .522 .501 .590 .648
PM1 .429 .224 .451 .557
PM2 .493 .480 .477 .458
PM3 .462 .497 .509 .534
PM4 .455 .514 .512 .537
PM5 .392 .544 .382 .506
OS1 .495 .550 .427 .522
OS2 .425 .424 .406 .556
OS3 .600 .569 .604 .618
OS4 .357 .455 .481 .558
OS5 .497 .481 .468 .531
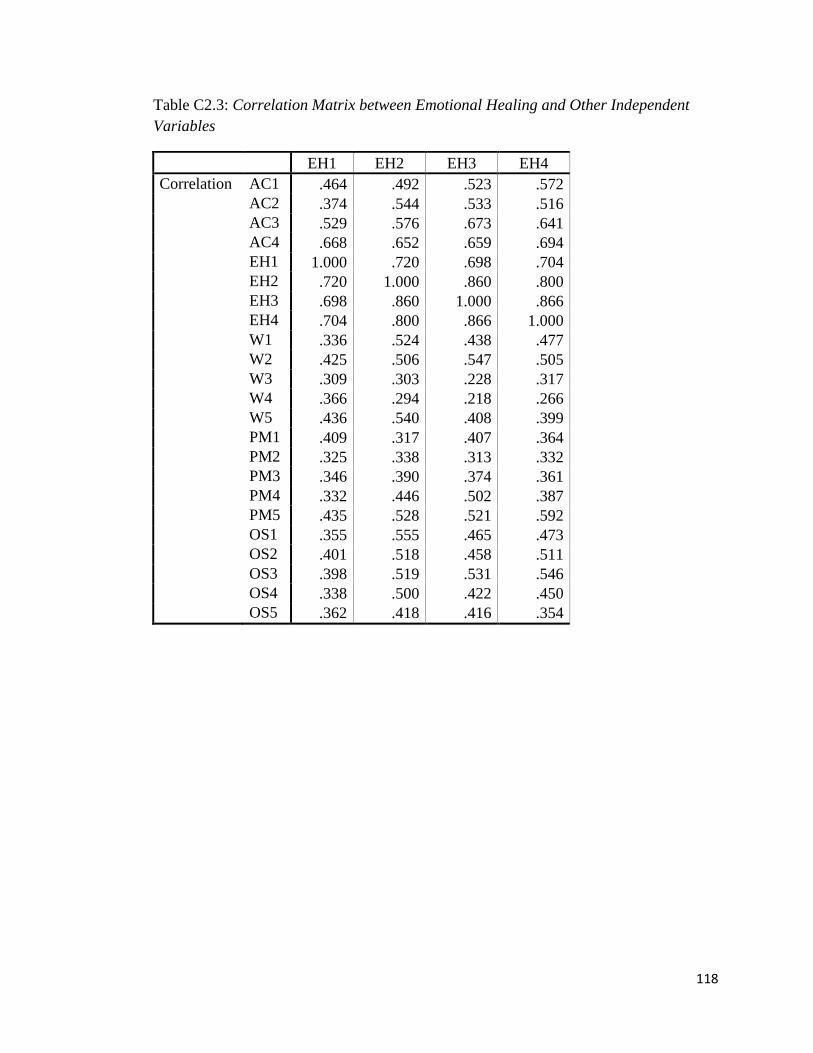
118
Table C2.3: Correlation Matrix between Emotional Healing and Other Independent
Variables
EH1 EH2 EH3 EH4
Correlation AC1 .464 .492 .523 .572
AC2 .374 .544 .533 .516
AC3 .529 .576 .673 .641
AC4 .668 .652 .659 .694
EH1 1.000 .720 .698 .704
EH2 .720 1.000 .860 .800
EH3 .698 .860 1.000 .866
EH4 .704 .800 .866 1.000
W1 .336 .524 .438 .477
W2 .425 .506 .547 .505
W3 .309 .303 .228 .317
W4 .366 .294 .218 .266
W5 .436 .540 .408 .399
PM1 .409 .317 .407 .364
PM2 .325 .338 .313 .332
PM3 .346 .390 .374 .361
PM4 .332 .446 .502 .387
PM5 .435 .528 .521 .592
OS1 .355 .555 .465 .473
OS2 .401 .518 .458 .511
OS3 .398 .519 .531 .546
OS4 .338 .500 .422 .450
OS5 .362 .418 .416 .354

119
Table C2.4: Correlation Matrix between Wisdom and Other Independent Variables
W1 W2 W3 W4 W5
Correlation AC1 .384 .476 .457 .399 .522
AC2 .464 .381 .397 .286 .501
AC3 .494 .609 .342 .311 .590
AC4 .480 .581 .447 .438 .648
EH1 .336 .425 .309 .366 .436
EH2 .524 .506 .303 .294 .540
EH3 .438 .547 .228 .218 .408
EH4 .477 .505 .317 .266 .399
W1 1.000 .589 .581 .363 .637
W2 .589 1.000 .583 .554 .632
W3 .581 .583 1.000 .647 .647
W4 .363 .554 .647 1.000 .565
W5 .637 .632 .647 .565 1.000
PM1 .319 .576 .427 .508 .527
PM2 .431 .359 .417 .312 .465
PM3 .426 .421 .440 .312 .577
PM4 .556 .600 .486 .342 .514
PM5 .348 .245 .254 .139 .314
OS1 .376 .393 .519 .473 .514
OS2 .440 .415 .441 .405 .518
OS3 .424 .531 .456 .559 .587
OS4 .488 .455 .453 .451 .640
OS5 .372 .452 .432 .507 .545
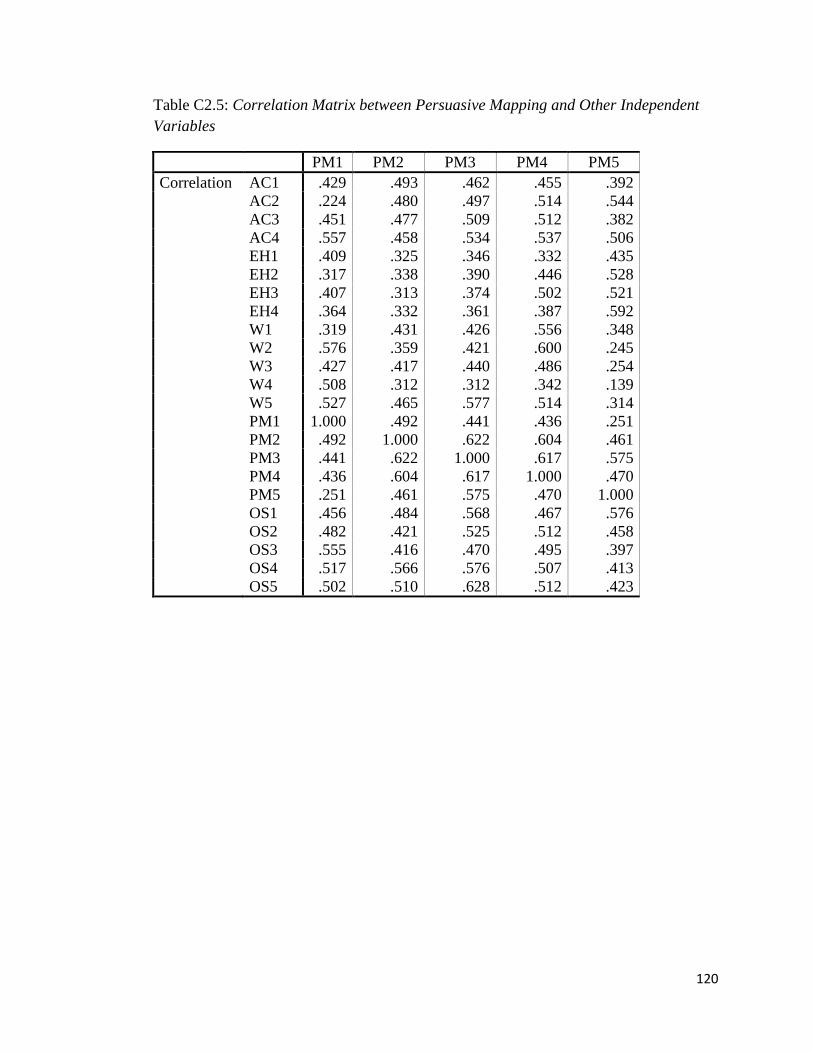
120
Table C2.5: Correlation Matrix between Persuasive Mapping and Other Independent
Variables
PM1 PM2 PM3 PM4 PM5
Correlation AC1 .429 .493 .462 .455 .392
AC2 .224 .480 .497 .514 .544
AC3 .451 .477 .509 .512 .382
AC4 .557 .458 .534 .537 .506
EH1 .409 .325 .346 .332 .435
EH2 .317 .338 .390 .446 .528
EH3 .407 .313 .374 .502 .521
EH4 .364 .332 .361 .387 .592
W1 .319 .431 .426 .556 .348
W2 .576 .359 .421 .600 .245
W3 .427 .417 .440 .486 .254
W4 .508 .312 .312 .342 .139
W5 .527 .465 .577 .514 .314
PM1 1.000 .492 .441 .436 .251
PM2 .492 1.000 .622 .604 .461
PM3 .441 .622 1.000 .617 .575
PM4 .436 .604 .617 1.000 .470
PM5 .251 .461 .575 .470 1.000
OS1 .456 .484 .568 .467 .576
OS2 .482 .421 .525 .512 .458
OS3 .555 .416 .470 .495 .397
OS4 .517 .566 .576 .507 .413
OS5 .502 .510 .628 .512 .423
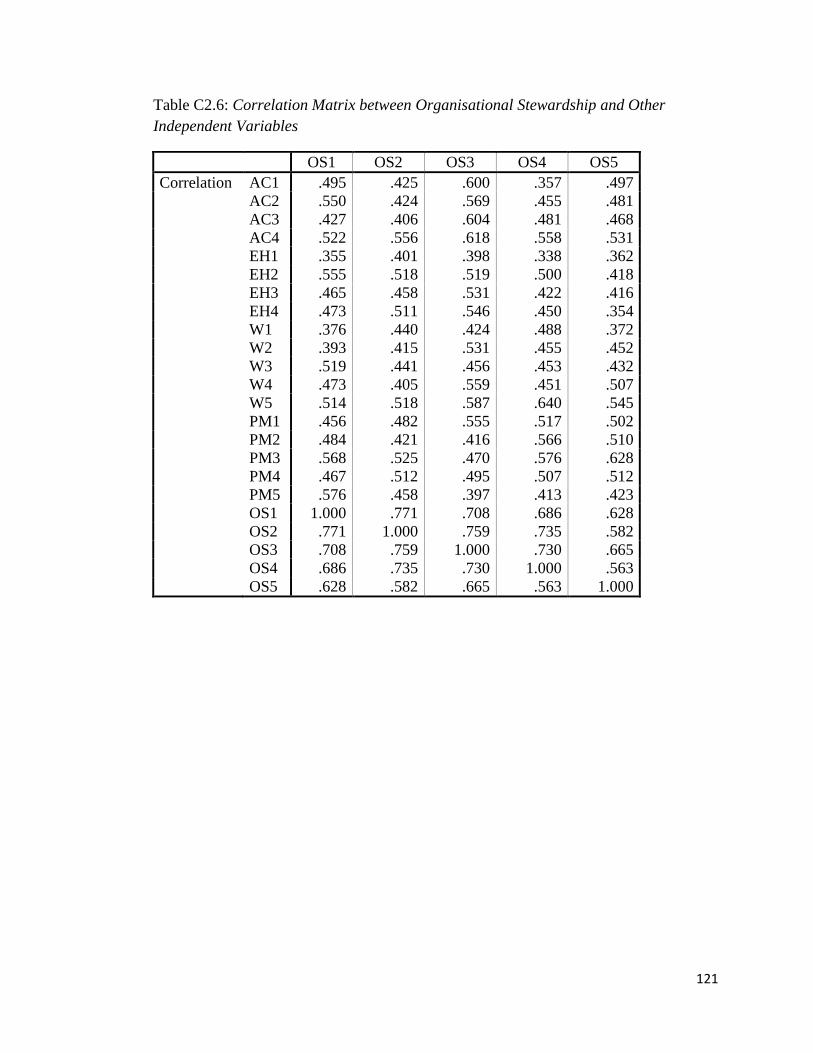
121
Table C2.6: Correlation Matrix between Organisational Stewardship and Other
Independent Variables
OS1 OS2 OS3 OS4 OS5
Correlation AC1 .495 .425 .600 .357 .497
AC2 .550 .424 .569 .455 .481
AC3 .427 .406 .604 .481 .468
AC4 .522 .556 .618 .558 .531
EH1 .355 .401 .398 .338 .362
EH2 .555 .518 .519 .500 .418
EH3 .465 .458 .531 .422 .416
EH4 .473 .511 .546 .450 .354
W1 .376 .440 .424 .488 .372
W2 .393 .415 .531 .455 .452
W3 .519 .441 .456 .453 .432
W4 .473 .405 .559 .451 .507
W5 .514 .518 .587 .640 .545
PM1 .456 .482 .555 .517 .502
PM2 .484 .421 .416 .566 .510
PM3 .568 .525 .470 .576 .628
PM4 .467 .512 .495 .507 .512
PM5 .576 .458 .397 .413 .423
OS1 1.000 .771 .708 .686 .628
OS2 .771 1.000 .759 .735 .582
OS3 .708 .759 1.000 .730 .665
OS4 .686 .735 .730 1.000 .563
OS5 .628 .582 .665 .563 1.000

122
Table C2.7: Total Variance Explained of Independent Variables
Comp
onent Initial Eigenvalues
Extraction Sums of
Squared Loadings
Rotation Sums of Squared
Loadings
Total
% of
Varian
ce
Cumula
tive % Total
% of
Varian
ce
Cumula
tive % Total
% of
Varianc
e
Cumula
tive %
1 11.801 51.307 51.307 11.801 51.307 51.307 4.991 21.702 21.702
2 2.031 8.832 60.139 2.031 8.832 60.139 3.874 16.844 38.546
3 1.420 6.175 66.315 1.420 6.175 66.315 3.852 16.749 55.295
4 1.153 5.015 71.329 1.153 5.015 71.329 3.688 16.034 71.329
5 .899 3.907 75.236
6 .868 3.773 79.009
7 .706 3.071 82.079
8 .549 2.386 84.465
9 .503 2.185 86.650
10 .425 1.847 88.497
11 .360 1.563 90.060
12 .337 1.464 91.524
13 .319 1.388 92.911
14 .285 1.241 94.152
15 .239 1.037 95.190
16 .212 .921 96.110
17 .206 .895 97.005
18 .187 .813 97.818
19 .156 .678 98.496
20 .119 .519 99.015
21 .103 .450 99.464
22 .069 .302 99.766
23 .054 .234
100.00
0
Extraction Method: Principal Component Analysis.
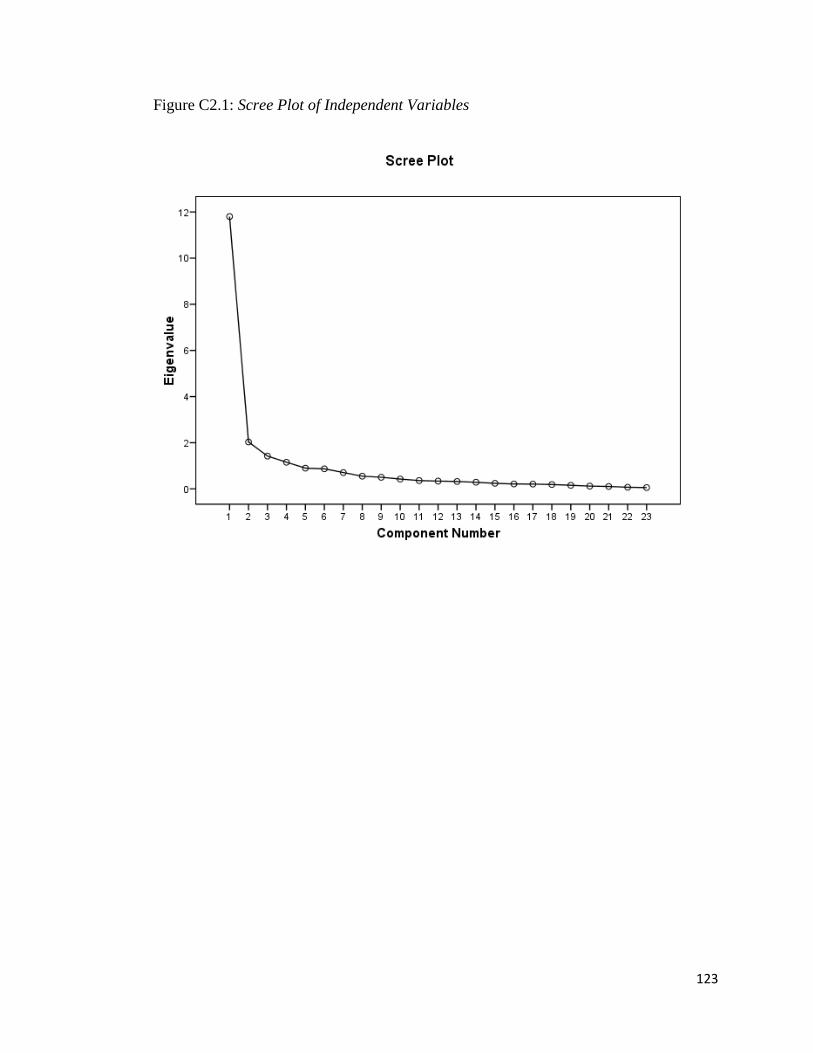
123
Figure C2.1: Scree Plot of Independent Variables
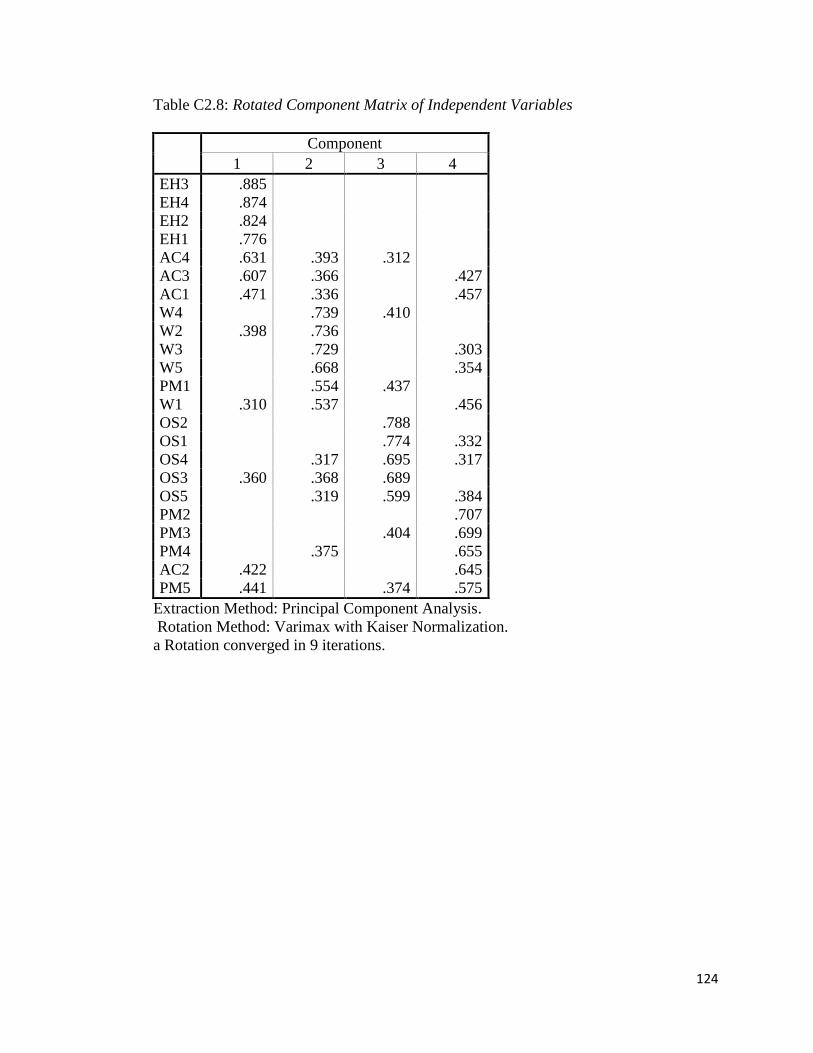
124
Table C2.8: Rotated Component Matrix of Independent Variables
Component
1 2 3 4
EH3 .885
EH4 .874
EH2 .824
EH1 .776
AC4 .631 .393 .312
AC3 .607 .366 .427
AC1 .471 .336 .457
W4 .739 .410
W2 .398 .736
W3 .729 .303
W5 .668 .354
PM1 .554 .437
W1 .310 .537 .456
OS2 .788
OS1 .774 .332
OS4 .317 .695 .317
OS3 .360 .368 .689
OS5 .319 .599 .384
PM2 .707
PM3 .404 .699
PM4 .375 .655
AC2 .422 .645
PM5 .441 .374 .575
Extraction Method: Principal Component Analysis.
Rotation Method: Varimax with Kaiser Normalization.
a Rotation converged in 9 iterations.
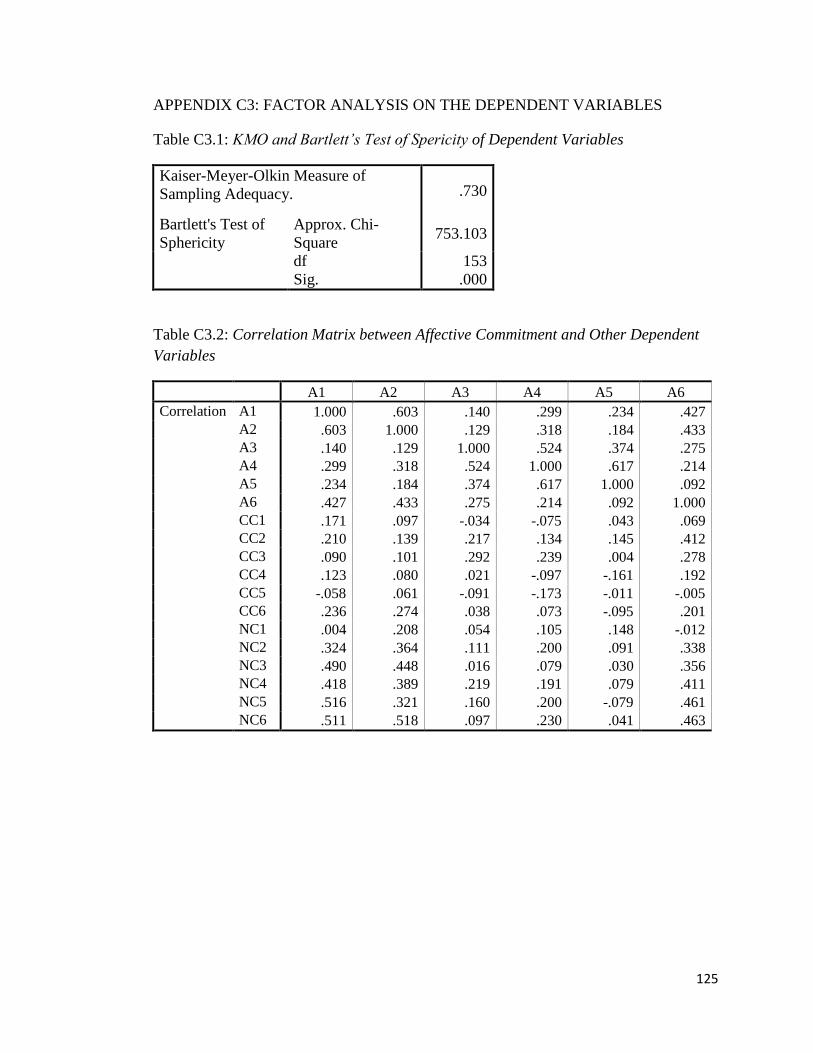
125
APPENDIX C3: FACTOR ANALYSIS ON THE DEPENDENT VARIABLES
Table C3.1: KMO and Bartlett’s Test of Spericity of Dependent Variables
Kaiser-Meyer-Olkin Measure of
Sampling Adequacy. .730
Bartlett's Test of
Sphericity
Approx. Chi-
Square 753.103
df 153
Sig. .000
Table C3.2: Correlation Matrix between Affective Commitment and Other Dependent
Variables
A1 A2 A3 A4 A5 A6
Correlation A1 1.000 .603 .140 .299 .234 .427
A2 .603 1.000 .129 .318 .184 .433
A3 .140 .129 1.000 .524 .374 .275
A4 .299 .318 .524 1.000 .617 .214
A5 .234 .184 .374 .617 1.000 .092
A6 .427 .433 .275 .214 .092 1.000
CC1 .171 .097 -.034 -.075 .043 .069
CC2 .210 .139 .217 .134 .145 .412
CC3 .090 .101 .292 .239 .004 .278
CC4 .123 .080 .021 -.097 -.161 .192
CC5 -.058 .061 -.091 -.173 -.011 -.005
CC6 .236 .274 .038 .073 -.095 .201
NC1 .004 .208 .054 .105 .148 -.012
NC2 .324 .364 .111 .200 .091 .338
NC3 .490 .448 .016 .079 .030 .356
NC4 .418 .389 .219 .191 .079 .411
NC5 .516 .321 .160 .200 -.079 .461
NC6 .511 .518 .097 .230 .041 .463

126
Table C3.3: Correlation Matrix between Continuance Commitment and Other
Dependent Variables
CC1 CC2 CC3 CC4 CC5 CC6
Correlation A1 .171 .210 .090 .123 -.058 .236
A2 .097 .139 .101 .080 .061 .274
A3 -.034 .217 .292 .021 -.091 .038
A4 -.075 .134 .239 -.097 -.173 .073
A5 .043 .145 .004 -.161 -.011 -.095
A6 .069 .412 .278 .192 -.005 .201
CC1 1.000 .185 .196 .180 .238 .186
CC2 .185 1.000 .489 .411 .222 .216
CC3 .196 .489 1.000 .353 .178 .339
CC4 .180 .411 .353 1.000 .140 .516
CC5 .238 .222 .178 .140 1.000 .215
CC6 .186 .216 .339 .516 .215 1.000
NC1 -.178 .001 -.060 -.129 -.163 -.146
NC2 .005 .381 .509 .327 .162 .320
NC3 .084 .352 .116 .308 .010 .359
NC4 .257 .382 .282 .206 -.015 .169
NC5 -.093 .389 .362 .297 -.001 .277
NC6 .085 .205 .302 .168 -.018 .260
Table C3.4: Correlation Matrix between Normative Commitment and Other Dependent
Variables
NC1 NC2 NC3 NC4 NC5 NC6
Correlation A1 .004 .324 .490 .418 .516 .511
A2 .208 .364 .448 .389 .321 .518
A3 .054 .111 .016 .219 .160 .097
A4 .105 .200 .079 .191 .200 .230
A5 .148 .091 .030 .079 -.079 .041
A6 -.012 .338 .356 .411 .461 .463
CC1 -.178 .005 .084 .257 -.093 .085
CC2 .001 .381 .352 .382 .389 .205
CC3 -.060 .509 .116 .282 .362 .302
CC4 -.129 .327 .308 .206 .297 .168
CC5 -.163 .162 .010 -.015 -.001 -.018
CC6 -.146 .320 .359 .169 .277 .260
NC1 1.000 -.056 .111 -.008 .068 .147
NC2 -.056 1.000 .345 .325 .505 .501
NC3 .111 .345 1.000 .385 .615 .527
NC4 -.008 .325 .385 1.000 .537 .551
NC5 .068 .505 .615 .537 1.000 .650
NC6 .147 .501 .527 .551 .650 1.000
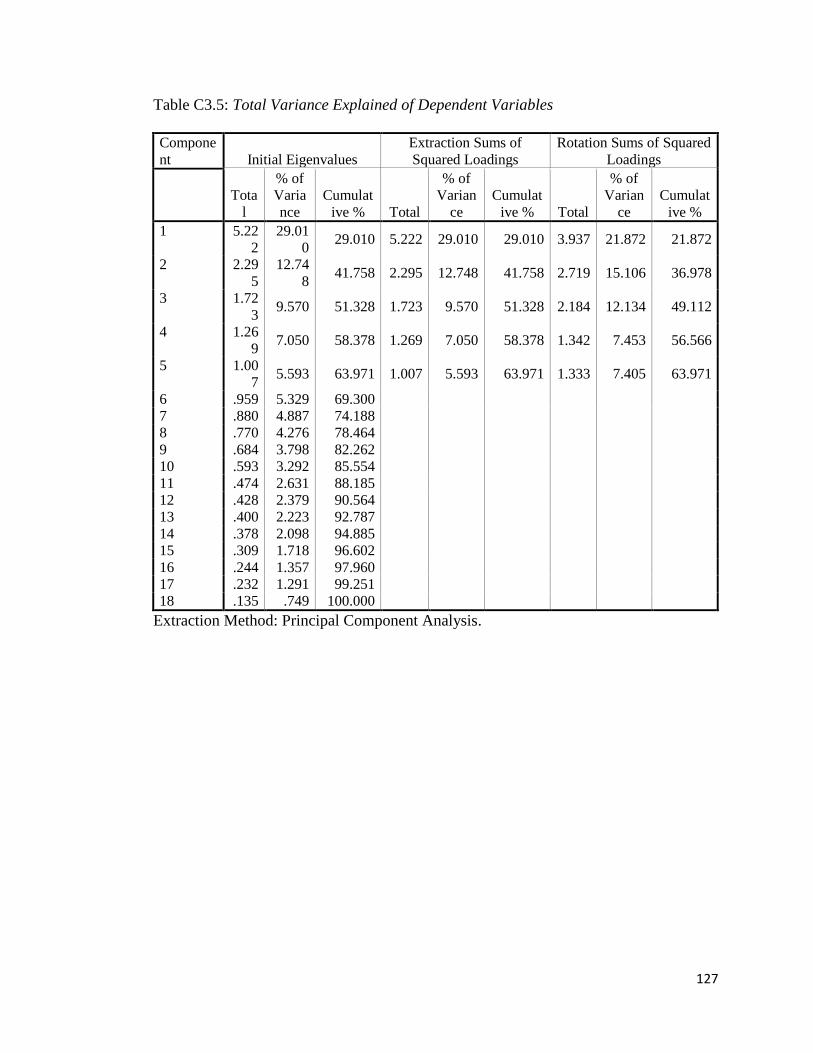
127
Table C3.5: Total Variance Explained of Dependent Variables
Compone
nt Initial Eigenvalues
Extraction Sums of
Squared Loadings
Rotation Sums of Squared
Loadings
Tota
l
% of
Varia
nce
Cumulat
ive % Total
% of
Varian
ce
Cumulat
ive % Total
% of
Varian
ce
Cumulat
ive %
1 5.22
2
29.01
0 29.010 5.222 29.010 29.010 3.937 21.872 21.872
2 2.29
5
12.74
8 41.758 2.295 12.748 41.758 2.719 15.106 36.978
3 1.72
3 9.570 51.328 1.723 9.570 51.328 2.184 12.134 49.112
4 1.26
9 7.050 58.378 1.269 7.050 58.378 1.342 7.453 56.566
5 1.00
7 5.593 63.971 1.007 5.593 63.971 1.333 7.405 63.971
6 .959 5.329 69.300
7 .880 4.887 74.188
8 .770 4.276 78.464
9 .684 3.798 82.262
10 .593 3.292 85.554
11 .474 2.631 88.185
12 .428 2.379 90.564
13 .400 2.223 92.787
14 .378 2.098 94.885
15 .309 1.718 96.602
16 .244 1.357 97.960
17 .232 1.291 99.251
18 .135 .749 100.000
Extraction Method: Principal Component Analysis.

128
Figure C3.1: Scree Plot of Dependent Variables

129
Table C3.6: Rotated Component Matrix of Dependent Variables
Component
1 2 3 4 5
A1 .792
NC6 .788
A2 .743
NC3 .730
NC5 .686 .494
NC4 .642 .338
A6 .565 .342
CC3 .795
CC2 .662
CC4 .620 .312
NC2 .400 .577
A5 .849
A4 .824
A3 .346 .673
CC1 .790
NC1 -.595
CC5 .667
CC6 .422 .563
Extraction Method: Principal Component Analysis.
Rotation Method: Varimax with Kaiser Normalization.
a Rotation converged in 9 iterations.
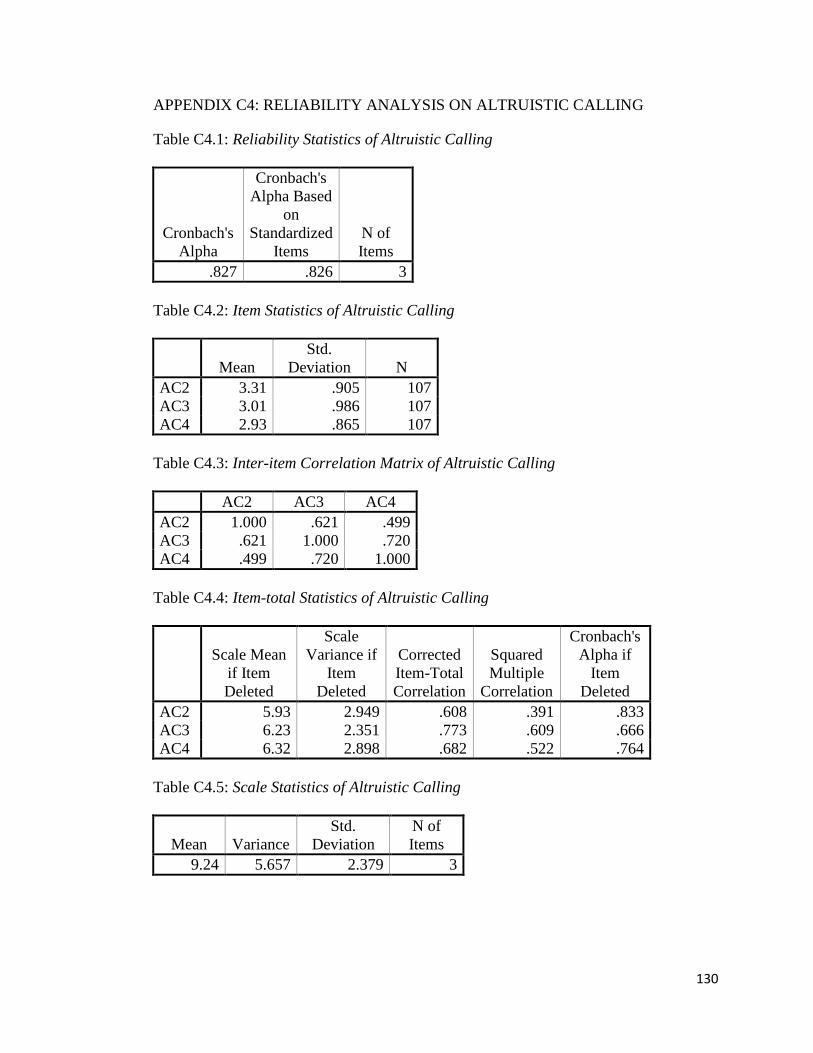
130
APPENDIX C4: RELIABILITY ANALYSIS ON ALTRUISTIC CALLING
Table C4.1: Reliability Statistics of Altruistic Calling
Cronbach's
Alpha
Cronbach's
Alpha Based
on
Standardized
Items
N of
Items
.827 .826 3
Table C4.2: Item Statistics of Altruistic Calling
Mean
Std.
Deviation N
AC2 3.31 .905 107
AC3 3.01 .986 107
AC4 2.93 .865 107
Table C4.3: Inter-item Correlation Matrix of Altruistic Calling
AC2 AC3 AC4
AC2 1.000 .621 .499
AC3 .621 1.000 .720
AC4 .499 .720 1.000
Table C4.4: Item-total Statistics of Altruistic Calling
Scale Mean
if Item
Deleted
Scale
Variance if
Item
Deleted
Corrected
Item-Total
Correlation
Squared
Multiple
Correlation
Cronbach's
Alpha if
Item
Deleted
AC2 5.93 2.949 .608 .391 .833
AC3 6.23 2.351 .773 .609 .666
AC4 6.32 2.898 .682 .522 .764
Table C4.5: Scale Statistics of Altruistic Calling
Mean Variance
Std.
Deviation
N of
Items
9.24 5.657 2.379 3
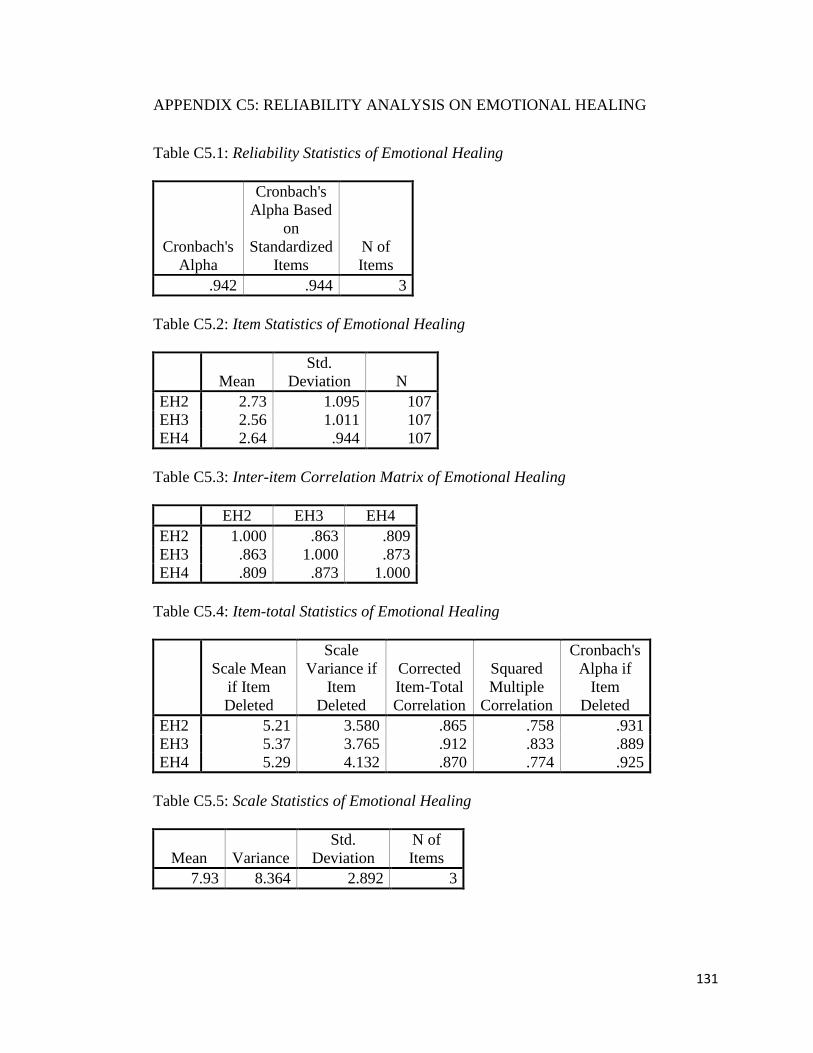
131
APPENDIX C5: RELIABILITY ANALYSIS ON EMOTIONAL HEALING
Table C5.1: Reliability Statistics of Emotional Healing
Cronbach's
Alpha
Cronbach's
Alpha Based
on
Standardized
Items
N of
Items
.942 .944 3
Table C5.2: Item Statistics of Emotional Healing
Mean
Std.
Deviation N
EH2 2.73 1.095 107
EH3 2.56 1.011 107
EH4 2.64 .944 107
Table C5.3: Inter-item Correlation Matrix of Emotional Healing
EH2 EH3 EH4
EH2 1.000 .863 .809
EH3 .863 1.000 .873
EH4 .809 .873 1.000
Table C5.4: Item-total Statistics of Emotional Healing
Scale Mean
if Item
Deleted
Scale
Variance if
Item
Deleted
Corrected
Item-Total
Correlation
Squared
Multiple
Correlation
Cronbach's
Alpha if
Item
Deleted
EH2 5.21 3.580 .865 .758 .931
EH3 5.37 3.765 .912 .833 .889
EH4 5.29 4.132 .870 .774 .925
Table C5.5: Scale Statistics of Emotional Healing
Mean Variance
Std.
Deviation
N of
Items
7.93 8.364 2.892 3

132
APPENDIX C6: RELIABILITY ANALYSIS ON WISDOM
Table C6.1: Reliability Statistics of Wisdom
Cronbach's
Alpha
Cronbach's Alpha
Based on
Standardized
Items N of Items
.871 .873 5
Table C6.2: Item Statistics of Wisdom
Mean
Std.
Deviation N
W1 3.55 .804 107
W2 3.44 .779 107
W3 3.66 .764 107
W4 3.42 .880 107
W5 3.70 .767 107
Table C6.3: Inter-item Correlation Matrix of Wisdom
W1 W2 W3 W4 W5
W1 1.000 .589 .581 .363 .637
W2 .589 1.000 .583 .554 .632
W3 .581 .583 1.000 .647 .647
W4 .363 .554 .647 1.000 .565
W5 .637 .632 .647 .565 1.000
Table C6.4: Item-total Statistics of Wisdom
Scale Mean if
Item Deleted
Scale
Variance if
Item Deleted
Corrected
Item-Total
Correlation
Squared
Multiple
Correlation
Cronbach's
Alpha if Item
Deleted
W1 14.22 7.157 .640 .510 .857
W2 14.34 6.999 .715 .518 .839
W3 14.11 6.931 .755 .586 .830
W4 14.36 6.873 .630 .501 .863
W5 14.07 6.900 .760 .584 .829
Table C6.5: Scale Statistics of Wisdom
Mean Variance
Std.
Deviation
N of
Items
17.78 10.553 3.249 5
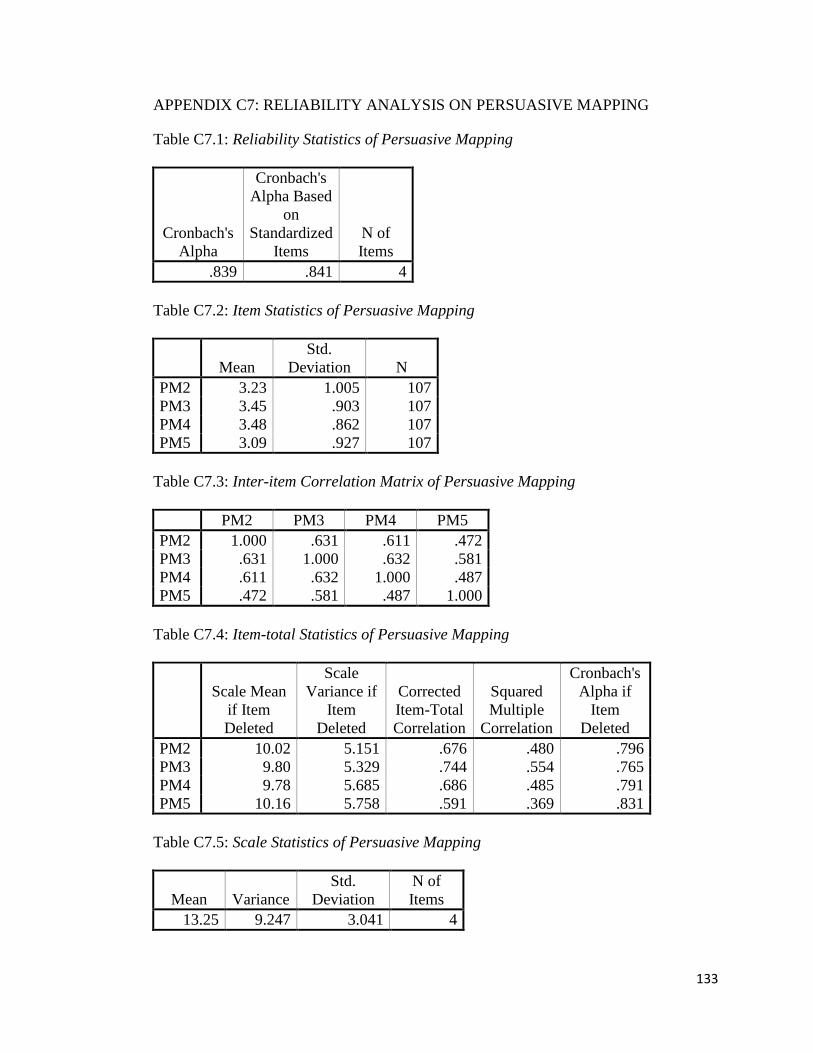
133
APPENDIX C7: RELIABILITY ANALYSIS ON PERSUASIVE MAPPING
Table C7.1: Reliability Statistics of Persuasive Mapping
Cronbach's
Alpha
Cronbach's
Alpha Based
on
Standardized
Items
N of
Items
.839 .841 4
Table C7.2: Item Statistics of Persuasive Mapping
Mean
Std.
Deviation N
PM2 3.23 1.005 107
PM3 3.45 .903 107
PM4 3.48 .862 107
PM5 3.09 .927 107
Table C7.3: Inter-item Correlation Matrix of Persuasive Mapping
PM2 PM3 PM4 PM5
PM2 1.000 .631 .611 .472
PM3 .631 1.000 .632 .581
PM4 .611 .632 1.000 .487
PM5 .472 .581 .487 1.000
Table C7.4: Item-total Statistics of Persuasive Mapping
Scale Mean
if Item
Deleted
Scale
Variance if
Item
Deleted
Corrected
Item-Total
Correlation
Squared
Multiple
Correlation
Cronbach's
Alpha if
Item
Deleted
PM2 10.02 5.151 .676 .480 .796
PM3 9.80 5.329 .744 .554 .765
PM4 9.78 5.685 .686 .485 .791
PM5 10.16 5.758 .591 .369 .831
Table C7.5: Scale Statistics of Persuasive Mapping
Mean Variance
Std.
Deviation
N of
Items
13.25 9.247 3.041 4
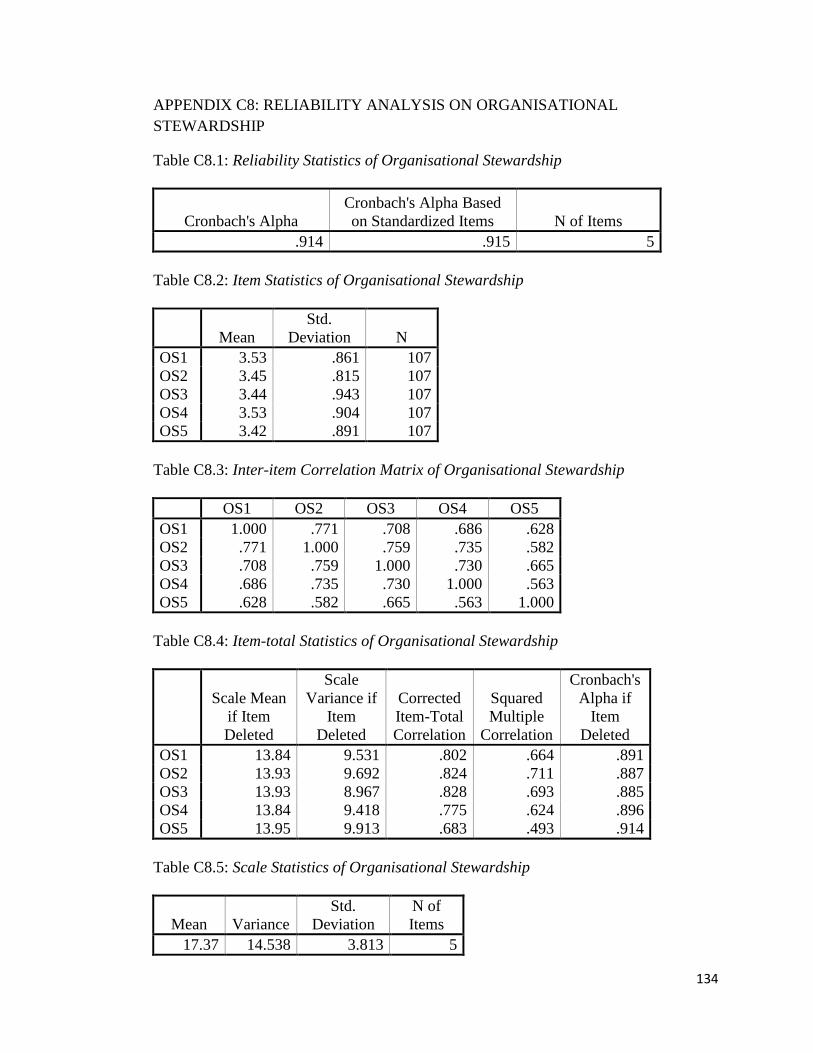
134
APPENDIX C8: RELIABILITY ANALYSIS ON ORGANISATIONAL
STEWARDSHIP
Table C8.1: Reliability Statistics of Organisational Stewardship
Cronbach's Alpha
Cronbach's Alpha Based
on Standardized Items N of Items
.914 .915 5
Table C8.2: Item Statistics of Organisational Stewardship
Mean
Std.
Deviation N
OS1 3.53 .861 107
OS2 3.45 .815 107
OS3 3.44 .943 107
OS4 3.53 .904 107
OS5 3.42 .891 107
Table C8.3: Inter-item Correlation Matrix of Organisational Stewardship
OS1 OS2 OS3 OS4 OS5
OS1 1.000 .771 .708 .686 .628
OS2 .771 1.000 .759 .735 .582
OS3 .708 .759 1.000 .730 .665
OS4 .686 .735 .730 1.000 .563
OS5 .628 .582 .665 .563 1.000
Table C8.4: Item-total Statistics of Organisational Stewardship
Scale Mean
if Item
Deleted
Scale
Variance if
Item
Deleted
Corrected
Item-Total
Correlation
Squared
Multiple
Correlation
Cronbach's
Alpha if
Item
Deleted
OS1 13.84 9.531 .802 .664 .891
OS2 13.93 9.692 .824 .711 .887
OS3 13.93 8.967 .828 .693 .885
OS4 13.84 9.418 .775 .624 .896
OS5 13.95 9.913 .683 .493 .914
Table C8.5: Scale Statistics of Organisational Stewardship
Mean Variance
Std.
Deviation
N of
Items
17.37 14.538 3.813 5

135
APPENDIX C9: RELIABILITY ANALYSIS ON AFFECTIVE COMMITMENT
Table C9.1: Reliability Statistics of Affective Commitment
Cronbach's
Alpha
Cronbach's Alpha Based
on Standardized Items N of Items
.738 .742 6
Table C9.2: Item Statistics of Affective Commitment
Mean Std. Deviation N
A1 2.93 .974 107
A2 2.89 .839 107
A3 3.11 .816 107
A4 3.03 .720 107
A5 3.12 .821 107
A6 3.14 .770 107
Table C9.3: Inter-item Correlation Matrix of Affective Commitment
A1 A2 A3 A4 A5 A6
A1 1.000 .603 .140 .299 .234 .427
A2 .603 1.000 .129 .318 .184 .433
A3 .140 .129 1.000 .524 .374 .275
A4 .299 .318 .524 1.000 .617 .214
A5 .234 .184 .374 .617 1.000 .092
A6 .427 .433 .275 .214 .092 1.000
Table C9.4: Item-total Statistics of Affective Commitment
Scale Mean if
Item Deleted
Scale
Variance if
Item Deleted
Corrected
Item-Total
Correlation
Squared
Multiple
Correlation
Cronbach's
Alpha if Item
Deleted
A1 15.29 7.076 .510 .415 .692
A2 15.34 7.603 .510 .423 .691
A3 15.11 8.138 .400 .323 .722
A4 15.20 7.763 .595 .518 .673
A5 15.10 8.018 .425 .394 .715
A6 15.08 8.172 .432 .283 .713
Table C9.5: Scale Statistics of Affective Commitment
Mean Variance
Std.
Deviation
N of
Items
18.22 10.666 3.266 6
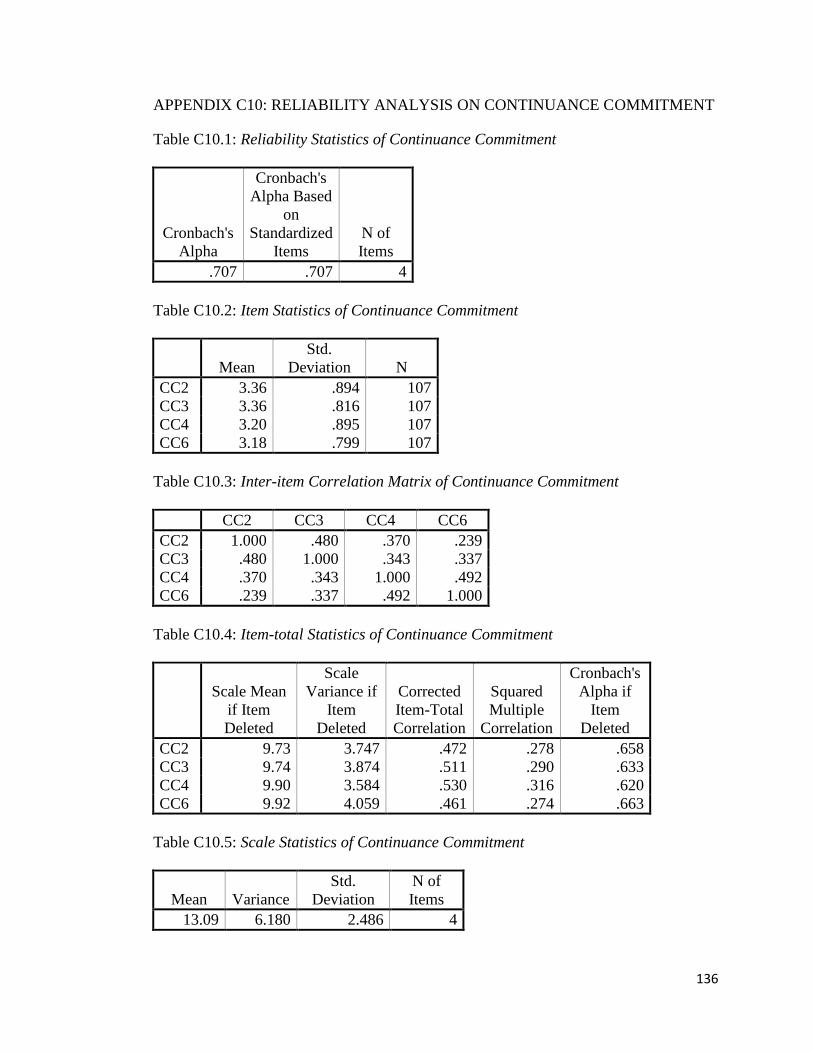
136
APPENDIX C10: RELIABILITY ANALYSIS ON CONTINUANCE COMMITMENT
Table C10.1: Reliability Statistics of Continuance Commitment
Cronbach's
Alpha
Cronbach's
Alpha Based
on
Standardized
Items
N of
Items
.707 .707 4
Table C10.2: Item Statistics of Continuance Commitment
Mean
Std.
Deviation N
CC2 3.36 .894 107
CC3 3.36 .816 107
CC4 3.20 .895 107
CC6 3.18 .799 107
Table C10.3: Inter-item Correlation Matrix of Continuance Commitment
CC2 CC3 CC4 CC6
CC2 1.000 .480 .370 .239
CC3 .480 1.000 .343 .337
CC4 .370 .343 1.000 .492
CC6 .239 .337 .492 1.000
Table C10.4: Item-total Statistics of Continuance Commitment
Scale Mean
if Item
Deleted
Scale
Variance if
Item
Deleted
Corrected
Item-Total
Correlation
Squared
Multiple
Correlation
Cronbach's
Alpha if
Item
Deleted
CC2 9.73 3.747 .472 .278 .658
CC3 9.74 3.874 .511 .290 .633
CC4 9.90 3.584 .530 .316 .620
CC6 9.92 4.059 .461 .274 .663
Table C10.5: Scale Statistics of Continuance Commitment
Mean Variance
Std.
Deviation
N of
Items
13.09 6.180 2.486 4

137
APPENDIX C11: RELIABILITY ANALYSIS ON NORMATIVE COMMITMENT
Table C11.1: Reliability Statistics of Normative Commitment
Cronbach's Alpha
Cronbach's Alpha Based
on Standardized Items N of Items
.830 .830 5
Table C11.2: Item Statistics of Normative Commitment
Mean
Std.
Deviation N
NC2 3.24 .738 107
NC3 2.81 .923 107
NC4 3.29 .765 107
NC5 3.13 .825 107
NC6 3.07 .843 107
Table C11.3: Inter-item Correlation Matrix of Normative Commitment
NC2 NC3 NC4 NC5 NC6
NC2 1.000 .345 .325 .505 .501
NC3 .345 1.000 .385 .615 .527
NC4 .325 .385 1.000 .537 .551
NC5 .505 .615 .537 1.000 .650
NC6 .501 .527 .551 .650 1.000
Table C11.4: Item-total Statistics of Normative Commitment
Scale Mean if
Item Deleted
Scale
Variance if
Item Deleted
Corrected
Item-Total
Correlation
Squared
Multiple
Correlation
Cronbach's
Alpha if Item
Deleted
NC2 12.31 7.423 .516 .307 .825
NC3 12.74 6.421 .592 .406 .810
NC4 12.26 7.157 .562 .359 .814
NC5 12.42 6.227 .761 .582 .757
NC6 12.48 6.271 .724 .531 .767
Table C11.5: Scale Statistics of Normative Commitment
Mean Variance
Std.
Deviation
N of
Items
15.55 10.042 3.169 5

138
APPENDIX C12: DESCRIPTIVE STATISTICS
Table C12.1: Descriptive Statistics of Independent and Dependent Variables
N
Minimu
m
Maximu
m Mean
Std.
Deviation
AC 107 1.33 5.00 3.0779 .79388
EH 107 1.00 5.00 2.6449 .96400
W 107 1.80 5.00 3.5495 .65190
PM 107 1.00 5.00 3.3131 .76022
OS 107 1.00 5.00 3.4729 .76350
A 107 1.17 4.17 3.0109 .56555
CC 107 2.00 4.75 3.2734 .62148
NC 107 1.60 4.60 3.0879 .64438
Valid N
(listwise) 107
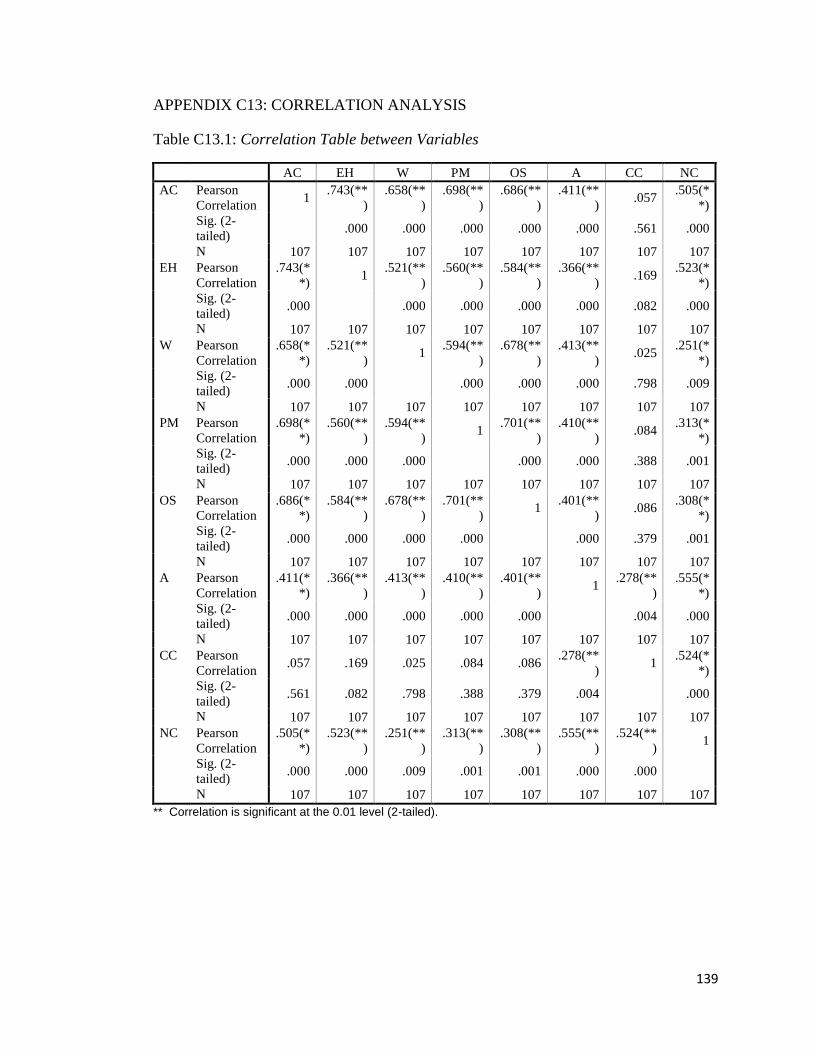
139
APPENDIX C13: CORRELATION ANALYSIS
Table C13.1: Correlation Table between Variables
AC EH W PM OS A CC NC
AC Pearson
Correlation 1
.743(**
)
.658(**
)
.698(**
)
.686(**
)
.411(**
) .057
.505(*
*)
Sig. (2-
tailed) .000 .000 .000 .000 .000 .561 .000
N 107 107 107 107 107 107 107 107
EH Pearson
Correlation
.743(*
*) 1
.521(**
)
.560(**
)
.584(**
)
.366(**
) .169
.523(*
*)
Sig. (2-
tailed) .000 .000 .000 .000 .000 .082 .000
N 107 107 107 107 107 107 107 107
W Pearson
Correlation
.658(*
*)
.521(**
) 1
.594(**
)
.678(**
)
.413(**
) .025
.251(*
*)
Sig. (2-
tailed) .000 .000 .000 .000 .000 .798 .009
N 107 107 107 107 107 107 107 107
PM Pearson
Correlation
.698(*
*)
.560(**
)
.594(**
) 1
.701(**
)
.410(**
) .084
.313(*
*)
Sig. (2-
tailed) .000 .000 .000 .000 .000 .388 .001
N 107 107 107 107 107 107 107 107
OS Pearson
Correlation
.686(*
*)
.584(**
)
.678(**
)
.701(**
) 1
.401(**
) .086
.308(*
*)
Sig. (2-
tailed) .000 .000 .000 .000 .000 .379 .001
N 107 107 107 107 107 107 107 107
A Pearson
Correlation
.411(*
*)
.366(**
)
.413(**
)
.410(**
)
.401(**
) 1
.278(**
)
.555(*
*)
Sig. (2-
tailed) .000 .000 .000 .000 .000 .004 .000
N 107 107 107 107 107 107 107 107
CC Pearson
Correlation .057 .169 .025 .084 .086
.278(**
) 1
.524(*
*)
Sig. (2-
tailed) .561 .082 .798 .388 .379 .004 .000
N 107 107 107 107 107 107 107 107
NC Pearson
Correlation
.505(*
*)
.523(**
)
.251(**
)
.313(**
)
.308(**
)
.555(**
)
.524(**
) 1
Sig. (2-
tailed) .000 .000 .009 .001 .001 .000 .000
N 107 107 107 107 107 107 107 107
** Correlation is significant at the 0.01 level (2-tailed).

140
APPENDIX C14: MULTIPLE REGRESSION ANALYSIS ON AFFECTIVE
COMMITMENT
Table C14.1: Multiple Regression Model Summary of Affective Commitment
Mo
del R
R
Squa
re
Adjuste
d R
Square
Std.
Error of
the
Estimat
e
Change Statistics
Durbi
n-
Wats
on
R
Square
Chang
e
F
Chang
e
df
1
df
2
Sig. F
Chan
ge
1 .535(
a) .287 .251 .48426 .287 8.035 5
10
0 .000 2.083
Table C14.2: ANOVA Table of Affective Commitment
Mode
l
Sum of
Squares df
Mean
Square F Sig.
1 Regressio
n 9.421 5 1.884 8.035 .000(a)
Residual 23.451 100 .235
Total 32.872 105
a Predictors: (Constant), OS, EH, W, PM, AC
b Dependent Variable: A
Table C14.3: Coefficients of Affective Commitment
Model Unstandardised
Coefficients
Standardized
Coefficients
t Sig. Collinearity
Statistics
B Std.
Error
Beta Tolerance VIF
(Constant) 1.442 .276 5.216 .000
AC .059 .110 .083 .536 .593 .301 3.320
EH .079 .074 .134 1.070 .287 .452 2.212
W .204 .107 .233 1.917 .058 .482 2.077
PM .100 .096 .135 1.039 .301 .421 2.376
OS .040 .101 .054 .395 .694 .382 2.620
a Dependent Variable: A
\
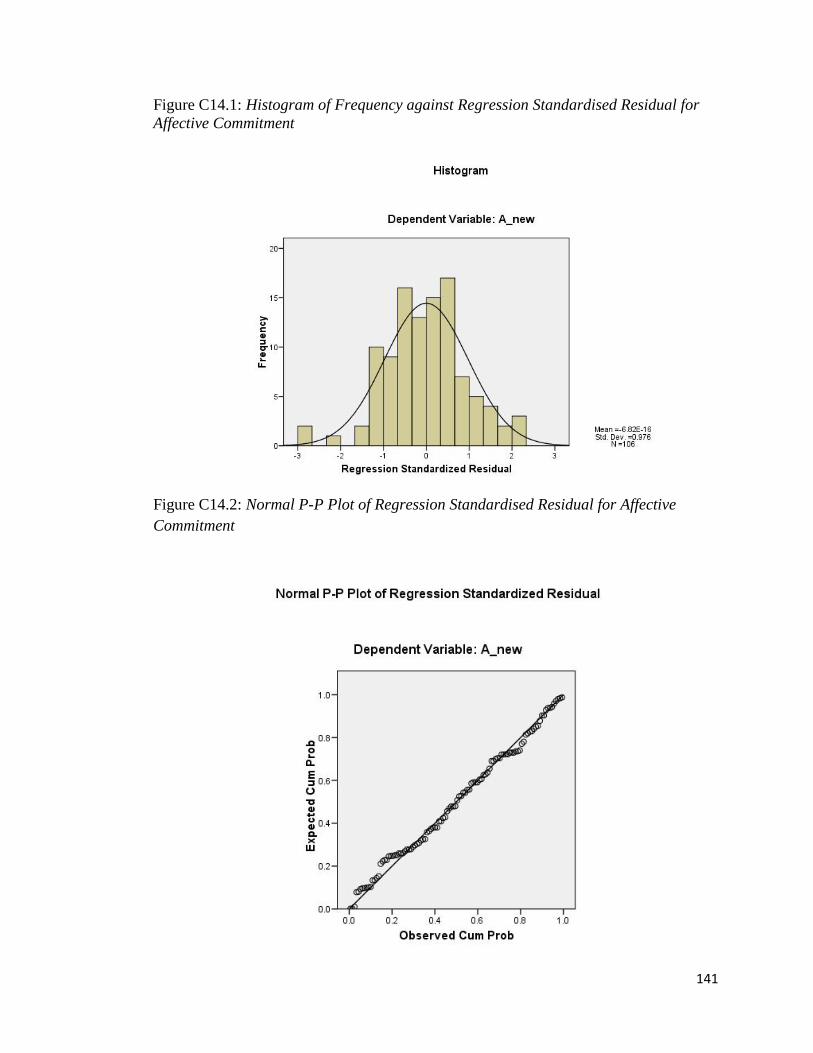
141
Figure C14.1: Histogram of Frequency against Regression Standardised Residual for
Affective Commitment
Figure C14.2: Normal P-P Plot of Regression Standardised Residual for Affective
Commitment
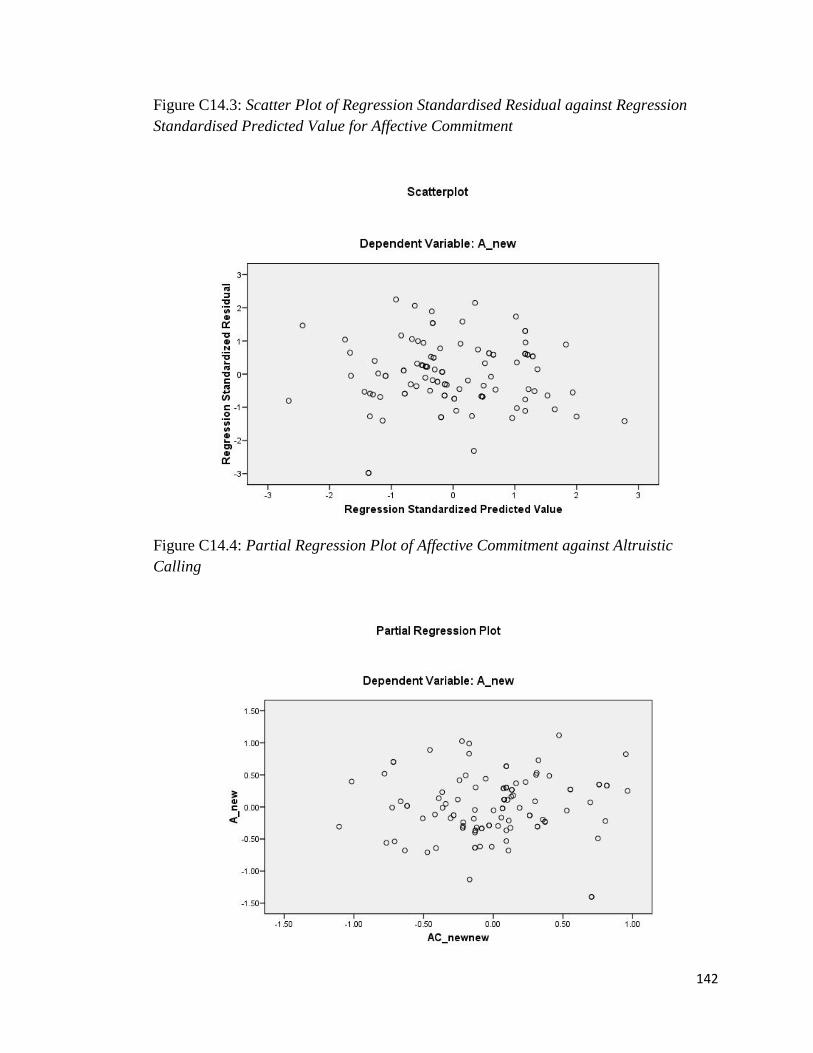
142
Figure C14.3: Scatter Plot of Regression Standardised Residual against Regression
Standardised Predicted Value for Affective Commitment
Figure C14.4: Partial Regression Plot of Affective Commitment against Altruistic
Calling
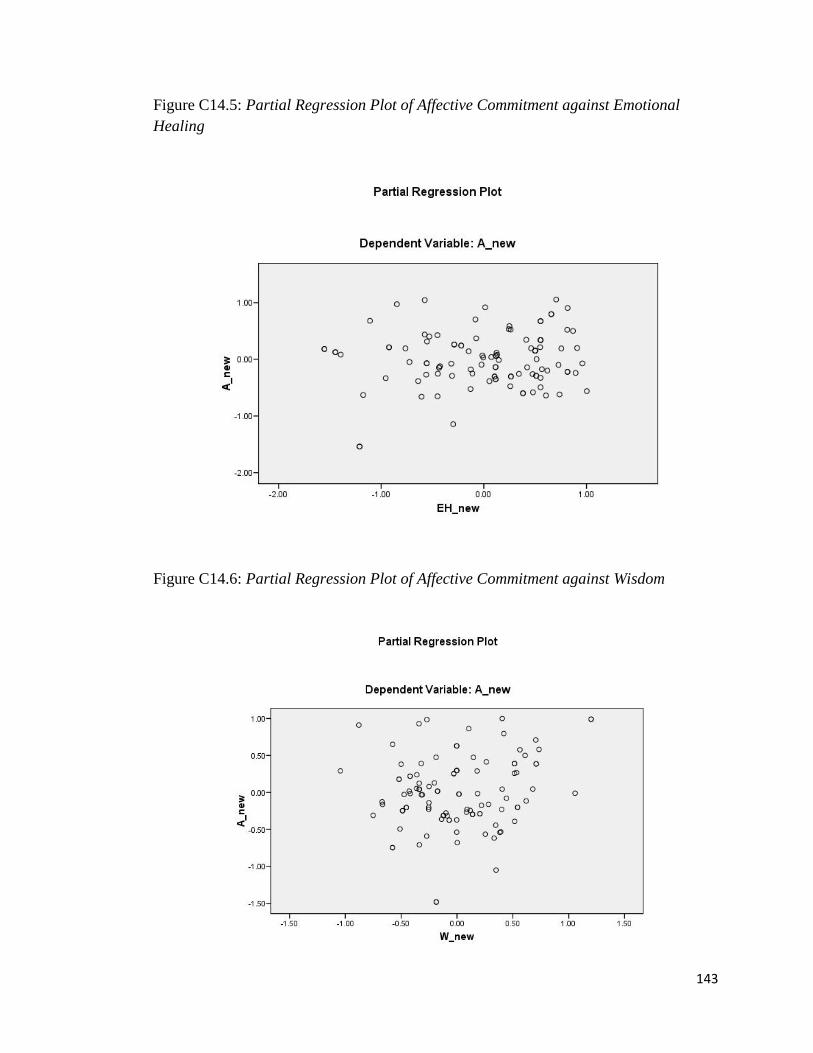
143
Figure C14.5: Partial Regression Plot of Affective Commitment against Emotional
Healing
Figure C14.6: Partial Regression Plot of Affective Commitment against Wisdom

144
Figure C14.7: Partial Regression Plot of Affective Commitment against Persuasive
Mapping
Figure C14.8: Partial Regression Plot of Affective Commitment against Organisational
Stewardship

145
APPENDIX C15: MULTIPLE REGRESSION ANALYSIS ON CONTINUANCE
COMMITMENT
Table C15.1: Multiple Regression Model Summary of Continuance Commitment
Mo
del R
R
Squa
re
Adjuste
d R
Square
Std.
Error of
the
Estimat
e
Change Statistics
Durbi
n-
Wats
on
R
Square
Chang
e
F
Chang
e
df
1
df
2
Sig. F
Chan
ge
1 .210(
a) .044 -.003 .62251 .044 .930 5
10
1 .465 1.865
Table C15.2: ANOVA Table of Continuance Commitment
Mode
l
Sum of
Squares df
Mean
Square F Sig.
1 Regressio
n 1.803 5 .361 .930 .465(a)
Residual 39.139 101 .388
Total 40.942 106
a Predictors: (Constant), OS, EH, W, PM, AC
b Dependent Variable: CC
Table C15.3: Coefficients of Continuance Commitment
Model Unstandardised
Coefficients
Standardized
Coefficients
t Sig. Collinearity
Statistics
B Std.
Error
Beta Tolerance VIF
(Constant) 3.165 .350 9.038 .000
AC -.140 .141 -.178 -.987 .326 .290 3.449
EH .176 .095 .273 1.856 .066 .437 2.289
W -.070 .136 -.074 -.517 .606 .467 2.143
PM .049 .123 .060 .397 .692 .416 2.405
OS .046 .129 .057 .356 .723 .374 2.673
a Dependent Variable: CC
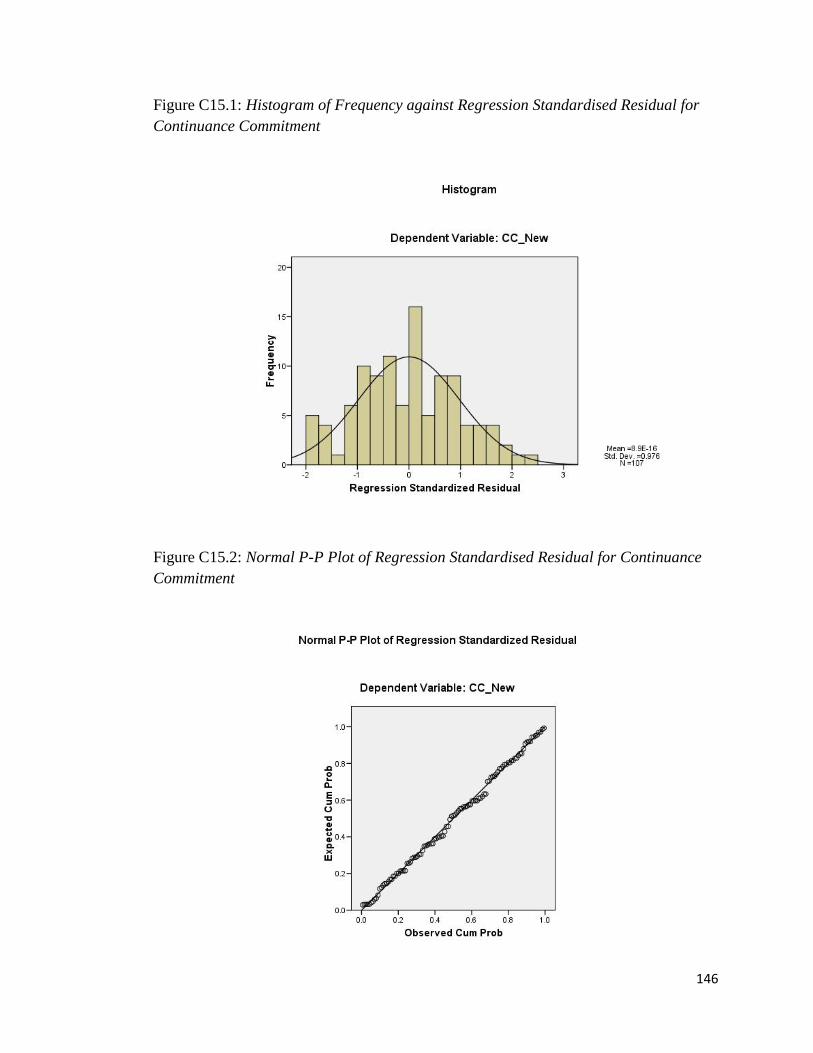
146
Figure C15.1: Histogram of Frequency against Regression Standardised Residual for
Continuance Commitment
Figure C15.2: Normal P-P Plot of Regression Standardised Residual for Continuance
Commitment

147
Figure C15.3: Scatter Plot of Regression Standardised Residual against Regression
Standardised Predicted Value for Continuance Commitment
Figure C15.4: Partial Regression Plot for Continuance Commitment against Altruistic
Calling
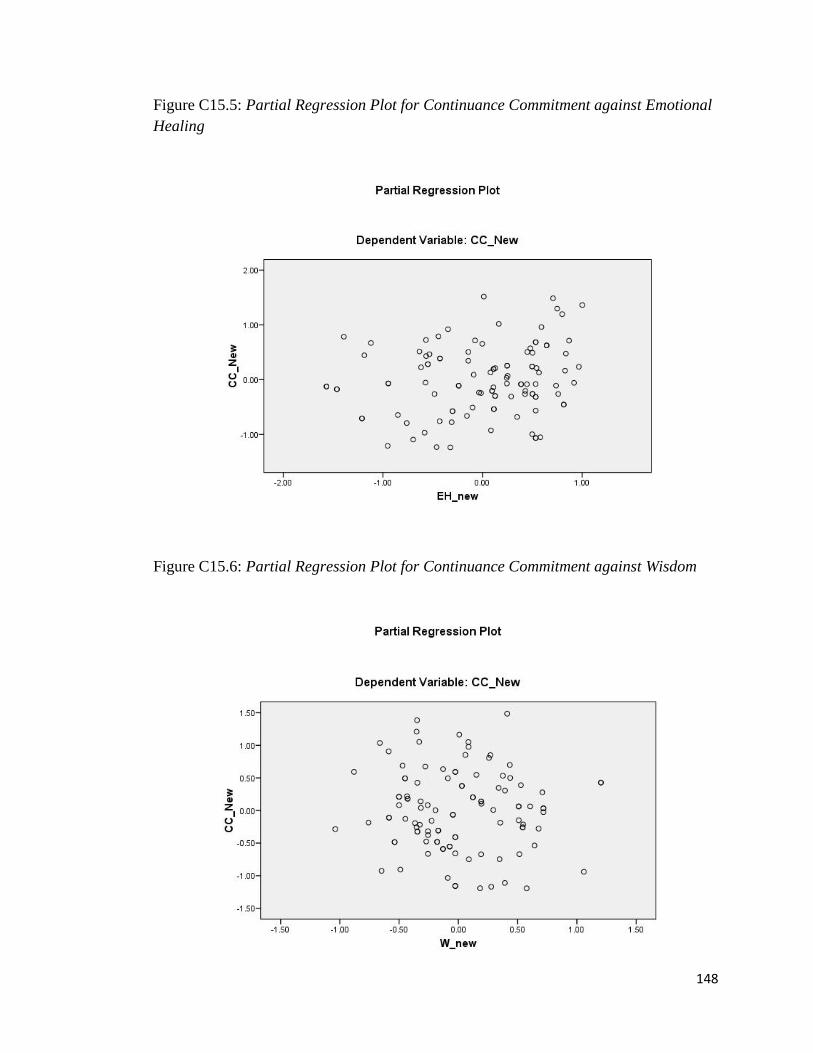
148
Figure C15.5: Partial Regression Plot for Continuance Commitment against Emotional
Healing
Figure C15.6: Partial Regression Plot for Continuance Commitment against Wisdom
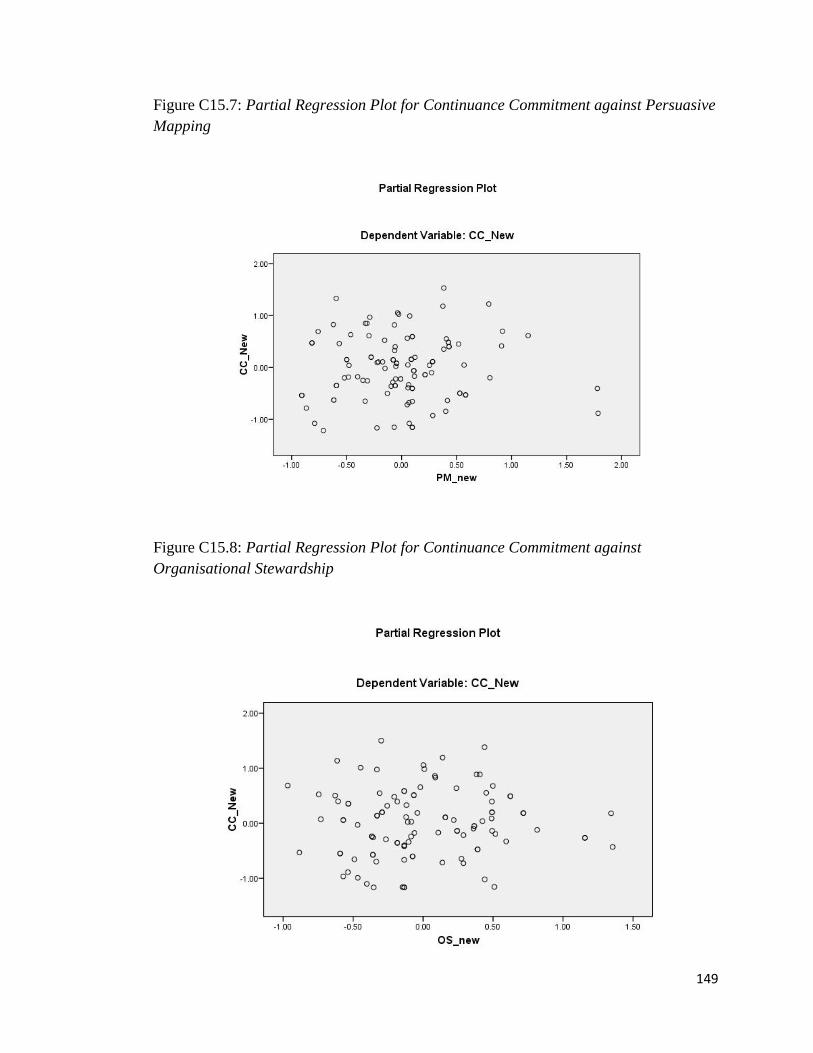
149
Figure C15.7: Partial Regression Plot for Continuance Commitment against Persuasive
Mapping
Figure C15.8: Partial Regression Plot for Continuance Commitment against
Organisational Stewardship

150
APPENDIX C16: MULTIPLE REGRESSION ANALYSIS ON NORMATIVE
COMMITMENT
Table C16.1: Multiple Regression Model Summary of Normative Commitment
Mo
del R
R
Squa
re
Adjuste
d R
Square
Std.
Error of
the
Estimate
Change Statistics
Durbi
n-
Wats
on
R
Square
Chang
e
F
Chang
e
df
1
df
2
Sig. F
Chan
ge
1 .567(
a) .322 .288 .54367 .322 9.582 5
10
1 .000 2.219
Table C16.2: ANOVA Table of Normative Commitment
Mode
l
Sum of
Squares df
Mean
Square F Sig.
1 Regressio
n 14.161 5 2.832 9.582 .000(a)
Residual 29.853 101 .296
Total 44.014 106
a Predictors: (Constant), OS, EH, W, PM, AC
b Dependent Variable: NC
Table C16.3: Coefficients of Normative Commitment
Model Unstandardised
Coefficients
Standardized
Coefficients
t Sig. Collinearity
Statistics
B Std.
Error
Beta Tolerance VIF
(Constant) 2.212 .306 7.234 .000
AC .322 .124 .397 2.607 .011 .290 3.449
EH .235 .083 .352 2.837 .006 .437 2.289
W -.132 .119 -.133 -1.109 .270 .467 2.143
PM -.044 .108 -.052 -.405 .686 .416 2.405
OS -.036 .113 -.043 -.321 .749 .374 2.673
a Dependent Variable: NC
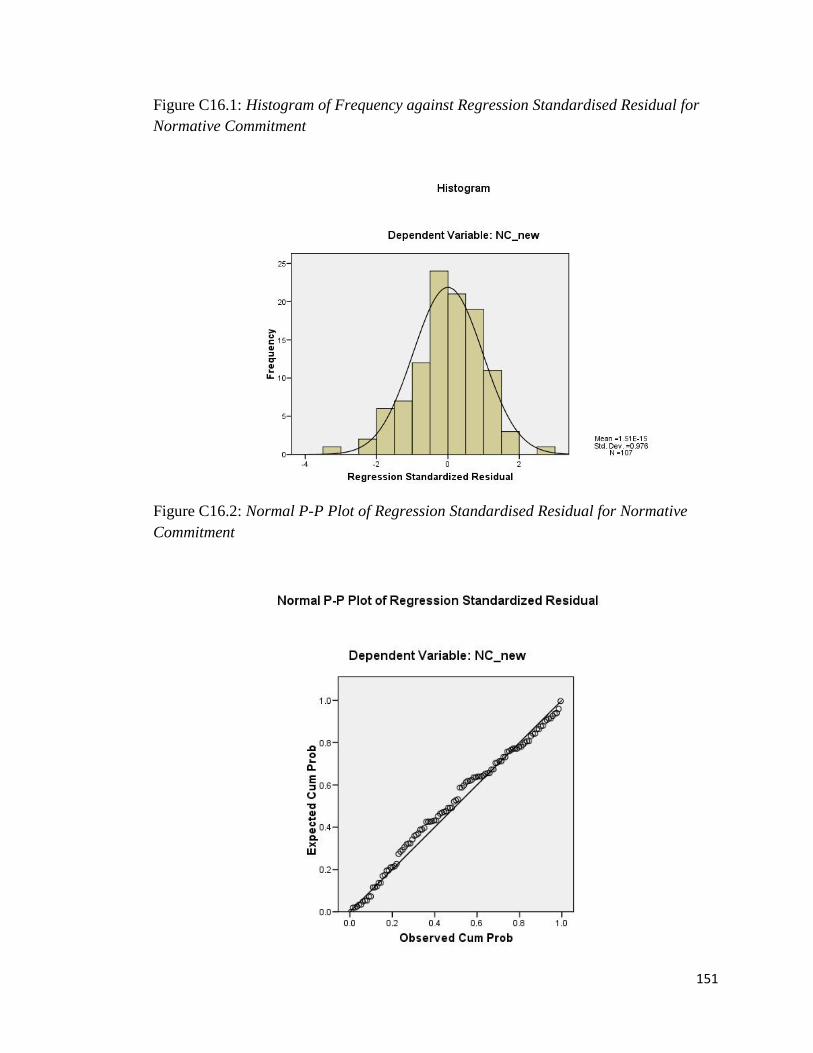
151
Figure C16.1: Histogram of Frequency against Regression Standardised Residual for
Normative Commitment
Figure C16.2: Normal P-P Plot of Regression Standardised Residual for Normative
Commitment
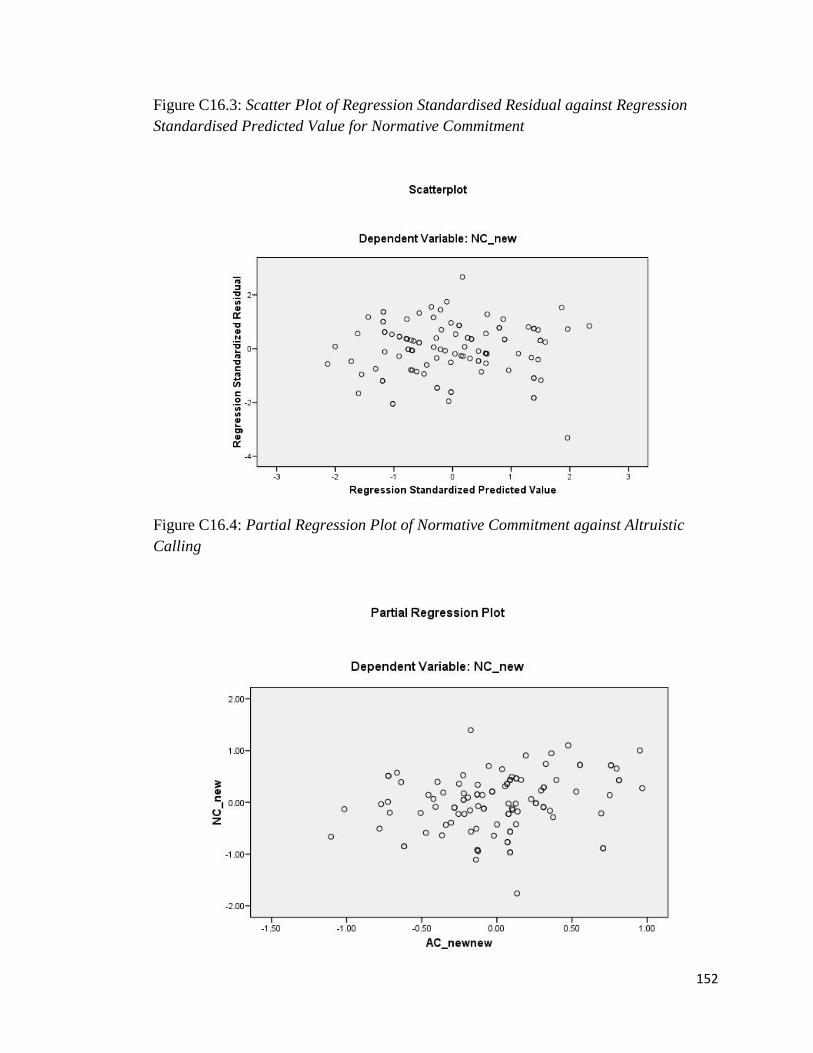
152
Figure C16.3: Scatter Plot of Regression Standardised Residual against Regression
Standardised Predicted Value for Normative Commitment
Figure C16.4: Partial Regression Plot of Normative Commitment against Altruistic
Calling
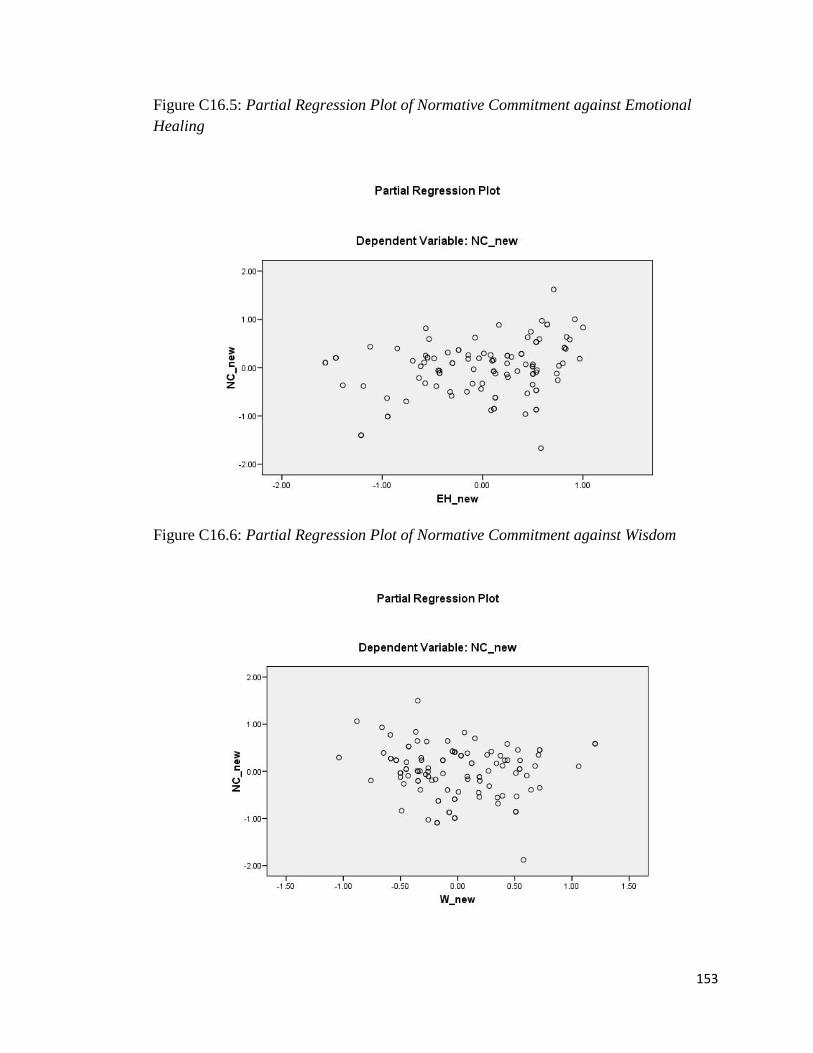
153
Figure C16.5: Partial Regression Plot of Normative Commitment against Emotional
Healing
Figure C16.6: Partial Regression Plot of Normative Commitment against Wisdom
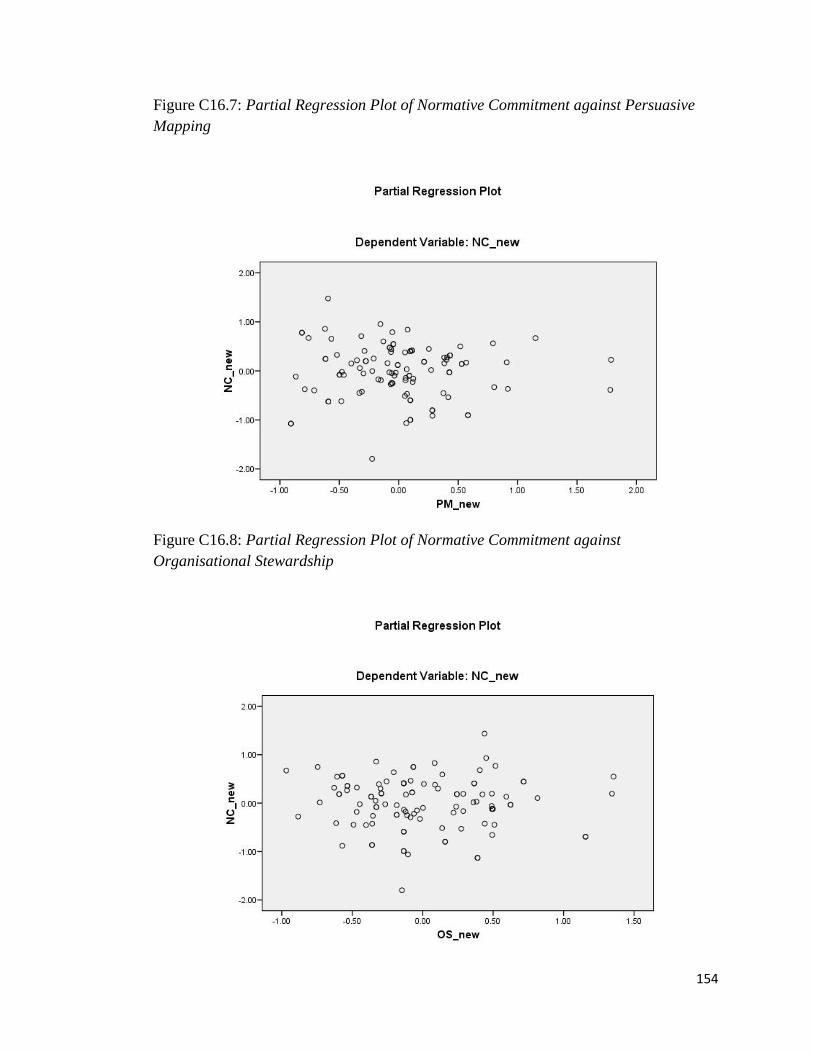
154
Figure C16.7: Partial Regression Plot of Normative Commitment against Persuasive
Mapping
Figure C16.8: Partial Regression Plot of Normative Commitment against
Organisational Stewardship