Embed Size (px)
Citation preview

Service delivery strategies to improvematernal health
Mar 2010
Dr. Marge Koblinsky PhD
Sr. Women’s Health Advisor
JSI

Talk outline
Reducing maternal mortality: what is effective?Lancet 2006: A new strategic focus
Bangladesh – Why is the MMR so low?-Matlab (E Chowdhury et al)-Khulna vs Sylhet
Indonesia — Why does the MMR remain so high?Human resourcesPublic private sectors
Work in progress:
Multi country analysis: pub/priv facility for birthConclusions

All women should be able to deliver in primary level health facilities (health centres) with midwives (SBAs) working in teams:
More efficient (achieving high coverage) than skilled attendants in the home or hospital
Most effective (impact on mortality) because skilled attendants can provide proven single interventions
Lancet 2006: A new strategic focus…..

Area 144 thou sq km
Population 140 million.
GDP Per Capita US$ 388
GDP growth rate 5.26%
Population in
poverty 44.3%
MMR 322/100,000 LB
Use SBA 13%
Csection 3.5%
Source. HDR 2005; BMMS 2001, BDHS 2004
Dhaka320
Khulna351
Rajshahi223
Barisa387l
Sylhet471
KM
806040200
Bangladesh: Why MMR declined?
GIS unit, ICDDR,B
India
India
Myanmar
India
N
Chittagong325

Per
1,0
00 l
ive
bir
ths
Projection of MMR in Bangladesh 1976-2015Projection of MMR in Bangladesh 1976-2015
Current declining rate = 3.2% annually (1999-2015)
Required declining rate = 5.1% annually (to achieve MDG target)
0.0
1.0
2.0
3.0
4.0
5.0
6.0
1976
1979
1982
1985
1988
1991
1994
1997
2000
2003
2006
2009
2012
2015
Projection National Sisterhood National Verbal Autopsy
1.43 /1000 LB
75% of MDG
Courtesy: Mahbub Elahi ChowdhuryBMMS 2001

Govt. Service Area
ICDDR,B Service Area
SylhetRajshahi
KhulnaChittagong
Barisal
Legend
ICDDR,B Hospital
ICDDR,B Subcenter
KM
43210
BANGLADESH
Dhaka
Matlab
@
Bay of Bengal
Divisional boundaries
Main rivers
GIS unit, ICDDR,B
Govt. Service Area
N
Map of Matlab Study Area

Matlab Home-Based Strategy, 1987-1995
In each block (20,000) 2 midwives were posted 24 hours on call
- Conduct home deliveries
- Refer complicated deliveries
- Provide ANC & PNC Other duties included:
- Organize community meetings, train
health workers, TBAs, organize
referrals, FP
Support systems
- Rickshaw/boat, porter
- Matlab clinic,
- Comm serv--immuniz, ORS
• No charges

Matlab Facility-Based Strategy, 1996 to date
In each block, 2 midwives posted in an upgraded Basic EOC facility
Services were better organizedconsistent suppliesseparate labor roomimproved links with Matlab
Hospitaltreat children’s problems
No charges

Matlab Clinic– BEOC Centre
Lady medical officers
Assisted vaginal deliveries
possible
No charges
• Backed up by transportation Speed boat/rickshaws/boatsAmbulance in Matlab
• Referrals linkages District hospital EmOC facility at
Matlab

0
100
200
300
400
500
76-80 81-85 86-90 91-95 96-00 01-05 76-80 81-85 86-90 91-95 96-00 01-05
Mat
ern
al d
eath
s p
er 1
00,0
00 p
reg
nan
cies Mortality fell by 68%
Mortality fell by 54%
ICDDR,B area Government area
Bangladesh national
Trends in maternal mortality over time

0
100
200
300
400
500
600
76-80 81-85 86-90 91-95 96-00 01-05 76-80 81-85 86-90 91-95 96-00 01-05
Ma
tern
al d
ea
ths
pe
r 1
00
,00
0 p
reg
na
nc
ies
0
10
20
30
40
50
60
70
80
90
100
% o
f b
irth
s w
ith
he
alt
h p
rofe
ss
ion
al
Maternal deaths % of births with health professional
Maternal mortality and use of skilled care at birth over time by areas
ICDDR,B area Government area

02000400060008000
100001200014000160001800020000
CE
mO
C
BO
C &
refe
rra
l
No
car
e
CE
mO
C
BO
C &
refe
rra
l
No
car
e
CE
mO
C
BO
C &
refe
rral
No
ca
re
1987-1993 1994-1999 2000-2005
Mor
tali
ty p
er 1
00,0
00 p
reg
nan
cies
0.0
10.0
20.0
30.0
40.0
50.0
% u
sed
sk
ille
d c
are
% of used skilled care
Reduction of mortality
For CEmOC - 26% per year
BEOC & referral - 8% per year
No care - 8% per year
p value for interaction between time and type of care <0.01
Pregnancy-related mortality and use of skilled care at birth, over time in the ICDDR,B service area
n =19
n =16 n =31
n =10
n =17 n =26 n =9 n =29
Total deaths = 173
n =16

At individual level
At low level of skilled attendance (about 10%):
Selection of high risk women in EmOC
Midwives/hospitals cannot save these women (women may have more severe complications; may have poor quality of care)
At the highest level of use of skilled care (about 40%):
Maternal mortality among those using care remains high (150 at BEOC; 720 at EmOC)
Maternal mortality among those not using skilled attendance is much lower (60/100,000)
Similar patterns are observed for perinatal mortality but selection effects are less strong
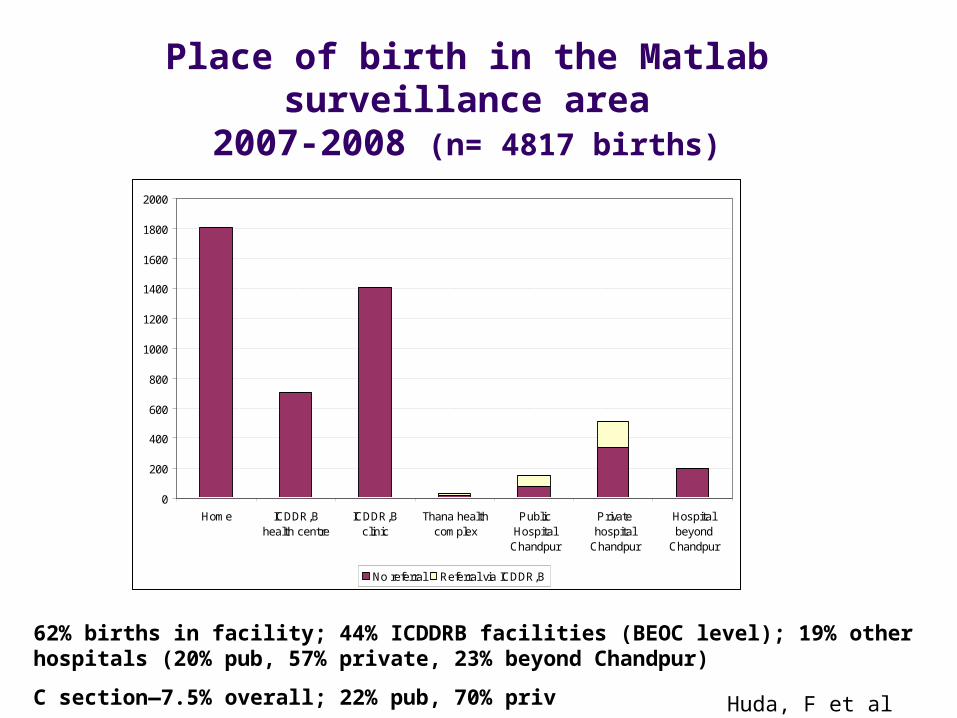
Place of birth in the Matlab surveillance area2007-2008 (n= 4817 births)
0
200
400
600
800
1000
1200
1400
1600
1800
2000
Home ICDDR,Bhealth centre
ICDDR,Bclinic
Thana healthcomplex
PublicHospital
Chandpur
Privatehospital
Chandpur
Hospitalbeyond
Chandpur
No referral Referral via ICDDR,B
62% births in facility; 44% ICDDRB facilities (BEOC level); 19% other hospitals (20% pub, 57% private, 23% beyond Chandpur)
C section—7.5% overall; 22% pub, 70% priv Huda, F et al 2009

Dhaka320
Khulna351
17% doc8% csec
Rajshahi223
Barisa387l
Sylhet471
8% doc4% csec
KM
806040200
GIS unit, ICDDR,B
India
Myanmar
India
N
Chittagong325
Bangladesh
MMR by division 2003
India

Divisions
CEmOC facilities/ 500,000
population
Dhaka 9.5Chittagong 5.6Rajshahi 6.3Khulna 12.7Barisal 5.1Sylhet 4.7Total Public NGO Priv
7.8 1.1 0.4 6.3
Geographic distribution of CEmOC
facilities in Bangladesh
1
2
3
5
6

CEmOC Facilities with CSection and Blood by type and division (%)
Cs and BT available in 60, 80 and 90% of public, NGO and private facilities respectively In 1/3 of public facilities, Cs not available mostly due to unavailability of ob/anesthetists
Among divisions Cs and BT most available in Khulna and least in Sylhet division

Professional assistance during birth and MMR: Indonesia
Why is the MMR so high?

Bangladesh vs Indonesia
Bangladesh IndonesiaPopulation (mil) 150 225Income low medRural % 74 48Density (pop/Km2) 920 119 (17000 is)TFR 2.7 2.8Midwives 5000 80,000
Obs 900 2100
Anes 860 750

Maternal Mortality Ratio Indonesia 1990-2015
390
334307
228
102
-
100
200
300
400
500
1990-1994 1993-1997 1998-2002 2003-2007 2015
Year
Mat
erna
l Dea
th p
er 1
00.0
00 L
ive
Birt
h
Estimated by Unicef, WHO, UNFPA, The WorldbankYear 2005 : 420
Target MDG 5 by 2015
IDHS 2007: Preliminary result
Village midwife program Decentralization
Financial crisis

IDHS 1987 & 2002: Increase in SBA from 35% to 66%, especially among the two poorest quartile (2007-73%)
Gap between rich and poor narrowing, but access of the poor still very low
0
10
20
30
40
50
60
70
80
90
100
Poor Lowmiddle
Middle Uppermiddle
Rich%
de
liv
eri
es
wit
h a
sk
ille
d a
tte
nd
an
t
SBA among 60% of the poorest is very low
Assistance during delivery

Trend of Cesarean Section 1986 – 2002 by wealth quartile
Access to Emergency care: C-Section
0.00
1.00
2.00
3.00
4.00
5.00
6.00
7.00
8.00
Lower 80% Rich
% C
ae
sa
rea
n s
ec
tio
ns
Among the poorest 80% CS is less than 1% compared to 3.6% in the richest quartile (2007 overall-6.8%)
Catastrophic effect in the ‘almost poor’ group

MMR by presence/absence of health professional and wealth quartile, and proportion of births with HP by quartile, Serang, Pandeglang, Indonesia, 2004-6
0
500
1000
1500
2000
2500
Den
gan
NA
KE
S
Tan
pa
NA
KE
SPoorestt Lower middle Upper Middle Least Poor
Mat
erna
l de
aths
per
100
,,000
live
bi
rths
0
10
20
30
40
50
60
70
80
90
100
% b
irths
with
HP
am
ong
wom
en w
ith r
ecen
t birt
h
Kematian Ibu per 100,000 live births % kelahiran dg Nakes
Den
gan
NA
KE
S
Tan
pa
NA
KE
S
Tan
pa
NA
KE
S
Tan
pa
NA
KE
S
Den
gan
NA
KE
S
Den
gan
NA
KE
SMMR 1.9 times higher with SBA; only amongst richest is MMR same
with/without SBA but still over 200 Ronsmans et al 2009

In-patient costs at different types of facilities ($US)
Public
Hospital
Military Hospital
IND-DRG (class C-A)
Normal Delivery
82-89 163 70-154
C section
340-435 494 128-282

Indonesia: Why is MMR high? Most women use midwife for birth, little access to
emergency care due to lack of availability of skilled providers, costs and insurance issues
Costs of birthing Variability and lack of transparency of fees for hospitals Many private facilities/providers will not accept insurance for poor Public hospitals may not treat until they receive card Midwife is not reimbursed for woman’s care if she refers to hospital
Quality of care Regulations govern who can treat patient; no control over private sector, No coordination between midwives and hospitals; between District
Health Office (FH) and Governor’s office (where hospitals/doctors report) Low availability of obs in facilities (not clear re anes)
Private sector and its role in delivery care among countries, Asia and Middle East
Amanda Pomeroy
Marge Koblinsky
Soumya Alva

Growth in the private sector, Asia
Total Facility Births, by Facility Type, Asia
0
10
20
30
40
50
60
70
80
90
100
India *
Indonesia
Philippines
Bangla
desh
Cambodia
Nepal
% o
f all
birt
hs (b
ar h
eigh
t ind
icat
es to
tal f
acili
ty b
irth
s) Private Govt NGO
*India facility rates are for three years preceding the survey, because the 1998 data do not have information on births five years preceding survey. For all other countries, these rates are for all births five years preceding survey.
All DHS data; first time point was chosen to be from the fourth round of DHS survey collection (1997-2003) while the second time point was chosen to be in the fifth phase (2003-Present).
Second Year
First Year

Growth in the private sector, Middle East
All DHS data except Yemen 2nd year (PAPFAM 2003); first time point was chosen to be from the fourth round of DHS survey collection (1997-2003) while the second time point was chosen to be in the fifth phase (2003-Present). The first year of Yemen (1997) data is not split by facility type. Jordan: 2002-2007, Egypt: 2000-2008.
Total Facility Births, by Facility Type, Middle East
0
10
20
30
40
50
60
70
80
90
100
Yemen -First Yr*
Yemen -Second Yr
Jordan -First Yr
Jordan -Second Yr
Egypt -First Yr
Egypt -Second Yr
% o
f all
birt
hs (b
ar h
eigh
t ind
icat
es to
tal f
acili
ty b
irths
) Private Public NGO

By Facility Type, Breakdown of Births by Type of Delivery, by Year, Bangladesh
0%
10%
20%
30%
40%
50%
60%
70%
80%
90%
100%
Public- 1
st Yea
r
Public- 2
nd Year
Privat
e- 1
st Y
ear
Privat
e- 2
nd Yea
r
Natural Delivery
C-section
Percent Change in Private C-sections:
51%
Percent Change in Public C-sections: 54%
Shift from normal to csection in both pub and private

By Facility Type, Breakdown of Births by Type of Delivery, by Year, Indonesia
0%
10%
20%
30%
40%
50%
60%
70%
80%
90%
100%
Natural Delivery
C-section
Percent Change in Public C-sections: 41%
Percent Change in Private C-sections:
43%
Increase in csections in public and private sectors but as 78% of fac births are private, hence most of csec are in priv sector

Conclusions Bangladesh
Access to EmOC is a must! SBAs bypassed in densely pop areas where EmOC available;
may not be skilled to manage cx Specialists (or those trained in surgery/anes) not available in rural
public facilities Increase in EmOC private facilities and use Expenditure for birthing care high
Asia Private sector use is growing Dualism allowed (Bangladesh, Indonesia, Nepal, some
states/India); FTEs in Govt few; Doctors have large debts from med school
Csection use high in private sector, depends on access (distance, costs, insurance coverage)