Embed Size (px)
Citation preview
12-08-2015
1
Week 6
Vinay Kumar Kalakbandi
Assistant Professor
Operations & Systems Area
12/08/2015 Vinay Kalakbandi 1
Service Operations (SO) Post Graduate Program 2014-16
Agenda
• Recap
• Mid Term
• Agenda for the rest of the course
• Demo of simulation tools
• Service Quality
• Yield Management
09/11/2014 Vinay Kalakbandi 2
12-08-2015
2
Up Next
• Today: Service Quality
• Next Session: American Airlines case (session 11)
• Next Week (sessions 12,13) – Starbucks Case – Even teams
– Zipcar – Odd Teams
– McDonalds Case – if time permits
• Guest Lectures (14-17 sessions) 22nd and 23rd August
• The week after (sessions 18,19) – Aravind Eyecare – Odd teams
– ITC e-choupal – Even teams
– Course Wrapup
• Project Presentations (session 20) – As per your convinience
09/11/2014 Vinay Kalakbandi 3
SERVICE QUALITY
09/11/2014 Vinay Kalakbandi 4
12-08-2015
3
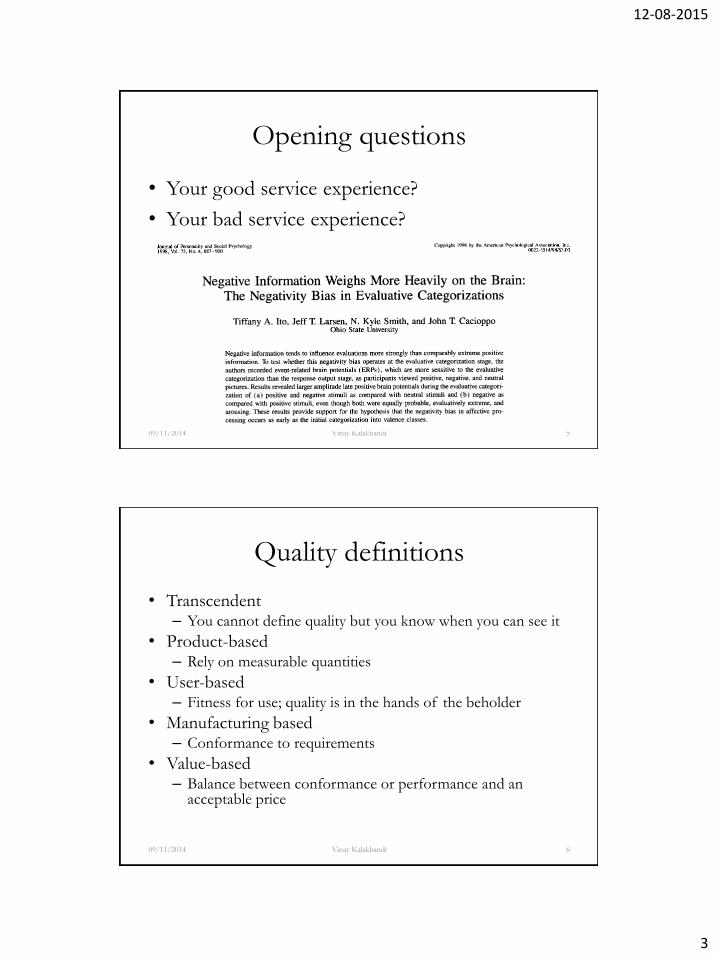
Opening questions
• Your good service experience?
• Your bad service experience?
• Negativity bias!
09/11/2014 Vinay Kalakbandi 5
Quality definitions
• Transcendent – You cannot define quality but you know when you can see it
• Product-based – Rely on measurable quantities
• User-based – Fitness for use; quality is in the hands of the beholder
• Manufacturing based – Conformance to requirements
• Value-based – Balance between conformance or performance and an
acceptable price
09/11/2014 Vinay Kalakbandi 6
12-08-2015
4
Customer Satisfaction
• All customers want to be satisfied.
• Customer loyalty is only due to the lack of a
better alternative
• Giving customers some extra value will delight
them by exceeding their expectations and insure
their return
Service quality
• Product quality versus service quality
• Fuzzy specifications
• Managing expectations
• Expectations are complicated!
– Not what on an average should happen
– What might, could, will, should or better not
happen!!!
09/11/2014 Vinay Kalakbandi 8
12-08-2015
5
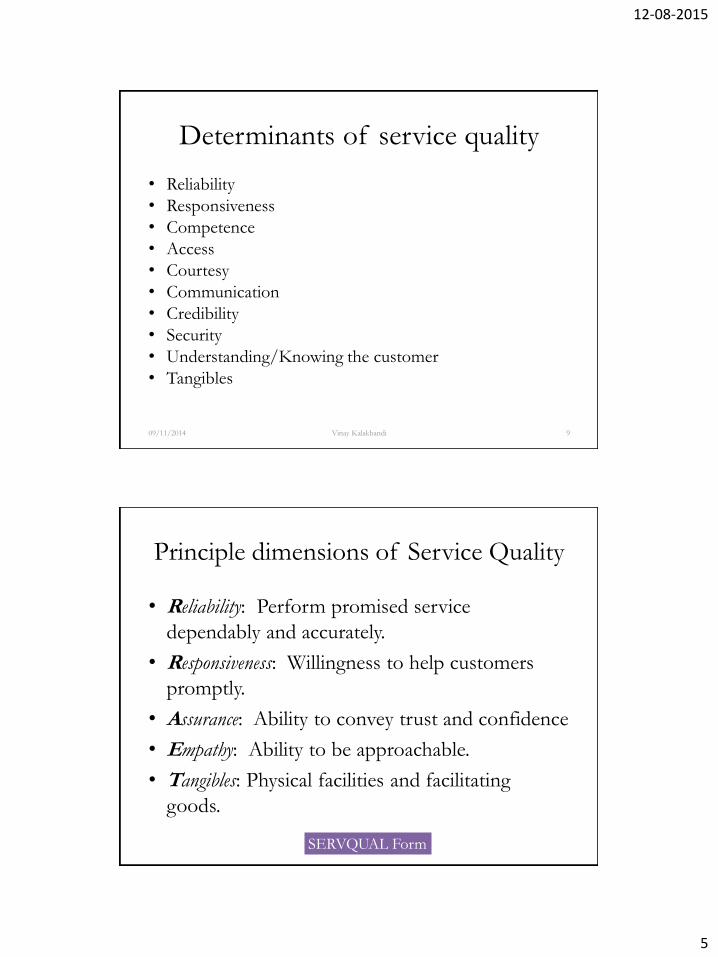
Determinants of service quality
• Reliability
• Responsiveness
• Competence
• Access
• Courtesy
• Communication
• Credibility
• Security
• Understanding/Knowing the customer
• Tangibles
09/11/2014 Vinay Kalakbandi 9
Principle dimensions of Service Quality
• Reliability: Perform promised service
dependably and accurately.
• Responsiveness: Willingness to help customers
promptly.
• Assurance: Ability to convey trust and confidence
• Empathy: Ability to be approachable.
• Tangibles: Physical facilities and facilitating
goods.
SERVQUAL Form SERVQUAL Form
12-08-2015
6
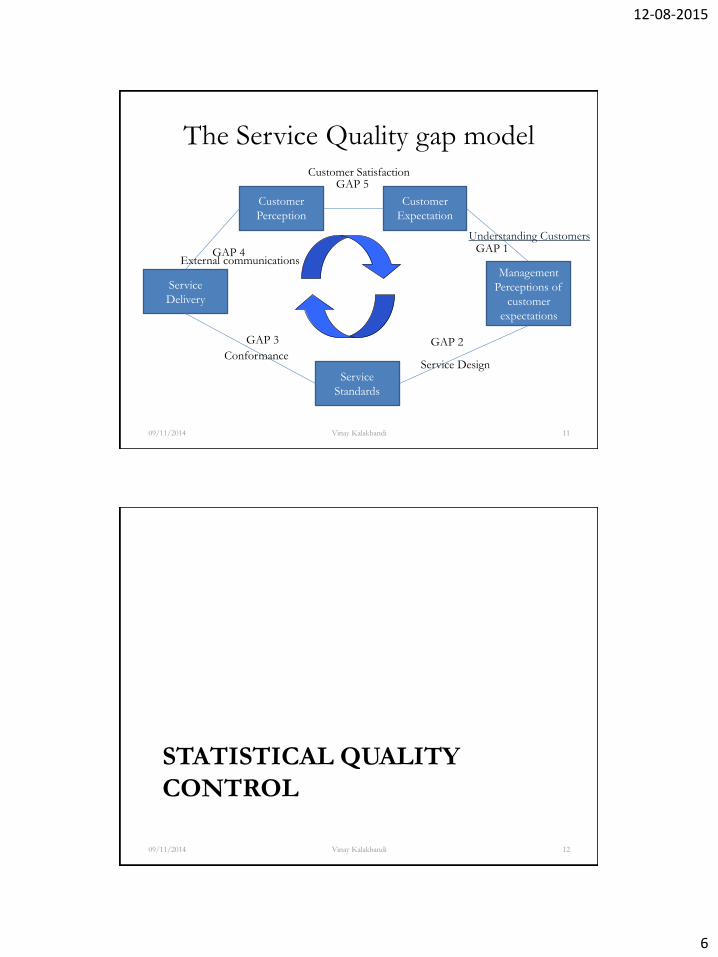
The Service Quality gap model
09/11/2014 Vinay Kalakbandi 11
Customer
Perception
Customer
Expectation
Service
Delivery
Service
Standards
Management
Perceptions of
customer
expectations
GAP 5
GAP 1
GAP 2 GAP 3
GAP 4
Customer Satisfaction
Understanding Customers
Service Design Conformance
External communications
STATISTICAL QUALITY
CONTROL
09/11/2014 Vinay Kalakbandi 12
12-08-2015
7
Pre-requisites
• Mean and standard deviation
• Random variables and Probability distribution
– Normal distribution
• Type 1 and Type 2 errors
• Central limit theorem
09/11/2014 Vinay Kalakbandi 13
Opening example
• We promise 40 second response time!
• Average response time at our call center is 40
seconds
09/11/2014 Vinay Kalakbandi 14
12-08-2015
8
Problem with Variability
• Difficult in determining what causes variability
in the process
• Quality Inspection in services not feasible
• Need to tease out the impact of assignable
causes and control the same
• This reduction in variability would make the
process capable
09/11/2014 Vinay Kalakbandi 15
The process view of services
• Service process are characterized by
– Output: Service outcome that determines service
quality
– Input: Customer inputs, Resources, employees
– Variability: Dispersion in output
• Natural causes: Non-controllable; inherent variability in
the system, noise, usually minor
• Assignable causes: Controllable, bring about a
fundamental change on the nature of the process, causes
considerable impact on quality
09/11/2014 Vinay Kalakbandi 16
12-08-2015
9
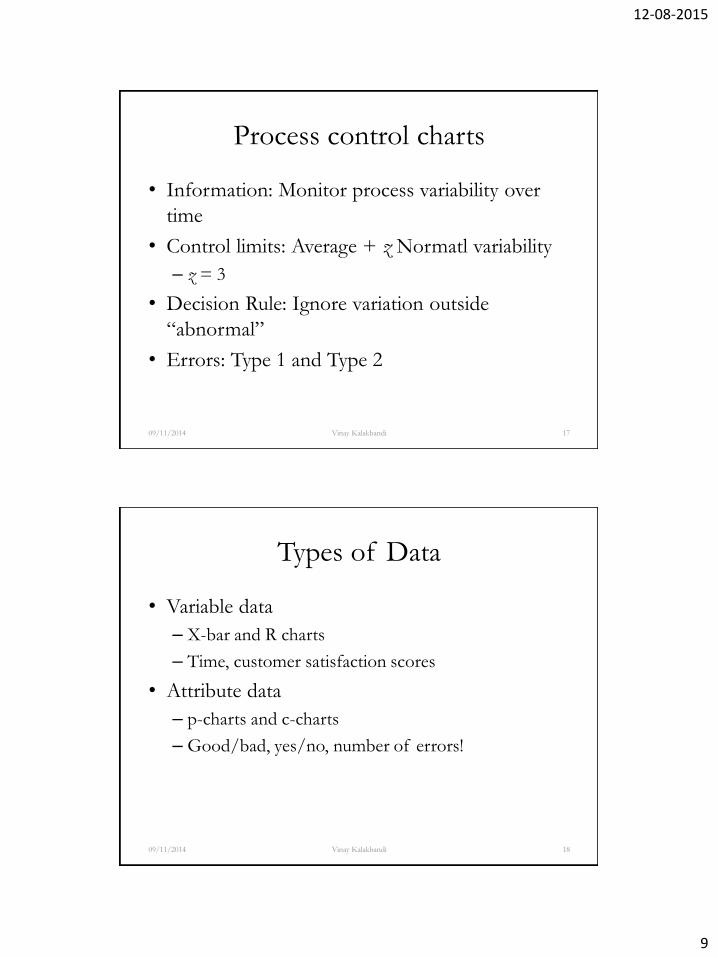
Process control charts
• Information: Monitor process variability over
time
• Control limits: Average + z Normatl variability
– z = 3
• Decision Rule: Ignore variation outside
“abnormal”
• Errors: Type 1 and Type 2
09/11/2014 Vinay Kalakbandi 17
Types of Data
• Variable data
– X-bar and R charts
– Time, customer satisfaction scores
• Attribute data
– p-charts and c-charts
– Good/bad, yes/no, number of errors!
09/11/2014 Vinay Kalakbandi 18
12-08-2015
10
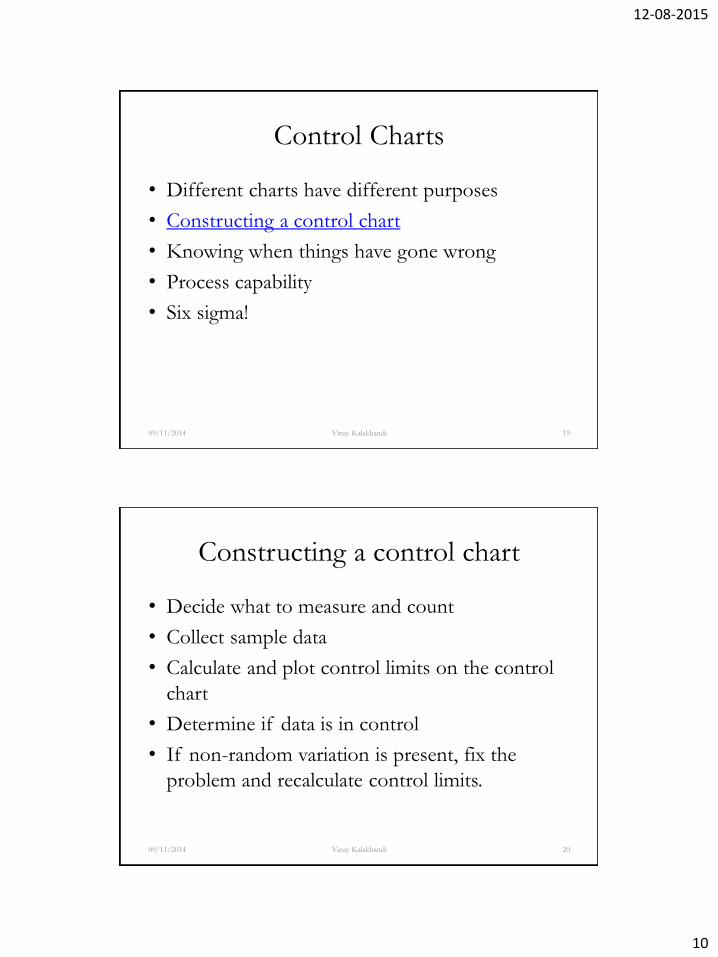
Control Charts
• Different charts have different purposes
• Constructing a control chart
• Knowing when things have gone wrong
• Process capability
• Six sigma!
09/11/2014 Vinay Kalakbandi 19
Constructing a control chart
• Decide what to measure and count
• Collect sample data
• Calculate and plot control limits on the control
chart
• Determine if data is in control
• If non-random variation is present, fix the
problem and recalculate control limits.
09/11/2014 Vinay Kalakbandi 20
12-08-2015
11
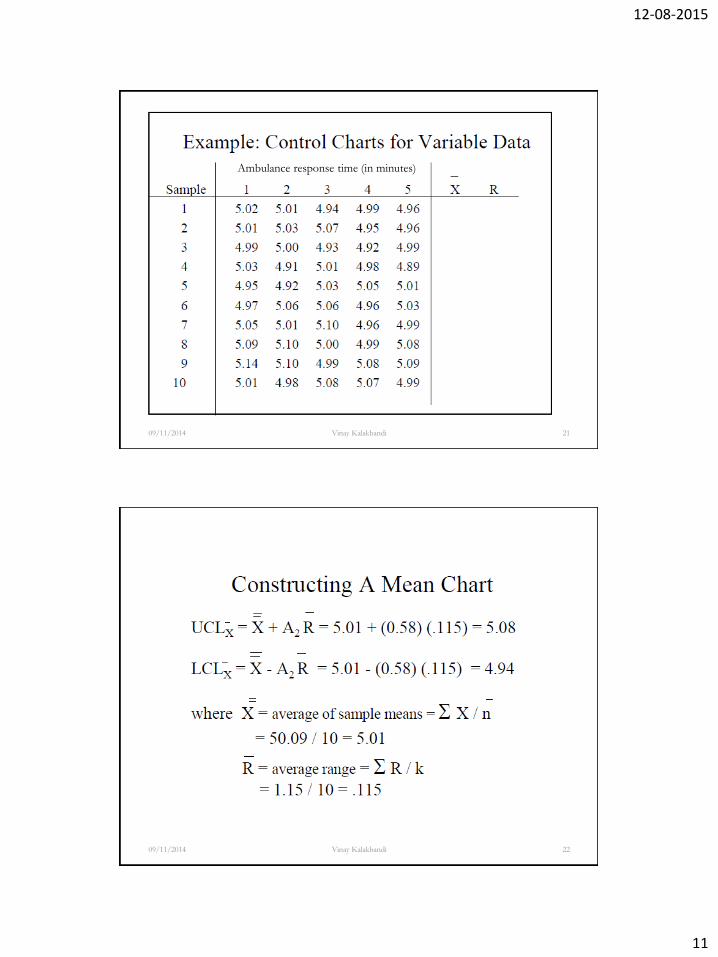
09/11/2014 Vinay Kalakbandi 21
Ambulance response time (in minutes)
09/11/2014 Vinay Kalakbandi 22
12-08-2015
12
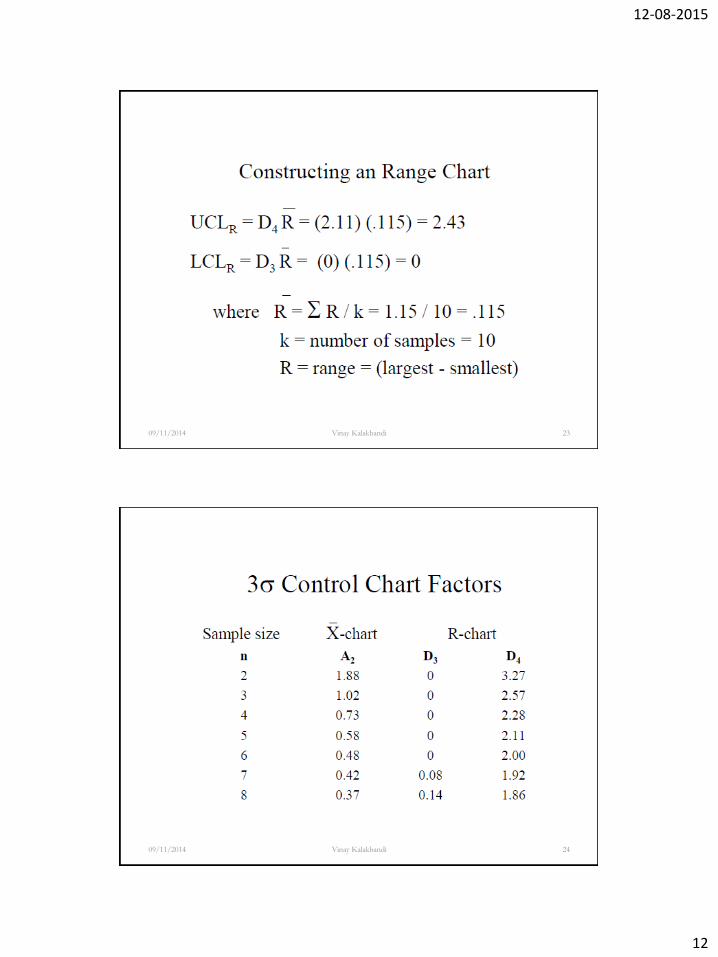
09/11/2014 Vinay Kalakbandi 23
09/11/2014 Vinay Kalakbandi 24
12-08-2015
13
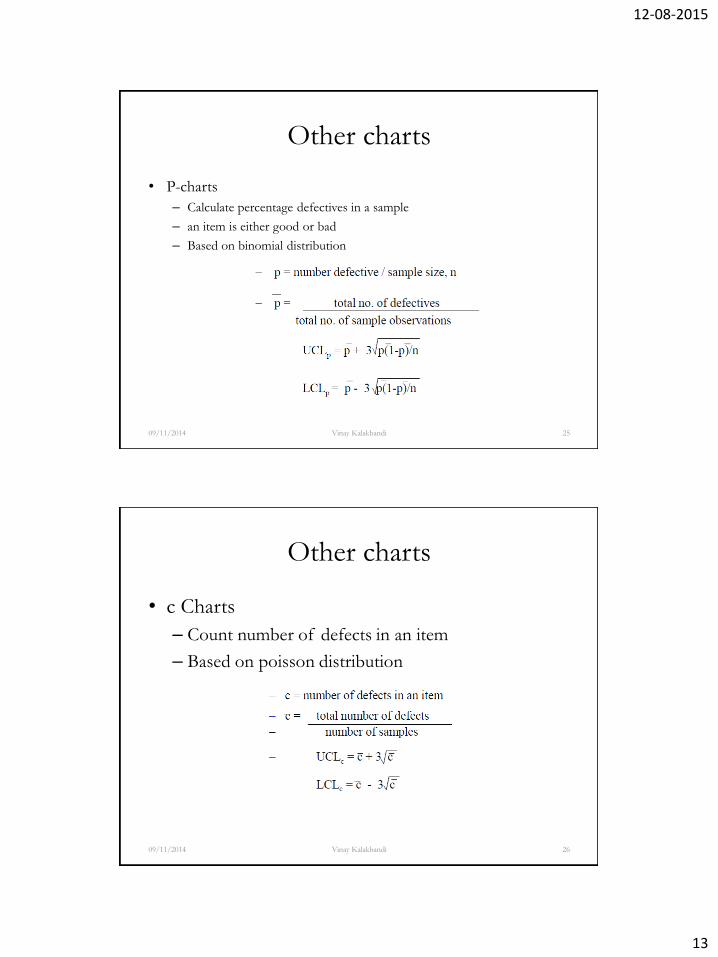
Other charts
• P-charts
– Calculate percentage defectives in a sample
– an item is either good or bad
– Based on binomial distribution
09/11/2014 Vinay Kalakbandi 25
Other charts
• c Charts
– Count number of defects in an item
– Based on poisson distribution
09/11/2014 Vinay Kalakbandi 26
12-08-2015
14
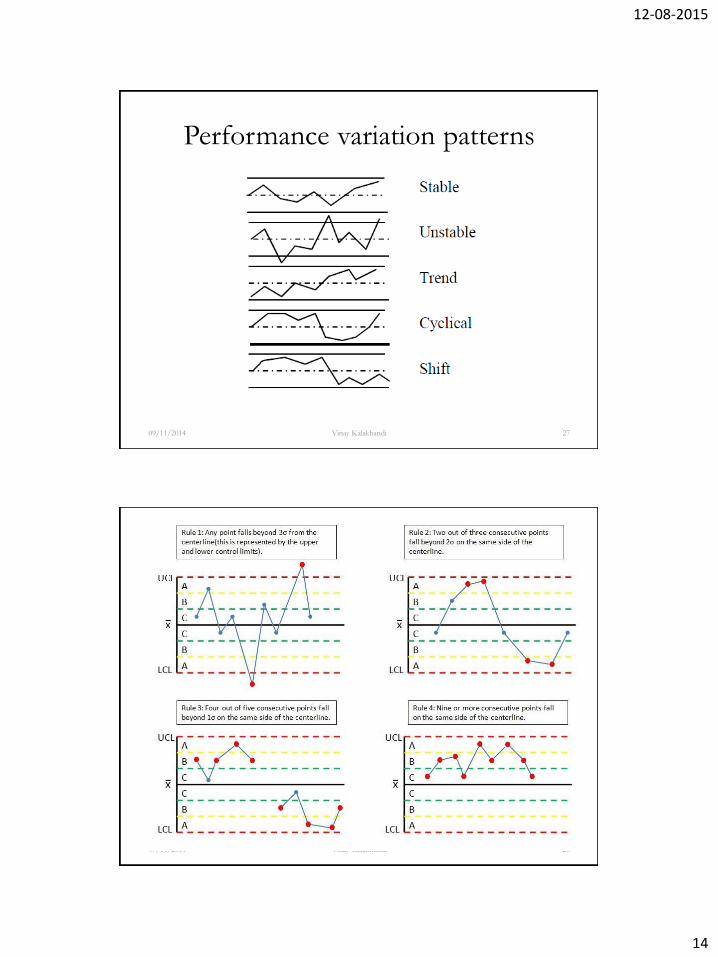
Performance variation patterns
09/11/2014 Vinay Kalakbandi 27
09/11/2014 Vinay Kalakbandi 28
12-08-2015
15
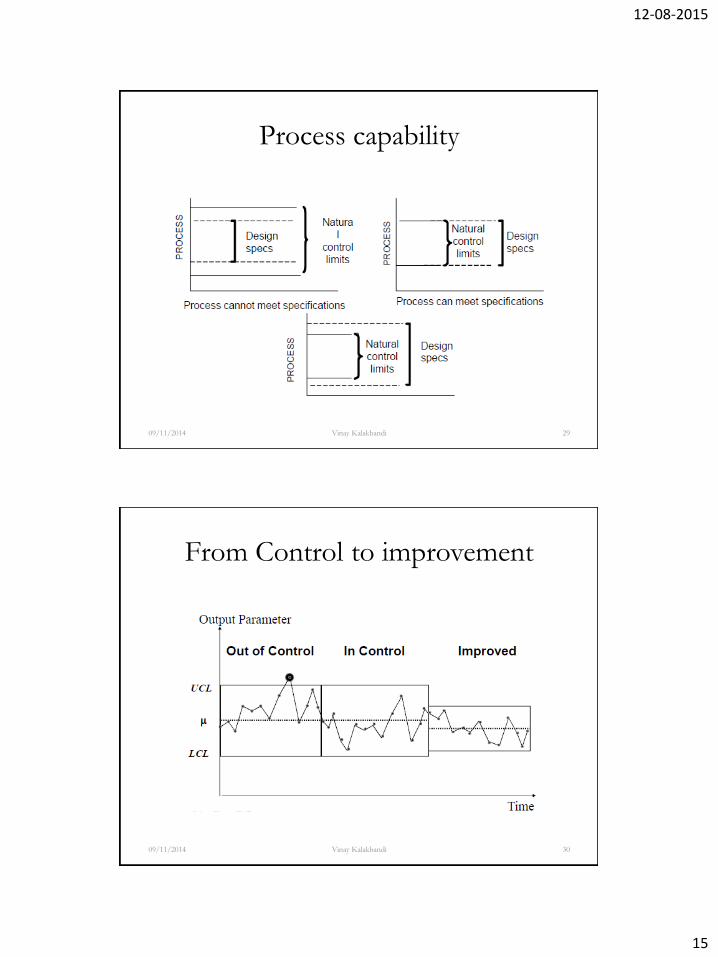
Process capability
09/11/2014 Vinay Kalakbandi 29
From Control to improvement
09/11/2014 Vinay Kalakbandi 30
12-08-2015
16
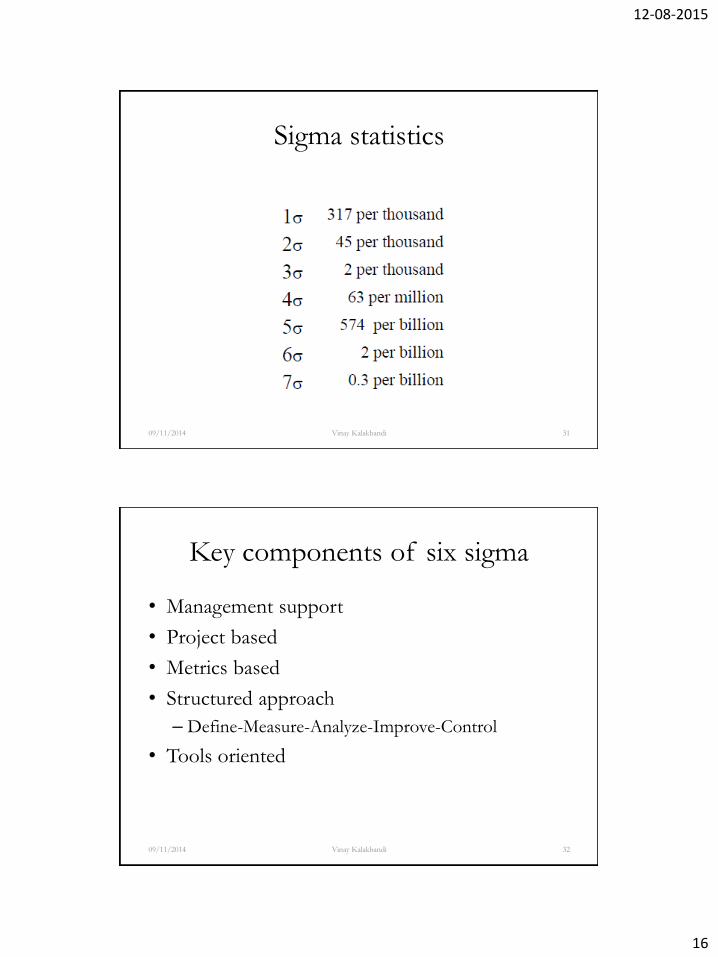
Sigma statistics
09/11/2014 Vinay Kalakbandi 31
Key components of six sigma
• Management support
• Project based
• Metrics based
• Structured approach
– Define-Measure-Analyze-Improve-Control
• Tools oriented
09/11/2014 Vinay Kalakbandi 32
12-08-2015
17
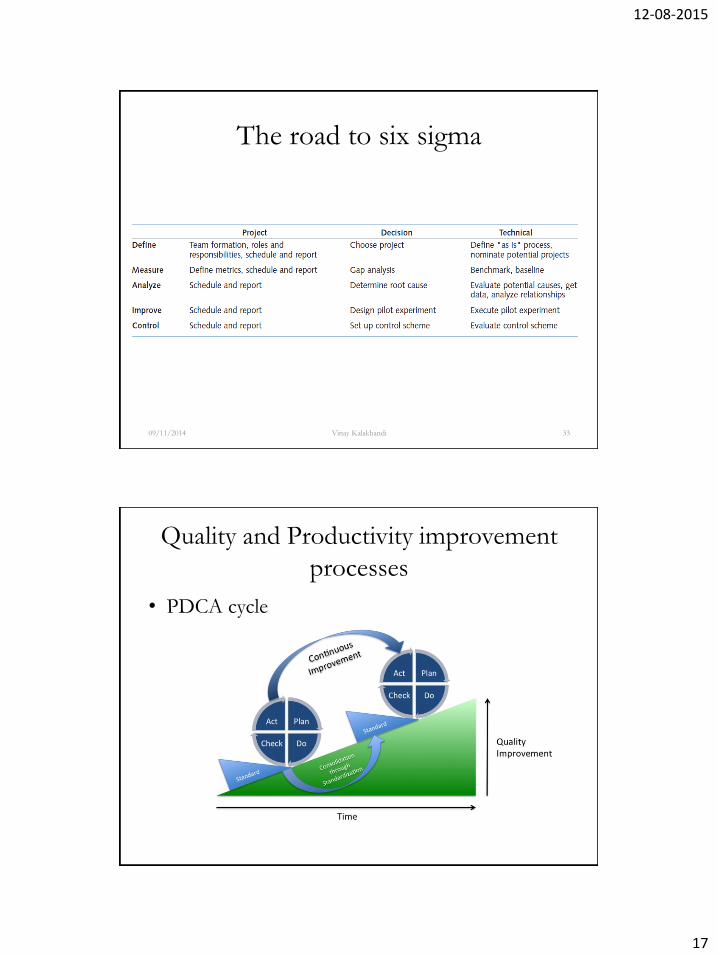
The road to six sigma
09/11/2014 Vinay Kalakbandi 33
Quality and Productivity improvement
processes
• PDCA cycle
12-08-2015
18
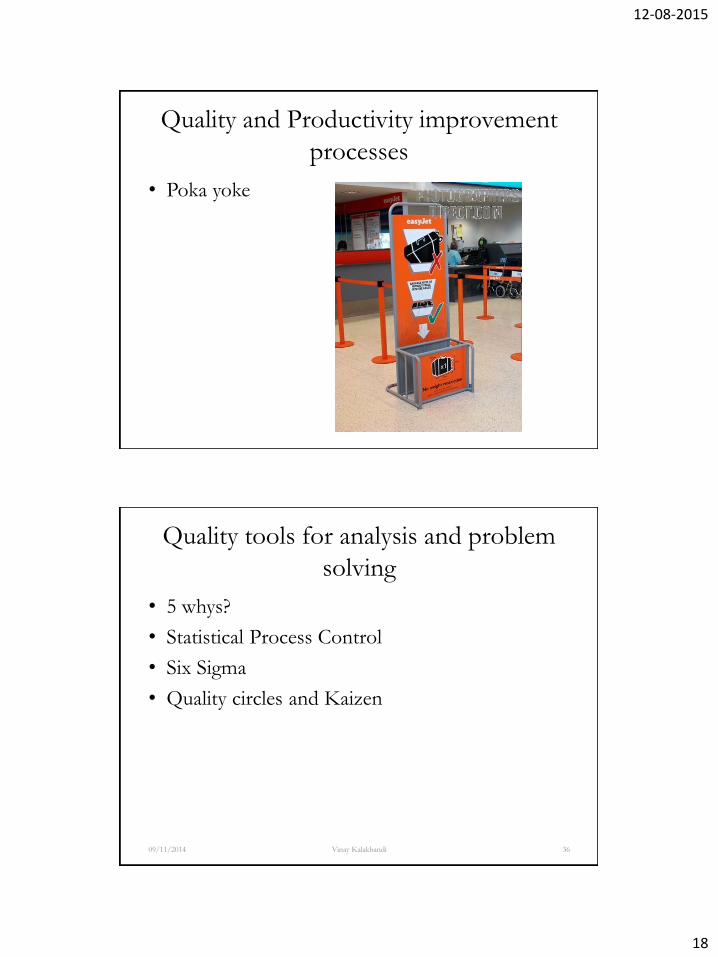
Quality and Productivity improvement
processes
• Poka yoke
Quality tools for analysis and problem
solving
• 5 whys?
• Statistical Process Control
• Six Sigma
• Quality circles and Kaizen
09/11/2014 Vinay Kalakbandi 36

12-08-2015
19
MANAGING SUPPLY AND
DEMAND
09/11/2014 Vinay Kalakbandi 37
________ IS THE ONLY
CONSTANT.
09/11/2014 Vinay Kalakbandi 38
12-08-2015
20
Generic strategies
• Level strategy
– Power stations
– Managing demand
• Chase
– Managing supply
– Call centres
09/11/2014 Vinay Kalakbandi 39
MANAGING DEMAND
09/11/2014 Vinay Kalakbandi 40
12-08-2015
21
Customer induced variability
• Arrival variability – Provide generous staffing or require reservations
• Capability variability – Adapt to customer skill levels or target customers based on
capability
• Request variability – Cross-train employees or limit service breadth
• Effort variability – Do work for customers or reward increased effort
• Subjective preference variability – Diagnose expectations or persuade customers to adjust
09/11/2014 Vinay Kalakbandi 41
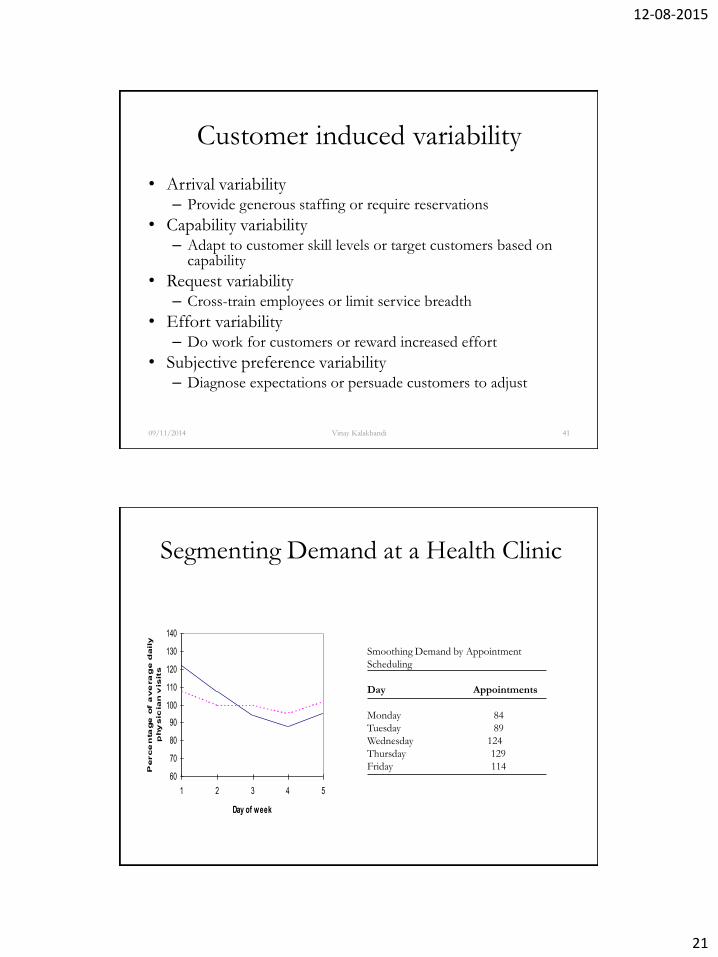
Segmenting Demand at a Health Clinic
60
70
80
90
100
110
120
130
140
1 2 3 4 5
Day of week
Perce
nta
ge
of a
ve
ra
ge d
aily
phy
sic
ian
vis
its
Smoothing Demand by Appointment
Scheduling
Day Appointments
Monday 84
Tuesday 89
Wednesday 124
Thursday 129
Friday 114
12-08-2015
22
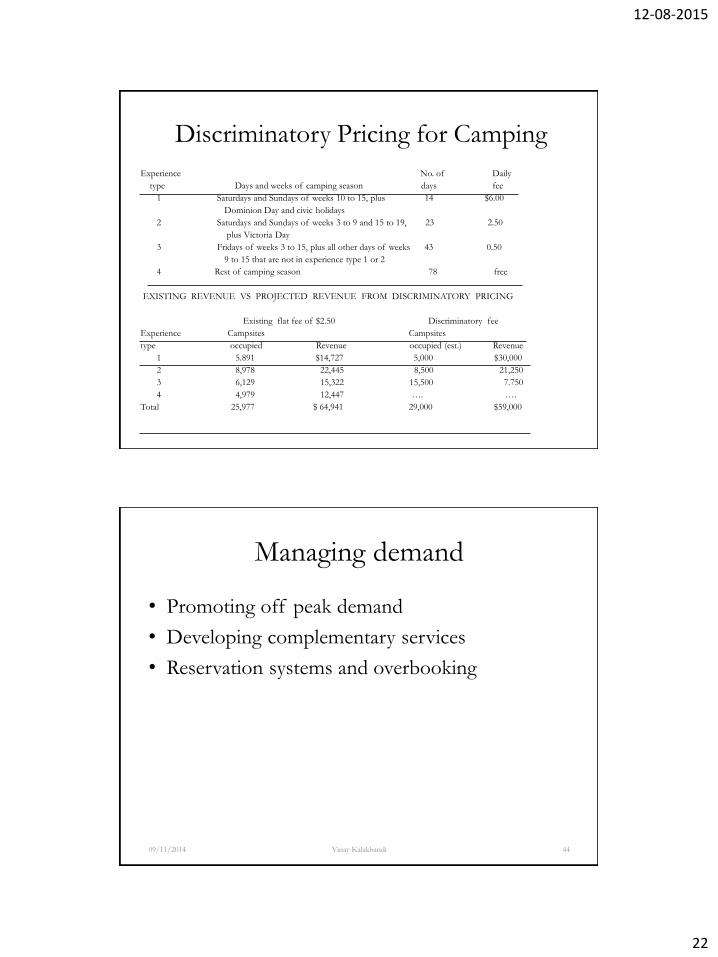
Discriminatory Pricing for Camping
Experience No. of Daily
type Days and weeks of camping season days fee
1 Saturdays and Sundays of weeks 10 to 15, plus 14 $6.00
Dominion Day and civic holidays
2 Saturdays and Sundays of weeks 3 to 9 and 15 to 19, 23 2.50
plus Victoria Day
3 Fridays of weeks 3 to 15, plus all other days of weeks 43 0.50
9 to 15 that are not in experience type 1 or 2
4 Rest of camping season 78 free
EXISTING REVENUE VS PROJECTED REVENUE FROM DISCRIMINATORY PRICING
Existing flat fee of $2.50 Discriminatory fee
Experience Campsites Campsites
type occupied Revenue occupied (est.) Revenue
1 5.891 $14,727 5,000 $30,000
2 8,978 22,445 8,500 21,250
3 6,129 15,322 15,500 7.750
4 4,979 12,447 …. ….
Total 25,977 $ 64,941 29,000 $59,000
Managing demand
• Promoting off peak demand
• Developing complementary services
• Reservation systems and overbooking
09/11/2014 Vinay Kalakbandi 44
12-08-2015
23
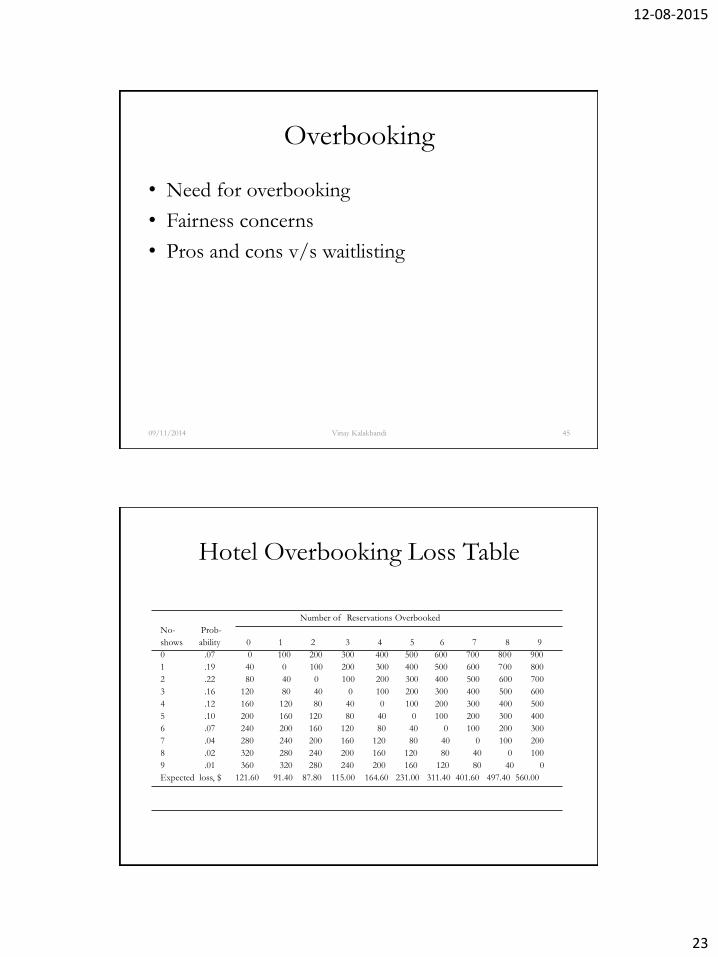
Overbooking
• Need for overbooking
• Fairness concerns
• Pros and cons v/s waitlisting
09/11/2014 Vinay Kalakbandi 45
Hotel Overbooking Loss Table
Number of Reservations Overbooked
No- Prob-
shows ability 0 1 2 3 4 5 6 7 8 9
0 .07 0 100 200 300 400 500 600 700 800 900
1 .19 40 0 100 200 300 400 500 600 700 800
2 .22 80 40 0 100 200 300 400 500 600 700
3 .16 120 80 40 0 100 200 300 400 500 600
4 .12 160 120 80 40 0 100 200 300 400 500
5 .10 200 160 120 80 40 0 100 200 300 400
6 .07 240 200 160 120 80 40 0 100 200 300
7 .04 280 240 200 160 120 80 40 0 100 200
8 .02 320 280 240 200 160 120 80 40 0 100
9 .01 360 320 280 240 200 160 120 80 40 0
Expected loss, $ 121.60 91.40 87.80 115.00 164.60 231.00 311.40 401.60 497.40 560.00
12-08-2015
24
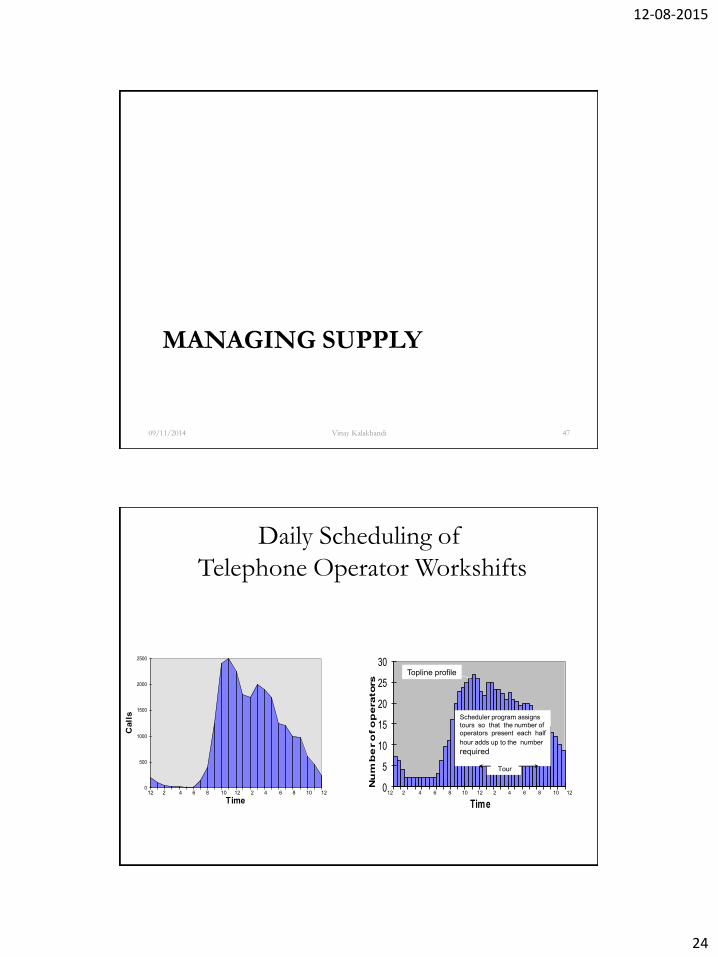
MANAGING SUPPLY
09/11/2014 Vinay Kalakbandi 47
Daily Scheduling of
Telephone Operator Workshifts
0
5
10
15
20
25
30
Nu
mb
er o
f o
perators
Time
Scheduler program assigns
tours so that the number of
operators present each half
hour adds up to the number
required
Topline profile
12 2 4 6 8 10 12 2 4 6 8 10 12
Tour
0
500
1000
1500
2000
2500
Time
Call
s
12 2 4 6 8 10 12 2 4 6 8 10 12
12-08-2015
25
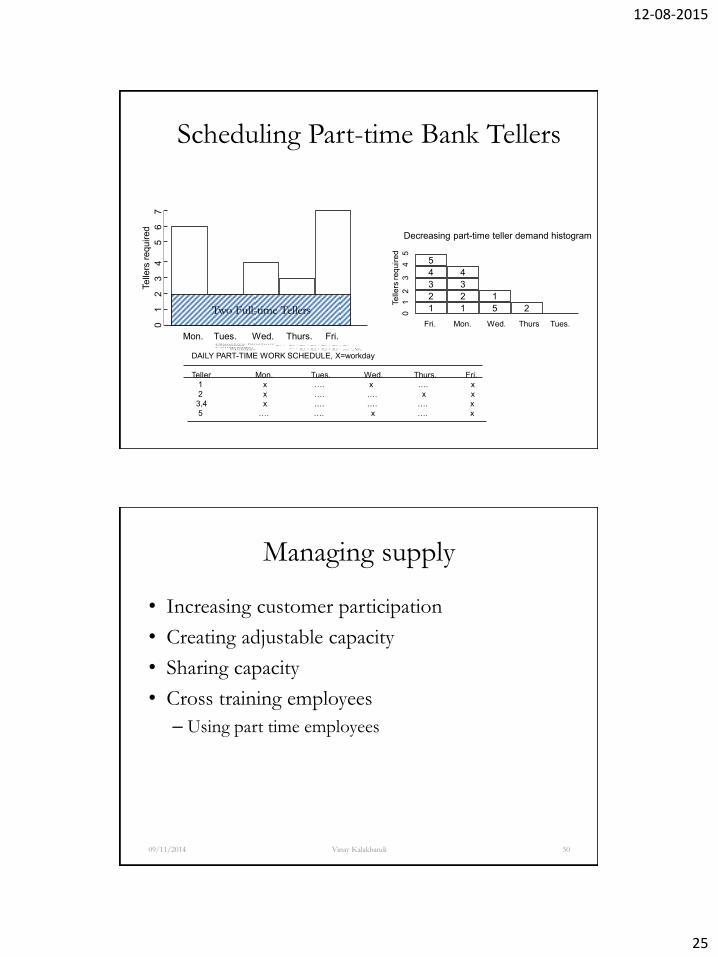
Scheduling Part-time Bank Tellers
Objective function:
Minimize x1+ x2+x3+x4+x5+x6+x7
Constraints:
Sunday x2+x3+x4+x5+x6 b1
Monday x3+x4+x5+x6+x7 b2
0
1
2
3
4
5
6
7
Telle
rs r
equired
Mon. Tues. Wed. Thurs. Fri.
Two Full-time Tellers
5
4
1
3
2
1
4
3
2 1
5 2
Fri. Mon. Wed. Thurs Tues. 0
1
2
3
4
5
Te
lle
rs r
eq
uir
ed
Decreasing part-time teller demand histogram
DAILY PART-TIME WORK SCHEDULE, X=workday
Teller Mon. Tues. Wed. Thurs. Fri.
1 x …. x …. x
2 x …. …. x x
3,4 x …. …. …. x
5 …. …. x …. x
Managing supply
• Increasing customer participation
• Creating adjustable capacity
• Sharing capacity
• Cross training employees
– Using part time employees
09/11/2014 Vinay Kalakbandi 50
12-08-2015
26
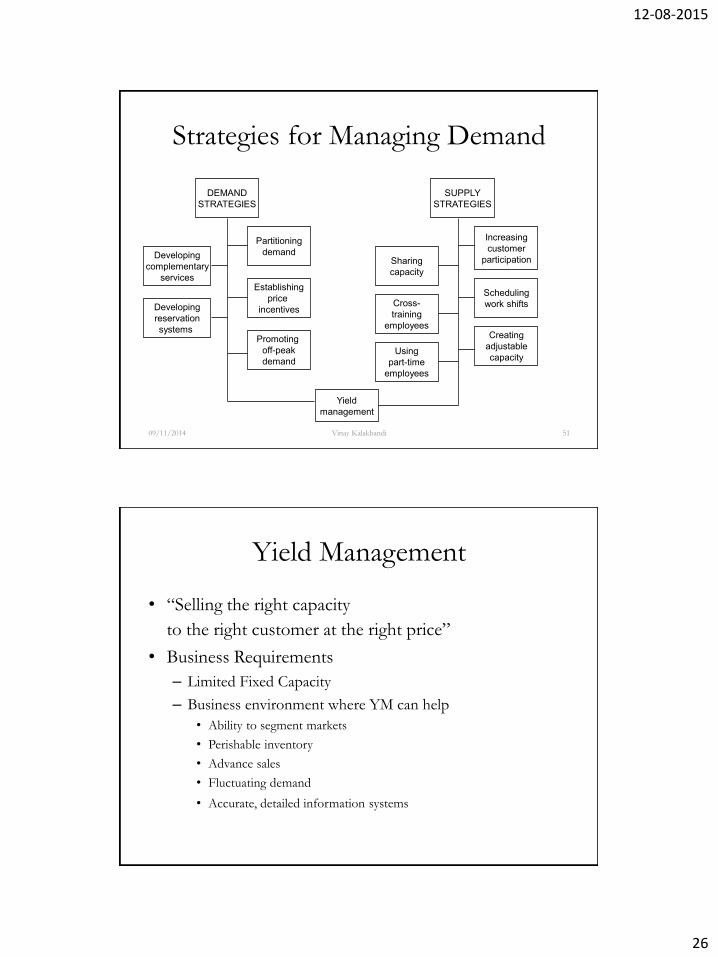
Strategies for Managing Demand
09/11/2014 Vinay Kalakbandi 51
DEMAND
STRATEGIES
Partitioning
demand Developing
complementary
services Establishing
price
incentives Developing
reservation
systems Promoting
off-peak
demand
Yield
management
SUPPLY
STRATEGIES
Cross-
training
employees
Increasing
customer
participation Sharing
capacity
Scheduling
work shifts
Creating
adjustable
capacity Using
part-time
employees
Yield Management
• “Selling the right capacity
to the right customer at the right price”
• Business Requirements
– Limited Fixed Capacity
– Business environment where YM can help
• Ability to segment markets
• Perishable inventory
• Advance sales
• Fluctuating demand
• Accurate, detailed information systems
12-08-2015
27
Industries that Fully Use YM Techniques
• Transportation-oriented industries – Airlines
– Railroads
– Car rental agencies
– Shipping
• Vacation-oriented industries – Tour operators
– Cruise ships
– Resorts
• Hotels, medical, broadcasting
Elements of a Yield Management System
• Lingo
– Reservation prices – Price discrimination
– Fare Buckets – For capturing consumer surplus
– Protection level – for better managing the yield
– Nesting in capacity allocation
• Littlewood’s rule
• EMSR a and EMSRb
12-08-2015
28
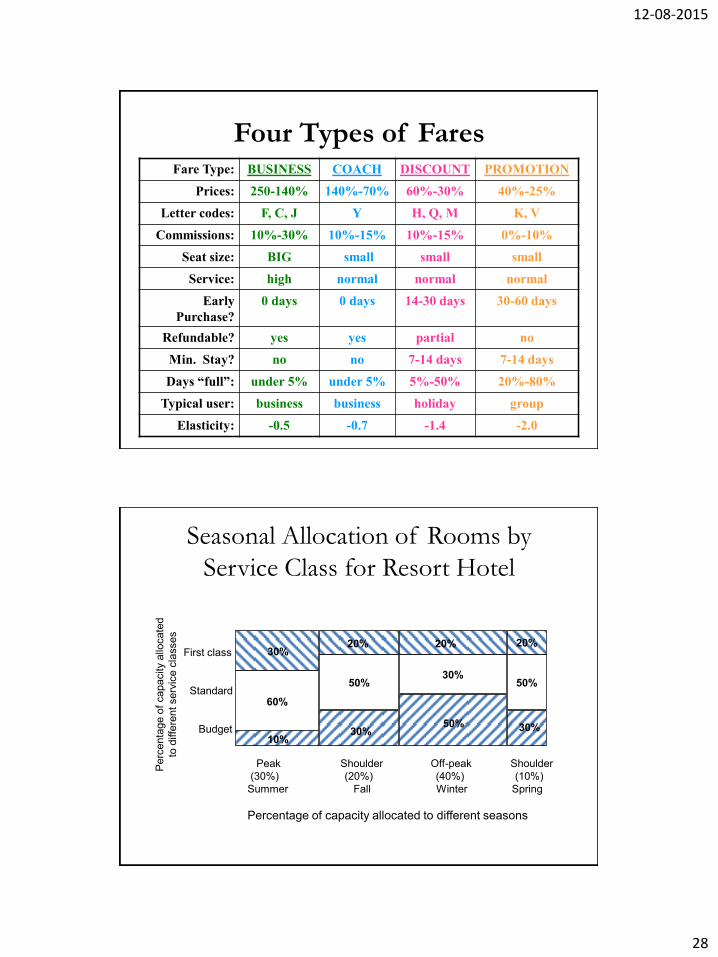
Four Types of Fares Fare Type: BUSINESS COACH DISCOUNT PROMOTION
Prices: 250-140% 140%-70% 60%-30% 40%-25%
Letter codes: F, C, J Y H, Q, M K, V
Commissions: 10%-30% 10%-15% 10%-15% 0%-10%
Seat size: BIG small small small
Service: high normal normal normal
Early
Purchase?
0 days 0 days 14-30 days 30-60 days
Refundable? yes yes partial no
Min. Stay? no no 7-14 days 7-14 days
Days “full”: under 5% under 5% 5%-50% 20%-80%
Typical user: business business holiday group
Elasticity: -0.5 -0.7 -1.4 -2.0
Seasonal Allocation of Rooms by
Service Class for Resort Hotel
First class
Standard
Budget
Perc
enta
ge o
f capacity a
llocate
d
to d
iffe
rent serv
ice c
lasses
60%
50% 30%
20%
50%
Peak Shoulder Off-peak Shoulder
(30%) (20%) (40%) (10%)
Summer Fall Winter Spring
Percentage of capacity allocated to different seasons
30% 20% 20%
10% 30%
50% 30%
12-08-2015
29
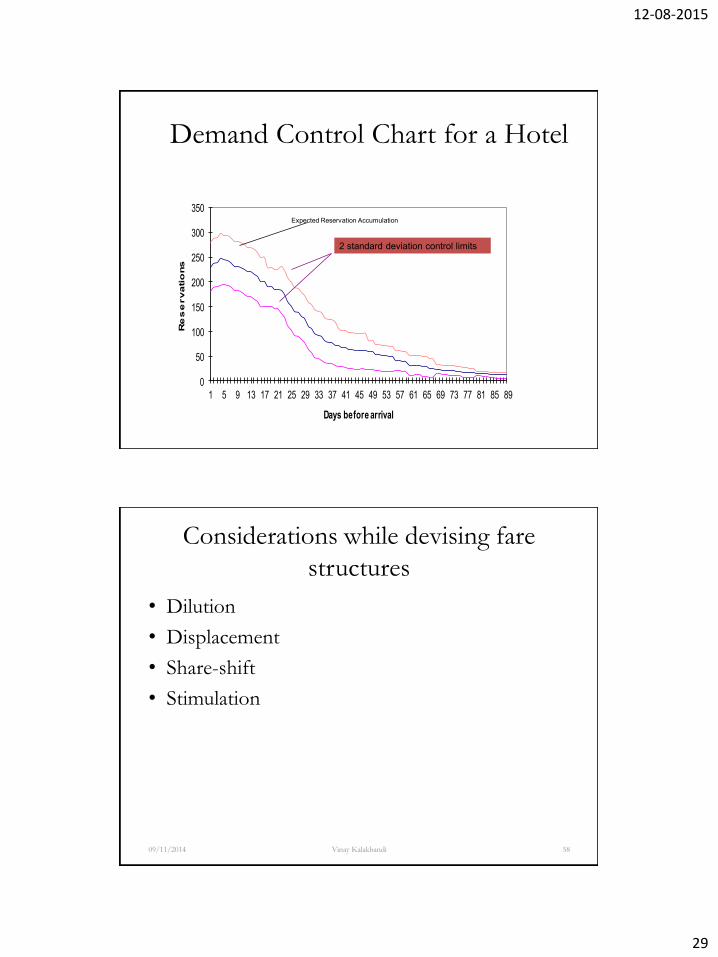
Demand Control Chart for a Hotel
0
50
100
150
200
250
300
350
1 5 9 13 17 21 25 29 33 37 41 45 49 53 57 61 65 69 73 77 81 85 89
Re
se
rvatio
ns
Days before arrival
Expected Reservation Accumulation
2 standard deviation control limits
Considerations while devising fare
structures
• Dilution
• Displacement
• Share-shift
• Stimulation
09/11/2014 Vinay Kalakbandi 58
12-08-2015
30
American Airlines case
09/11/2014 Vinay Kalakbandi 59
THANK YOU
09/11/2014 Vinay Kalakbandi 60


![00. Decision Making_(Week 6)[SO]](https://img.pdfslide.net/doc/110x75/55cf9432550346f57ba0435f/00-decision-makingweek-6so.jpg)