Embed Size (px)
Citation preview

Slide 1
GIZ Support to Ministry of Urban Development
Training on Preparation of City Sanitation Plan – Part II
State of Uttrakhand
Session 2:Analysis of technical sectors
Dehradun, 20-22 April 2017
Slide 203.05.2017
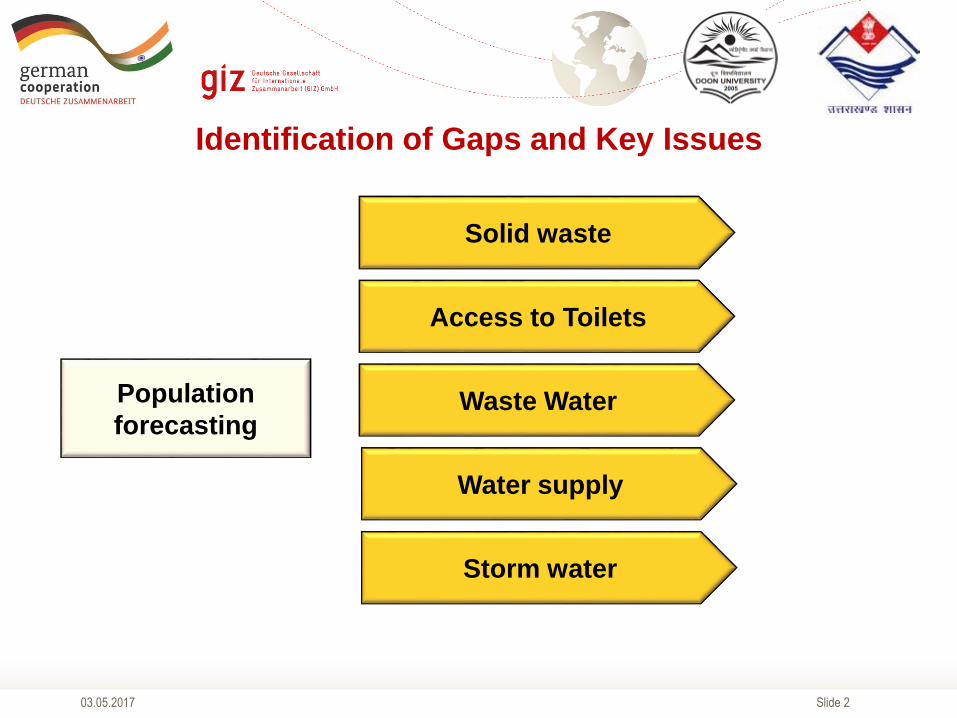
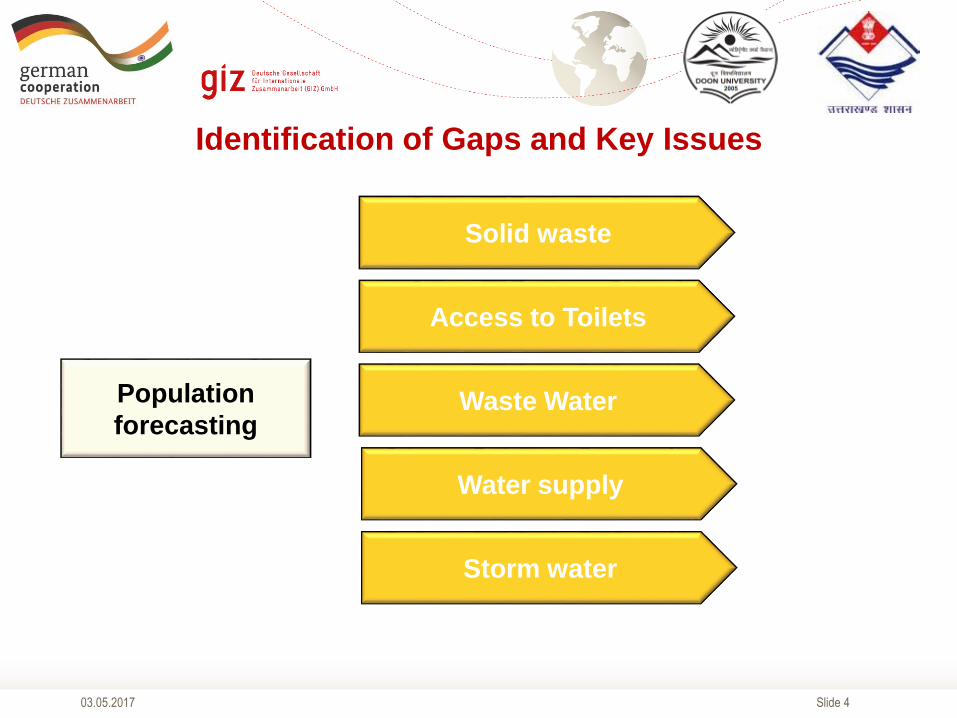
Population
forecasting
Solid waste
Access to Toilets
Waste Water
Water supply
Storm water
Identification of Gaps and Key Issues
Slide 303.05.2017
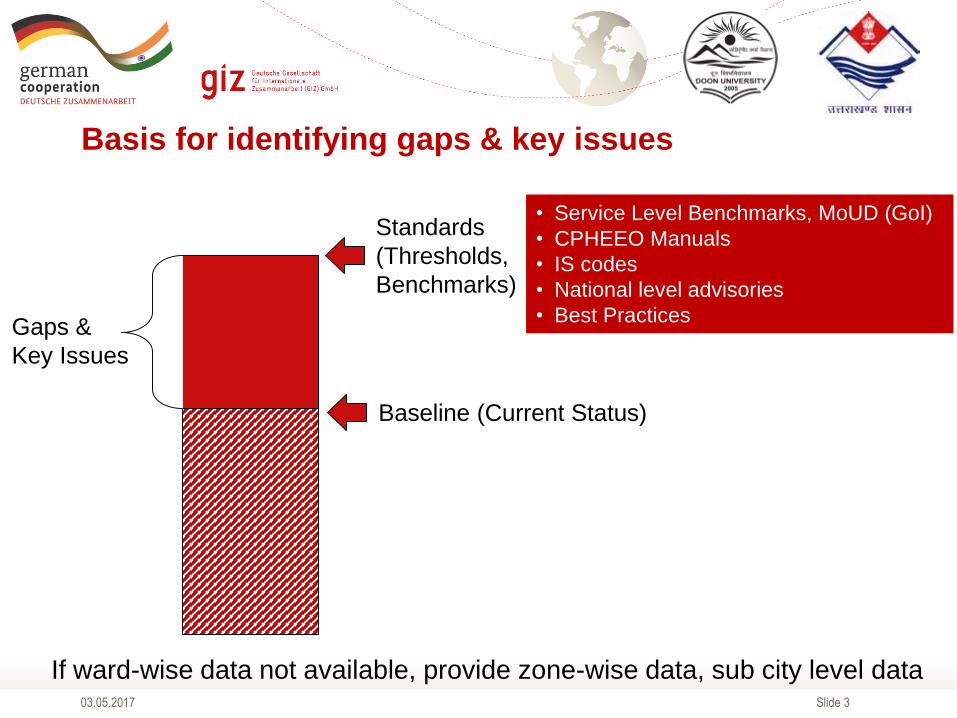
Basis for identifying gaps & key issues
Baseline (Current Status)
Standards
(Thresholds,
Benchmarks)
Gaps &
Key Issues
• Service Level Benchmarks, MoUD (GoI)
• CPHEEO Manuals
• IS codes
• National level advisories
• Best Practices
If ward-wise data not available, provide zone-wise data, sub city level data
Slide 403.05.2017
Population
forecasting
Solid waste
Access to Toilets
Waste Water
Water supply
Storm water
Identification of Gaps and Key Issues
Slide 503.05.2017
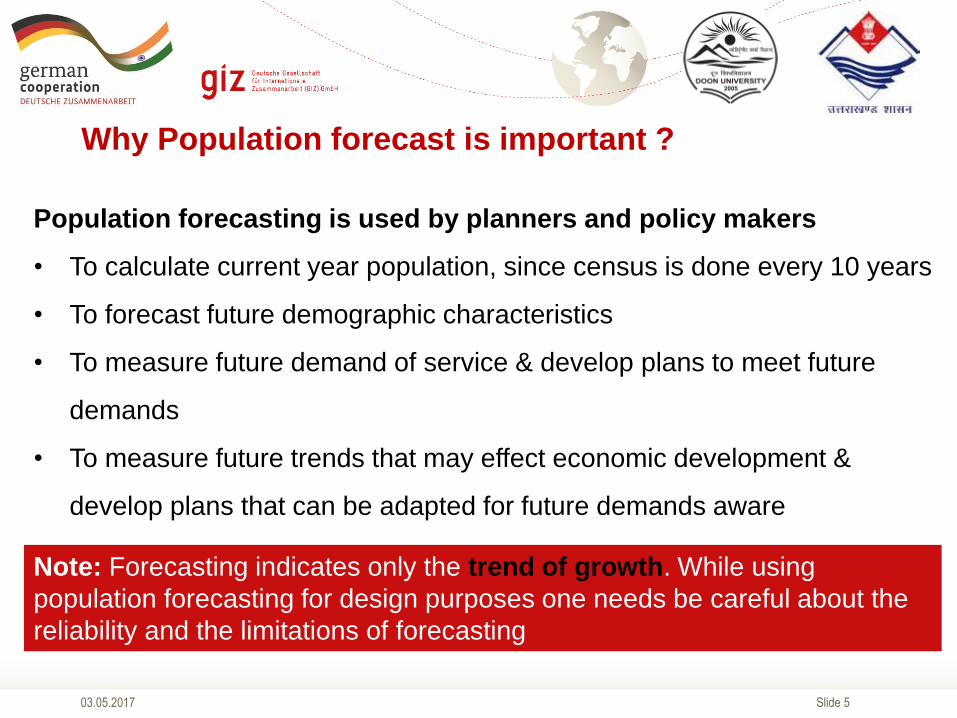
Why Population forecast is important ?
Population forecasting is used by planners and policy makers
• To calculate current year population, since census is done every 10 years
• To forecast future demographic characteristics
• To measure future demand of service & develop plans to meet future
demands
• To measure future trends that may effect economic development &
develop plans that can be adapted for future demands aware
Note: Forecasting indicates only the trend of growth. While using
population forecasting for design purposes one needs be careful about the
reliability and the limitations of forecasting
Slide 603.05.2017
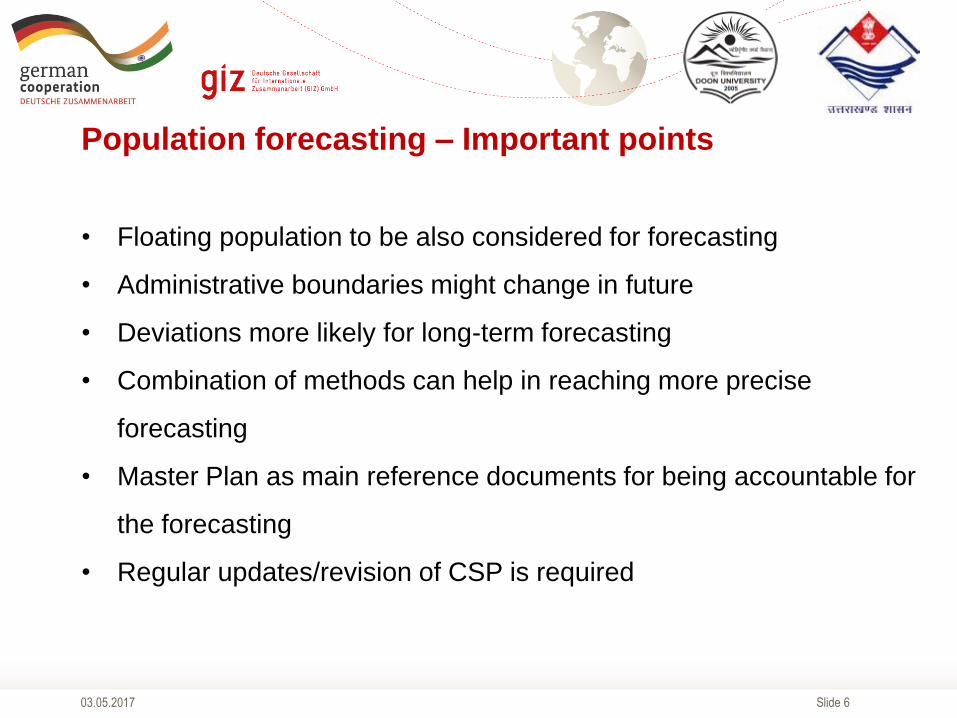
• Floating population to be also considered for forecasting
• Administrative boundaries might change in future
• Deviations more likely for long-term forecasting
• Combination of methods can help in reaching more precise
forecasting
• Master Plan as main reference documents for being accountable for
the forecasting
• Regular updates/revision of CSP is required
Population forecasting – Important points
Slide 703.05.2017
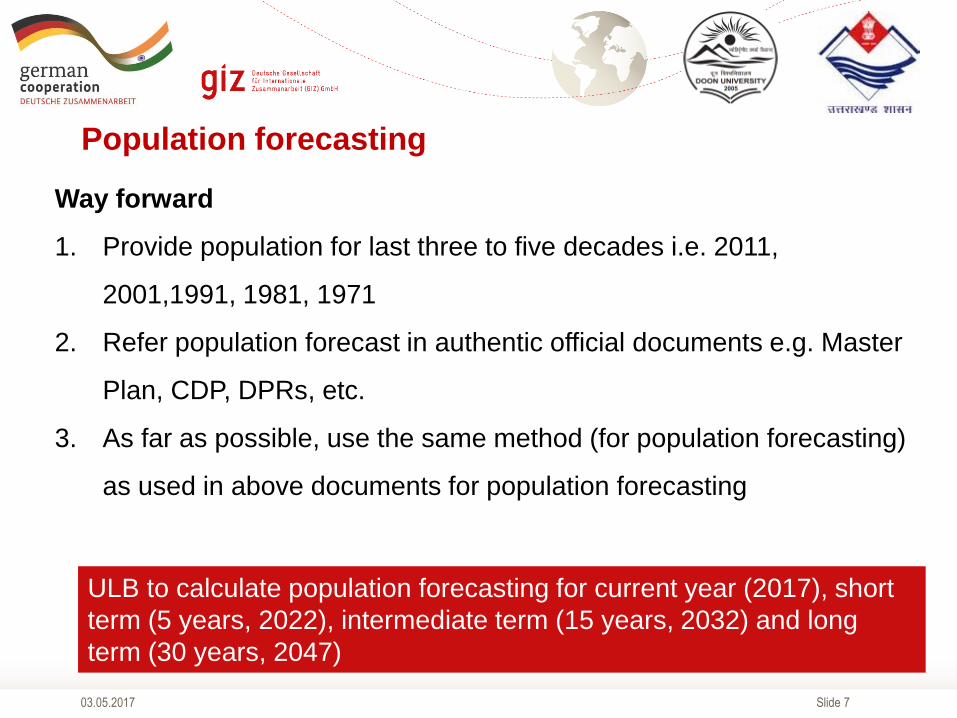
Population forecasting
Way forward
1. Provide population for last three to five decades i.e. 2011,
2001,1991, 1981, 1971
2. Refer population forecast in authentic official documents e.g. Master
Plan, CDP, DPRs, etc.
3. As far as possible, use the same method (for population forecasting)
as used in above documents for population forecasting
ULB to calculate population forecasting for current year (2017), short
term (5 years, 2022), intermediate term (15 years, 2032) and long
term (30 years, 2047)
Slide 803.05.2017
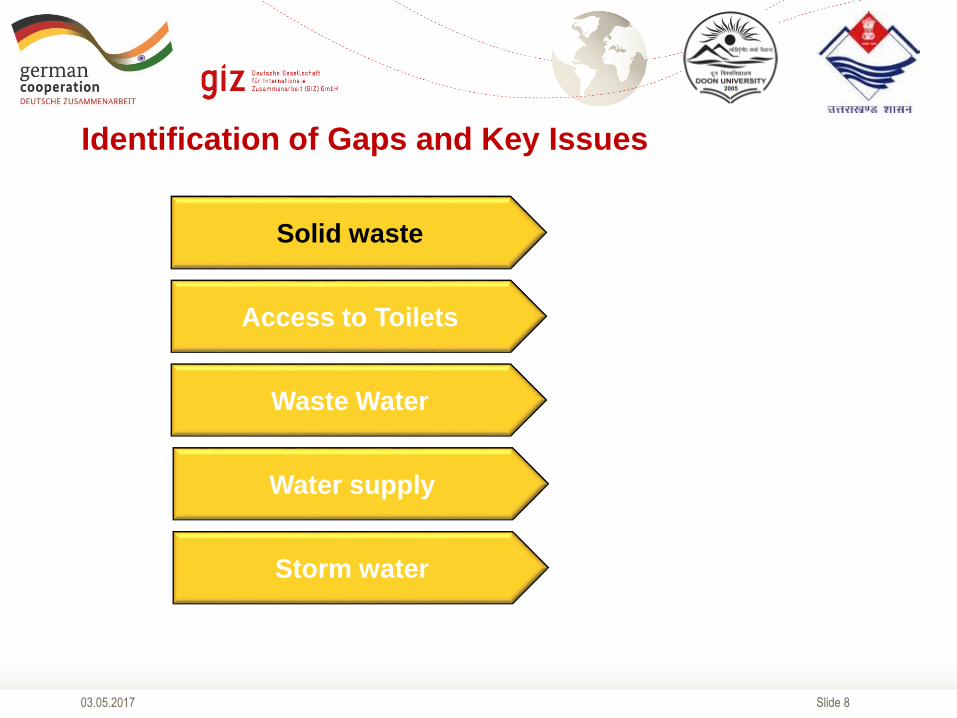
Identification of Gaps and Key Issues
Solid waste
Access to Toilets
Waste Water
Water supply
Storm water
Slide 903.05.2017
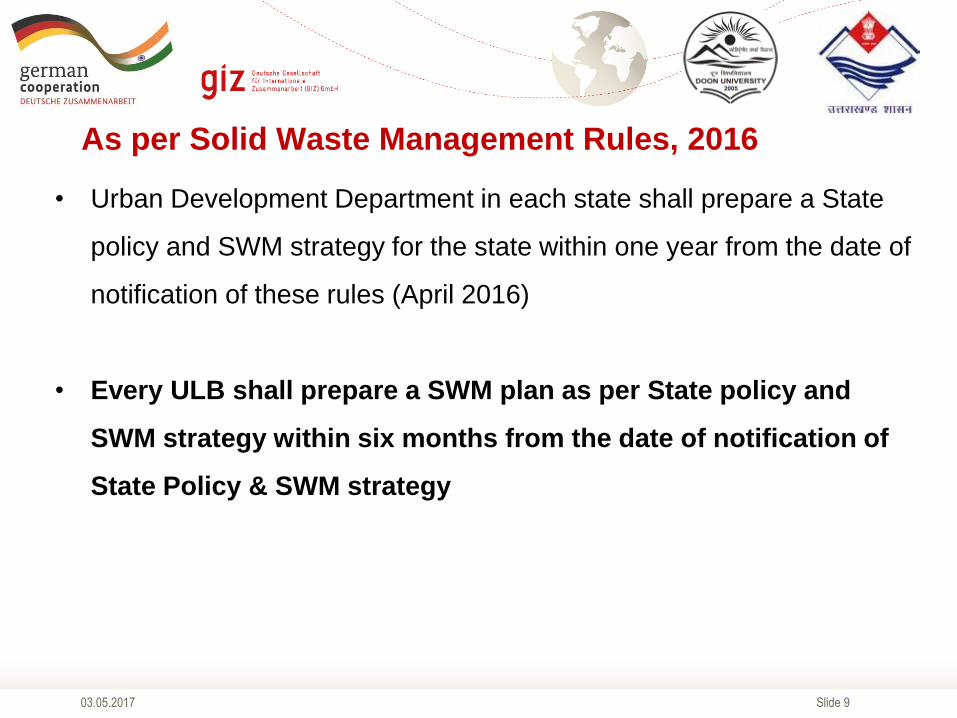
As per Solid Waste Management Rules, 2016
• Urban Development Department in each state shall prepare a State
policy and SWM strategy for the state within one year from the date of
notification of these rules (April 2016)
• Every ULB shall prepare a SWM plan as per State policy and
SWM strategy within six months from the date of notification of
State Policy & SWM strategy
Slide 1003.05.2017
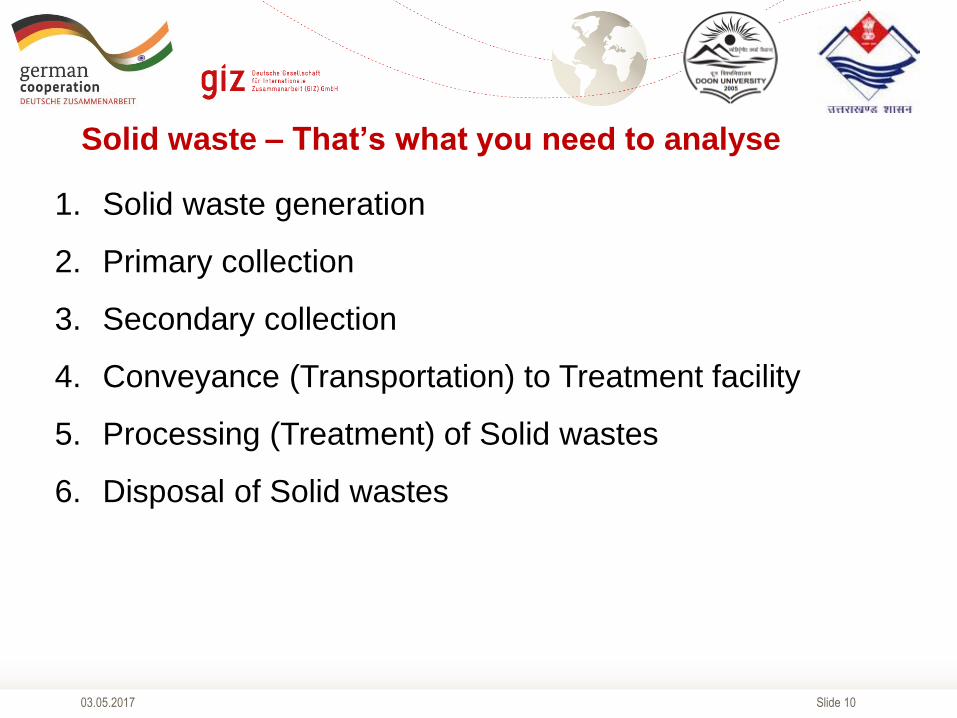
Solid waste – That’s what you need to analyse
1. Solid waste generation
2. Primary collection
3. Secondary collection
4. Conveyance (Transportation) to Treatment facility
5. Processing (Treatment) of Solid wastes
6. Disposal of Solid wastes
Slide 1103.05.2017
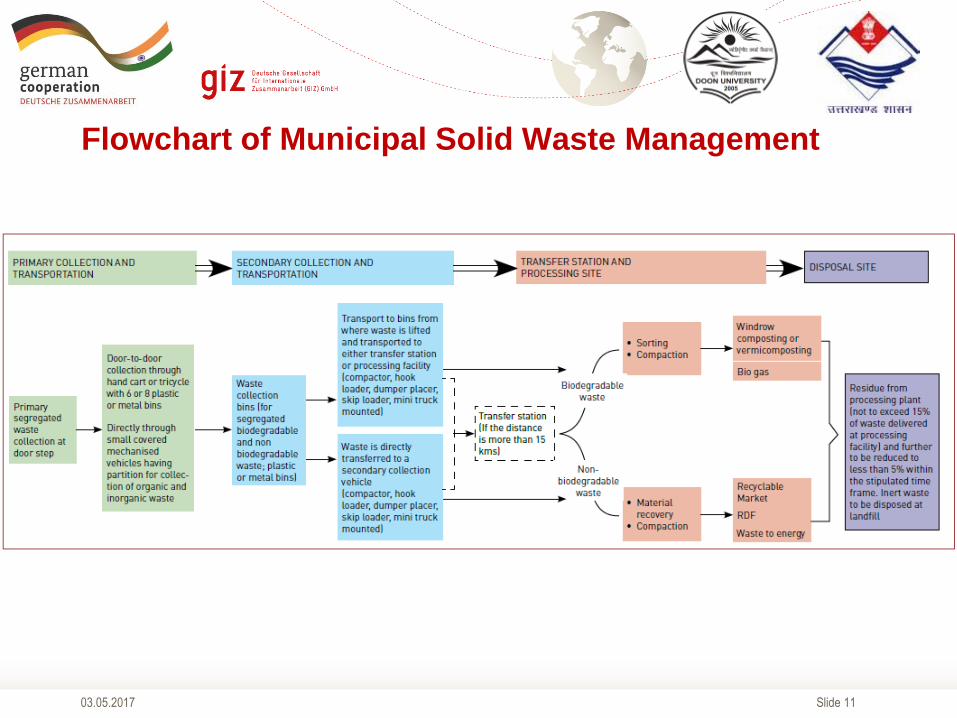
Flowchart of Municipal Solid Waste Management
Slide 1203.05.2017
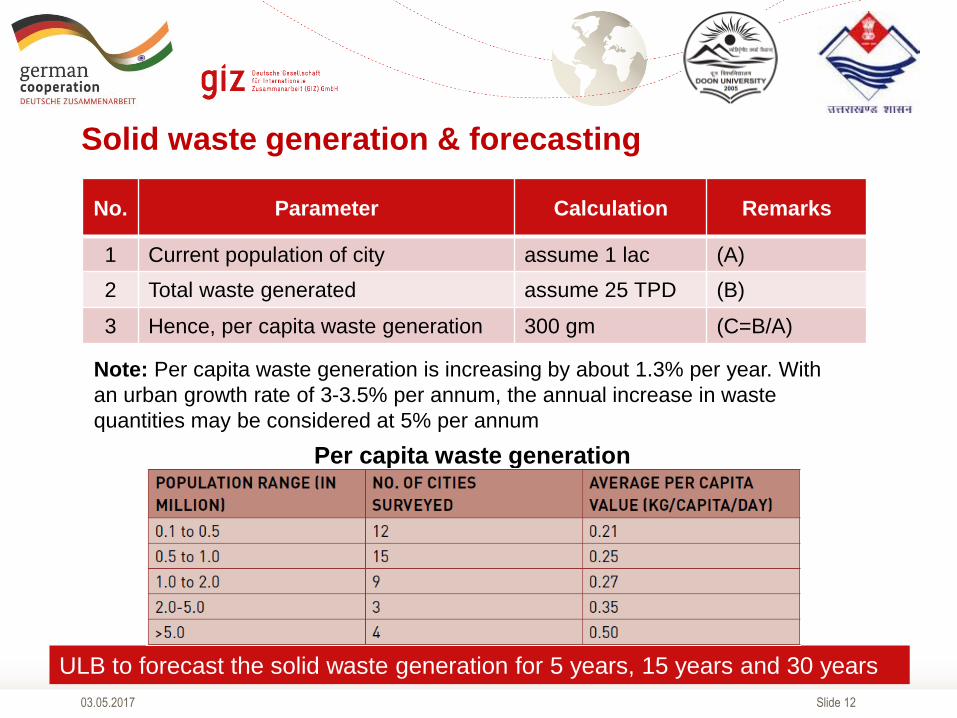
Solid waste generation & forecasting
No. Parameter Calculation Remarks
1 Current population of city assume 1 lac (A)
2 Total waste generated assume 25 TPD (B)
3 Hence, per capita waste generation 300 gm (C=B/A)
ULB to forecast the solid waste generation for 5 years, 15 years and 30 years
Per capita waste generation
Note: Per capita waste generation is increasing by about 1.3% per year. With
an urban growth rate of 3-3.5% per annum, the annual increase in waste
quantities may be considered at 5% per annum
Slide 1303.05.2017
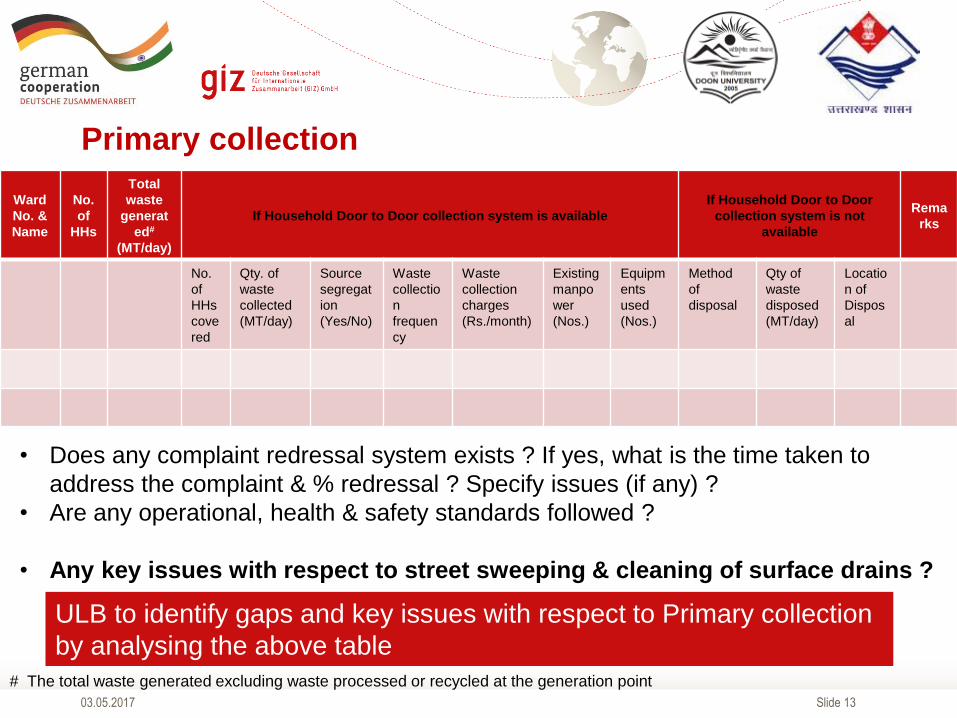
Primary collection
Ward
No. &
Name
No.
of
HHs
Total
waste
generat
ed#
(MT/day)
If Household Door to Door collection system is available
If Household Door to Door
collection system is not
available
Rema
rks
No.
of
HHs
cove
red
Qty. of
waste
collected
(MT/day)
Source
segregat
ion
(Yes/No)
Waste
collectio
n
frequen
cy
Waste
collection
charges
(Rs./month)
Existing
manpo
wer
(Nos.)
Equipm
ents
used
(Nos.)
Method
of
disposal
Qty of
waste
disposed
(MT/day)
Locatio
n of
Dispos
al
ULB to identify gaps and key issues with respect to Primary collection
by analysing the above table
• Does any complaint redressal system exists ? If yes, what is the time taken to
address the complaint & % redressal ? Specify issues (if any) ?
• Are any operational, health & safety standards followed ?
• Any key issues with respect to street sweeping & cleaning of surface drains ?
# The total waste generated excluding waste processed or recycled at the generation point
Slide 1403.05.2017
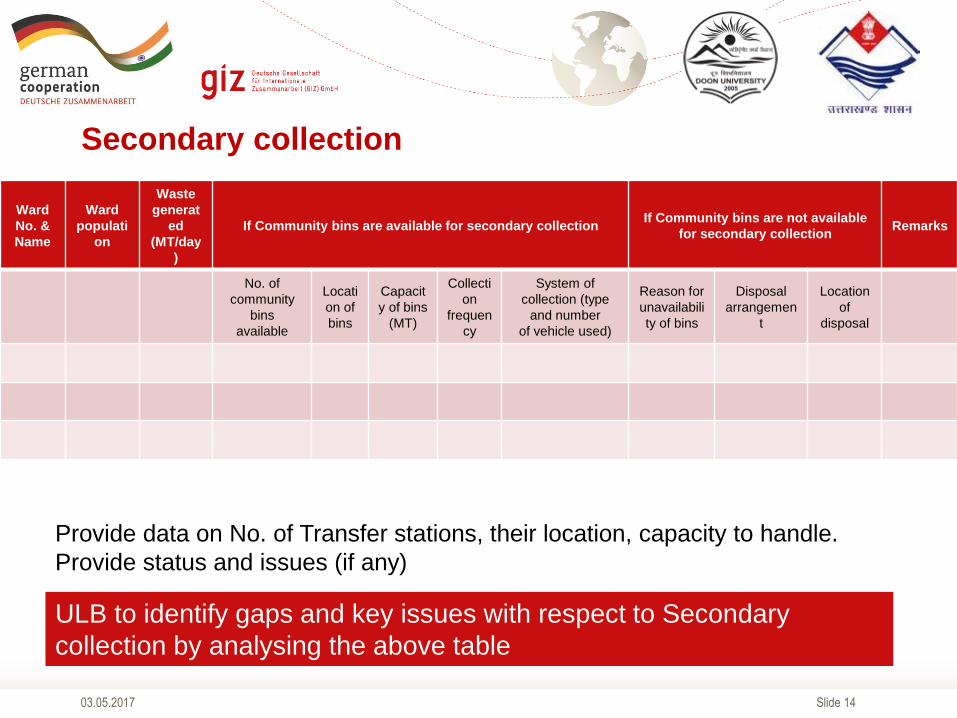
Secondary collection
ULB to identify gaps and key issues with respect to Secondary
collection by analysing the above table
Ward
No. &
Name
Ward
populati
on
Waste
generat
ed
(MT/day
)
If Community bins are available for secondary collectionIf Community bins are not available
for secondary collectionRemarks
No. of
community
bins
available
Locati
on of
bins
Capacit
y of bins
(MT)
Collecti
on
frequen
cy
System of
collection (type
and number
of vehicle used)
Reason for
unavailabili
ty of bins
Disposal
arrangemen
t
Location
of
disposal
Provide data on No. of Transfer stations, their location, capacity to handle.
Provide status and issues (if any)
Slide 1503.05.2017
Conveyance (Transportation) to Treatment facility
• Are the No. & type of vehicles deployed adequate ?
• Is the capacity of vehicles adequate ?
• Is the travel distance economically not viable ?

Slide 1603.05.2017
Processing (Treatment) of Solid wastes
If any Treatment facility exist ?
• How is biodegradable, non-biodegradable and hazardous waste
treated ?
• Is the treatment facility adequate ?
• Any other issues ?
If no Treatment facility exist ?
• Method of disposal and ill-effects of such disposal ?
Slide 1703.05.2017
Disposal of Solid wastes
If any Scientific landfill facility exist ?
• Does the Landfill only permits non-usable, non-recyclable, non-
biodegradable, non-combustible and non-reactive inert waste,
residues of waste processing facilities, etc.
• Is facility for sorting, storing and transportation of recyclable material
to the processing facility existing ?
• Does the Landfill site meet the specification as given in Schedule-I
of SWM Rules, 2016 ?
Slide 1803.05.2017
Standards for Solid waste management
• Solid Waste Management Rules, 2016
• Municipal Solid Waste Management Manual, 2016, CPHEEO, MoUD (GoI)
Slide 1903.05.2017
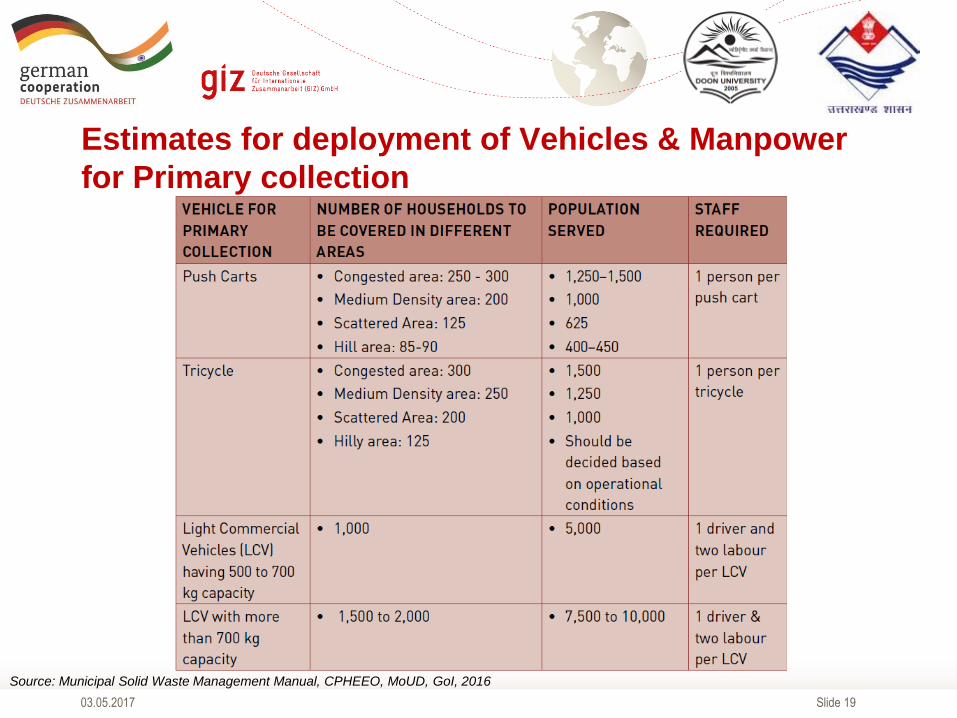
Estimates for deployment of Vehicles & Manpower
for Primary collection
Source: Municipal Solid Waste Management Manual, CPHEEO, MoUD, GoI, 2016
Slide 2003.05.2017
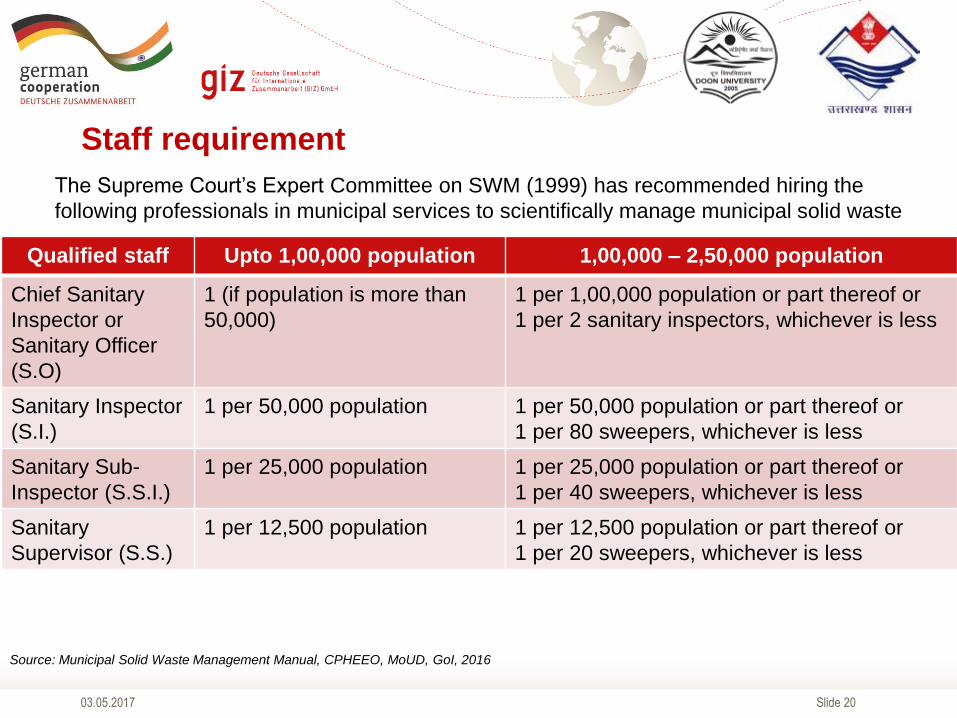
Staff requirement
The Supreme Court’s Expert Committee on SWM (1999) has recommended hiring the
following professionals in municipal services to scientifically manage municipal solid waste
Qualified staff Upto 1,00,000 population 1,00,000 – 2,50,000 population
Chief Sanitary
Inspector or
Sanitary Officer
(S.O)
1 (if population is more than
50,000)
1 per 1,00,000 population or part thereof or
1 per 2 sanitary inspectors, whichever is less
Sanitary Inspector
(S.I.)
1 per 50,000 population 1 per 50,000 population or part thereof or
1 per 80 sweepers, whichever is less
Sanitary Sub-
Inspector (S.S.I.)
1 per 25,000 population 1 per 25,000 population or part thereof or
1 per 40 sweepers, whichever is less
Sanitary
Supervisor (S.S.)
1 per 12,500 population 1 per 12,500 population or part thereof or
1 per 20 sweepers, whichever is less
Source: Municipal Solid Waste Management Manual, CPHEEO, MoUD, GoI, 2016
Slide 2103.05.2017
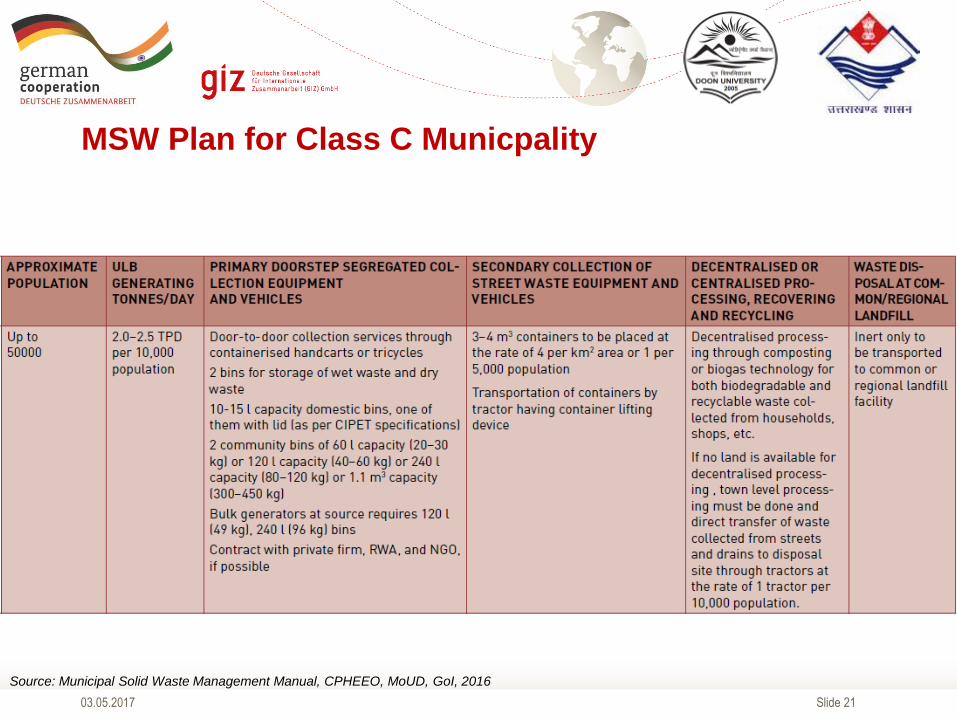
MSW Plan for Class C Municpality
Source: Municipal Solid Waste Management Manual, CPHEEO, MoUD, GoI, 2016
Slide 2203.05.2017
Indicative key issues
• Lack of source segregation and limited composting / waste recovery levels
• Littering and waste dumping in open drains reflects the poor state of SWM in the
city. Door-to-collection is negligible while processing / safe landfilling is non-
existent
• Indiscriminate dumping of solid waste in open storm water drains and inadequate
treatment and disposal facility causes adverse impacts in downstream areas
• Solid waste management system does not comply with the SWM rules, 2016 and
CPHEEO manual

Slide 23
Room mapping exercise Solid Waste
Management
03.05.2017
• Do you have door-2-door collection?
• Is there any kind of Solid Waste Treatment Facility in
your city?
Slide 2403.05.2017
Identification of Gaps and Key Issues
Solid waste
Access to Toilets
Waste Water
Water supply
Storm water
Slide 2503.05.2017
Access to Toilets – That’s what you need to analyse
1. Coverage of Toilets
2. Community Toilets
3. Public Toilets
Slide 2603.05.2017
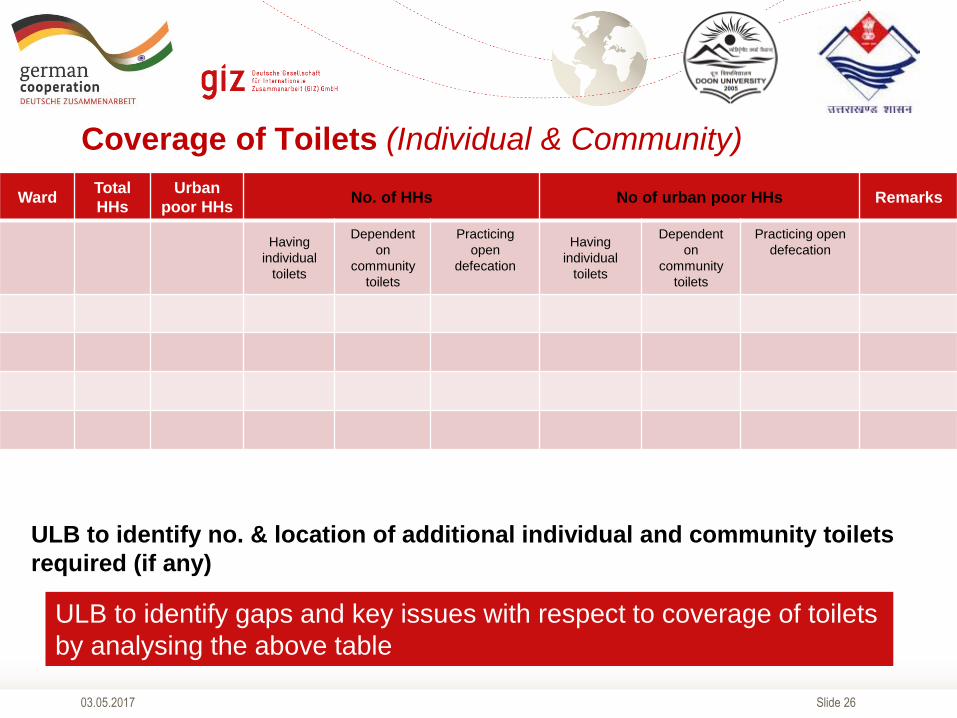
Coverage of Toilets (Individual & Community)
ULB to identify gaps and key issues with respect to coverage of toilets
by analysing the above table
ULB to identify no. & location of additional individual and community toilets
required (if any)
WardTotal
HHs
Urban
poor HHsNo. of HHs No of urban poor HHs Remarks
Having
individual
toilets
Dependent
on
community
toilets
Practicing
open
defecation
Having
individual
toilets
Dependent
on
community
toilets
Practicing open
defecation
Slide 2703.05.2017
Community Toilet Blocks
ULB to identify gaps and key issues with respect to Community Toilets
by analysing the above table
S
r.
N
o.
Lo
cat
ion
/
Wa
rd
No. of
Popula
tion
depen
dent
No of
Seats
No of
Urinals
Waste water
disposal
arrangement
(sewered,
septic tank,
open drains,
etc)
Function
al status
(water,
lighting,
etc)
Design
considerat
ion for
men &
women
(privacy) –
Yes / No
Is
complaint
redressal
system
available ?
Own
ed
&
Main
taine
d by
User
charg
es
(Rs)
Cost
Reco
very
(%)
Re
ma
rks
M
en
Wo
men
Me
n
W
om
en
Slide 2803.05.2017
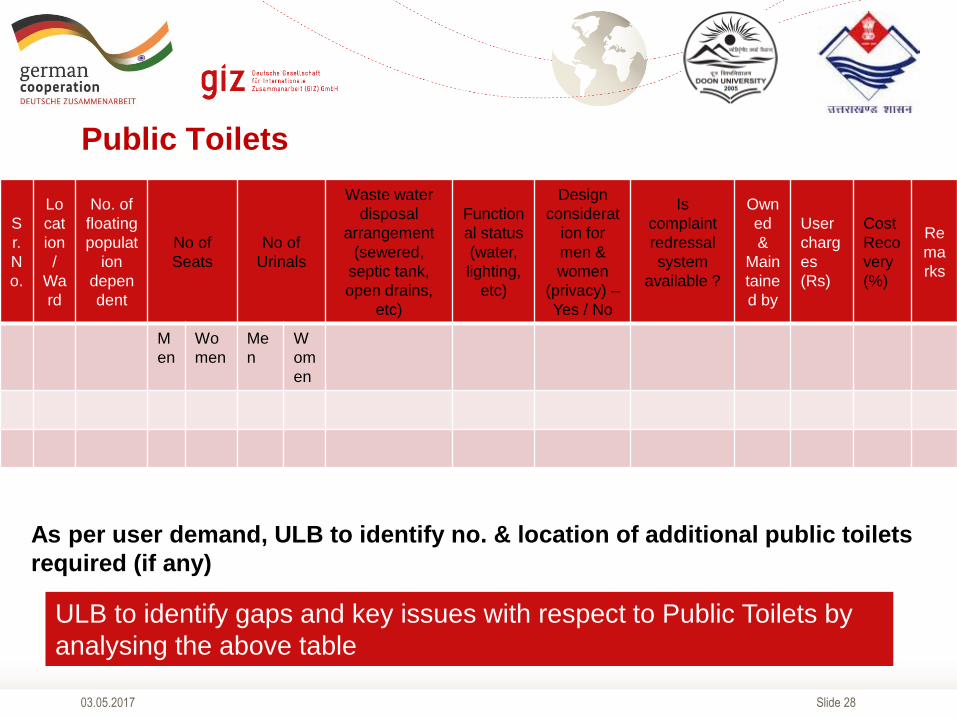
Public Toilets
ULB to identify gaps and key issues with respect to Public Toilets by
analysing the above table
As per user demand, ULB to identify no. & location of additional public toilets
required (if any)
S
r.
N
o.
Lo
cat
ion
/
Wa
rd
No. of
floating
populat
ion
depen
dent
No of
Seats
No of
Urinals
Waste water
disposal
arrangement
(sewered,
septic tank,
open drains,
etc)
Function
al status
(water,
lighting,
etc)
Design
considerat
ion for
men &
women
(privacy) –
Yes / No
Is
complaint
redressal
system
available ?
Own
ed
&
Main
taine
d by
User
charg
es
(Rs)
Cost
Reco
very
(%)
Re
ma
rks
M
en
Wo
men
Me
n
W
om
en
Slide 3003.05.2017
Standards for Toilets
• IS 1172 : 1993, Code of Basic Requirements for Water supply, Drainage and
Sanitation
• Guidelines on Community Toilets, 1995, Ministry of Urban Affairs and Employment
(GoI)
• National School Sanitation Manual, MoUD & MHRD (GoI)
• State / Local Municipal Building rules (Uttrakhand (to be confirmed ) Municipality
Building Rules)
• Guidelines for Swachh Bharat Mission (SBM), MoUD (GoI)
• Swachh Bharat Swachh Vidyalaya – A National Mission

Slide 3103.05.2017
Norms for Toilets
• Source: Guidelines for Swachh Bharat Mission (SBM), MoUD (GoI)
Men Women
Toilet seats 35 25Community
Toilets
Toilet seats
One per 100 persons up to
400 persons;
For over 400 persons, add
at the rate of one per 250
persons or part thereof
Two for 100 persons up
to 200 persons;
over 200 persons, add at
the rate of one per 100
persons or part thereof
Public Toilets
UrinalsOne for 50 persons or
part thereofNil
Slide 3203.05.2017
Indicative key issues
• Inadequate and deficiently designed, operated & managed individual and
community toilets in the urban poor areas resulting in open defecation and
severe health impacts
• Prevalence of open defecation in slums and around religious areas and open
urination at public places
• Inadequately designed, operated and managed public toilets resulting in open
defecation causing health impacts
• Inadequate provision of Public Toilets and Community toilets has led to
prevalence of open defecation in low-income pockets in the fringes and open
urination in commercial areas respectively
Slide 3303.05.2017
Identification of Gaps and Key Issues
Solid waste
Access to Toilets
Waste Water
Water supply
Storm water
Slide 3403.05.2017
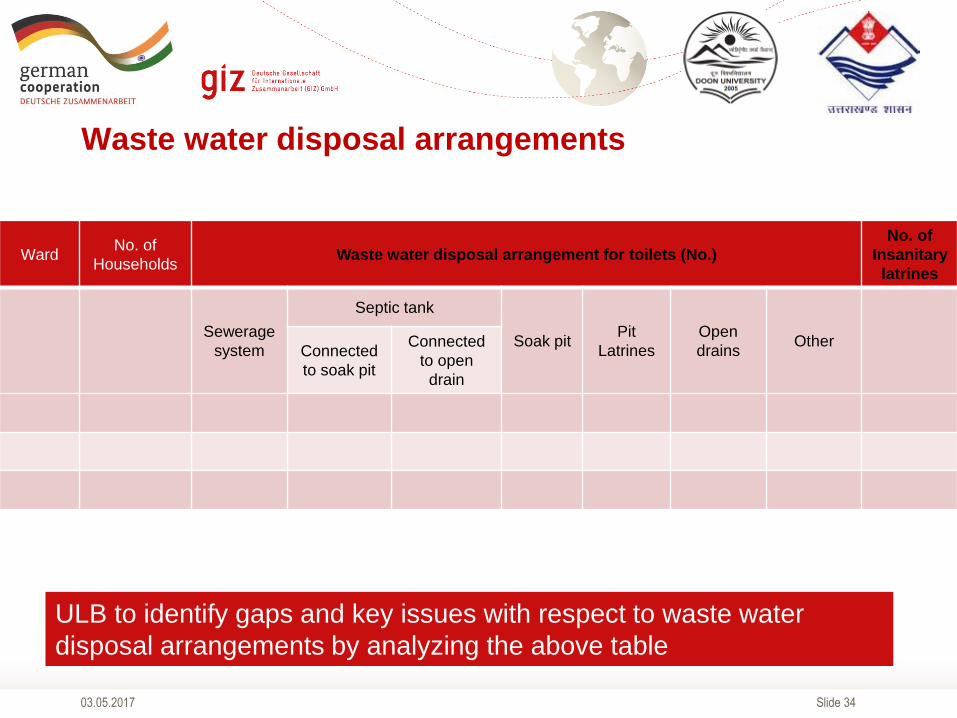
Waste water disposal arrangements
ULB to identify gaps and key issues with respect to waste water
disposal arrangements by analyzing the above table
WardNo. of
HouseholdsWaste water disposal arrangement for toilets (No.)
No. of
Insanitary
latrines
Sewerage
system
Septic tank
Soak pitPit
Latrines
Open
drainsOther
Connected
to soak pit
Connected
to open
drain
Slide 3503.05.2017
Waste water (septage management) – That’s what
you need to analyse
1. Waste water disposal arrangements
2. Septic Tanks
3. Septage collection & conveyance
4. Septage Treatment & Disposal / Reuse
Slide 3603.05.2017
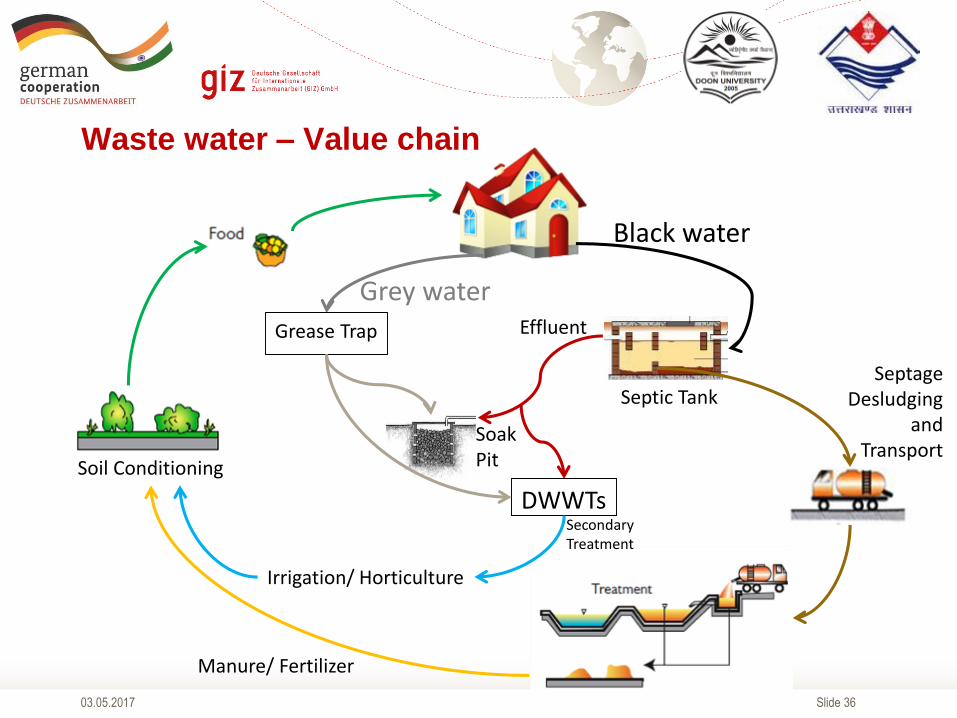
Waste water – Value chain
Black water
Grey water
Septic Tank
Effluent
Soak Pit
Septage Desludging
and Transport
DWWTs
Grease Trap
Secondary Treatment
Soil Conditioning
Irrigation/ Horticulture
Manure/ Fertilizer
Slide 3703.05.2017
Septic Tanks
• Does the design of existing septic tanks (in the city) confirm to IS 2470 (Part 1):1985 ?
o Are the septic tanks two chambered and water tight ?
o What is the physical condition & functional status of septic tanks ? Are they broken ?
o Are the septic tanks of adequate size ?
o Is grey water also entering into the septic tanks ?
o Where are the septic tanks located with respect to the building ? Are they accessible for cleaning ?
• Is the design of septic tanks controlled through building / planning rules at ULB level ?
• Where is the grey water and effluent (from septic tanks) disposed ?
• Does any secondary treatment system (eg. soak pit, dispersion trench, etc.) exist for
disposal and treatment of effluent (from septic tanks) and grey water ?
• Are the secondary treatment systems designed as per IS 2470 (Part 2) : 1985 ?
ULB to identify gaps and key issues related to Septic Tanks
Slide 3803.05.2017
Septage collection & conveyance
ULB to identify gaps and key issues related to Septage collection &
conveyance
• Is septage collection & conveyance activity completely or partially managed by the private
operators ? Are these private operators authorized and regulated ?
• Is the desludging of septic tanks carried out every 2-3 years ?
• Are number & type of vehicles deployed for septage collection & conveyance adequate?
• Does any complaint redressal system exists ?
• Are any operational, health & safety standards followed during septage collection &
conveyance activity ?
Manual Scavenging• No. of manual scavengers in the city ?
• Reasons for manual scavenging
Slide 3903.05.2017
Septage Treatment and Disposal / Reuse
• Does any treatment facility exists ?
• Location for disposal of untreated septage ? What are the ill effects of such
disposal ?
• Is untreated septage reused (eg. manure, etc.) ?
ULB to identify gaps and key issues related to Septage Treatment &
Disposal / Reuse
Slide 4003.05.2017
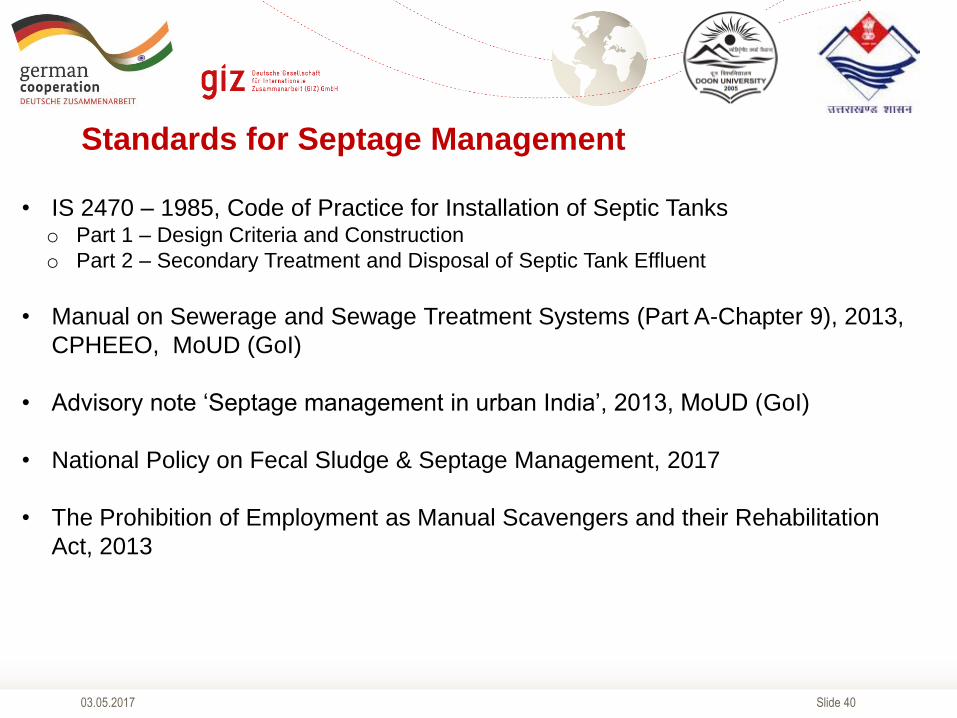
Standards for Septage Management
• IS 2470 – 1985, Code of Practice for Installation of Septic Tankso Part 1 – Design Criteria and Construction
o Part 2 – Secondary Treatment and Disposal of Septic Tank Effluent
• Manual on Sewerage and Sewage Treatment Systems (Part A-Chapter 9), 2013,
CPHEEO, MoUD (GoI)
• Advisory note ‘Septage management in urban India’, 2013, MoUD (GoI)
• National Policy on Fecal Sludge & Septage Management, 2017
• The Prohibition of Employment as Manual Scavengers and their Rehabilitation
Act, 2013
Slide 41Session 3: Stakeholder
03.05.2017
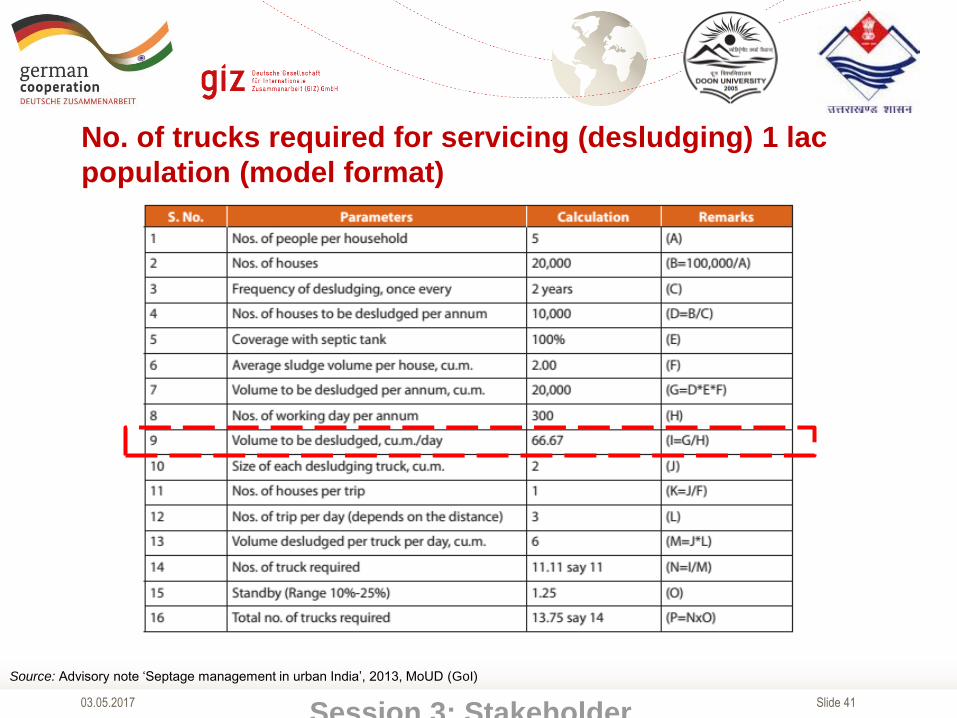
No. of trucks required for servicing (desludging) 1 lac
population (model format)
Source: Advisory note ‘Septage management in urban India’, 2013, MoUD (GoI)
Slide 4203.05.2017
Indicative key issues
• Lack of information on waste water disposal arrangements
• Limited efforts towards septage management
• Regulation and over sight of onsite Sanitation & Septage Management is
inadequate
• Unscientific disposal of septage from Septic Tanks into open drains causes
adverse impacts in downstream areas
• Higher risk due to improper septic tanks and septage management leading to
contamination of water bodies/water supply distribution system and incidences of
water borne diseases
Slide 4703.05.2017
Identification of Gaps and Key Issues
Solid waste
Access to Toilets
Waste Water
Water supply
Storm water
Slide 4803.05.2017
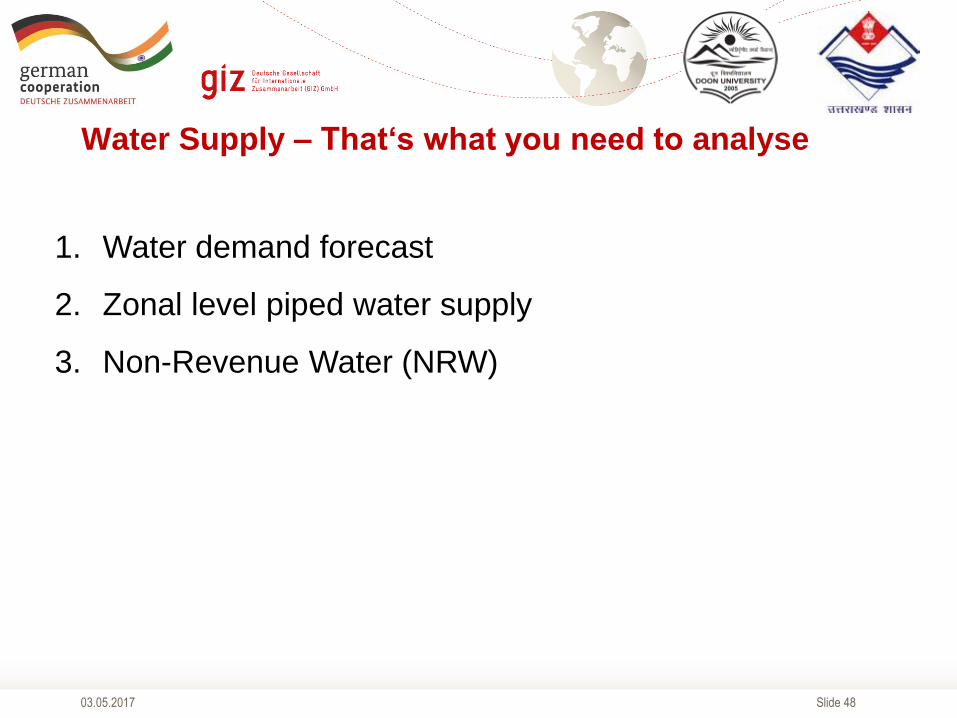
Water Supply – That‘s what you need to analyse
1. Water demand forecast
2. Zonal level piped water supply
3. Non-Revenue Water (NRW)
Slide 4903.05.2017
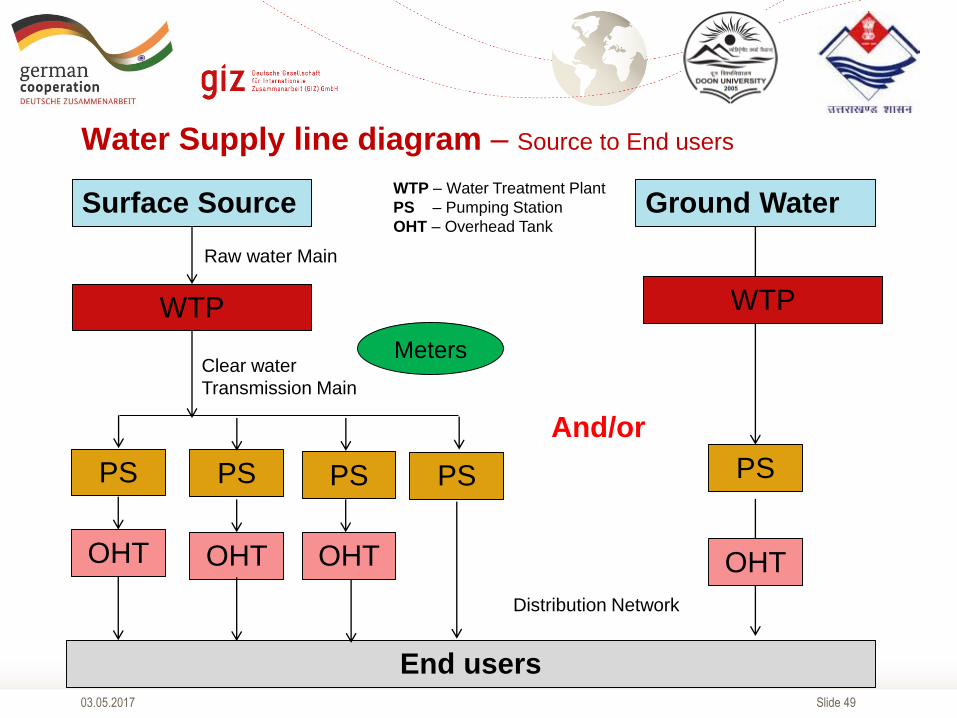
Water Supply line diagram – Source to End users
Surface Source
WTP
OHT
End users
Ground Water
OHT OHT
PS PS PS PS PS
Raw water Main
Clear water
Transmission Main
Distribution Network
Meters
WTP – Water Treatment Plant
PS – Pumping Station
OHT – Overhead Tank
WTP
OHT
And/or
Slide 5003.05.2017
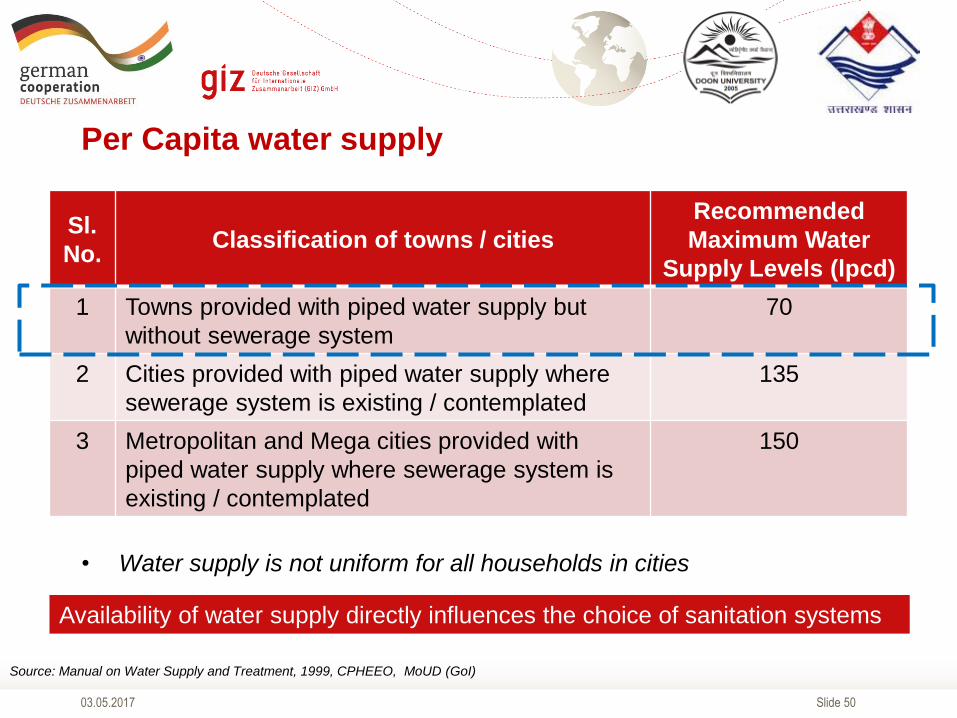
• Water supply is not uniform for all households in cities
Sl.
No.Classification of towns / cities
Recommended
Maximum Water
Supply Levels (lpcd)
1 Towns provided with piped water supply but
without sewerage system
70
2 Cities provided with piped water supply where
sewerage system is existing / contemplated
135
3 Metropolitan and Mega cities provided with
piped water supply where sewerage system is
existing / contemplated
150
Per Capita water supply
Source: Manual on Water Supply and Treatment, 1999, CPHEEO, MoUD (GoI)
Availability of water supply directly influences the choice of sanitation systems
Slide 5103.05.2017
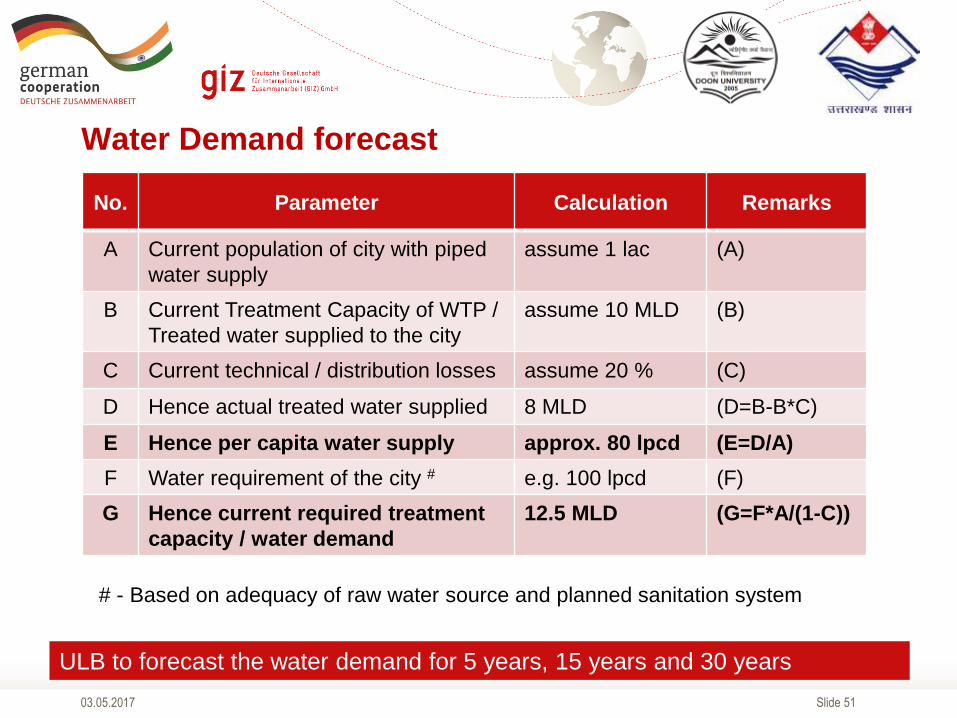
Water Demand forecast
ULB to forecast the water demand for 5 years, 15 years and 30 years
No. Parameter Calculation Remarks
A Current population of city with piped
water supply
assume 1 lac (A)
B Current Treatment Capacity of WTP /
Treated water supplied to the city
assume 10 MLD (B)
C Current technical / distribution losses assume 20 % (C)
D Hence actual treated water supplied 8 MLD (D=B-B*C)
E Hence per capita water supply approx. 80 lpcd (E=D/A)
F Water requirement of the city # e.g. 100 lpcd (F)
G Hence current required treatment
capacity / water demand
12.5 MLD (G=F*A/(1-C))
# - Based on adequacy of raw water source and planned sanitation system
Slide 5203.05.2017
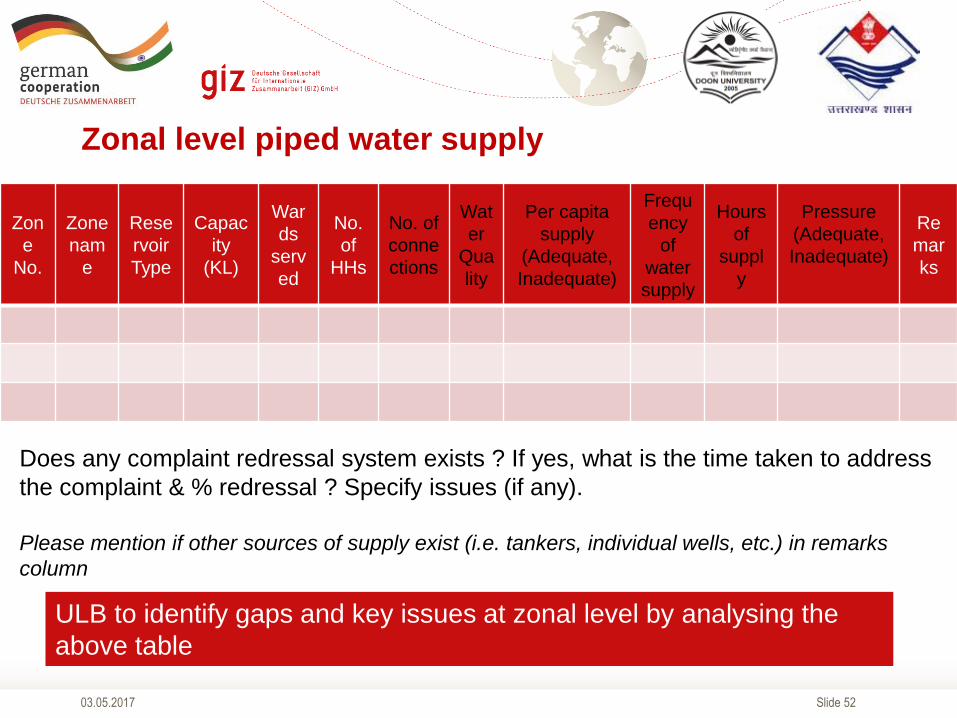
Zonal level piped water supply
Zon
e
No.
Zone
nam
e
Rese
rvoir
Type
Capac
ity
(KL)
War
ds
serv
ed
No.
of
HHs
No. of
conne
ctions
Wat
er
Qua
lity
Per capita
supply
(Adequate,
Inadequate)
Frequ
ency
of
water
supply
Hours
of
suppl
y
Pressure
(Adequate,
Inadequate)
Re
mar
ks
Does any complaint redressal system exists ? If yes, what is the time taken to address
the complaint & % redressal ? Specify issues (if any).
Please mention if other sources of supply exist (i.e. tankers, individual wells, etc.) in remarks
column
ULB to identify gaps and key issues at zonal level by analysing the
above table
Slide 5303.05.2017
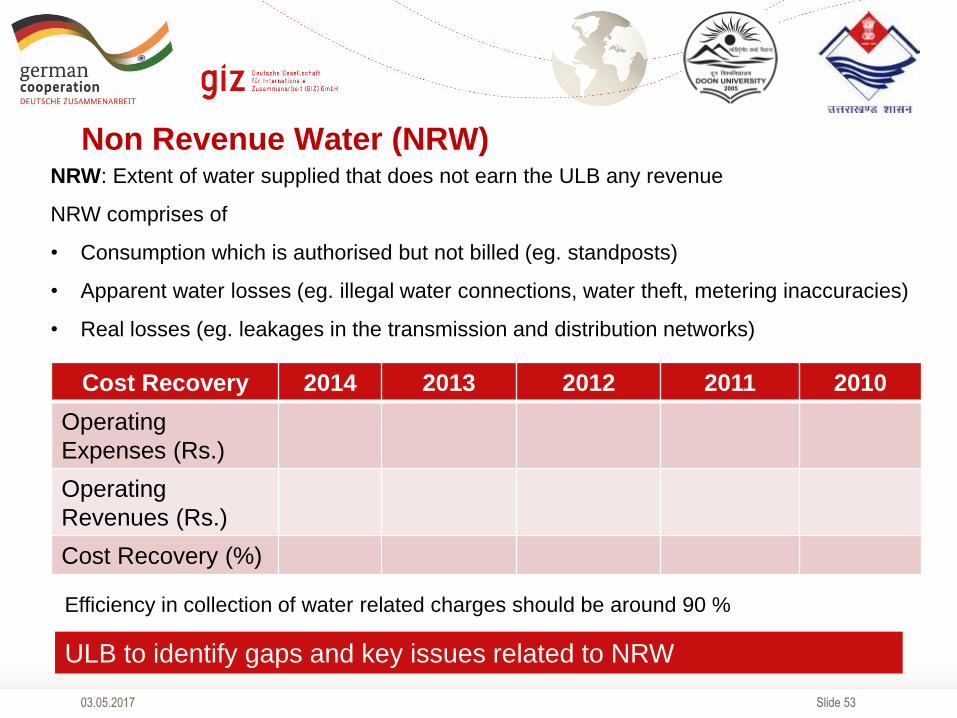
Non Revenue Water (NRW)NRW: Extent of water supplied that does not earn the ULB any revenue
NRW comprises of
• Consumption which is authorised but not billed (eg. standposts)
• Apparent water losses (eg. illegal water connections, water theft, metering inaccuracies)
• Real losses (eg. leakages in the transmission and distribution networks)
Cost Recovery 2014 2013 2012 2011 2010
Operating
Expenses (Rs.)
Operating
Revenues (Rs.)
Cost Recovery (%)
Efficiency in collection of water related charges should be around 90 %
ULB to identify gaps and key issues related to NRW
Slide 5403.05.2017
Indicative key issues
• Sub standard quality of water supplied in various parts of the City posing health
risks
• NRW levels are high and need urgent attention
• Water supply is beset with poor service delivery & poor cost recovery
• Service delivery in Water Supply within city falls significantly short of service level
norms

Slide 5503.05.2017
Identification of Gaps and Key Issues
Solid waste
Access to Toilets
Waste Water
Water supply
Storm water
Slide 5603.05.2017
Storm water – That’s what you need to
analyse
• Storm water drainage system
• Water logging / flooding
Slide 5703.05.2017
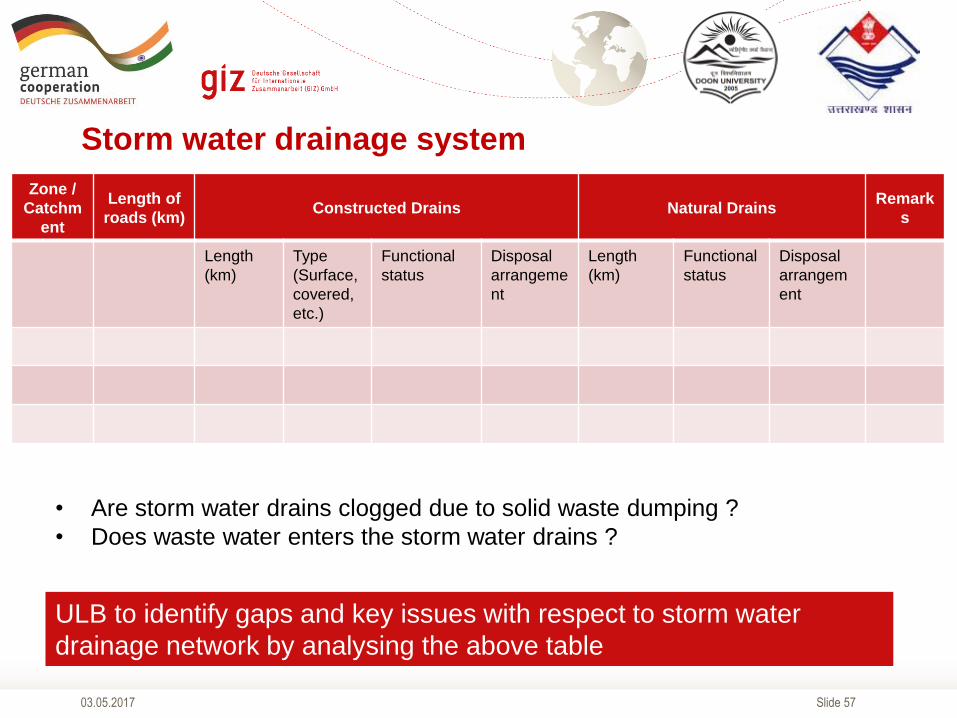
Storm water drainage system
ULB to identify gaps and key issues with respect to storm water
drainage network by analysing the above table
Zone /
Catchm
ent
Length of
roads (km)Constructed Drains Natural Drains
Remark
s
Length
(km)
Type
(Surface,
covered,
etc.)
Functional
status
Disposal
arrangeme
nt
Length
(km)
Functional
status
Disposal
arrangem
ent
• Are storm water drains clogged due to solid waste dumping ?
• Does waste water enters the storm water drains ?
Slide 5803.05.2017
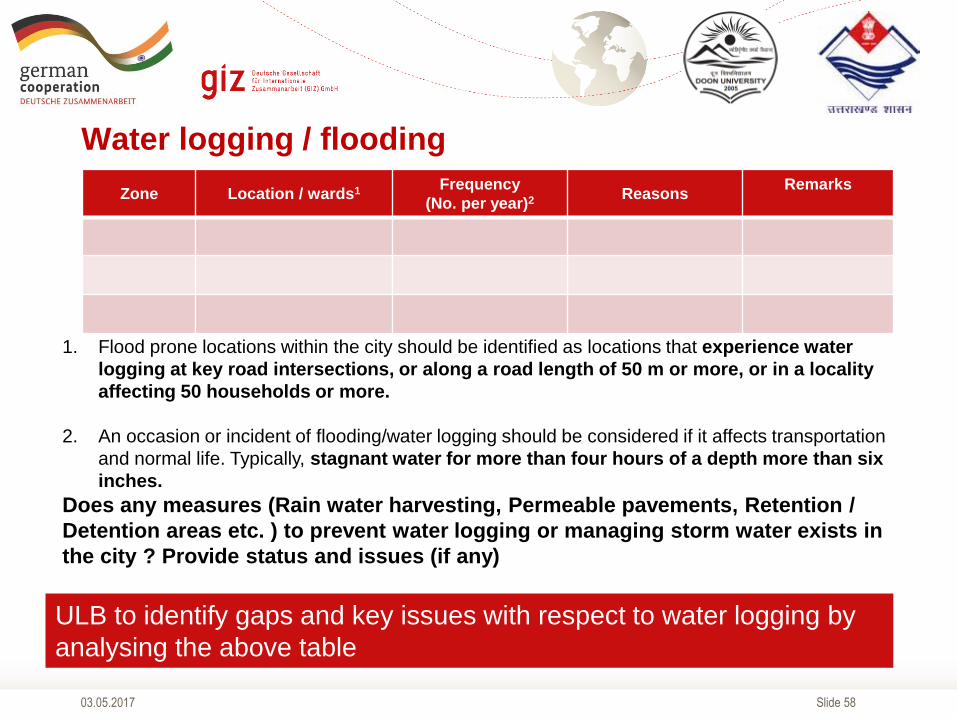
Water logging / flooding
ULB to identify gaps and key issues with respect to water logging by
analysing the above table
Zone Location / wards1 Frequency
(No. per year)2 ReasonsRemarks
1. Flood prone locations within the city should be identified as locations that experience water
logging at key road intersections, or along a road length of 50 m or more, or in a locality
affecting 50 households or more.
2. An occasion or incident of flooding/water logging should be considered if it affects transportation
and normal life. Typically, stagnant water for more than four hours of a depth more than six
inches.
Does any measures (Rain water harvesting, Permeable pavements, Retention /
Detention areas etc. ) to prevent water logging or managing storm water exists in
the city ? Provide status and issues (if any)
Slide 5903.05.2017
Indicative key issues
• Storm water drainage network faces severe abuse with ‘grey water flows’ and
‘solid waste dumping’
• Clogging of drains leads to vulnerable pollution hotspots
• Flooding of low lying areas due to poor storm water management in the city
• Poor maintenance and non-integration of the available storm water drainage
network renders it underutilized leading to a considerable number of water
logging areas and hence unhealthy conditions
Slide 6003.05.2017
As a federal enterprise, GIZ supports the German Government in achieving its objectives in the field of international cooperation for sustainable development.
Published byDeutsche Gesellschaft fürInternationale Zusammenarbeit (GIZ) GmbH
Registered offices, Bonn and Eschborn, Germany
“Support to National Urban Sanitation Policy Programme”
“2nd floor, B-5/2, Safdarjung Encalve , New Delhi – 110029”T 011 - 494945353F 011 - 49495391
I www.giz.de
Responsible
GIZ – SNUSP & Doon University
Author(s)
GIZ and Doon University
In cooperation with
Ministry of Urban Development, Government of India