Embed Size (px)
Citation preview

1
Data Mining in Pharmaceutical Marketing and Sales Analysis
Pavel Brusilovskiy, PhD
Merck

2
Contents
What is Data Mining? Data Mining vs. Statistics: what is the
difference? Why Data Mining is important tool in
pharmaceutical marketing research and sales analysis?
Case Study

3
What is the Data Mining?
“The magic phrase to put in every funding proposal you write to NSF, DARPA, NASA, etc”
“Data Mining is a process of torturing the data until they confess”
“The magic phrase you use to sell your….. - database software - statistical analysis software - parallel computing hardware - consulting services”

4
Data Mining Data Mining
is a cutting edge technology to analyze diverse, multidisciplinary and multidimensional complex data
is defined as the non-trivial iterative process of extracting implicit, previously unknown and potentially useful information from your data
Data mining could identify relationships in your multidimensional and heterogeneous data that cannot be identified in any other way
Successful application of state-of-the-art data mining technology to marketing, sales, and outcomes research problems (not to mention drug discovery) is indicative of analytic maturity and the success of a pharmaceutical company

5
Data Mining and Related Fields
VisualizationMachineLearning
Statistics Database
Data Mining
Is Data Mining extension of Statistics?

6
Statistics vs. Data Mining: Concepts
Feature Statistics Data Mining
Type of Problem Well structured Unstructured / Semi-structured
Inference Role Explicit inference plays great role in any analysis
No explicit inference
Objective of the Analysis and Data Collection
First – objective formulation, and then - data collection
Data rarely collected for objective of the analysis/modeling
Size of data set Data set is small and hopefully homogeneous
Data set is large and data set is heterogeneous
Paradigm/Approach Theory-based (deductive) Synergy of theory-based and heuristic-based approaches (inductive)
Signal-to-Noise Ratio STNR > 3 0 < STNR <= 3
Type of Analysis Confirmative Explorative
Number of variables Small Large
7
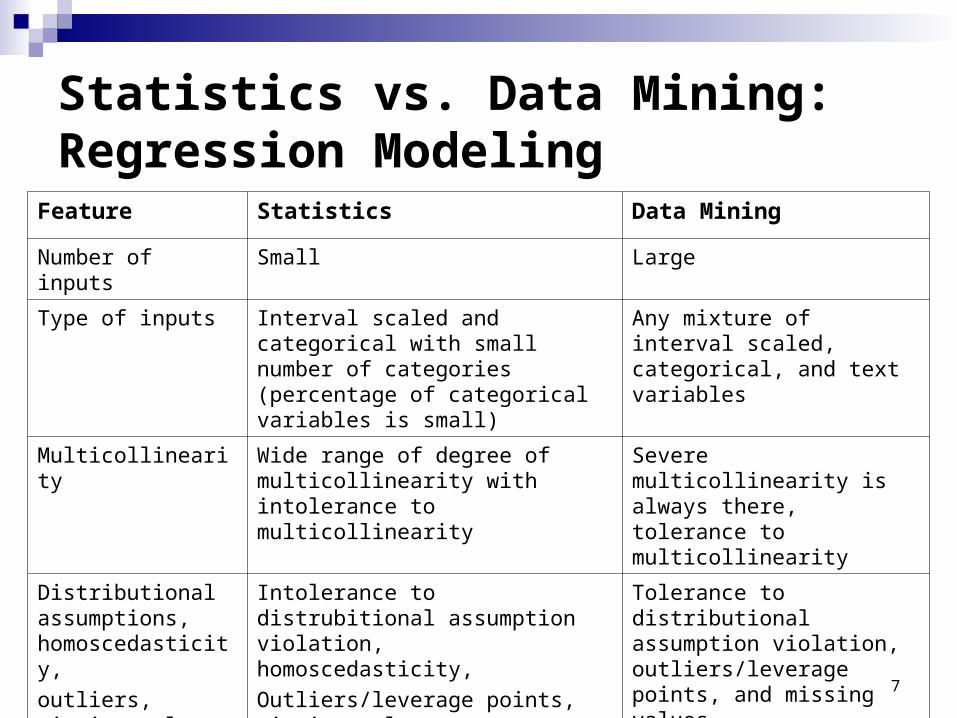
Statistics vs. Data Mining: Regression Modeling
Feature Statistics Data Mining
Number of inputs Small Large
Type of inputs Interval scaled and categorical with small number of categories (percentage of categorical variables is small)
Any mixture of interval scaled, categorical, and text variables
Multicollinearity Wide range of degree of multicollinearity with intolerance to multicollinearity
Severe multicollinearity is always there, tolerance to multicollinearity
Distributional assumptions, homoscedasticity,
outliers, missing values
Intolerance to distrubitional assumption violation, homoscedasticity,
Outliers/leverage points, missing values
Tolerance to distributional assumption violation, outliers/leverage points, and missing values
Type of model Linear / Non-linear / Parametric / Non-Parametric in low dimensional X-space (intolerance to uncharacterizable non-linearities)
Non-linear and non-parametric in high dimensional X-space with tolerance to uncharacterizable non-linearities

8
What is an unstructured problem?Well-structured Business Problem Unstructured Business
Problem
Definition
Can be described with a high degree of completeness
Cannot be described with a high degree of completeness
Can be solved with a high degree of certainty
Cannot be resolved with a high degree of certainty
Experts usually agree on the best method and best solution
Experts often disagree about the best method and best solution
Can be easily and uniquely translated into quantitative counterpart
Cannot be easily and uniquely translated into quantitative counterpart
Goal Find the best solution Find reasonable solution
Complexity
Ranges from very simple to complex Ranges from complex to very complex
Example Project: Sample size calculationKey business question: what is the physician sample size (PCP vs. OBGYN) to detect five script difference of Product A. sales? How to translate this business question into quantitative counterpart?No data No variables
Project: Customer Feedback StudyKey business question: Is there any relationship between customer perception and performance?How to translate this business question into quantitative counterpart?Data: 800 observations/interactions and 400 variables/attributesVariables are differently scaled

9
What are differences between Data Mining and Statistics?
Statistical analysis is designed to deal with well structured problems: Results are software and researcher independent Inference reflects statistical hypothesis testing
Data mining is designed to deal with unstructured problems Results are software and researcher dependent Inference reflects computational properties of data
mining algorithm at hand

10
Is Data Mining extension of Statistics? Data Mining and Statistics: mutual fertilization with
convergence
Statistical Data Mining (Graduate course, George Mason University)
Statistical Data Mining and Knowledge Discovery (Hardcover) by Hamparsum Bozdogan (Editor) An overview of Bayesian and frequentist issues that arise in
multivariate statistical modeling involving data mining
Data Mining with Stepwise Regression (Dean Foster, Wharton School) use interactions to capture non-linearities use Bonferroni adjustment to pick variables to include use the sandwich estimator to get robust standard errors

11
When data mining technology is appropriate? Data mining technology is appropriate if:
The business problem is unstructured Accurate prediction is more important than the explanation The data include the mixture of interval, nominal, ordinal, count, and text
variables, and the role and the number of non-numeric variables are essential
Among those variables there are a lot of irrelevant and redundant attributes
The relationship among variables could be non-linear with uncharacterizable nonlinearities
The data are highly heterogeneous with a large percentage of outliers, leverage points, and missing values
The sample size is relatively large
Important marketing, sales, and outcomes research studies have the majority of these features
12
Accurate prediction is more important than the explanation

13
Case Study: Effectiveness Evaluation of Vaccine Sales Force New lunched vaccine (10 months in
marketplace) Sales force structure: two sales team
Team_1 Team_2
Some locations are visited only by Team_1 (1-up promotion), others – by both teams (2-up promotion)
Promotion is on doctors/HCP level, but sales is on location level
Business question: What is the effectiveness of 2-up promotion?

14
Dependent Variables and Study Design Dependent variables (criteria to judge):
Total dosage purchased (shipped or ordered?) Total dosage purchased per promotion dollar Probability of making a purchase Time to the first purchase Frequency of purchase, etc.
Study Design: Test (2-up promotion locations) – Control (1-up promotion locations)
Consider Vaccine sales as two criteria problem: Estimate outcome for Test and Control groups, taking into account
difference in sales difference in promotion cost
Use pre-period data to match Test and Control groups and post-period data to compare sales and promotion cost

15
Independent Variables 47 input variables
Demographics of a location Geography, specialty, potentials, potential decile, average age,
reimbursement, believes, etc.
Promotion activities Number of direct interactions with HCP by Team_1 Number of direct interactions with HCP by Team_2
Percentage of direct interaction with decision maker by Team_1 Percentage of direct interaction with decision maker by Team_2
Number of phone interactions with HCP by Team_1 Number of phone interactions with HCP by Team_2, etc.

16
Variables Distribution
Private Dosage Potential
Public dosage Potential
Number of Sales Calls
Vaccine Dosage Sales

17
Methodology Form Test - Control groups, using only pre-period data
and propensity score methodology with greedy one-to-one matching technique on propensity score
Develop models for the post-period data for total vaccine sales, controlling for “location demographics” variables promotion variables in pre-period sales in pre-period
Estimate the difference in sales for Test and Control groups, taking into account promotion cost

18
Propensity Score Propensity score
is the predicted probability of receiving the treatment (probability of belonging to a test group)
is a function of several differently scaled covariates
Propensity_Score = f (location demographics variables,promotion variables, sales variables),
0 < f < 1
where f is a non-parametric non-linear multivariate function A sample matched on propensity score will be similar
across all covariates used to calculate propensity score

19
Propensity score with SAS EM
Neural Net was the bestmodeling paradigm

20
Finding and Business Implication
There is no algorithmically significant difference in sales between Test and Control groups, but promotion cost for Control group is two times lower than for Test group. In other words, 2-up structure does not produce desired/expected outcome for Vaccine performance
Team / Group
Mean of Sales Call
Test 5.29
Control 2.76

21
Phone call / Sales call response curve for Vaccine sales, constructed by TreeNet
Number ofPurchases
Number ofPurchases
Number of Purchases has a strong diminishing returns effect when the number of sale calls becomes greater than thirty five and the number of Phone calls becomes greater than 2
Number of Phone calls Number of Sales calls

22
Phone call and Sales call response surface for Vaccine sales, , constructed by TreeNet
Sales call is the most effective whena location gets two Phone calls
Number of Purchase has a strong diminishing returns effect when thenumber of Sales calls becomes greaterthan thirty five and the number of Phone calls becomes greater than 2
Num
ber o
f
Phon
e ca
lls
Number of Sales
calls

23
Reference
David J. Hand, Data Mining: Statistics and More? The American Statistician, May 1998, Vol. 52 No. 2http://www.amstat.org/publications/tas/hand.pdf
Friedman, J.H. 1997. Data Mining and Statistics. What’s connection? Proceedings of the 29th Symposium on the Interface: Computing Science and Statistics, May 1997, Houston, Texas
Padhraic Smyth (2000), An Introduction to Data Mining, Elumetric.com Inc
Doug Wielenga (2007), Identifying and Overcoming Common Data Mining Mistakes, SAS Global Forum Paper 073-2007