Embed Size (px)
Citation preview
Session 4 – Using Data (part 2)
www.yhtphn.co.uk/win

• Developing a Community/ Population Profile
• Estimating the burden of disease• Presenting data• Websites and other sources of
information
www.yhtphn.co.uk/win
Outline

• In groups of 3-4 write a list of all the things you might need for a community/ population profile
• You will need to decide your population- eg Woodhouse, Leeds, YH, England
• What types of data are you interested in?
www.yhtphn.co.uk/win
Developing a Population/ Community Profile

• A population is every member of a group of interest or geography
• Your population might include: o Population demographics – who’s whoo Area demographics – infrastructure, deprivationo Health Status – mortality, morbidity, lifestyleso Services – use of hospitals, primary care, non NHSo People – lifestyles, risk factors, views and experienceso Other – education, housing, income
www.yhtphn.co.uk/win
Population Profile

• You want to know what is happening in Leeds in terms of coronary heart disease
• Split into same groups• Discuss what types of info you would
need
www.yhtphn.co.uk/win
Estimating the Burden of Disease

• Define population at risk and their characteristics (as before)
• What are risk factors- smoking, obesity, diabetes, genetic, hypertension etc
• Define events specifically relating to disease in question – incidence and prevalence, time/ place/ person using various data sources
• Use of services
www.yhtphn.co.uk/win
Heart Disease in Leeds

THE BURDEN OF CHD• 3.1 Introduction• 3.2 CHD Mortality• 3.3 CHD Morbidity• 3.4 Case Mix• 3.5 Risk Factors
- 3.5.1 Smoking - 3.5.2 Poor Diet, Physical Activity and Obesity
3.5.2.1 Diet 3.5.2.2 Physical Activity
3.5.2.3 Obesity - 3.5.3 High Risk Groups
www.yhtphn.co.uk/win
Salford PCT CHD Strategy

• Percentages• Rates• Mean (average)• Median• Mode• Standard Deviation• Confidence Intervals• Time trends
www.yhtphn.co.uk/win
Presenting Data
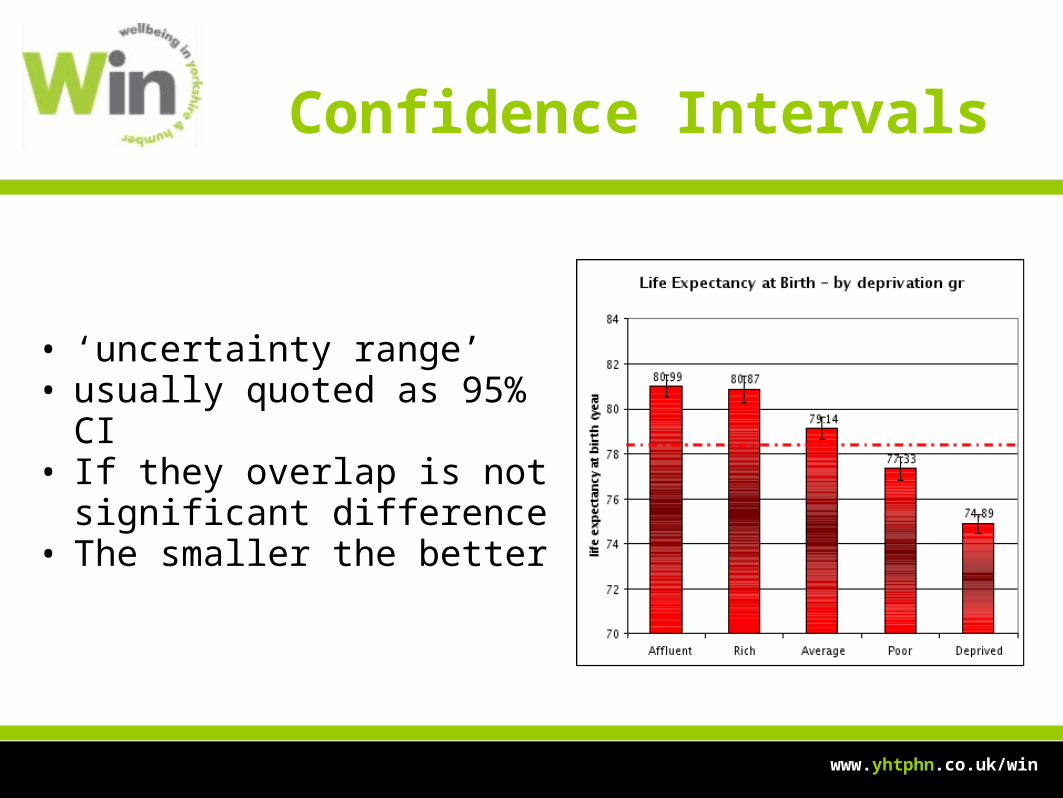
• ‘uncertainty range’ • usually quoted as 95% CI• If they overlap is not
significant difference• The smaller the better
www.yhtphn.co.uk/win
Confidence Intervals
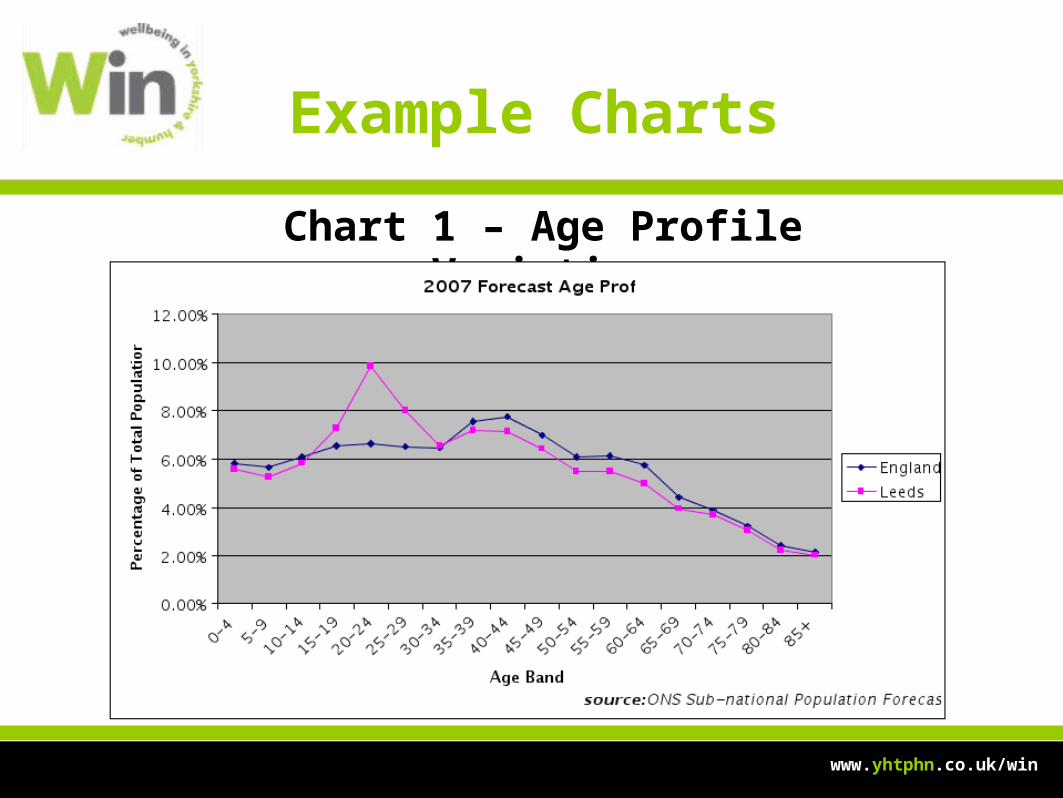
Chart 1 – Age Profile Variation
www.yhtphn.co.uk/win
Example Charts

Chart 2 – Bar Chart Comparison
www.yhtphn.co.uk/win

Chart 3 - Trend line
www.yhtphn.co.uk/win

Chart 4 – Male / Female Comparison of Respiratory
Disease Mortality
www.yhtphn.co.uk/win

Chart 5: GIS maps
www.yhtphn.co.uk/win

Chart 6: GIS maps
www.yhtphn.co.uk/win

• Define your question and what data you need• Try and find it yourself
- See handout X - Look at PHRC website:
http://www.leeds.nhs.uk/phrc/information/?pagepath=Information/Statistics
- Ask your organisation’s information officer
www.yhtphn.co.uk/win
Getting more help
• The skills to be able to understand how to access data and information that will support them in their role.
• A broader understanding of the importance of measuring patterns of disease and health.
• Understand the broad principals of critical appraisal• Review a range of annual reports• Know who to approach in their area for advice and
support
www.yhtphn.co.uk/win
Understanding Data: learning Outcomes