Embed Size (px)
Citation preview

Dag Øystein Hjermann
Spatial ecology of the bush-cricket Decticus verrucivorus: Movement, metapopulation dynamics and genetic variation in patchy and linear habitats
Dr. scient. thesis
Division of Zoology, Department of Biology,
Faculty of Mathematics and Natural Sciences
University of Oslo, 2000

List of papersPaper I: Hjermann, D. Ø. Do bush-crickets avoid the habitat edge? Microhabitat selection
in the wart-biter (Decticus verrucivorus). Manuscript.
Paper II: Hjermann, D. Ø. 2000. Analyzing habitat selection in animals without well-
defined home ranges. Ecology 81: 1462-1468.
Paper III: Hjermann, D. Ø. The condition of individual bush-crickets influence their spatial
distribution. Manuscript.
Paper IV: Hjermann, D. Ø. Why does emigration increase with decreasing patch size? An
experimental test of the boundary encounter rate hypothesis. Manuscript.
Paper V: Hjermann, D. Ø. and Ims, R. A. 1996. Landscape ecology of the wart-biter
Decticus verrucivorus in a patchy landscape. Journal of Animal Ecology 65: 768-
780.
Paper VI: Hjermann, D. Ø., Ims R. A. and Bondrup-Nielsen, S. Patterns and processes
underlying population genetic structure in anthropogenic linear habitats: Four
hypothetical scenarios and one case study. Manuscript.
Paper V is reprinted by courtesy of Blackwell Scientific Publications

Contents
Overview and synthesis
Preface 1
Scope of the thesis 3
Scaling of processes and patterns in ecology and metapopulation ecology 5
Study species and study areas 6
The wart-biter 6
Meadows - the wart-biter's natural habitat in Norway 8
The study areas 9
Movement behaviour - a "missing link" in metapopulation ecology 11
Use of area depending on habitat size 12
Use of area depending on habitat shape 15
Deciding to emigrate 16
Statistical problems in the analysis of movement behaviour 18
Interpreting occupancy patterns 19
The wart-biters in the Frogn study area 19
Metapopulation models - the good, the bad and the ugly 21
Estimating dispersal parameters from patch occupancy patterns 24
Interpreting genetic variation: invasion of new landscape elements 25
References 27
Individual papers

Overview and synthesis
Preface
When it was time to plan my Master thesis in 1991, I found out that this Ims guy
seemed quite all right to me. I mustered enough courage to knock on his office door to ask if
he was willing to supervise me. He took the time to talk with me there and then (I found out
later that he always does). I only knew he worked with small mammals, so I was a bit
surprised when he asked if I wanted to work with wart-biters. - Wart-biters? I replied. He
explained that it was a quite large bush-cricket. – Well, I knew that, I replied. (I didn't.) I
went out of his office with a supervisor and a theme for my Master thesis. I had no idea
(fortunately!) that I would be defending a thesis on the wart-biter nine years later.
First, Rolf deserves a big THANK YOU. Rolf is the supervisor everybody should
have. On the professional level, he has original research ideas, plenty of knowledge of
natural history as well as ecological theory, and a lot of statistical expertise. On the personal
level, he has been a pleasure to have as a supervisor. He has never had too little time to talk
when I've knocked on his door; he has always given enthusiastic response on my own ideas;
he even did quite much of the "farming" work for the Evenstad papers (III and IV). Rolf is
simply a very nice and unselfish person that is almost unable to tell people "no". (He spends
at least half of the year in the field instead.)
I would also like to thank Søren. The reader should know that he and Rolf did far
more field work than myself for Paper VI, and crawling along the road verges of highway
with heavy traffic isn't that pleasant. Søren and Halvor Knutsen also spent much time in the
allozyme lab for this paper, and I thank them for being my patient lab teachers. Nigel
Yoccoz has learnt me a lot about statistics - and wart-biters - and he collected the French
sample in paper VI.
Then there is a bunch of other people to thank. First, my mother and father learned
me to appreciate nature, both the mountains around Lærdal and the sea in Vestfold. Being
the youngest in a big family, my brothers and sisters are also greatly responsible for my
interest in nature and nature’s mysteries - especially Rudi, who dragged me up in the
mountains from the time I was old enough to walk. (He even was in the local bird-watcher’s
society, although I have a vague idea that this society also had a strong interest for “birds”
with two legs and mammae). The time as an undergraduate student of biology was a fantastic
time with discussions, private and organized field excursions, and countless parties. For me,
this time was proof that common introductory biology courses for both ecologists and
1

Overview and synthesis
molecular biologists (such as “Bio101”) is a necessary part of the biology education, both
socially and scientifically. I can’t avoid mentioning my “mates” Jostein and John, but I don’t
have enough space to mention the rest – you know who you are! During field work, I have
enjoyed working and living together with a lot of nice people including Live, Inger, Anne,
Wendy, Naomi, Harry and Gry. During the last years, when most old student friends had
dispersed into computer and teacher jobs, fellow entomologists Steve and Guldborg formed
much of of my social life at work. I also spent many enjoyable hours together with Jonathan
working (not always so intensely) with his reindeer data; thanks for the cooperation! A
considerable amount of time was spent in e-mail discussions with Yngve, Trygve, Trond-
Inge, Thomas and the rest of the members of the intellectual forum "Søplegjengen", an
activity which undoubtedly has enhanced my linguistic and rhetoric capabilities.
Finally, I whole-heartedly thank Nils Christian Stenseth for supporting me during
all these years, including giving me small jobs during one year of unemployment (after my
Master) and, not least, offering me to work on his marine ecology group as a post doc. I also
thank Jogeir Stokland who gave me the opportunity to work at NIJOS, which has been an
interesting and rewarding experience and a valuable insight into “the world outside Blindern”.
I also thank the Norwegian Research Council for supplying a million kroner or so for my
doctorate and the Nansen Foundation for financial support for Paper VI.
Finally, I am deeply thankful to my wife Irene. When we started on our dr. theses
just a few months apart, I was a bit worried about how we would handle the stress of writing
dissertations simultanously. Now, we have produced not only two (almost) finished theses,
but also our beautiful daughter Inga. Because of you and your unique way of keeping our
relationship strong, it has actually been four very nice years. I thank you for sharing your life
with me.
Oslo, November 2000
Dag Ø. Hjermann
2

Overview and synthesis
Overview and synthesis
Scope of the thesisThis thesis deals with spatial ecology, using a bush-cricket, the wart-biter Decticus
verrucivorus, as a study species. The papers do not tell a comprehensive "story" but are
somewhat loosely knitted together around some key words. First, spatial variation is the
lowest common denominator of all the papers. This thesis covers spatial variation on scales
varying by five orders of magnitude, from movement behavior on a 5-10 meter scale to
genetic variation on 50 km-scale (the papers are arranged according to spatial scale; Tab. 1).
Movement behaviour is the focus of four papers (I- IV) and a fundamental part in the
underlying processes of the last two. Finally, since the wart-biter is patchily distributed,
metapopulation theory (Hanski & Gilpin 1997) is the ground foundation for much of my
thinking and the conceptual framework for papers IV and V. The core of this theory is a
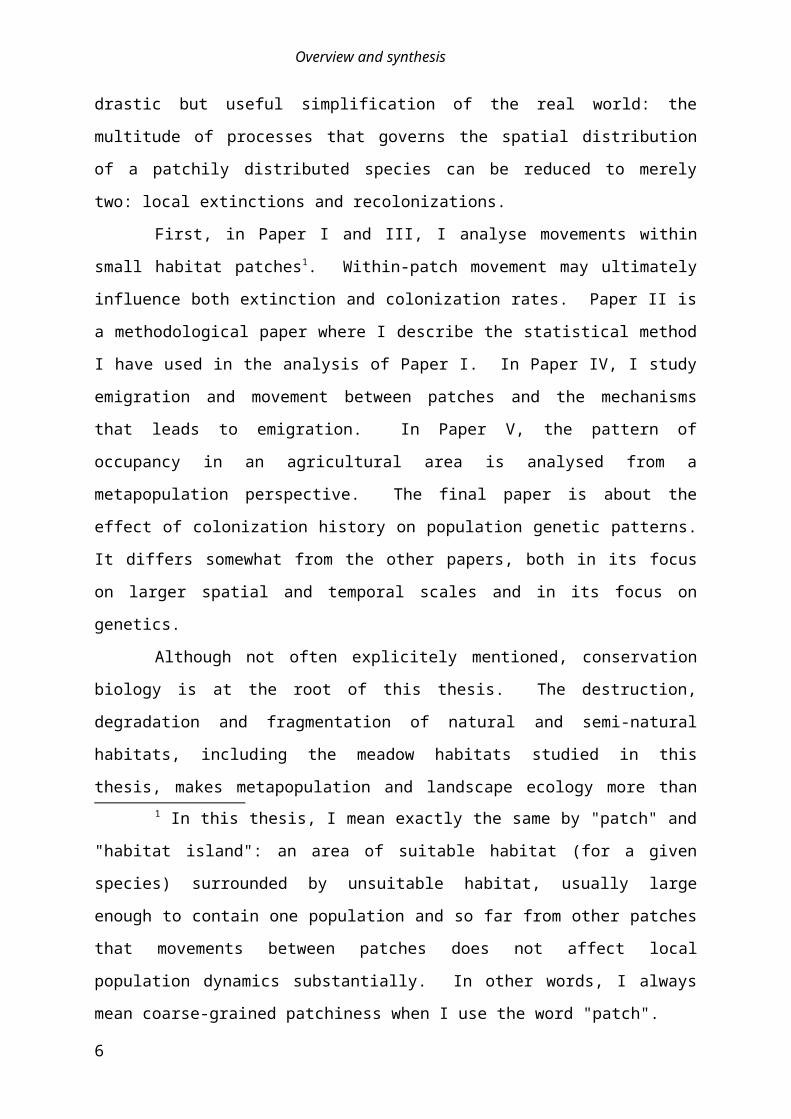
drastic but useful simplification of the real world: the multitude of processes that governs the
spatial distribution of a patchily distributed species can be reduced to merely two: local
extinctions and recolonizations.
First, in Paper I and III, I analyse movements within small habitat patches1. Within-
patch movement may ultimately influence both extinction and colonization rates. Paper II is
1 In this thesis, I mean exactly the same by "patch" and "habitat island": an area of
suitable habitat (for a given species) surrounded by unsuitable habitat, usually large enough to
contain one population and so far from other patches that movements between patches does
not affect local population dynamics substantially. In other words, I always mean coarse-3
Table 1. Short overview of the papers in this thesis.
Scale of process
Paper Process / pattern Spatial Temporal
I Movement within natural habitat patches < 15 m 1-2 h - 3 weeks
II Movement within patches Statistical methodology
III Movement within experimental patches < 15 m 1-2 h - 3 weeks
IV Movement between experimental patches 15 - 300 m 1-2 h - 3 weeks
V Occupancy, extinction and immigration of patches 50 - 6000 m 1-3 years
VI Invasion and genetic variation of linear habitats 0.2 - 55 km 5-20 years

Overview and synthesis
a methodological paper where I describe the statistical method I have used in the analysis of
Paper I. In Paper IV, I study emigration and movement between patches and the mechanisms
that leads to emigration. In Paper V, the pattern of occupancy in an agricultural area is
analysed from a metapopulation perspective. The final paper is about the effect of
colonization history on population genetic patterns. It differs somewhat from the other
papers, both in its focus on larger spatial and temporal scales and in its focus on genetics.
Although not often explicitely mentioned, conservation biology is at the root of this
thesis. The destruction, degradation and fragmentation of natural and semi-natural habitats,
including the meadow habitats studied in this thesis, makes metapopulation and landscape
ecology more than just academic disciplines. Many species are forced to try to survive in
habitat patches that are very small and isolated from each other compared to the landscape in
which they evolved. Theory often suggests that when habitat destruction goes beyond a
critical threshold, the landscape becomes unsuitable for an accelerating number of species
(e.g., Andrén 1994, 1999; Bascompte and Sole 1996). As there may be a considerable time
lag from a species is doomed to extinction (because of habitat destruction) and the extinction
itself (the "extinction debt"; Tilman et al. 1994; Pimm et al. 1995; Loehle and Li 1996;
Cowlishaw 1999), we do not know how many species that "are waiting for their turn" at
present. Metapopulation and landscape ecology may help discovering and understanding the
threats to biodiversity before it is too late.
grained patchiness when I use the word "patch".
4

Overview and synthesis
Scaling of processes and patterns in
ecology and metapopulation ecologyIn metapopulation biology, processes are typically divided in two types based on
scale: processes within each population, and processes between populations (Tab. 2).
However, one should not forget that this is a simplification. First, the definition of
population is, to some extent, arbitrary, and must be defined on basis of the spatial scale of
some process (Addicott et al. 1987). E.g., we can define a population as the spatial area
within which 95 % of matings occur between animals that both were born inside that area.
However, a definition of the population that is suitable for population genetics is not
necessarily suitable for population dynamics and vice versa. Moreover, the scale of each
process vary between years and between different landscapes (e.g., depending on the degree
of fragmentation). Thus, the framework of Tab. 2 can be extremely difficult to apply in
practice.5
Table 2. Processes and patterns in a metapopulation perspective.
Hierarchal level Processes Patterns
Populations (most individuals interact with other individuals in the same population)
Birth/death of individuals (depends on intra- and interspecific competiton, predation etc.)
Immigration
Local movement (including emigration)
Local population size
Distribution of individuals within patch
Metapopulations (most individuals mate within populations; interactions between populations not large enough to influence local dymanics)
Local extinctions (stochastic or deterministic)
Recolonization of empty patches
Distribution of absence/presence on habitat islands (depends on area, isolation and patch quality)
Collections of metapopulations(practically all individuals mate within metapopulations; interactions between metapopulations not large enough to influence metapopulation dynamics)
Invasions due to spread
Invasions/exclusions due to altered large-scale conditions (e.g. climate change)
Exclusions due to stochastic global extinction of metapopulations
Distribution pattern, differences in density among regions
Geographic patterns of genotype frequencies

Overview and synthesis
In some cases, however, populations are quite easy to identify and it is easy to
classify processes as within-patch and between-patch. A typical example is animals that live
in discrete, well-defined patches with room for one population and sufficiently remote from
each other (compared to the species' dispersal capacities) that we can assume the populations
to behave independently of each other. When metapopulation theory and other theories
including space emerged, ecologists naturally looked for such systems to test the predictions
of the theory. Wiens (1995) has pointed out that before space was built into ecological
theory, ecologists tended to seek homogenous study areas to test theories of population
dynamics, predator-prey systems, competition and so on. To a large degree, the same thing
has happened in the flourishing growth of empirical metapopulation studies in the 1990s, only
that the "ideal" of the completely homogenous study area was replaced by another "ideal",
collections of quite small, sharply defined, homogenous areas. The wart-biter systems I have
studied in Papers I-V are good examples of such systems, either naturally occuring (as in
Paper I and V) or artificial (as in Paper III and IV). There is nothing wrong with seeking
relatively simple systems where it is practically possible to test certain theories. However, it
should be kept in mind that many, or most, species live in patches that vary continuously in
quality, i.e., source-sink systems (Pulliam 1988). Thomas & Kunin (1999) have proposed a
framework that is able to incorporate source-sink-dynamics in metapopulation structures. To
complicated matters even further, patches need not be stable in time (e.g., Stelter 1997),
patches need not have well-defined edges, and patch quality can vary a lot in time, so that
former sources can become sinks and vice versa (Boughton 1999).
Study species and study areas
The wart-biter
The wart-biter (Decticus verrucivorus (Linneaeus)) is one of the largest large bush-
crickets (Ortoptera: Tettigoniidae) of Northern Europe (body length: 24-38 mm for females,
26-44 mm for males; Harz 1960). It is a continental species that prefer hot summers; it is
widespread in large parts of Eurasia, including most of Central and Southern Europe and
parts of Iran, Pakistan and China (Samways and Harz 1982). In England, there are only a
few populations in the extreme south. In Norway, it is found along the coast from the
Swedish border to Rogaland and in some parts of the lowlands of eastern Norway (such as
southern Telemark and southern Østerdal).
6
Overview and synthesis
The wart-biter is winged, but unprovoked flight is extremely uncommon; Ander
(1947) reported to have seen wart-biters flying longer distances (at least 20-30 m) twice
during a period of 17 years. It sometimes alights when disturbed, but then usually flies only
2-3 meters, infrequently up to 20 m in windy weather (personal observation). Some
individuals also use the wings to enhance jumping when it travels through non-habitat with
little or no vegetation (personal observation). It lives on the ground in open habitats with
quite low vegetation; I will discuss its habitat requirements in depth below.
It is possible to rear wart-biters on purely plant food (Ragge 1965), but in nature
they are partly carnivorous; adults eat 25-70 % animal food such as acridid grasshoppers and
other insects (Nagy 1950, Harz 1960, Bellman 1985, Cherrill 1989, Thorens and Nadig
1997). Because adults in some habitats need to hide in tussocks to avoid predators, this may
decrease their opportunities to hunt (Cherrill 1989).
The wart-biter hatches in April/May and goes through seven instars (Ingrisch 1978a;
Holst 1986). In Norway, the first adults appear in late June to late July, depending on
weather conditions in spring and early summer. Probably because of the competition for
virgin females, males become adult a couple of weeks before the females (Wedell 1992).
Adult males stridulate (sing) to attract females, often climbing up on high vegetation to make
the sound reach further. It needs a body temperature of 23-25 C to sing (Nielsen 1938), i.e.,
almost only in sunshine in Norway, and they sing mainly in the morning (9-12 a.m.) and to a
lesser degree in the afternoon (around 3 p.m.). Females can approach singing males and vice
versa, and each sex may turn down sexual invitations from individuals of the other sex, at
least for the moment. However, it is more common thaT females tun down males than vice
versa (personal observation). During mating, the male transfer a spermatophore which is
attached externally to the female's genitalia. The spermatophore is quite large (9-10 % of the
males' weight), it consists of an large sperm-free spermatophylax that the female eats after
mating, and an ampulla with sperm that she eats after the spermatophylax (Wedell & Arak
1989). It has been suggested that the spermatophylax is a parental investment in bush-
crickets, but in the wart-biter, it has low protein concentration (4.2 %), and does not increase
female fecundity (Wedell & Arak 1988). Rather, it appears to be a mating investment evolved
by sperm competion with other males. If the spermatophylax is large, more sperm is released
from the sperm ampulla because it takes longer time before it is eaten (Wedell 1991).
The abundance of wart-biters has declined in Northern Europe the last decades
(Ingrisch 1979; Holst 1986; Bengt Ehnström, personal communication). The reason for this
7

Overview and synthesis
is changes in landscapes and agricultural practices that makes unfertilized meadows and
grasslands less common (see next chapter). The wart-biter is regarded as one of England's
most acutely threatened insect species, and there is considerable effort to save it from
extinction, including a captive breeding and reintroduction program (Cunningham et al.
1997).
Meadows - the wartbiter's natural habitat in Norway
The wart-biter lives on the ground in open habitats with quite low vegetation. The
vegetation must not be too tall (at most 30-40 cm in my own experience). In Norway,
various types of unfertilized meadows and grassland are suitable habitats (personal
observation). The nitrophilous vegetation in fertilized meadows is too dense and tall for the
species. However, it is also absent from meadows that are cut very short (Weidemann et al.
1990) or intensively grazed by, e.g., horses (personal observation). South-facing or flat
habitats are preferred (Oschmann 1973; Ingrisch 1979; Cherril and Brown 1990a; Paper V).
Probably, the reason for these habitat requirements is the wart-biter's temperature
requirements. The species have extremely high optimum temperatures: instar development
and survival is optimal at around 35 C, and not possible below 20 C, while the temperature
optimum for adults is 36-40 C (Ingrisch 1978a,b). They lay their eggs in the ground in
places with little or no vegetation where the soil heats up quickly in spring (dry, fine-grained
substrate is preferred). Instars and adults spend much time basking in the sun to increase
body temperature, positioned so that the side of the body is perpendicular to the sun's
direction (personal observation).
In Norway, the wart-biter appears to be a follower of agriculture, which has a 5000
year history in our country. Its primary habitat type in Scandinavia, unfertilized meadows,
has been in decline for many years. The meadows are fertilised and cultivated to increase
8
Table 3. For some groups, the proportion of species on the Norwegian Red List that have the cultural landscape and meadows, respectively, as their main habitat. “Meadows” include "natural" unfertilized meadows for grazing or harvesting, and dry meadows. The cultural landscape is a wider term that in addition to meadows includes trees in the agricultural landscape, fields, stone walls, farmyards etc. The data are assembled from DN (1999a, 1999b).
Red-listed species Total in Norway
Taxon No. of species Cultural landscape% (no. of species)
MeadowsApprox. %
No. of species
Fungi 763 25 (189 ) 14 6000
Mosses and liverworts 216 25 (54) 20 1064
Vascular plants 255 37 (94) 32 1775
True bugs 82 38 (31) 38 445
Beetles 778 18 (141) 18 3430
Butterflies and moths 540 58 (312) 33 2111

Overview and synthesis
grass yields, encroached by bushes because of lack of grazing/cutting, and turned into forest,
corn fields and housing estates. In Sweden, the area of unfertilized meadows for grazing was
reduced by 85 % from 1850 to 1966, while the area of traditionally managed meadows for
cutting has been reduced by 99.9 % (Edelstam 1995). There have been a similar trend in
Norway. With the decline in unfertilized meadows, a significant part of the biological
diversity is also in decline. In Norway, 874 red-listed species (28.5 % of the Norwegian Red
List) are associated with the cultural landscape (DN 1999b). Many of those have meadows as
their primary habitat (Tab. 3). Also, around 70 species of birds are in decline because of
changes in the cultural landscape (DN 1994).
The study areas
We studied the natural distribution of wart-biters in two systems: in scattered
meadows in an agricultural area, i.e., the "traditional" wart-biter habitat, and in roadsides
along a major highway, which may be the most imortant habitat for this speciesin the future.
In addition, we used an experimental area where wart-biters originally were absent.
The first location for our work with the wart-biter was an agricultural landscape in
Frogn, ca. 40 km from Oslo in the direction of Gothenburg (Paper I, V; see map in Paper V).
This area (ca. 6 km2) is dominated by agricultural fields (with wheat, barley, rye, oats,
vegetables and strawberries) with quite large patches of spruce and oak forests. The area is
mostly confined by spruce forest. Most wart-biter habitats are small meadow patches in the
fields where the soil is too shallow to be plowed because of rocky outcrops. Many of these
meadows were grazed before. Grazing and harvesting fodder is non-existent in the area now
(except for some horsegrazing, which usually renders the vegetation extremely short). It is
not known whether the vegetation is stable, and if not, how rapidly bushes and trees
encroaches that patches; some of the farmers cut bushes and trees to avoid shadow on the
fields. Some roadsides as well as one patch of humid meadow are also suitable wart-biter
habitats.
This area can be said to examplify a landscape where the original wart-biter habitat
exists because of the geological properties of the area, i.e., the combination of fertile soil
(suitable for agriculture) and rocky outcrops. Rocky outcrops in forests are too isolated too
be suitable wart-biter habitat, and in lowland agricultural landscapes without rocky outcrops,
there are usually few potential wart-biter habitats because of modern agricultural practices.
In south-eastern Norway, unfertilized meadows that are managed by traditional farming are
most common at higher altitudes, where sheep and dairy farming is common. However, the 9

Overview and synthesis
climate tend to be too cold for the wart-biter in these areas. Thus, as a combination of
geological and economical factors, there are few wart-biter habitats left in meadows.
However, roadsides that are managed properly, i.e., cut a couple of times each
summer, have a type of vegetation that appears to be suitable wart-biter habitat. The wart-
biter also seems to require that the roadside width are above of a certain limit; I have never
observed populations in roadsides less than 1.5-2 m wide, and the probability of occupancy
seems to increase up to 3-4 m width. Such broad roadsides are common along major, modern
highways and sometimes along train lines. In Paper VI, we studied the wart-biter populations
that have established along a stretch of a major Norwegian highway, E18 between
Holmestrand and Larvik. This is an area with intensive agriculture and rapid urban
development. There are very few meadows suitable for wart-biters left in this area, and the
number is steadily decreasing. Large parts of the road has been built 5-20 years ago and cuts
through forests and large fields. The roadsides along this road currently seem to be the most
important wart-biter habitat in the area. The climatic conditions are similar as in the Frogn
area.
At last, we used an area at Evenstad field station in Østerdalen, around 150 km
north of Oslo (Paper III, IV). The vegetation was suitable meadow vegetation. Compared to
the two other locations, the mean temperature through the year is substantially colder, but the
climate is also more continental, and summers can be quite hot. Wart-biters were collected
from other places and released in the area at the start of the experiment.
Movement behaviour
- a "missing link" in metapopulation ecologyEl lobo es una cosa incognoscible. Lo que se tiene en la trampa
no es mas que dientes y forro. El lobo propio no se puede
conocer. Lobo o lo que sabe el lobo. Tan como preguntar lo que
saben las piedras. Los arboles. El mundo.
Cormac McCarthy: The Crossing 2
Behaviour is the key to dispersal rate between patches in two ways. (I here assume
we talk about species that have enough physical and "mental" control over their movements
to stay within the natal patch if they want to. This excludes for instance many aquatic species
2 The wolf is an unknowable thing. What one has in the trap is nothing but teeth
and fur. The wolf itself cannot be known. Wolf or what the wolf knows. It's like asking
what the stones know. The trees. The world.
10

Overview and synthesis
that follow the water movements as plankton in part of their life cycle.) First, some animals
decide to leave their "home" patch, i.e., they decide to emigrate. Which factors influences
how many animals that emigrate, which animals that decide to do it, and when they do it?
This is the subject of Paper IV. Second, after the animals have left the natal patch, they try to
locate another patch while moving through the matrix (which often is drawn as a big white
area in metapopulations maps, but seldom is so completely devoid of structure as such
drawings seem to indicate). Which factors influence the path they follow, and more
specifically: how much of the path trajectory results from innate movement patters (i.e. how
often and how much they change direction), and how much depends on sensory information
that they gather while moving? In this thesis, I have ignored this subject as much as possible,
although I could not avoid making some assumptions about this in Paper V. It is, however, a
question that is both extremely important, and in many cases extremely difficult to resolve
(more on this in the chapter about Metapopulation models.)
In much more indirect manner, movement behaviour also influences the probability
of local extinction, the other basic process of metapopulations. First, movement behaviour
may influence intraspecific competition, which in turn influences population size and thereby
the risk of extinction. Second, the emigration rate can be so high (relative to immigration
rate) that the risk of extinction is considerably increased. The first topic is related to the
themes of Paper I and III, the second in Paper IV.
Animals have presumably evolved movement behaviours that are optimal (within
the constraints set by movement speed, the amount of body resources not devoted to
reproduction, etc.). Animals can also be expected to make the best use of sensory
information, often through indirect cues. In this connection, "optimal" means "optimal for
the individual's fitness", or more precisely, the evolutionary stable strategy (ESS). In the case
of dispersal rate, the ESS strategy may often be very close to the dispersal rate that
maximizes metapopulation occupancy (Hamilton and May 1977; but also see Lemire and
Lessard 1997 for a different conclusion). I am not aware of similar theoretical studies of
within-patch movement of animals that seek to maximise fitness (which in males often means
to maximise the number of matings).
However, the wart-biter's landscape has changed a lot only through the last decades,
so it evolved in a landscape that was quite different from the current landscape. Movement
behaviour (and other types of behaviour) can turn from adaptive to maladaptive when the
landscape changes. This is relevant for within-patch movement, the decision of emigration,
11

Overview and synthesis
and the search strategy during movement between patches. E.g., if the species evolved in a
fragmented landscape that is less fragmented than the current landscape, it probably has a
"too high" dispersal rate, because its dispersal strategy is adjusted to the "old" level of
dispersal mortality, which probably was lower than the current one. In addition, the link
between an individual's sensory "input" (e.g., how often an individual encounters the habitat
edge) and its behavioural "output" (e.g., the choice between staying and emigrating) may be
“tuned” to be optimal in habitat patches looking quite differently than the patches in which
the animals live today. E.g., suppose that the mechanism for "setting" the migration rate at a
optimum level is that animals decides to disperse after encountering the edge a certain
number of times. When patch size decreases, the dispersal rate will increase markedly. Thus,
when the landscape is fragmented, the optimal dispersal rate decreases, while the actual
dispersal rate may increase, leading to a large gap between optimal and actual dispersal
strategies. Natural selection will reduce this gap, but the metapopulation may go extinct in
the process.
Use of area depending on habitat size
In classical metapopulation theory, the patch is usually treated as a point with zero
dimensions in space; i.e., all local processes are assumed to be non-spatial, and can be
essentially fully understood by "classical" population dynamics of closed populations with
some stochasticity thrown in (i.e., refs.). However, movement also plays a role within
patches. For a species that (in part) is regulated by intraspecific competition and lives in a
patch where resources are evenly distributed, any movement behaviour that leads to spatial
variation in density will result in "inefficient" space use, in the sense that the population size
at equilibrium is lower than it could be if the density did not vary in space. (For patches
where resources are not evenly distributed, the "optimal" space use is where the pattern of
species density corresponds to the pattern of in resource density.) E.g., if animals tend to
aggregate in clumps although there is no variation in resources, animals experience a higher
density than the real overall density, which leads to higher intraspecific competition thereby
lower population size. This may in turn influence the probability of local (and global)
extinction.
In the Frogn study area, the wart-biter occupies patches of a wide range of sizes,
from large meadows of 1000 m2 to two-meter-wide road verges. In paper I, I investigated
how wart-biters select habitat within the patch in two patches of different size (as well as in
one road verge; see the next chapter). The positions of individually marked insects were
12

Overview and synthesis
mapped with intervals of 30 minutes to two hours during a three-week period. The data were
analysed using two different methods that shed light on microhabitat selection on two
different scales: which microhabitats the adult animals choose for each "move" (i.e., between
two observations), and which microhabitats the adults use by large. The first question relates
to the adult animal's decisions during the three-week study period and must be analysed using
special methods (Paper II), while the latter question relates to the animals' decisions during all
life stages, including where the females decide to lay their eggs and where the instars decide
to move. On the latter scale, we found that the edge was avoided in both patches. The pattern
indicated a negative edge effect for distances up two meters, and was strikingly similar
between patches (Paper I, Fig. 3a). By analysing habitat selection for each move, the same
pattern prevailed in the large patch, while in the small patch it seemed that both the edge and
the interior were avoided (Paper I, Fig. 3b). The results showed a considerable degree of
aggregation in both patches, and that large parts of the patches were effectively empty
because of movement behaviour.
However, without replicates of patches of the same size, it is difficult to conclude
that differences in behaviour result from patch size alone. In addition, vegetation differences
between edge and interior are confounding factors. In the large patch, the pattern of edge
avoidance was quite consistent between habitat types, but this was not the case for the small
patch. As a complementary study to Paper I, I therefore set up an experiment with patches
created experimentally on Evenstad field station (Paper III and IV). Here, eight patches in
three different sizes were "carved" out by mowing a larger area, and animals caught
elsewhere were released in equal densities and tracked much the same way as in Paper I. The
animals were of two different "qualities": animals reared in the laboratory, and animals
caught as adults. Unexpectedly, animals of the latter group appeared to be in better
condition: they moved more, both within and between islands, males sang more often and
more loudly, and females' ranges overlapped with the most active males. In this experiment,
the overall use of the edge zone (here defined to be 1 m wide) corresponded to the area of the
edge, with one exception: Lab-reared (low-quality) animals (of both sexes) in medium-sized
patches (8 x 4 m) stayed more in the edges than expected.
Why did paper I and III yield so different results with regard to edge use? Since the
results of Paper I indicate that animals avoid the edge per se and not the type of vegetation
found in the edge, I suggest that positive phonotaxis (that singing males attract each other) is
a likely explanation that also agree well with other studies of wart-biter behaviour (Keuper et
13

Overview and synthesis
al. 1986, Weidemann et al. 1990). So why did not wart-biters avoid the edges in Paper III as
well? The answer is likely to be the difference in the range of patch sizes and shapes: the
smallest patch in Paper I was 390 m2, while the largest patch in Paper II was 80 m2. In
addition, the patches of Paper III were "semi-linear" (the large ones measured 16 x 5 m).
Weidemann et al. (1990) found that wart-biter males aggregate in clumps (a kind of "leks").
Because of the limited patch width and the relatively high density of wart-biters, the patches
in Paper III were probably just large (and wide) enough to make room for a wart-biter clump,
there simply was no room left outside the clumps. Weidemann et al. (1990) also found that
the distribution of males within clumps was significantly more regular than a random
distribution, indicating male-male interference, which also was reported by Keuper et al.
(1986) for this species. In Paper III, the inferior males probably avoided the interior because
they were deterred by males singing loud and frequently. The similar distribution of females
may similarly have been caused by female-female interferential competition for "sexy" males.
This hypothesis is more uncertain, since other authors have not reported this for the female
wart-biters; however, it is (weakly) supported by my own observations of outright kicking
fights between females. In the large patches, however, the inferior animals used the interior
as much as the edge, perhaps because there were more room between superior animals.
Papers I and III both have weaknesses in different ways. For Paper I, the lack of
replication (imposed by the time constraints of a single field worker) is a severe drawback.
The main drawback of Paper III is the small size (and semi-linear shape) of the patches; the
"large" patches of this study were smaller than the smallest non-linear occupied patches
observed in the Frogn landscape (around 100 m2; Paper V). Animal ranges did not increase
from the medium to the large patches in the experimental patches (Paper III, Fig. 6),
indicating that the movement of each individual, at least, was not constrained by patch size.
However, the addition of larger and less linear patches would have been preferable3.
Nevertheless, I find that the unexpected difference between inferior and superior animals to
be interesting, and to my knowledge the first Orthopteran example of spatial segregation
according to social status in what appears to be a lek-like system. Another striking feature of
both Paper I and III is the unexpected similarity between the sexes in many aspects of
3 Indeed, my original experiment included patch sizes up to 20x 20 m. I tried to
implement this experiment twice: first in a meadow owned by Oslo City, which ended up
being cut by a farmer, and then in a grassland at The Agricultural University at Ås, which
unfortunately had too dense vegetation for the wart-biters' taste.
14

Overview and synthesis
movement behaviour and microhabitat selection. One possible explanation for this could be
that because the males' contribute a spermatophore (see Study species) and mate relatively
infrequently, and we can expect more symmetrical mating behaviour than the common
pattern of "reluctant females, ardent males" (Krebs and Davies 1987:169). However, Nina
Wedell (e.g., Wedell & Arak 1989; Wedell 1991) has concluded that the spermatophore has a
mating function and no effect on fecundity. A simpler and perhaps more likely hypothesis is
that males simply adjust their movements to the spatial pattern of females.
Use of area depending on habitat shape
Linear habitats are a striking feature of landscapes modified by man, and for many
species, linear habitats become increasingly important for the preservation of species in the
landscape (Paper VI and references therein). Quite few studies, however, have compared
linear and non-linear habitats (in contrast with the attention devoted to linear landscape
elements as movement corridors). For the wart-biter in Norway, roadsides and similar
habitats (e.g., verges along train tracks, grassy areas around highway intersections) seem to be
making up an increasing part of the wart-biter habitat. The strong increase in this type of
areas does not outweigh the loss of "traditional" farmland habitats, but it certainly decreases
the negative impact landscape change and the probability of regional extinction of the
species.
A wide-held belief in landscape ecology is that long narrow habitats are inferior
relative to non-linear patches of same size, amongst other things because of edge effects; this
has also been confirmed by some studies (e.g., Major et al. 1999). However, the situation
seemed to be turned around in the Frogn area, where the smallest occupied roadsides were
smaller than the smallest occupied non-linear patches, and the number of singing males
indicated a higher density of animals in the road verges (Paper I). The pattern of wart-biter
movements in this habitat (Paper I; also see previous chapter) indicated that in the roadside
edges were not avoided; actually, they were preferred. The preference for edges may be
caused by differences in microclimate (the roadside sloped towards the east, but was flatter
near the edges). Anyway, these results indicates an edge response that differs form the non-
linear patches in the same area, and may indicate a more "effective" use of the habitat area,
i.e., that a smaller fraction of the habitat is effectively empty.
15

Overview and synthesis
Deciding to emigrate
Which factors influences the emigration rate, and more specifically: How does
habitat area and shape influence emigration rate? These questions are obviously of great
importance in metapopulation biology, and essential for predictive models. In a much-cited
paper, Stamps et al. (1987) described a model where animals move around the patch on
random. Each time an animal encounters the patch edge, it is hypothesised to leave the patch
with some probability x, and to bounce off the edge with probability 1-x. Given this model,
emigration rate decreases with increasing patch area because animals encounter the edge
more frequently. The predictions from this hypothesized mechanism (I will call it "the
boundary encounter rate hypothesis") have often been found to be quite adequate in a
metapopulation context. E.g., in a study of a metapopulation of the bush-cricket Metrioptera
bicolor, Kindvall (1999) developed a simulation model based on observed daily movement
distances in the habitat, daily movement rates in non-habitat, and probabilities of emigration
at the boundary towards several types of non-habitat. Non-habitat movement rates and the
emigration probabilities were estimated by experimentally releasing animals in the forest and
on borders, respectively. By comparing with data from long-term observations, he found that
this model predicted long-term net displacement distances and emigration rates quite
accurately. Haddad (1999) did a similar kind of analysis to predict how movement rates of
butterflies through corridors were affected by the corridor's width and length, using a
simulation model which departed from correlated random walks only at habitat boundaries.
In the Evenstad experiment (Paper IV; also see Use of area depending on habitat
size), I clearly found that emigration rate increased with patch area. The ratios of the
dispersal rates of the small, medium and large patches were 3.1 : 2.2 : 1, which fit quite well
to the prediction that emigration rate is proportional to the edge/area ratio, as the boundary
encounter rate hypothesis predicts (Stamps et al. 1987).
However, since the wart-biters adopted fairly stable ranges, we would also expect
that wart-biters that stayed in the edge zone would be more inclined to emigrate compared to
those who stayed more in the patch interior. However, I found no indication that this was
true. Therefore, although my observations agree with the boundary encounter rate
hypothesis, they do not agree with the underlying behavioural mechanism that this hypothesis
assumes. I propose social cohesion as an alternative hypothesis: the social interactions
between the animals function as glue that keeps them as a group. If there are few animals in
a patch, there are fewer interactions and the force that keeps them staying is weaker, and they
16

Overview and synthesis
are more inclined to move away from the patch. In the case of the wart-biter, the song of the
males is presumably the most important social interaction. An important difference between
this hypothesis and the boundary encounter rate hypothesis is that the social cohesion
hypothesis predicts that the emigration rate depends on the population size, not on the patch
area. As a kind of support for this hypothesis, I found that there seemed to be a connection
between the net emigration rate the first three days of the experiment (when emigration rates
where high due to the unfamiliar habitat) and the emigration rate the following two weeks.
Those patches that happened to be left by many individuals in the start of the experiment
tended to be left by even more individuals later. Of course, this is not conclusive evidence
for this hypothesis.
Except for patch size, I found that a much larger proportion of migrants (individuals
that emigrated at least once) among males than among females (61 versus 21 %). This was
the only behavioural parameter for which we found a clear difference between the sexes.
Also, I found that animals in good condition and with high movement activity migrated far
more than other animals. E.g., 56% of the animals with movement activity above the median
migrated, while only 30% of the others. Since condition and movement activity was closely
correlated, it is impossimle to separate the effects of those factors. Thus, it did not seem that
the inferior animals were forced to leave the patch; on the contrary, the typical migrant was a
sexually attractive male that probably sought to increase his fitness even further. It is worth
noting that after the initial bout of migration, which lasted for around three days, the
migration activity was quite low for an extended period, but then increased again towards the
end of the season. It seems likely that this was an adaptive strategy for males: after having
secured some reproduction "at home", they emigrated, hoping to find other patches with
females that had not been mated (and they did!). The difference between the sexes may
indicate that males' fitness is more limited by the number of matings than the females' fitness
are, in spite of the male's investment spermatophore. This view is supported by Wedell
(1992).
Statistical problems in the analysis of movement behaviour
I encountered a statistical problem when I were about to analyse the movement data:
the observed use of habitat with regard to, say, vegetation type, must be compared to the
availability of the different vegetation types. Of course, we could assume that the entire
habitat island was available. On a large time-scale, this is not wrong: in the course of for
instance the entire season, the entire habitat patch may be more or less equally available to the 17

Overview and synthesis
wart-biters. However, it was clear that many wart-biters only transversed a small portion of
the habitat island during the two-three weeks of the study, and it would be entirely wrong to
assume that they could select microhabitat from the entire habitat in the 1-2 hours between
recordings. The answer to this problem was Arthur et al's (1996) paper on how to estimate
habitat selection when availability changes. In this paper, they used the 99 th percentile of
observed movement distances as the radius within which all parts of the habitat were equally
available. In my case, this would lead to an overestimation on the amount of habitat close to
the habitat edge because of the limited size of the habitat patches. Moreover, my observation
intervals were not constant, in part because not all animals were found during each searching
bout, and movement lengths also depended on temperature. I therefore modified their
method by letting availability vary as a continuous function of distance from last observation,
time, and other variables. This modification is reported as a separate paper (Paper II),
including analysis of part of the data from paper I as a worked example.
Interpreting occupancy patterns
The wart-biters in the Frogn study areaIf it looks like a duck, and quacks like a duck, we have at least to
consider the possibility that we have a small aquatic bird of the
family Anatidae on our hands.
Douglas Adams: Dirk Gently's Holistic Detective Agency
In Paper V in this thesis, Rolf A. Ims and I studied the distribution of wart-biters in
the Frogn study area. During the two years of the study, we found wart-biter populations in
only 27 and 16 patches of the area, respectively, although 70 patches seemed to contain
suitable habitat for the species. We basically asked two questions about this pattern. First, is
it a metapopulation? Second, assuming the answer to be "yes", can we calculate the average
dispersal distance based on the pattern of occupancy alone? The latter question will be
discussed in a later chapter. Regarding the first question, we found that many aspects of the
wart-biter distribution agreed well with the metapopulation concept. First, we found that the
probability that a patch was occupied increased with patch area and decreased with the degree
of isolation relative to occupied patches. Those two factors, when log-transformed, appeared
to have additive effects on occupancy, i.e., a patch of a given area became more likely to be
occupied when isolation decreased. The latter is an important point when dealing with short-
term data where little or no turnover is observed, because we might also observe significant
effects of area and isolation if a species is in the process of invading an area, assuming that
18

Overview and synthesis
patches that are smaller then a certain size cannot sustain a population. We would not expect
the effects of area and isolation to be additive, however, so the fact that they are additive in
our study indicates turnover. Second, we observed some actual turnover. Third, we found
that small, but little isolated patches tended to harbour single animals that presumably had
dispersed to these patches earlier the same year. These facts together strongly suggest a
metapopulation-like structure.
However, not everything conformed to a classical metapopulation. First, it is not
clear whether the largest patches were susceptible to extinction. Thus, the system may have
some patches that practically can be looked upon as mainlands. However, a metapopulation
model is not "harmed" by the inclusion of patches with extinction rates practically equal to
zero; its predictive power is not diminished. Thus, this is largely a point of semantics.
Second, a patch occupied in the first year was so small and isolated that it "should not" have
been occupied, i.e., according to the metapopulation model we used, it was extremely
unlikely to be occupied. Just how "outlying" this patch is depends partly on which model that
is used, however (more on metapopulation models in the next chapter). Even if it is a single
patch, a single outlier that we are unable to explain is enough to declare, with a high degree
of certainty, that the model we have used is wrong. Although all models in principle are
wrong, this makes the predictive power of the model somewhat questionable. A possible
explanation for this patch is the time lag inherent in metapopulations; the probability that a
patch is occupied does not depends on the isolation relative to occupied patches for a period
of time up to this moment, not the isolation in this moment. (The outlier patch is close to a
large patch that was unoccupied in 1992 and 1994, but might have been occupied shortly
before our study. Later, the large patch has become occupied, while the outlier became
extinct in 1994.) Finally, we do not know whether the metapopulation is in dynamic
equilibrium, i.e., whether the proportion of occupied patches is without a temporal trend.
However, observations from the years following this study (unpublished data) do not suggest
any such trend, and the landscape is fairly stable.
As a conclusion, I reformulate the first question of this chapter: Is there a model
(verbal or mathematical) that is simpler than the metapopulation model, and can explain the
observed patterns? I cannot answer anything but "no". However, we have little direct
evidence of turnover, and we know little about recolonization and extinction rates. Also, we
have no clue about what causes extinctions, i.e., the relative importance of demographic
stochasticity, temporal environmental variation, deterministic extinctions (e.g., because of
19

Overview and synthesis
vegetation succession) and high emigration rates. Such knowledge would of course be very
important in a conservation context.
20

Overview and synthesis
Metapopulation models - the good, the bad and the uglyI'm astounded by people who want to "know" the universe when
it's hard enough to find your way around Chinatown.
Woody Allen
Metapopulation models have evolved and radiated into countless forms from Levins'
original model. As far as single-species models are concerned, the main trend has been
towards increasing complexity and increasing realism. Part of the reason is that
metapopulation ecology has developed from a purely theoretical concept to a highly applied
discipline of conservation biology. Increasingly, politicians and landscape managers demand
specific advice regarding reserve and landscape design, which cannot be answered without a
realistic model. Unfortunately, both of the main processes in metapopulations are infamously
difficult to model realistically, and it is easy to end up with models with a lot of parameters.
In addition, many of the parameters are notoriously difficult to estimate. In structured
metapopulation models, for instance, local population dynamics is explicitely modelled (e.g.,
using the logistic growth equation). Thus, one does not only need estimates of maximum
growth rate (R) and carrying capacity (K), but one also needs to know (or assume) the
relationship between population size and the probability of extinction (i.e., demographic
stochasisity). Unless very precies estimates are available from a species that have been
studied in detail through a number of years, such models are often of limited value and. Also,
small differences in models structure can have a large influence on predictions. E.g., Mills et
al. (1996) used four different programs to analyse population viability based on the same data
set, and found that there were large deviations between predictions from each program
because of such apparent details as idiosyncracies of the input format and how density
independence is incorporated.
Part of the problem is that the available data commonly is snapshot or semi-snapshot
patterns of occupancy, i.e., data on which patches that are occupied in one or a few years,
respectively. If turnover is low, extinctions and recolonizations can be so infrequent that it is
impossible to fit independent models of extinction and recolonization (as done by Sjögren
Gulve and Ray 1996). Thus, one has to rely on the snapshot/semi-snapshot occupancy
patterns. Thus, the question is how to squeeze maximum information out of the following
data (in the most extreme case): the area of each patch, the distances between patches, and
which patches that are occupied in a single year. We obviously need a model.
21

Overview and synthesis
Metapopulation models for interpretation of snapshot or semi-snapshot patterns can
be arranged in a continuum from mechanistic to phenomenological models. Basically, in a
mechanistic model, the processes (in metapopulation studies: immigration and emigration)
that link predictor variables (patch areas and distances between patches) to observed patterns
(occupancy of habitat islands) are modelled, based on ecological theory. Thus, the
parameters in the model have some direct interpretation in relation to the processes that are
assumed to case the pattern. In contrast, in phenomenological models the link between
predictor variables and the observed pattern is a statistical model that is chosen simply
because it appears to fit the data well. Thus, the estimated parameters have no direct
ecological interpretation. The most successful metapopulation model may be Ilkka Hanski's
incidence function model (IFM; Hanski 1994). Here, occupancy is mechanistically described
as a function of extinction and colonization probabilities, which in turn are more or less
phenomenologically described as functions of population size (or patch area) and the number
of immigrants, respectively. Both the last functions can be said to be partly mechanistic
(since they use functions that ecologically makes sense) and partly phenomenological (since
the parameters have no direct ecological meaning). At last, the number of immigrants is
described as a function of the distance to other patches and their areas. The entire model has
five parameters. Hanski recommends that one, the average dispersal distance, is estimated
using dispersal data, while the other four are estimated by fitting the model to the pattern of
occupancy. Thus, the number of immigrants and the probabilities of colonization and
extinction can be predicted for any habitat patch on basis of the estimated parameters. The
IFM has been applied in a number of studies with good results (Hanski and Thomas 1994;
Hanski et al. 1996; Wahlberg et al. 1996). Finally, a purely phenomenological approach to
wart-biter occupancy is to use logistic regression to model the probability of occupancy as a
function of patch area and isolation. One example of this kind is Thomas et al. (1992), who
studied the distribution of occupied and vacant butterfly habitats.
Paper V in this thesis is another example of a purely phenomenological approach
applied to the wart-biters of the Frogn study area. The approach is actually idendical to the
study of Thomas et al. (1992), except that we used a theoretical dispersal function (the
negative exponential, the same as in IFM) as a basis to calculate isolation indices for each
patch. This study is based on patch occupancy data for two successive generations of wart-
biters, i.e., typical semi-snapshot data. We assumed that the probability of occupancy in a
single year was a logistic function of log(isolation index), log(area) and variables of habitat
22

Overview and synthesis
quality (describing vegetation and slope). Thus, the number of parameters that must be
estimated is [number of habitat quality variables + 3], with an additional parameter to
estimate (average dispersal distance) if isolation indices are estimated using the theoretical
dispersal function. The parameters were estimated by fitting the model to the occupancy
data.
Purely phenomenological models like the logistic regression and more
mechanistically based models like IFM appear very different. First, the mathematical
formulations of the models seem totally unrelated to each other. However, it is easy to show
that in much of parameter space they may be quite similar. Second, mechanistic models
based on ecological theory have parameters that have some meaning with regard to the
ecological processes of extinction and recolonization, while the meaning of the parameters of
the logistic models are not readily interpreted in terms of those processes (they are easily
interpreted in terms of occupancy; see Discussion in Paper V). Therefore, mechanistic
models can be used to simulate the metapopulation during time and how patch destruction
affects metapopulation viability. It is also easy to analyse the effect of destroying patches
using statistical models (i.e., a phenomenological approach); just keep the estimated
parameters and calculate new isoclines after patch removal. With a statistical model and
some additional information, it is also possible to deduce curves of per-year colonization and
extinction rates. One advantage of statistical models is that their properties are well-known.
Another advandage may be increased robustness and precision of estimates due to a lower
number of parameters in the model (e.g., three in a logistic model vs. four in the IFM if there
are no habitat quality variables).
Generally, whichever type of model that is used, estimating parameters from
snapshot or semi-snapshot patterns of occupancy involve several caveats. First, these models
assume that there is no trend in the proportion of occupied patches, i.e., that the
metapopulation is in a state of dynamic quasi-stability. Obviously, predicting the risk of
global extinction assuming dynamic stability becomes a meaningless effort if this assumption
does not hold. If the metapopulation is on its way to deterministic extinction (because
patches have become too small and/or too isolated from each other) such a flawed analysis
will only obscure the fact that some action must be taken. Breaking this assumption can also
lead to very biased estimates also if the metapopulation is not extremely far from stability.
E.g., Kindvall (1995) found that Hanski's model yielded turnover rates 2-6 higher than
observed, probably because the assumption of stability did not hold because new patches had
23

Overview and synthesis
been created recently before the study. Another caveat is that without knowledge of local
dynamics, there may be an unknown source-sink structure in the population. Predictions
about the effects of destroying patches may be far too optimistic regarding the removal of
patches that in reality are source patches (and too pessimistic regarding the removal of sink
patches). A third and related caveat is the assumption that migration rate is equal and not
affected by for instance patch area. Small populations can be sinks simply because of high
emigration rates (Kuusaari et al. 1998; Paper IV). Finally, even though there is no trend in
the proportion of occupied patches, temporal heterogeneity in patterns and processes may
lead to erroneous conclusions in studies based on a few years data. E.g., extinctions (or
recolonizations, for that matter) may occur largely during infrequent years of unfavourable
weather, and it can be difficult to foresee the extinction pattern if we have not observed such
a year (e.g., Weiss et al. 1988; Solbreck 1991). One example that shows the susceptibility of
data from one or a few years (how data from one or a few years can lead astray) is the
Euphydryas editha metapopulation studied by Boughton (1999). Here, former sources
became extinct due to an unusual frost, and were recolonized from the former pseudosinks.
Estimating dispersal parameters from patch occupancy patterns
Spatial ecology with predictive power depends on at least some data on dispersal
between populations. However, such data may be very difficult to collect. Therefore, it
would be incredibly useful to be able to estimate dispersal indirectly, using the pattern of
occupied and unoccupied patches as the only raw data. Theoretically, this is possible if we
make three assumptions. The first one is that the number of dispersers from an island is
proportional to the area of the patch. The second is that dispersal does only depend on
distance, i.e. that it does not depend on features in the landscape outside the patches. The
third assumption is the form of the dispersal function, i.e., the probability that an individual
that leaves a patch arrives at another patch as a function of the distance between the patches.
In our case (Paper V), we assumed the negative-exponential function c = exp(-D/D').
Biologically, the assumptions behind this function is that animals spread by simple diffusion,
and dispersers are "lost" at a constant rate during dispersal (Turchin 1998:188). Alternative
functions could be the power function or the Gaussian function, which assumes that the ratio
between long and short-range dispersers is higher and lower, respectively (Turchin
1998:192). E.g., Hill (1996) found that dispersal lengths of butterflies in a patchy landscape
was well explained by the power function (see also Kot et al. 1996 and references therein).
As shown in Paper V, we found a good agreement between the observed average dispersal
24

Overview and synthesis
distance (37 m, calculated from male dispersal only) and the average dispersal distance
estimated using the pattern of occupancy (36-42 m, depending on the number of habitat
variables included in the model). However, one case of good agreement does not exactly
guarantee that average dispersal distance can be estimated in this way in general. Moreover,
even if the average dispersal distance is can be estimated adequately, this number may not be
of much use as long as the form of the dispersal function is uncertain, since the tails of this
function is very important when predicting the future of the metapopulation. Thus, it is very
uncertain to which degree it is practically useful to estimate dispersal parameters from the
occupancy patterns. Nevertheless, for many species that disperse as spores, seeds, etc., it can
be practically impossible to estimate dispersal rates. In addition it can be very difficult to
estimate the probability that a new population can be established in an empty patch as a
function of the number of dispersers that arrive. Thus, it would be interesting to find out,
e.g., using simulation, how accurately a dispersal curve can be derived given the number of
patches and the size of the geographic area that has been sampled.
Interpreting genetic variation: invasion of new landscape
elementsAs mentioned before in this synthesis, roadsides are a habitat type that is becoming
increasingly important for the wart-biter. The wart-biter seems to require roadsides of a
certain width; I have never observed populations in roadsides less than 2 m wide, and the
probability of occupancy seems to increase up to 3-4 m width. Such broad roadsides are most
common along major highways built the last 20 years. Thus, the invasion and use of such
roadsides is of great interest for the conservation of the wart-biter. Roadsides, if properly
managed, are potentially important habitat for many other insect species as well as plants.
For instance, it is believed that 80% of the butterfly species of the Netherlands can use
roadside habitat (Anonymous 1995, cited in Forman and Alexander 1998). In addition, the
creation of these new habitats can be exploited as experiments on a larger scale than any
ecological research project can afford. First, they provide case studies of invasion of new
habitat, a field of ecology that has received quite much attention recently (e.g., Kareiva
1996). Secondly, they can be used to study gene flow and genetic differentiation in linear
habitats, an area of many theoretical, but few empirical studies (Paper VI).
In Paper VI, Søren Bondrup-Nielsen, Rolf Anker Ims and I discuss different ways
that anthropogenic linear habitats can be created and be invaded by a species. We include 25

Overview and synthesis
both linear habitats that are engineered by human beings (e.g., roadsides) and linear habitats
that have been created by destroying most of a once non-linear habitat (e.g., clearcutting a
forest except for river margins). To investigate how these different scenarios affect spatial
genetic patterns, we do a simulation study where we follow the gene frequencies of two loci
in a row of populations, starting out with different initial patterns of spatial genetic patterns,
as well as varying population sizes and migration rates. Using standard analyses of genetic
structuring, such as overall Fst and correlation analyses (spatial autocorrelation as well as
correlation and crosscorrelation between loci), such data can help estimating migration rates,
effective population sizes, and/or the age since populations were established. In some cases,
genetic data can also be used as a rear-view mirror, since some types of initial conditions
(specifically, concurrent genetic gradients in two loci) can be detected by the presence of
correlation between loci for around fifty generations after establishment of populations.
As a case study, we studied the distribution and genetic variation of wart-biters
along a stretch of a major Norwegian highway (E18 Holmestrand - Larvik). Large parts of
this road has been built 5-20 years ago, and currently it seems to be the most important wart-
biter habitat in the area along the road, which is intensively developed for farming and
housing. As genetic markers we used one allozyme loci (ME) as well as the amount of black
pigmentation on the wings (wing melanism, WM). We found quite strong correlation
between loci as well as spatial autocorrelation within loci. In light of the simulation results,
the most likely explanation appears to be that ME and WM varied geographically in similar
ways before the corridor populations established. Based on simulation results, it also seems
likely that the average effective population size is in the order of 60 individuals and that
migration rate (between neighbouring sample points) is above 0.05. Although these values
does not seem entirely improbable, it must be emphasized that this way of using the
simulation results is somewhat speculative.
26

Overview and synthesis
ReferencesAddicott, J.F., Aho, J.M., Antolin, M.F., Padilla, D.K., Richardson, J.S., and Soluk, D.A.
(1987). Ecological neighborhoods: scaling environmental patterns. Oikos 49: 340-
346.
Ander, K. (1947). Flygförmågan hos våra hopprätvinger [Flight ability of our Orthoptera].
Fauna Och Flora 42: 210-221.
Andren, H. (1994). Effects of habitat fragmentation on birds and mammals in landscapes with
different proportions of suitable habitat: A review. Oikos 71: 355-366.
Andren, H. (1999). Habitat fragmentation, the random sample hypothesis and critical
thresholds. Oikos 84: 306-308.
Anonymous (1995). Natuur Over Wegen. Dienst Weg- en Waterbouwkunde, Delft,
Netherlands.
Arthur, S.M., Manly, B.F., McDonald, L.L., and Garner, G.W. (1996). Assessing habitat
selection when availability changes. Ecology 77: 215-227.
Bascompte, J. and Sole, R.V. (1996). Habitat fragmentation and extinction thresholds in
spatially explicit models. Journal of Animal Ecology 65: 465-473.
Bellman, H. (1985). A Field Guide to the Grasshoppers and Crickets of Britain and Northern
Europe. Collins, London.
Boughton, D.A. (1999). Empirical evidence for complex source-sink dynamics with
alternative states in a butterfly metapopulation. Ecology 80: 2727-2739.
Cherrill, A. J. (1989). The diet of the Wart-biter Decticus verrucivorus (L.). Bulletin of the
British Entomological Society 20: 115-118.
Cherrill, A.J. and Brown, V.K. (1990a). The habitat requirements of adults of the wart-biter
Decticus verrucivorus (L.) (Orthoptera: Tettigoniidae) in southern England (UK).
Biological Conservation 53: 145-158.
Cherrill, A.J. and Brown, V.K. (1990b). The life cycle and distribution of the water-biter
Decticus verrucivorus (L.) (Orthoptera: Tettigoniidae) in a chalk grassland in southern
England (UK). Biological Conservation 53: 125-144.
Cunningham, A.A., Frank, J.M., Croft, P., Clarke, D., and PearceKelly, P. (1997). Mortality
of captive British wartbiter crickets: Implications for reintroduction programs.
Journal of Wildlife Diseases 33: 673-676.
27

Overview and synthesis
DN (1994). Verdifulle kulturlandskap i Norge. Mer enn bare landskap! Direktoratet for
Naturforvaltning, Trondheim.
DN (1999a). Kartlegging av naturtyper. Verdisetting av biologisk mangfold. Direktoratet for
naturforvaltning - håndbok 13.
DN (1999b). Nasjonal rødliste for truede arter i Norge 1998. Norwegian red list 1998.
Direktoratet for naturforvaltning - rapport 1999-3.
Edelstam, C. (1995). Ängar. Jordbruksverket, Jönköping, Sweden.
Forman, R. T. T. and Alexander, L. E. (1998). Roads and their major ecological effects.
Annual Review of Ecology and Systematics 29: 207-231.
Haddad, N. M. (1999). Corridor use predicted from behaviors at habitat boundaries.
American Naturalist 153: 215-227.
Hamilton, W.D. and May, R.M. (1977). Dispersal in stable habitats. Nature 269: 578-581.
Hanski, I. (1994). A practical model of metapopulation dynamics. Journal of Animal
Ecology 63: 151-162.
Hanski, I. and Gilpin, M. (1997). Metapopulation Biology. Ecology, Genetics, and
Evolution. Academic Press, London.
Hanski, I., Moilanen, A., Pakkala, T., and Kuussaari, M. (1996). The quantitative incidence
function model and persistence of an endangered butterfly metapopulation.
Conservation Biology 10: 578-590.
Hanski, I. and Thomas, C.D. (1994). Metapopulation dynamics and conservation: A spatially
explicit model applied to butterflies. Biological Conservation 68: 167-180.
Harz, K. (1960). Geradflügler oder Orthopteren (Die Tierwelt Deutschlands 46). VEB
Gustav Fischer Verlag, Jena.
Hill, J.K., Thomas, C.D., and Lewis, O.T. (1996). Effects of habitat patch size and isolation
on dispersal by Hesperia comma butterflies: implications for metapopulation
structure. Journal of Animal Ecology 65: 725-735.
Holst, K. T. (1986). The Saltatoria (bush-crickets, crickets and grasshoppers) of Northern
Europe. Fauna Entomologica Scandinavica 16.
Ingrisch, S. (1978a). Labor- und Freilanduntersuchungen zur Dauer der postembryonalen
Entwicklung einiger mitteleuropäischer Laubhauschrecken (Orthoptera: Tettigoniidae)
und ihre Beeinflussung durch Temperatur und Feuchte. Zoologischer Anzeiger 200:
309-320.
28

Overview and synthesis
Ingrisch, S. (1978b). Zum verhalten mitteleuropäischer Leubheuschrecken (Orthoptera:
Tettigoniidae) und ihre Beeinflussung durch Temperatur und Feuchte. Deutsche
Entomologische Zeitschrift 25: 349-360.
Ingrisch, S. (1979). Experimentell-ökologische Freilanduntersuchungen zur Monotopbindung
der Laubheuschrecken (Orthoptera: Tettigoniidae) und ihre Beeinflussung durch
Temperatur und Feuchte. Beitraege zur Naturkunde der Osthessen 15: 33-95.
Kareiva, P. (1996). Developing a predictive ecology for non-indigenous species and
ecological invasions. Ecology 77: 1651-1652.
Keuper, A., Kalmring, K., Schatral, A., Latimer, W., and Kaiser, W. (1986). Behavioural
adaptations of ground living bushcrickets to the properties of sound propagation in
low grassland. Oecologia 70: 414-422.
Kindvall, O. (1995). Ecology of the bush cricket Metrioptera bicolor with implications for
metapopulation theory and conservation (doctor dissertation). Sveriges
Lantbruksuniversitet Rapport 29.
Kindvall, O. (1999). Dispersal in a metapopulation of the bush cricket, Metrioptera bicolor
(Orthoptera: Tettigoniidae). Journal of Animal Ecology 68: 172-185.
Kot, M., Lewis, M.A., and van den Driessche, P. (1996). Dispersal data and the spread of
invading organisms. Ecology 77: 2027-2042.
Krebs, J. R. and Davies, N. B. (1987). An Introduction to Behavioural Ecology. Blackwell,
Oxford.
Kuussaari, M., Saccheri, I., Camara, M., and Hanski, I. (1998). Allee effect and population
dynamics in the Glanville fritillary butterfly. Oikos 82: 384-392.
Lemire, M. and Lessard, S. (1997). On the non-existence of an optimal migration rate.
Journal Of Mathematical Biology 35: 657-682.
Major, R.E., Christie, F.J., Gowing, G., and Ivison, T.J. (1999). Age structure and density of
red-capped robin populations vary with habitat size and shape. Journal of Applied
Ecology 36: 901-908.
Mills, L.S. and Allendorf, F.W. (1996). The one-migrant-per-generation rule in conservation
and management. Conservation Biology 10: 1509-1518.
Nagy, B. (1950). Beiträge zur Kenntnis des Nahrungsbedarfs von Decticus verrucivorus L.
(Orthopt.:Tettigon.). Annales Biologicae Universitatis Debreceniensis 1: 222-227.
29

Overview and synthesis
Pulliam, H. R. (1996). Sources and sinks: empirical evidence and population consequences.
In: O. E. Rhodes, R. K. Chesser, and M. H. Smith (eds.): Population dynamics in
ecological space and time. The University of Chicago Press, Chicago.
Samways, M. J. and Harz, K. (1982). Biogeography of intraspecific morphological variation
in the bush crickets Decticus verrucivorus (L.) and D. albifrons (F.) (Orthoptera:
Tettigoniidae). Journal of Biogeography 9: 243-254.
Solbreck, C. (1991). Unusual weather and insect population-dynamics - Lygaeus equestris
during an extinction and recovery period. Oikos 60: 343-350.
Stamps, J.A., Buechner, M., and Krishnan, V.V. (1987). The effects of edge permeability and
habitat geometry on emigration from patches of habitat. American Naturalist 129:
533-552.
Stelter, C., Reich, M., Grimm, V., and Wissel, C. (1997). Modelling persistence in dynamic
landscapes: Lessons from a metapopulation of the grasshopper Bryodema tuberculata.
Journal of Animal Ecology 66: 508-518.
Thomas, C.D. and Kunin, W.E. (1999). The spatial structure of populations. Journal of
Animal Ecology 68, 647-657.
Thomas, C.D., Thomas, J.A., and Warren, M.S. (1992). Distributions of occupied and vacant
butterfly habitats in fragmented landscapes. Oecologia 92: 563-567.
Thorens, P. and Nadig, A. (1997). Atlas de Distribution des Orthopteres de Suisse. Centre
Suisse de Cartographie de la Faune, Pro Natura,
Tilman, D., May, R.M., Lehman, C.L., and Nowak, M.A. (1994). Habitat destruction and the
extinction debt. Nature 371: 65-66.
Turchin, P. (1998). Quantitative Analysis of Movement. Sinauer, Sunderland, Massachusetts.
Wahlberg, N., Moilanen, A., and Hanski, I. (1996). Predicting the occurrence of endangered
species in fragmented landscapes. Science 273: 1536-1538.
Wedell, N. (1991). Sperm competition selects for nuptial feeding in a bush-cricket. Evolution
45: 1975-1978.
Wedell, N. (1992). Protandry and mate assessment in the wartbiter Decticus verrucivorus
(Orthoptera, Tettigoniidae). Behavioral Ecology and Sociobiology 31: 301-308.
Wedell, N. and Arak, A. (1989). The wartbiter spermatophore and its effect on female
reproductive output (Orthoptera: Tettigoniidae, Decticus verrucivorus). Behavioral
Ecology and Sociobiology 24: 117-125.
30

Overview and synthesis
Weidemann, S., Stiedl, O., and Kalmring, K. (1990). Distribution and population density of
the bushcricket Decticus verrucivorus in a damp-meadow biotope. Oecologia 82:
369-373.
Weiss, S.B., Murphy, D.D., and White, R.R. (1988). Sun, slope, and butterflies: topographic
determinants of habitat quality for Euphydryas editha. Ecology 69: 1486-1496.
Wiens, J. A. (1995). Landscape mosaics and ecological theory. In: L. Hansson, L. Fahrig, and
G. Merriam (eds.): Mosaic Landscapes and Ecological Processes. Chapman & Hall,
London.
31

Overview and synthesis
List of papersPaper I: Hjermann, D. Ø. Do bush-crickets avoid the habitat edge? Microhabitat selection
in the wart-biter (Decticus verrucivorus). Manuscript.
Paper II: Hjermann, D. Ø. 2000. Analyzing habitat selection in animals without well-
defined home ranges. Ecology 81: 1462-1468.
Paper III: Hjermann, D. Ø. The condition of individual bush-crickets influence their spatial
distribution. Manuscript.
Paper IV: Hjermann, D. Ø. Why does emigration increase with decreasing patch size? An
experimental test of the boundary encounter rate hypothesis. Manuscript.
Paper V: Hjermann, D. Ø. and Ims, R. A. 1996. Landscape ecology of the wart-biter
Decticus verrucivorus in a patchy landscape. Journal of Animal Ecology 65: 768-
780.
Paper VI: Hjermann, D. Ø., Ims R. A. and Bondrup-Nielsen, S. Patterns and processes
underlying population genetic structure in anthropogenic linear habitats: Four
hypothetical scenarios and one case study. Manuscript.
Paper V is reprinted by courtesy of Blackwell Scientific Publication
32

Overview and synthesis
Paper 1
33

Overview and synthesis
Paper 2
34

Overview and synthesis
Paper 3
35

Overview and synthesis
Paper 4
36

Overview and synthesis
Paper 5
37

Overview and synthesis
Paper 6
38

Overview and synthesis
39
Box 1: Guesstimating migration rates from observations of patches with single males
In Paper V, we each year categorized patches into three types: patches with no observations or
wart-biters at all, patches with observations of single males, and patches with observations of at least two
animals. We can use the data in the middle group to give us a rough idea about migration rates per area in
occupied patches. I here demonstrate this for the 1992 data from Frogn (Paper V). I use only data for the
patches that are smaller than the smalles patch with populations any of the years, i.e., patches that
appeared to be to small for establishment of a population (<120 m 2). I sorted these patches by connectivity
value (sensu Paper V), then calculated the running mean of connectivity value and the observed
probability of observing a male on the patch. The result is the "observed" line in the figure below.
Now, the connectivity value of patch i was calculated using two basic assumptions: the density
of wart-biters and the migration rate is the same on all occupied patches (i.e., the migration rate does not
depend on area, contrary to what I showed in Paper II). Then, the number of emigrant males from a patch
equals [patch area]*[density of wart-biters]*[migration rate], or [no. of emigrant males] = area*C, where
C is the number of emigrants per area. What we want is to estimate C. To find how many of the
emigrants from patch j that reaches another patch i, we multiply with a function ci,j that depends only on
the distance between i and j. The rest of the emigrants ends up somewhere else or dies. The expected
number of emigrants that reaches i from j is therefore areaj*C*ci,j. To find the expected number of
emigrants that reaches i from anywhere, we sum up this product for all patches j, i.e. [the number of
immigrants] = areaj*C*ci = C*areaj*ci (since C is a constant). However, I have defined connectivity
as areaj*ci (Paper V). Thus, by assuming different values of C we can plot the expected number of
immigrants in the same graph as the observed numbers of males (see below).
Probability of immigration of a male to an empty patch. The "observed numbers" are running
means of eight islands sorted by connectivity value.
We here see that for the right-hand part of the graph, C values around 0.0025 - 0.005 appears to
fit quite well. For lower connectivity values, the observed values is higher, though. This may have two
reasons. Low connectivity means that the surrounding patches are small and/or far away. However, Paper
II clearly indicates that emigration rate is higher on small patches. In addition, long-distance migration
may be more common that the negative exponential function (which we used for ci,j) indicates, and
moreover, we assumed that no migrants moved longer than 400 m. I therefore think that C = 0.0025 -
0.005 might be a plausible estimate, i.e., one male emigrant per 2-400 m 2 of habitat. The estimate is
probably closest to the truth for medium and large patches.

Overview and synthesis
Box 2: Guesstimating extinction and colonization probabilities from a logistic
regression model
Based on the rough estimate of male emigration rate described in Box 1, we can
calculate both extinction and colonization rates, given a couple of assumptions more. As in
Box 1, we assume that dispersers are independent and that the probability of dispersing from
one place to another follow the negative exponential distribution. Let us also assume that the
emigration rate of males is 2.9 times the emigration rate females is equal that of males (which
is what we found in Paper II). Then, the probability of immigration by one individual, two
individuals and one individual of each sex, respectively, is as depicted in the figure below.
Next, we assume that the colonization probability equals the extinction probability
on the 50% isocline of probability of occupancy (which implies that the metapopulation is in
equilibrium). It is then easy to calculate the probability of extinction as a function of area
(see figure of H. comma).
40