Embed Size (px)
Citation preview

Seven Year Fixed Rate BondOctober 2016
Delivering results
From 1966 - 2016
Philip NeutzeChief Financial Officer
Stewart ReynoldsManager, Business Intelligence
Campbell De MorganTreasury Specialist

2016
2
October NZDCM Presentation
Auckland International Airport Limited (Auckland Airport) intends to make an offer of fixed rate bonds (Bonds) in reliance upon the exclusion in clause 19
of schedule 1 of the Financial Markets Conduct Act 2013 (FMCA). Except for the interest rate and the maturity date, the Bonds will have identical rights,
privileges, limitations and conditions as Auckland Airport’s:
(a) 4.73% NZ$100,000,000 fixed rate bonds maturing on 13 December 2019 which are quoted on the NZX Debt Market under the ticker code AIA120;
(b) 5.52% NZ$150,000,000 fixed rate bonds maturing on 28 May 2021 which are quoted on the NZX Debt Market under the ticker code AIA130; and
(c) 4.28% NZ$100,000,000 fixed rate bonds maturing on 9 November 2022 which are quoted on the NZX Debt Market under the ticker code AIA200,
(together, Quoted Bonds) and therefore are the same as the Quoted Bonds for the purposes of the FMCA and the Financial Markets Conduct Regulations
2014 (FMC Regulations).
Auckland Airport is subject to a disclosure obligation that requires it to notify certain material information to NZX Limited (NZX) for the purpose of that
information being made available to participants in the market and that information can be found by visiting https://www.nzx.com/companies/AIA.
Investors should look to the market price of the Quoted Bonds to find out how the market assesses the returns and the risk premium for those bonds.
Disclaimer
This presentation is for preliminary information purposes only and is not an offer to sell or the solicitation of any offer to purchase or subscribe for any
financial products and no part of it shall form the basis of or be relied upon in connection with any contract or commitment whatsoever. The information in
this document is given in good faith and has been obtained from sources believed to be reliable and accurate at the date of the preparation, but its
accuracy, correctness and completeness cannot be guaranteed.
All of the data provided in this document is derived from publicly available information in relation to Auckland Airport (including the annual report of
Auckland Airport for its financial year ended 30 June 2016), unless otherwise indicated.
A Terms Sheet dated 26 October 2016 (Terms Sheet) has been prepared in respect of the offer of the Bonds. Investors should not purchase the Bonds
until they have read the Terms Sheet. Investors should consider the risks that are associated with an investment in the Bonds, particularly with regard to
their personal circumstances (including financial and tax issues).
The selling restrictions set out in the Terms Sheet shall apply to the Bonds.
Any internet site addresses provided in this presentation are for reference only and, except as expressly stated otherwise, the content of any such internet
site is not incorporated by reference into, and does not form part of, this presentation.
This presentation may contain forward looking statements with respect to the financial condition, results of operations and business, and business
strategy, of Auckland Airport. Auckland Airport gives no assurance that the assumptions upon which Auckland Airport based its forward looking
statements on will be correct, or that its business and operations will not be affected in any substantial manner by other factors not currently foreseeable
by Auckland Airport or beyond its control. Accordingly, Auckland Airport can make no assurance that the forward looking statements will be realised.
This presentation is dated 26 October 2016.
Important Notice

2016 October NZDCM Presentation
Agenda
Page
1. Key terms of the offer 4
2. Company overview 6
3. Strategy for our future 13
4. Financial information 17
5. Outlook 23
Appendices
3

2016 October NZDCM Presentation
Key terms of the offer
4
Issuer Auckland International Airport Limited (“Auckland Airport”)
Description of Bonds
Direct, unsecured, unsubordinated, fixed rate debt obligations of Auckland Airport
ranking equally and without preference among themselves and equally with all other
outstanding unsecured and unsubordinated indebtedness of Auckland Airport
(except indebtedness preferred by law)
Issuer Long-Term Credit Rating (S&P) A-
Expected Long-Term Issue Credit Rating (S&P) A-
Issue AmountUp to NZ$100,000,000 with the ability to accept unlimited oversubscriptions at
Auckland Airport’s discretion
Opening Date Wednesday, 26 October 2016
Closing Date 1.00pm on Friday, 28 October 2016
Issue Date Wednesday, 2 November 2016
Tenor 7 years
Maturity Date Thursday, 2 November 2023
Interest Rate The aggregate of the Base Rate and the Margin on the rate set date
Base RateThe semi-annual mid-market swap rate for an interest rate swap of a term matching
the period from the Issue Date to the Maturity Date
Indicative Issue Margin The indicative margin is 1.40 per cent per annum area for the Bonds
Interest Payment Dates 2 May and 2 November in each year until and including the Maturity Date
Minimum Denomination NZ$10,000 and multiples of NZ$1,000 thereafter
Interest Payments Semi-annually in arrears
Joint Lead ManagersBank of New Zealand and Westpac Banking Corporation (acting through its New
Zealand branch) (ABN 33 007 457 141)
Co-Managers Commonwealth Bank of Australia and Forsyth Barr
Registrar Link Market Services Limited

2016
Hig
hlig
hts
Com
pany
overv
iew
Str
ate
gy f
or
our
futu
re
Fin
ancia
l
Info
rmatio
nO
utlo
ok
October NZDCM Presentation
Auckland Airport at a glance
5
100+
17.3 millionannual passengers
24/7
24 x 7 operation,
365 days a year
share of long haul arrivals toNew Zealand9 1 %
26 international
airlines announced
4 international
freight airlines
44 international
destinations
19 domesticdestinations
229,000 tonnesof cargo each year
1,500hectares of land
3,635metres of runway
2 hotels
average annual
passenger growth
over 50 years
20,000+people working at
and around the airport
900+businesses
Auckland Airportin 2016
157,000+
flights each year
135+
international flights each day
295+
domestic flights each day
shops, cafés
and restaurants24/7
Information as at June 2016
share of
international visitors
to New Zealand74%
6.6%

Com
pany
overv
iew

2016
Hig
hlig
hts
Com
pany
overv
iew
Str
ate
gy f
or
our
futu
re
Fin
ancia
l
Info
rmatio
n
October NZDCM Presentation
Outlo
ok
Auckland Airport is the busiest in New Zealand
7
• The largest airport in New Zealand
• ~74% of international passengers to New Zealand arrive or depart from Auckland Airport and 91% of total long haul arrivals
• Main commercial airport serving New Zealand’s largest city with 157,000 aircraft movements a year
• No curfew for flights, operating 24 hours a day, 7 days a week
• It is one of New Zealand’s most important infrastructure assets, and the largest NZX listed company with a market capitalisation of $8.0bn 2
• 1,500 hectares of freehold land on the Auckland isthmus ($3.6 billion market value at 30 June 2016)
• Listed on the NZX and ASX
New Zealand international airports by passenger numbers
Passengers excluding transits in the year ended June 2016
1. Monthly traffic performance updates: AKL, CHC, WLG, ZQN airports
2. As at 20 October 2016
Auckland16.682 million
Wellington5.849 million
Christchurch6.306 million
Queenstown1.651 million

2016
Hig
hlig
hts
Com
pany
overv
iew
Str
ate
gy f
or
our
futu
re
Fin
ancia
l
Info
rmatio
n
October NZDCM Presentation
Outlo
ok
Connecting New Zealand to the world
8
DohaDubai
HonoluluGuangzhou
Chongqing
Tianjin
Bangkok
Denpasar
Hong Kong
Tokyo
Beijing
Shanghai
Seoul
Osaka
London
San Francisco
Los Angeles
Vancouver
Santiago
Buenos Aires
Houston
Adelaide
Brisbane
Cairns
Sunshine Coast
Melbourne
Perth
Apia
Nadi
SuvaRarotonga
Auckland Airport connects New Zealand to 44 international destinations
Taipei
Manila
Nouméa
Port Vila
Norfolk Island
Niue
Nuku'alofaPapeete
Ho Chi Minh CityKuala Lumpur
Singapore
Sydney
Gold Coast
• Auckland Airport’s focus on increasing connectivity and working closely with airlines has
helped achieve a 6.6% average annual passenger growth over 50 years
• Auckland Airport welcomes travellers from established, emerging and new destinations like
Buenos Aires, Dubai, Shanghai, Houston and Ho Chi Minh City
Routes launched or announced based on single ticketed fares as at 13 October 2016
Xi’an
2016
Hig
hlig
hts
Com
pany
overv
iew
Str
ate
gy f
or
our
futu
re
Fin
ancia
l
Info
rmatio
n
October NZDCM Presentation
Outlo
ok
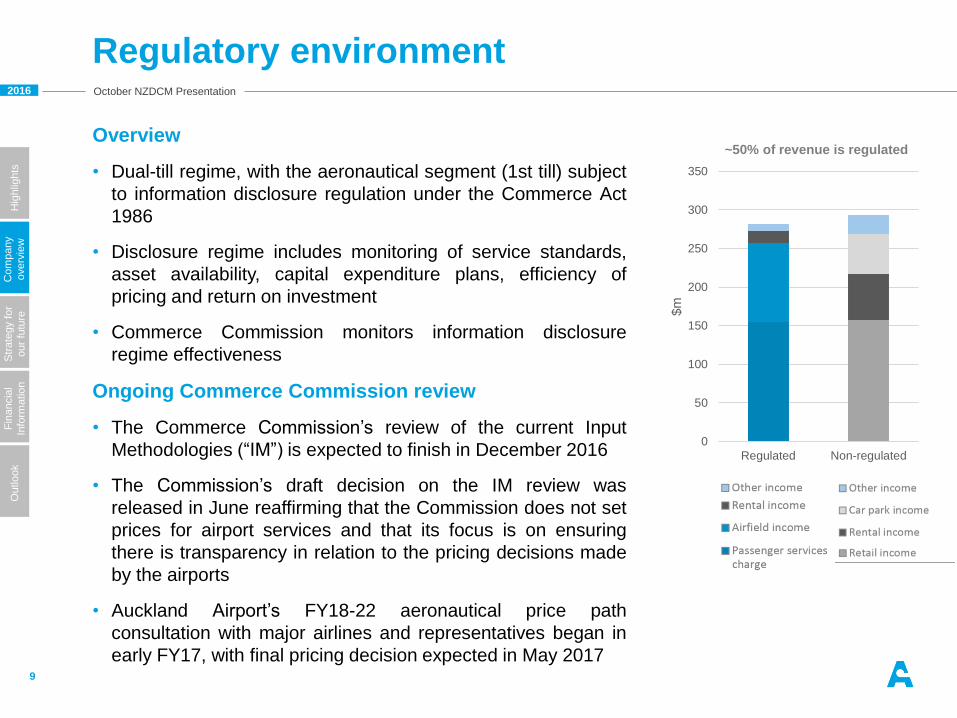
Overview
• Dual-till regime, with the aeronautical segment (1st till) subject
to information disclosure regulation under the Commerce Act
1986
• Disclosure regime includes monitoring of service standards,
asset availability, capital expenditure plans, efficiency of
pricing and return on investment
• Commerce Commission monitors information disclosure
regime effectiveness
Ongoing Commerce Commission review
• The Commerce Commission’s review of the current Input
Methodologies (“IM”) is expected to finish in December 2016
• The Commission’s draft decision on the IM review was
released in June reaffirming that the Commission does not set
prices for airport services and that its focus is on ensuring
there is transparency in relation to the pricing decisions made
by the airports
• Auckland Airport’s FY18-22 aeronautical price path
consultation with major airlines and representatives began in
early FY17, with final pricing decision expected in May 2017
Regulatory environment
9
0
50
100
150
200
250
300
350
Regulated Non-regulated
$m
~50% of revenue is regulated

2016
Hig
hlig
hts
Com
pany
overv
iew
Str
ate
gy f
or
our
futu
re
Fin
ancia
l
Info
rmatio
n
October NZDCM Presentation
Outlo
ok
0.0
2.0
4.0
6.0
8.0
10.0
12.0
14.0
16.0
18.0
FY00 FY01 FY02 FY03 FY04 FY05 FY06 FY07 FY08 FY09 FY10 FY11 FY12 FY13 FY14 FY15 FY16
An
nu
al p
asse
ng
ers
(m
)
Financial Year Ended 30 June
Total Passengers at Auckland Airport (excl. Transits)
Proven passenger growth
10
• Continued growth demonstrates resilience to global economic weakness and other
external shocks
Sept 11
Terrorist
Attacks
SARS
Outbreak
Avian Flu
Outbreak
Sub Prime
Crisis and
Global
Recession
Christchurch
Earthquake

2016
Hig
hlig
hts
Com
pany
overv
iew
Str
ate
gy f
or
our
futu
re
Fin
ancia
l
Info
rmatio
n
October NZDCM Presentation
Outlo
ok
Compares favourably to Australasian airports
11
FY16 passenger growth rates %
8,780
14,332
4,253
9,165
1,549
5,260
7,902
26,597
9,506
24,711
4,757
17,200
0% 20% 40% 60% 80% 100%
Auckland
Sydney
Perth
Melbourne
Christchurch
Brisbane
International (Excl. Transits) Domestic
8.1%
9.8%
7.5%
4.1%
1.4%
-2.9%
9.5%
3.7%
7.1%6.2%
3.8%
1.5%
-4.0%
-2.0%
0.0%
2.0%
4.0%
6.0%
8.0%
10.0%
12.0%
International (Excl. Transits) Domestic
Auckland Sydney Perth Melbourne Christchurch Brisbane
• Auckland Airport experienced the highest total passenger growth of the main Australasian
airports in FY16
– highest rate of domestic passenger growth
– second highest rate of international passenger growth
• Auckland Airport has the highest proportion of international passengers of all Australasian
airports
International vs domestic passenger mix
Source: Monthly traffic performance updates: AKL, CHC, SYD, PER, MEL, BNE airports
Figures in thousands

2016
Hig
hlig
hts
Com
pany
overv
iew
Str
ate
gy f
or
our
futu
re
Fin
ancia
l
Info
rmatio
n
October NZDCM Presentation
Outlo
ok
Diverse business activities
12
Aeronautical Base
• ~50% of revenues come from aeronautical activities
• 8 new airlines announced and 15 new routes established in FY16
• Continued focus on route development
Diverse Retail Offering
• Significant and diverse retail offering
• Strong performance from Specialty and Destination categories – up 25% FY16
• Larger space in development will drive step change in retail over the next two years
Strong Carpark Growth
• ~10,000 parking spaces across a range of parking services from Valet to Park&Ride
• Increase to average revenue per space over FY16
• Increasing demand is driving further expansion
Extensive Investment Property
• Significant land holding of 1,500 hectares
• 9 hectares of development completed and a 12.3% increase in rent roll in FY16
• Momentum building for 2017, a number of significant developments underway
Hotel Occupancy Increasing
• Holds interest in two hotels at the airport
• Occupancy rates increased to 89%
• Design underway for a third hotel
Strong Associate Airport Performance
• Holds interest in two other airports
• Queenstown experienced an 18% increase in passenger numbers in 2016 with total aircraft movements up 7% on prior period
• NQA international passenger numbers increased by 24.4% in 2016Y2016

Str
ate
gy for
our fu
ture

2016
Hig
hlig
hts
Com
pany
overv
iew
Str
ate
gy f
or
our
futu
re
Fin
ancia
l
Info
rmatio
n
October NZDCM Presentation
Outlo
ok
Our strategy
Adopt an ambitious and innovative approach to help
New Zealand to sustainably unlock the growth
opportunities in travel, trade and tourism
Strengthen and extend our retail, transport and hotel
businesses to ensure we can respond to evolving
customer needs
Continue to improve our performance by increasing
the productivity of our assets, processes, operations
and balance sheet
Add to our strong infrastructure and commercial
foundations for long-term sustainable growth
Be Fast, Efficient
& Effective
Strengthen Our
Consumer Business
Grow Travel Markets
Invest for Future Growth
14

2016
Hig
hlig
hts
Com
pany
overv
iew
Str
ate
gy f
or
our
futu
re
Fin
ancia
l
Info
rmatio
n
October NZDCM Presentation
Outlo
ok
Delivering on our ambitions
15
In 2013 we established several ambitious targets under our Faster, Higher, Stronger growth
strategy
Aspirations: How we tracked in FY16:
400,000Double Chinese arrivals to 400,000
by FY17, up from 213,781 in FY13
359,270An increase of 66,835 in FY16
$60mBuild property rent roll to $60 million
by FY17, up from $44 million in FY13
$63mAn increase of $7 million in FY16
10mAchieve 10 million international passengers
(excluding transits) by FY18, up from 7 million in
FY13
9mAn increase of 0.7 million in FY16
20mReach 20 million total passengers by
FY20, up from 14.5 million in FY13
17.3mAn increase of 1.5 million in FY16

2016
Hig
hlig
hts
Com
pany
overv
iew
Str
ate
gy f
or
our
futu
re
Fin
ancia
l
Info
rmatio
n
October NZDCM Presentation
Outlo
ok
Investing for future growth
• Bold 30-year vision developed with international experts (www.airportofthefuture.co.nz)
• Vision based on a combined domestic and international terminal as well as an efficient, affordable and staged development path
• Work completed on the first two phases and well underway on phases 3-5:
Phase 1: Additional baggage belts
Phase 2: Reconfigured inbound processing
Phase 3: Expanded outbound processing and airside dwell areas
Phase 4: Pier B, bus lounge, remote and contact stands
Phase 5: Domestic Terminal (first stage)
• A significant period of investment is underway as we build to accommodate the ongoing growth in passengers, aircraft and businesses operating at the airport
16

Fin
ancia
l In
form
ation

2016
Hig
hlig
hts
Com
pany
overv
iew
Str
ate
gy f
or
our
futu
re
Fin
ancia
l
Info
rmatio
n
October NZDCM Presentation
Outlo
ok
Strong five year financial performance
18
For the year ended 30 JuneNZ$m
2016 2015 2014 2013 2012 CAGR
Revenue 573.9 508.5 475.8 448.5 426.8 7.7%
Expenses 143.6 128.5 120.6 117.6 107.5 7.5%
Earnings before interest, taxation, depreciation,
fair value adjustments and investments in
associates (EBITDAFI)
430.3 380.0 355.2 330.9 319.3 7.7%
EBITDAFI Margin 75.0% 74.7% 74.7% 73.8% 74.8%
Share of (loss) / profit from associates (8.4) 12.5 11.6 9.9 9.2 n/a
Derivative fair value (decrease)/increase (2.6) (0.7) 0.6 1.5 (2.1) n/a
Property, plant and equipment revaluation (16.5) (11.9) 4.1 - - n/a
Investment property revaluation 87.1 57.2 42.0 23.1 1.4 n/a
Depreciation expense 73.0 64.8 63.5 62.1 64.5 3.1%
Interest expense 79.1 86.0 68.2 66.7 69.0 3.5%
Taxation expense 75.4 62.8 65.9 58.6 52.0 9.7%
Reported net profit after tax 262.4 223.5 215.9 178.0 142.3 16.5%
Underlying profit after tax1 212.7 176.4 169.9 153.8 139.0 11.2%
1 A reconciliation showing the difference between reported net profit after tax and underlying profit after tax is included in the financial report for the year ended 30
June 2016

2016
Hig
hlig
hts
Com
pany
overv
iew
Str
ate
gy f
or
our
futu
re
Fin
ancia
l
Info
rmatio
n
October NZDCM Presentation
Outlo
ok
Summary balance sheet
19
For the year ended 30 JuneNZ$m
2016 2015 2014 2013 2012
Cash 52.6 38.5 41.4 69.2 42.8
Trade and other receivables 42.3 36.6 29.0 26.8 23.1
Other current assets 8.0 12.3 3.2 3.6 3.4
Current assets 102.9 87.4 73.6 99.6 69.3
Property, plant and equipment 4,708.1 3,884.1 3,761.5 3,020.2 3,021.7
Investment properties 1,048.9 848.1 733.4 635.9 579.8
Investment in associates 142.8 163.6 158.4 165.7 180.0
Derivative financial instruments 138.8 118.3 6.9 17.1 24.7
Total assets 6,141.5 5,101.5 4,733.8 3,938.5 3,875.5
Borrowings 1,886.9 1,722.5 1,506.9 1,142.0 1,108.7
Other liabilities 373.9 336.1 308.2 297.1 294.0
Total liabilities 2,260.8 2,058.6 1,815.1 1,439.1 1,402.7
Equity 3,880.7 3,042.9 2,918.7 2,499.4 2,472.8
Total liabilities and equity 6,141.5 5,101.5 4,733.8 3,938.5 3,875.5

2016
Hig
hlig
hts
Com
pany
overv
iew
Str
ate
gy f
or
our
futu
re
Fin
ancia
l
Info
rmatio
n
October NZDCM Presentation
Outlo
ok
Credit metrics
20
• Growth in the debt book has been mirrored by the increasing asset base of the company
- book leverage has only increased 2.1%
• Average interest cost fell to 5.1% following successful refinancing at lower rates, rebalancing
towards floating rate exposure and the decline in base rates during the year
• Credit rating is A-
• Balance sheet capacity for capital expenditure uplift
For the year ended 30 June 2016 2015 2014 2013 2012
Debt / debt + book value of equity 30.7% 33.8% 31.8% 29.0% 28.6%
Debt / debt + market value of equity 19.7% 22.5% 24.7% 22.8% 25.8%
Funds from operations / gross debt (S&P methodology) 16.7% 15.3% 16.0% 19.9% 19.3%
Funds from operations interest cover 4.6x 3.9x 4.5x 4.2x 3.9x
Weighted average interest cost (12 months to 30 June) 5.1% 5.8% 6.0% 6.2% 6.5%
Average debt maturity profile (years) 4.3 4.9 3.2 4.2 4.5
Percentage of fixed borrowings 49% 50% 59% 66% 66%

2016
Hig
hlig
hts
Com
pany
overv
iew
Str
ate
gy f
or
our
futu
re
Fin
ancia
l
Info
rmatio
n
October NZDCM Presentation
Outlo
ok
Funding
21
• Auckland Airport sources debt funding
from a variety of markets and maintains
a wide range of debt maturities
• Weighted average maturity of existing
facilities of 4.3 years
• Committed headroom of $280 million at
30 June
• Auckland Airport continues to target an
A- credit rating
• Auckland Airport remains committed to
dividend policy of paying ~100% of
underlying NPAT
• Targeting $500 million debt raisings in
FY17
• This will refinance $305 million of
maturing debt and $195 million of
growth capital expenditure
0
50
100
150
200
250
300
350
400
450
201
7
201
8
201
9
202
0
202
1
202
2
202
3
202
4
202
5
202
6
202
7
Mill
ions
Debt maturity profile as at 30 June 2016
Commercial Paper Bank Facilities Floating Bonds Fixed Bonds USPP
$91.8m
$328.8m
$606.3$225.0m
$635.0m
Drawn borrowings by category as at 30 June 2016
Commercial Paper (4.9%)
Drawn Bank Facilities (17.4%)
Fixed Bonds (32.1%)
Floating Bonds (11.9%)
USPP (33.7%)
Total Borrowings
$1,886.9 million

2016
Hig
hlig
hts
Com
pany
overv
iew
Str
ate
gy f
or
our
futu
re
Fin
ancia
l
Info
rmatio
n
October NZDCM Presentation
Outlo
ok
Capital expenditure
22
For the year ended 30 June2016
$m2015
$mChange
Renewal 18.4 13.7 34.3%
Growth 224.8 133.9 67.9%
Total capital expenditure 243.2 147.6 64.8%
Depreciation 73.0 64.8 12.7%
• The majority of capital expenditure is investing for future earnings growth
• Capital expenditure is forecast to increase in FY17 to between $330 million and $370 million on:
– significant aeronautical projects including the International Terminal level 1 redevelopment, the
extension to International Terminal Pier B, and additional remote and contact stands; and
– investment property developments including Fonterra, Ministry for Primary Industries, two
logistics developments and the new office development Quad 7
0
50
100
150
200
250
300
350
400
FY12 FY13 FY14 FY15 FY16 FY17
Actual Guidance
Ca
pe
x $
m
Renewal Spend Growth Spend Guidance range

Outlook
2016
Hig
hlig
hts
Com
pany
overv
iew
Str
ate
gy f
or
our
futu
re
Fin
ancia
l
Info
rmatio
nO
utlo
ok
October NZDCM Presentation
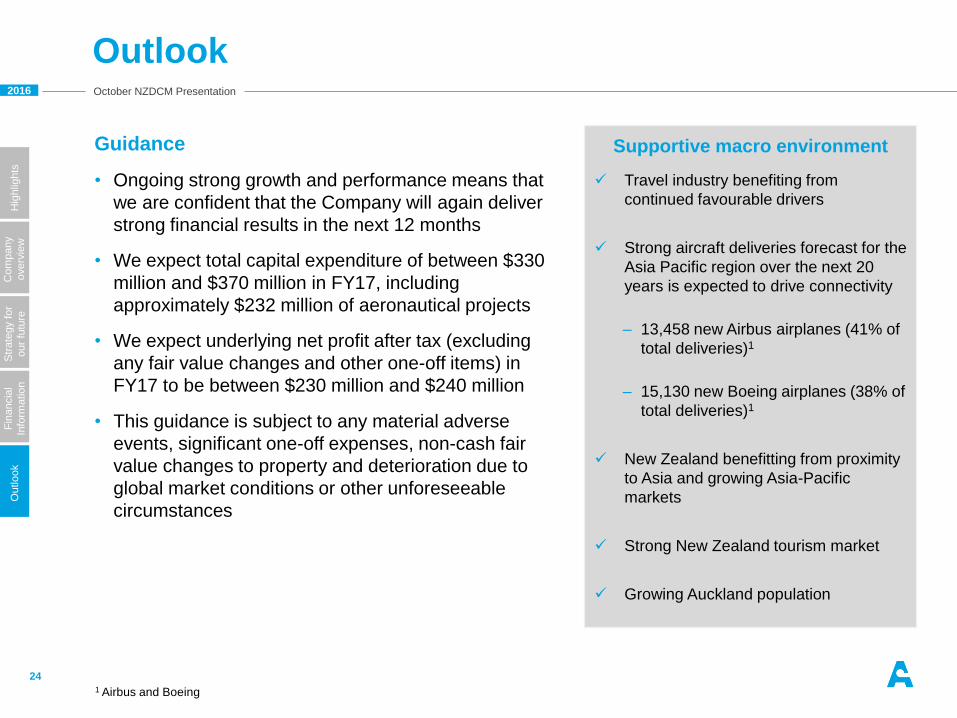
Supportive macro environment
Travel industry benefiting from
continued favourable drivers
Strong aircraft deliveries forecast for the
Asia Pacific region over the next 20
years is expected to drive connectivity
– 13,458 new Airbus airplanes (41% of
total deliveries)1
– 15,130 new Boeing airplanes (38% of
total deliveries)1
New Zealand benefitting from proximity
to Asia and growing Asia-Pacific
markets
Strong New Zealand tourism market
Growing Auckland population
Outlook
24
Guidance
• Ongoing strong growth and performance means that
we are confident that the Company will again deliver
strong financial results in the next 12 months
• We expect total capital expenditure of between $330
million and $370 million in FY17, including
approximately $232 million of aeronautical projects
• We expect underlying net profit after tax (excluding
any fair value changes and other one-off items) in
FY17 to be between $230 million and $240 million
• This guidance is subject to any material adverse
events, significant one-off expenses, non-cash fair
value changes to property and deterioration due to
global market conditions or other unforeseeable
circumstances
1 Airbus and Boeing

2016 October NZDCM Presentation
Contact details
Debt investor inquiries
Campbell De Morgan
Treasury Specialist
DDI: +64 9 255 9029, Mobile: +64 27 478 3243
25

Questions

Appendic
es

2016
Hig
hlig
hts
Com
pany
overv
iew
Str
ate
gy f
or
our
futu
re
Fin
ancia
l
Info
rmatio
n
October NZDCM Presentation
Outlo
ok
Significant land holdings
28
• Auckland Airport owns approximately 1,500 hectares of freehold land with ~300 hectares
available for investment property development
• Vacant land enables staged and affordable expansion of aeronautical infrastructure as
required and ongoing rental income growth
Auckland Airport boundaries
Auckland CBD (transposed)

2016
Hig
hlig
hts
Com
pany
overv
iew
Str
ate
gy f
or
our
futu
re
Fin
ancia
l
Info
rmatio
n
October NZDCM Presentation
Outlo
ok
Strong revenue growth across the business
29
For the year ended 30 June$m
2016 2015 2014 2013 2012 CAGR
Airfield income 103.4 93.3 87.6 81.6 77.3 7.5%
Passenger services charge 154.9 140.9 131.5 120.2 83.1 16.8%
Terminal services charge - - - - 28.6 n/a
Retail income 157.5 132.0 127.1 124.3 120.8 6.9%
Car park income 52.1 46.6 42.8 40.4 36.6 9.2%
Rental income 74.7 64.6 59.3 55.4 55.0 8.0%
Other income 31.3 31.1 27.5 26.6 25.4 5.4%
Total revenue 573.9 508.5 475.8 448.5 426.8 7.7%
• Aircraft and passenger growth drove the majority of the increase in FY16 airfield income
and passenger service charge, plus 1.5% - 2.5% price increases
• Strong passenger growth, new commercial agreements in duty free and outstanding
specialty performance contributed to the excellent growth in retail income
• Proactive management through the online channel resulted in higher parking transaction
values, combined with higher passenger volumes
• Strong rent reviews and the completion of office and warehouse space in year drove rental
increase
Revenue by segment

2016
Hig
hlig
hts
Com
pany
overv
iew
Str
ate
gy f
or
our
futu
re
Fin
ancia
l
Info
rmatio
n
October NZDCM Presentation
Outlo
ok
Runway movements growing
30
Aircraft movements
49,82546,69245,80944,31445,094
107,929104,264107,454110,832110,421
20162015201420132012
0
20,000
40,000
60,000
80,000
100,000
120,000
140,000
160,000
180,000
Domestic aircraftmovements
International aircraftmovements
MCTOW
4.94.64.34.14.2
2.11.91.91.81.7
20162015201420132012
0.0
1.0
2.0
3.0
4.0
5.0
6.0
7.0
8.0
Mill
ions
Domestic MCTOW
International MCTOW
• Increased connectivity to new and existing destinations reversed a 7 year decline in total
aircraft movements
• Up-gauging of domestic and international fleets continued in FY16, however existing carriers
appear to be closer to optimal configuration, suggesting aircraft movement growth may
continue