Embed Size (px)
Citation preview

Seventh Multi-year Expert Meeting on Commodities and Development
15-16 April 2015 Geneva
The current situation and outlook for grains, rice and oilseeds
By
Amy Reynolds Senior Economist, International Grains Council
The views expressed are those of the author and do not necessarily reflect the views of UNCTAD.

IGC 2011
www.igc.int
IGC 2015 igc.int
International Grains Council
UNCTAD Multi-Year Expert Meeting on
Commodities and Development
Geneva
15-16 April 2015
Amy Reynolds
International Grains Council

IGC 2011
www.igc.int
IGC 2015 igc.intTotal grains in 2014/15: Record supplies, falling
prices and currency movements
0
500
1000
1500
2000
2500
3000
Barley
Wheat
Maize
Other
Supplies up 3% y/y to 2.4bn t
m t
125.00
175.00
225.00
275.00
325.00
375.00Jan 2000 = 100
Grains* GOI at lowest since mid 2010
* Excluding oilseeds and rice
65
75
85
95
105Index
US$ index at 12-year high

IGC 2011
www.igc.int
IGC 2015 igc.intWheat: world supply and demand summary
m t 5-year
Ave. *
14/15
f’cast
15/16
proj.
Production 687 719 709
Supply 875 906 907
Trade 144 153 150
Consumption 687 708 711
Stocks 188 198 196
of which:
Major exporters **
62 66 65
* Refers to 2010/11-2014/15
** Argentina, Australia, Canada, EU, Kazakhstan, Russia, Ukraine, US.
POINTS TO NOTE
• 2015/16 areas up slightly, but lower
average yields to cut production by
1% y/y.
• Small increase in total consumption in
15/16: higher food use expected, but
lower feeding.
• World stocks seen falling at end
2015/16, but still comfortable.
• Trade to stay high in 15/16, albeit
slightly lower y/y. Growth in milling
wheat demand in Far East Asia and
Africa, but some retreat from high
2014/15 levels expected in Near East
Asia.

IGC 2011
www.igc.int
IGC 2015 igc.intWheat: 2015/16 consumption to be up marginally
0
100
200
300
400
500
600
700
800
900Other
Feed
Food
Food up 1.3%, feed down 4%
-20
-10
0
10
20
30
40
Feed
Food
m t m t
Annual volume changes
0.0
0.5
1.0
1.5
2.0
2.5
3.0
3.5
4.0y/y % change
Long term changes in food demand
Some
upturn in
growth
recently

IGC 2011
www.igc.int
IGC 2015 igc.intWheat: Another year of strong export competition
in 2015/16?
0
5
10
15
20
25
30
35
40
45
50m t
Ukraine
Kazakhstan
Russia
0%
5%
10%
15%
20%
25%
30%
35%
US
EU
14/15 Black Sea exports high, despite
recent measures. But a fall in 15/16?
The EU overtakes the US to become
the largest wheat exporter
% of world exports
IGC 2011
www.igc.int
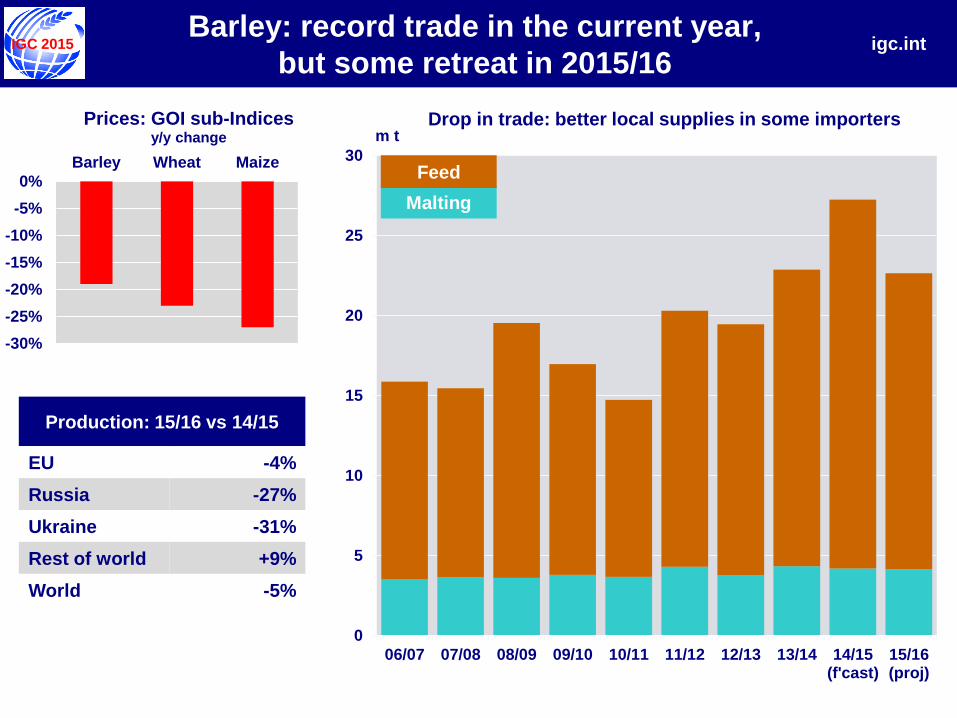
IGC 2015 igc.intBarley: record trade in the current year,
but some retreat in 2015/16
-30%
-25%
-20%
-15%
-10%
-5%
0%
Barley Wheat Maize
Prices: GOI sub-Indicesy/y change
Production: 15/16 vs 14/15
EU -4%
Russia -27%
Ukraine -31%
Rest of world +9%
World -5%
0
5
10
15
20
25
30
06/07 07/08 08/09 09/10 10/11 11/12 12/13 13/14 14/15(f'cast)
15/16(proj)
Malting
Feed
m tDrop in trade: better local supplies in some importers

IGC 2011
www.igc.int
IGC 2015 igc.intMaize: world supply and demand summary
m t 5-year
Ave. *
14/15
f’cast
15/16
proj.
Production 910 990 941
Supply 1,051 1,164 1,131
Trade 105 116 118
Consumption 901 974 961
Stocks 150 191 171
of which:
Major exporters **
44 66 50
* Refers to 2010/11-2014/15
** Argentina, Brazil, Ukraine, US.
POINTS TO NOTE
• World harvested area in 2015/16 to
fall and, assuming some drop in
average yields, production seen down
by 5% y/y.
• Strong demand anticipated, but
slightly lower y/y, reflecting smaller
feed use.
• A 10% contraction in end-2015/16
stocks is projected, led by the major
exporters.
• Global trade placed 1% higher y/y, as
reduced local harvests will trigger
buying in some countries, incl. the EU
and Mexico.

IGC 2011
www.igc.int
IGC 2015 igc.intMaize: Global use at a record in 2014/15, with only a
small decline projected in 2015/16.
0
25
50
75
100
125
0
100
200
300
400
500
600
700
800
900
1,000
90/91 95/96 00/01 05/06 10/11 13/14 14/15f'cast
15/16proj
Industrial
Feed
m t
Food
Other Trade (Jul/Jun) >
-25 yrs -5 yrs-10 yrs-15 yrs-20 yrs
m t

IGC 2011
www.igc.int
IGC 2015 igc.int
150
165
180
195
210
225
240
255
270
Ma
r-1
4
Ap
r-1
4
Ma
y-1
4
Ju
n-1
4
Ju
l-1
4
Au
g-1
4
Se
p-1
4
Oc
t-1
4
No
v-1
4
De
c-1
4
Jan
-15
Feb
-15
Ma
r-1
5
Maize: Export prices are falling and spreads
between origins are unusually narrow
US$/t fob
Fob price range (main exporters)
150
175
200
225
250
275
300
325
350
Ma
r-1
0
Se
p-1
0
Ma
r-1
1
Se
p-1
1
Ma
r-1
2
Se
p-1
2
Ma
r-1
3
Se
p-1
3
Ma
r-1
4
Se
p-1
4
Ma
r-1
5
GOI maize sub Index
Jan 2000 = 100

IGC 2011
www.igc.int
IGC 2015 igc.intSorghum: Trade could reach a 30-year high in 2015/16
on surging demand from China
0
2
4
6
8
10
12
07/08 09/10 11/12 13/14 15/16 proj
m t
Japan
Mexico
Others
China
150
175
200
225
250
275
300
325
350
Mar-13 Sep-13 Mar-14 Sep-14 Mar-15
US$/t fob
US maize, fob Gulf
US sorghum, fob Gulf

IGC 2011
www.igc.int
IGC 2015 igc.intRice: world supply and demand summary
m t (milled basis) 5-year
Ave. *
14/15
f’cast
15/16
proj.
Production 468 475 480
Supply 573 585 581
Trade 40 42 43
Consumption 467 483 487
Stocks 107 101 94
of which:
Major exporters **
35 31 26
* Refers to 2010/11-2014/15
** India, Pakistan, Thailand, US, Vietnam.
POINTS TO NOTE
• Total use of rice projected to exceed
production in 2015/16, resulting in a
7m t drop in world carryovers.
• Much of the decline concentrated in
the five major exporters, chiefly
Thailand and India, seen falling to an
eight-year low of 26m t.
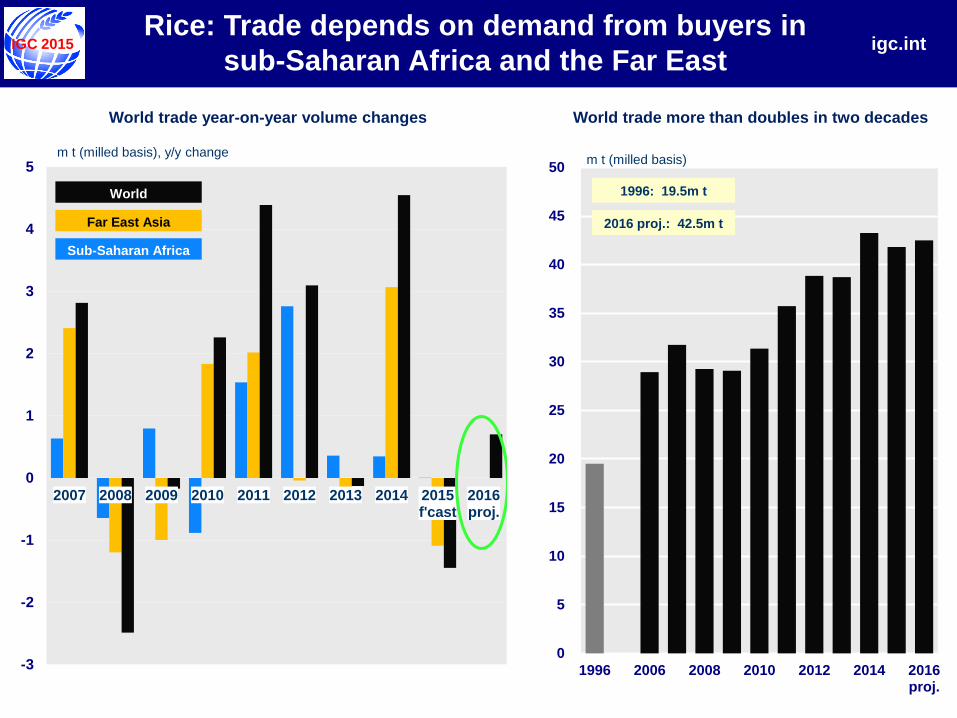
• World trade to edge up in 2015/16, to
42.5m t, second highest total on
record, underpinned by demand from
African and Asian buyers.
• Thailand to remain the dominant
exporter, its shipments seen at more
than 11m t in calendar 2016.

IGC 2011
www.igc.int
IGC 2015 igc.intRice: major exporters stocks to
contract again in 2015/16, to an eight-year low
0
5
10
15
20
25
30
35
40
05/06 07/08 09/10 11/12 13/14 15/16proj.
Thailand
India
m t (milled basis)
Others *
* Pakistan, US, Vietnam
Declines due to India and Thailand
0
2
4
6
8
10
12
14
05/06 07/08 09/10 11/12 13/14 15/16proj.
Stocks
Exports
m t (milled basis)
Thailand’s stocks to fall as exports remain high
IGC 2011
www.igc.int
IGC 2015 igc.intRice: Trade depends on demand from buyers in
sub-Saharan Africa and the Far East
-3
-2
-1
0
1
2
3
4
5
2007 2008 2009 2010 2011 2012 2013 2014 2015f'cast
2016proj.
m t (milled basis), y/y change
Far East Asia
World
Sub-Saharan Africa
0
5
10
15
20
25
30
35
40
45
50
1996 2006 2008 2010 2012 2014 2016proj.
m t (milled basis)
1996: 19.5m t
2016 proj.: 42.5m t
World trade more than doubles in two decadesWorld trade year-on-year volume changes

IGC 2011
www.igc.int
IGC 2015 igc.intSoyabeans: world supply and demand summary
m t 5-year
Ave. *
14/15
f’cast
15/16
proj.
Production 276 314 311
Supply 305 344 355
Trade 102 116 122
Consumption 272 300 313
Stocks 32 44 42
of which:
Major exporters **
13 26 25
* Refers to 2010/11-2014/15
** Argentina, Brazil, US.
POINTS TO NOTE
• Production tentatively seen posting a
fractional y/y fall, but remaining high
and the second largest outturn on
record.
• World trade expected to rise to a fresh
peak, but growth still less than in
earlier years.
• China’s imports projected at close to
80m t in 2015/16 – equivalent to 65%
of global traded volumes.
• Aggregate end-season carryovers
likely to remain ample, with stocks
especially high in the major exporters.

IGC 2011
www.igc.int
IGC 2015 igc.int
0
4
8
12
16
05/06 07/08 09/10 11/12 13/14 15/16proj.
Soyabeans: Inventories to remain high
in the major exporters in 2015/16
0
4
8
12
16
05/06 07/08 09/10 11/12 13/14 15/16proj.
Brazilm t
0
4
8
12
16
05/06 07/08 09/10 11/12 13/14 15/16proj.
Argentinam tUS
m t

IGC 2011
www.igc.int
IGC 2015 igc.intSoyabeans: World trade up by 80% in 10 years,
shaped near-entirely by Asian needs
0
25
50
75
100
125
05/06 07/08 09/10 11/12 13/14 15/16proj.
m t
Other Asia
China
World
0
10
20
30
40
50
60
05/06 07/08 09/10 11/12 13/14 15/16proj.
m t
US
Brazil
Brazil and the US compete for top exporter spotImport demand dominated by China

IGC 2011
www.igc.int
IGC 2015 igc.int
For more information, please visit: www.igc.int
or email: [email protected]