Embed Size (px)
Citation preview
Sewta Car Parking Assessment – Gwent and Vale of Glamorgan stations.
Final Reportv2 June 2010
Sewta Car Parking Assessment- Gwent and Vale of Glamorgan stations, Final Report, March 2010.
DOCUMENT CONTROL SHEET BPP 04 F8
Client: SEWTA
Project: Car Parking Assessment Job No: JC2873A0
Document Title: Sewta Car Parking Assessment – Gwent and Vale of Glamorgan stations. (Draft)
Originator Checked by Reviewed by Approved by NAME NAME NAME NAME ORIGINAL Lynda Moore Geoff Smith Geoff Smith Mike Lampkin
DATE SIGNATURE SIGNATURE SIGNATURE SIGNATURE
31st March 2010
Document Status: First Issue
NAME NAME NAME NAME ORIGINAL Geoff Smith Lynda Moore Geoff Smith Mike Lampkin
DATE SIGNATURE SIGNATURE SIGNATURE SIGNATURE
June 2010
Document Status: v2
NAME NAME NAME NAME ORIGINAL
DATE SIGNATURE SIGNATURE SIGNATURE SIGNATURE
Document Status:
NAME NAME NAME NAME ORIGINAL
DATE SIGNATURE SIGNATURE SIGNATURE SIGNATURE
Document Status:
This document has been prepared by a division, subsidiary or affiliate of Jacobs Consultancy UK Ltd (“Jacobs Consultancy”) in its professional capacity as consultants in accordance with the terms and conditions of Jacobs Consultancy’s contract with the commissioning party (the “Client”). Regard should be had to those terms and conditions when considering and/or placing any reliance on this document. No part of this document may be copied or reproduced by any means without prior written permission from Jacobs Consultancy. If you have received this document in error, please destroy all copies in your possession or control and notify Jacobs Consultancy. Any advice, opinions, or recommendations within this document (a) should be read and relied upon only in the context of the document as a whole; (b) do not, in any way, purport to include any manner of legal advice or opinion; (c) are based upon the information made available to Jacobs Consultancy at the date of this document and on current UK standards, codes, technology and construction practices as at the date of this document. It should be noted and it is expressly stated that no independent verification of any of the documents or information supplied to Jacobs Consultancy has been made. No liability is accepted by Jacobs Consultancy for any use of this document, other than for the purposes for which it was originally prepared and provided. Following final delivery of this document to the Client, Jacobs Consultancy will have no further obligations or duty to advise the Client on any matters, including development affecting the information or advice provided in this document. This document has been prepared for the exclusive use of the Client and unless otherwise agreed in writing by Jacobs Consultancy, no other party may use, make use of or rely on the contents of this document. Should the Client wish to release this document to a third party, Jacobs Consultancy may, at its discretion, agree to such release provided that (a) Jacobs Consultancy’s written agreement is obtained prior to such release; and (b) by release of the document to the third party, that third party does not acquire any rights, contractual or otherwise, whatsoever against Jacobs Consultancy and Jacobs Consultancy, accordingly, assumes no duties, liabilities or obligations to that third party; and (c) Jacobs Consultancy accepts no responsibility for any loss or damage incurred by the Client or for any conflict of Jacobs Consultancy’s interests arising out of the Client's release of this document to the third party.

Sewta Car Parking Assessment- Gwent and Vale of Glamorgan stations, Final Report, March 2010.
CONTENTS
1 INTRODUCTION 1 1.1 Background 1 1.2 Key Issues 2 1.3 Report Structure 2
2 EXISTING PARKING FACILITIES AND USE 4
3 CATCHMENT AND MARKET ANALYSIS 6 3.1 NPS Data Analysis 6 3.2 Census Data Analysis 8 3.3 Rail Demand Data Analysis 14 3.4 Suppressed Parking Demand and Future Requirements 16
4 STATION SPECIFIC ANALYSIS 19 4.1 Vale of Glamorgan 19 4.2 Marches Line 28 4.3 Main / Gloucester Line 33
5 ECONOMIC EVALUATION 39 5.1 Cost / Benefit Analysis 39 5.2 Sensitivity tests 45
6 CONCLUSIONS & RECOMMENDED FURTHER WORKSTREAMS 49 6.1 Conclusions 49 6.2 Summary of Findings 49 6.3 Recommended Further Work 51
APPENDIX A MODE OF ACCESS BY STATION 53 Table 1 Existing Station Parking Supply, charges and Demand 4 Table 2 Mode of access to station (NPS data) 6 Table 3 2001 Census Population and Car Ownership, by catchment 10 Table 4 2001 Census Journey to Work in Cardiff City Centre 11 Table 5 2001 Census Journey to Work in Bristol City Centre 11 Table 6 2001 Census Journey to Work in Cardiff vs Employed 12 Table 7 Parking demand in Relation to People Working in Cardiff / Bristol 13 Table 8 Parking Demand per Thousand Population 14 Table 9 Implied demand and potential suppressed demand from NPS analysis 17 Table 10 2018 –Surplus /Shortfall of car parking spaces to capacity for different
demand scenarios 18 Table 11 2026 –Surplus /Shortfall of car parking spaces to capacity for different
demand scenarios 18 Table 12 Vale of Glamorgan Economic Appraisal Results 2002 values and prices.41 Table 13 Cwmbran station Economic Appraisal Results 2002 values and prices. 42 Table 14 Abergavenny station Economic Appraisal Results 2002 values and
prices. 43

Sewta Car Parking Assessment- Gwent and Vale of Glamorgan stations, Final Report, March 2010.
Table 15 Gloucester/ Main Line Economic Appraisal Results 2002 values and prices. 44
Table 16 Sensitivity Tests on Vale of Glamorgan stations 45 Table 17 Sensitivity Tests on Marches Line stations 45 Table 18 Sensitivity Tests on Main/ Gloucester Line stations 46 Table 19 Details of Sensitivity Tests 47 Table 20 Sensitivity test Results 47 Figure 1 Car Access to Stations – Vale of Glamorgan 7 Figure 2 Car Access to stations- Marches, Main and Gloucester Line 8 Figure 3 Defined Parking Catchment Area – Vale of Glamorgan (East) 9 Figure 4 Defined Parking Catchment area – Vale of Glamorgan (West) 9 Figure 5 Defined Parking Catchment Area – Marches / Main / Gloucester Line 10 Figure 6 Total Annual Journeys 2003-2009 – Vale of Glamorgan Line 15 Figure 7 Total Annual Journeys 2003-2009– Marches Line 15 Figure 8 Total Annual Journeys 2003-2009 – Main/ Gloucester Line 16 Figure 9 Aerial photograph of Penarth Station 19 Figure 10 Aerial photograph of Dingle Road station 21 Figure 11 Aerial photograph of Cogan Station 22 Figure 12 Aerial photograph of Eastbrook station 23 Figure 13 Aerial photograph of Dinas Powys station 25 Figure 14 Aerial photograph of Rhoose station 26 Figure 15 Aerial photograph of Llantwit Major station 27 Figure 16 Aerial photograph of Cwmbran station 29 Figure 18 Aerial photograph of Pontypool and New Inn Station 30 Figure 19 Aerial photograph of Abergavenny station 32 Figure 20 Aerial photograph of Severn Tunnel Junction station 33 Figure 22 Aerial photograph of Caldicot station 36 Figure 23 Aerial photograph of Chepstow station 37

Sewta Car Parking Assessment- Gwent and Vale of Glamorgan stations, Final Reportv2, June 2010 Page 1 of 58
1 INTRODUCTION
1.1 Background
Sewta (South East Wales Transport Alliance) propose investment in rail services to attract people to rail for journeys to Cardiff and Newport as part of the sustainable development and regeneration strategy for South East Wales. The Sewta Rail Strategy Study recommended provision of additional car parking at stations to improve access to rail services, and since the publication of this report a number of studies have been undertaken across the region; • The Rhymney Line Rail Enhancement Scheme – Business Case Study - Car
Parking Strategy Evaluation examined the parking strategy for the Corridor between Caerphilly and Rhymney and the suppressed demand for car parking. The business case for additional parking provision at 5 stations was examined and evidence presented for securing Transport Grant and EU Convergence funding via Wefo.
• Similarly, the Maesteg Rail Line – Car Parking Appraisal Study examined the
corridor between Pontyclun and Maesteg and the business case for improved parking at 3 stations for funding bids;
• The Rhondda Cynon Taff Car Parking at Stations study examined the Valley
Lines to the North of Cardiff and examined the business case of 6 schemes including three that would involve multi-storey facilities, also for funding bids to Wefo, and;
• The Barry Docks Station Car Parking Appraisal Study is ongoing and is
examining the car parking supply in the Cadoxton – Barry Town section of the Vale of Glamorgan and the business case for a scheme at one station.
The driver for most of the previous studies has been the availability of funding from the EU Convergence programme and the bidding timescales. This study evaluates the potential to expand and create car parking capacity at stations in the remainder of the Sewta region – specifically the stations in Monmouthshire, Newport and the Vale of Glamorgan (not covered by the Barry Docks Station study); namely: (a) Vale of Glamorgan:
• Penarth • Dingle Road • Cogan • Eastbrook • Dinas Powys • Rhoose ( for Cardiff International Airport) • Llantwit Major The appraisal on this line also gives consideration to a potential new station at St Athans, although a detailed appraisal of this station is outside the scope of this study.

Sewta Car Parking Assessment- Gwent and Vale of Glamorgan stations, Final Reportv2, June 2010 Page 2 of 58
(b) Marches Line:
• Cwmbran • Abergavenny • Pontypool and New Inn (c) Main / Gloucester Line:
• Severn Tunnel Junction • Caldicot • Chepstow The appraisal on this line will also gives consideration to a potential new station at Llanwern, although a detailed appraisal of this station is outside the scope of this study. The study follows a similar methodology as the previous studies, although these stations do not have defined parking schemes for appraisal. 1.2 Key Issues
Whilst the requirements differ for each station there are some common issues that the study addresses, such as; • Where do existing passengers (and specifically car users) come from? • Where are they going to? • What is the scale of the existing and future market for car parking demand? • What would be the scale of the benefits to be gained through improved parking
supply? • And, for some schemes, is there a business case for improved parking provision? 1.3 Report Structure
The report is structured as follows: • Section 2: Existing parking facilities; car parking capacity, charges and use; • Section 3 Catchment and market analysis:
Station catchment analysis; definition of ‘catchment areas’ for each station,
analysing NRTS data (passenger interview data) to determine the origins of station users for each station.
Analysis of Census data for each station catchment data to understand the level of station use in relation to the population in the catchment area.
Analysis of the census journey to work data (in total and by mode) to understand the market for rail demand and car parking provision at each station.
Analysis of demand (MOIRA data) to understand where people are travelling to and how this has changed over time.
Analysis of current suppressed demand and potential suppressed demand over time.
Analysis of the impact of train service frequency improvements at relevant stations.

Sewta Car Parking Assessment- Gwent and Vale of Glamorgan stations, Final Reportv2, June 2010 Page 3 of 58
• Section 4: Station specific analysis and discussion of key findings from section 3. This section recommends schemes for economic appraisal.
• Section 5: Economic appraisal for stations identified in section 4. • Section 6 :Conclusions and recommendations for further workstreams.

Sewta Car Parking Assessment- Gwent and Vale of Glamorgan stations, Final Reportv2, June 2010 Page 4 of 58
2 EXISTING PARKING FACILITIES AND USE
Table 1 shows the existing parking capacity, charges and demand at the stations assessed within this report. Parking capacity has been sourced from either council surveys or the National Rail web site in the absence of survey data. It should be noted that the National Rail (NR) database only shows the NR owned spaces and this is in several cases on the Vale of Glamorgan line lower than the number surveyed. This is because there is also highways owned parking at the stations. We have shown the higher of the two figures as this is the true parking available at the site. Parking demand has been sourced from recent surveys where possible and in the absence of this from observations and / or the 2005 Sewta Rail Strategy Study.
Table 1 Existing Station Parking Supply, charges and Demand Station Parking
Capacity Charges Demand Source / Comments
Vale of Glamorgan Penarth 45 Free 45 Observed –Difficult to get
a space – often full -Car park has 2 hour time restrictions– but more commonly used by local shoppers than rail passengers – comment on Wiklopedia web site and from VOG council. 15 NR owned, circa 30 on approach to station, highways owned. .
Dingle Road 0 n/a Observation from VOG CC – people are parking in local residential streets
Cogan 56 Free 50 VOG survey, Spring 2010. 24 spaces shown on NR site.
Eastbrook 31 Free 34 VOG survey, Spring 2010. Dinas Powys 0 n/a Rhoose (CIA) 74 Free 2 VOG survey Autumn 2009
(max count 14 in Dec 2005) 66 spaces shown on NR site.
Llantwit major 79 Free 45 VOG survey Autumn 2009 survey .40 spaces shown on NR site, but confirmed with VOG now 79 spaces, following some recent work.
Marches Line Cwmbran 150 Free 141 Observed Feb 2010 – only
5 non- disabled spaces free
Pontypool & New Inn 25 Free 6 Observed Feb 2010.15 spaces on NR site.
Abergavenny 64 £2 daily, reductions for season tickets
61 2005 SEWTA and observation circa 2007
Sewta Car Parking Assessment- Gwent and Vale of Glamorgan stations, Final Reportv2, June 2010 Page 5 of 58
Station Parking
Capacity Charges Demand Source / Comments
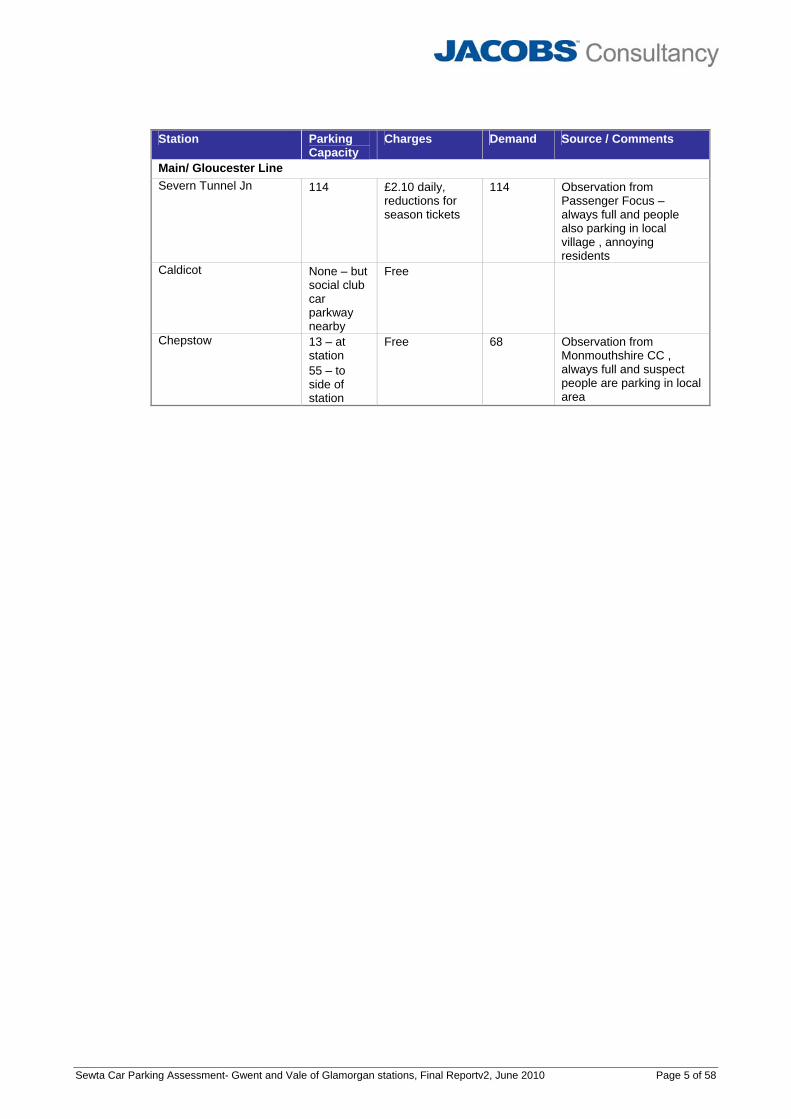
Main/ Gloucester Line Severn Tunnel Jn 114 £2.10 daily,
reductions for season tickets
114 Observation from Passenger Focus – always full and people also parking in local village , annoying residents
Caldicot None – but social club car parkway nearby
Free
Chepstow 13 – at station 55 – to side of station
Free 68 Observation from Monmouthshire CC , always full and suspect people are parking in local area
Sewta Car Parking Assessment- Gwent and Vale of Glamorgan stations, Final Reportv2, June 2010 Page 6 of 58
3 CATCHMENT AND MARKET ANALYSIS
3.1 NPS Data Analysis
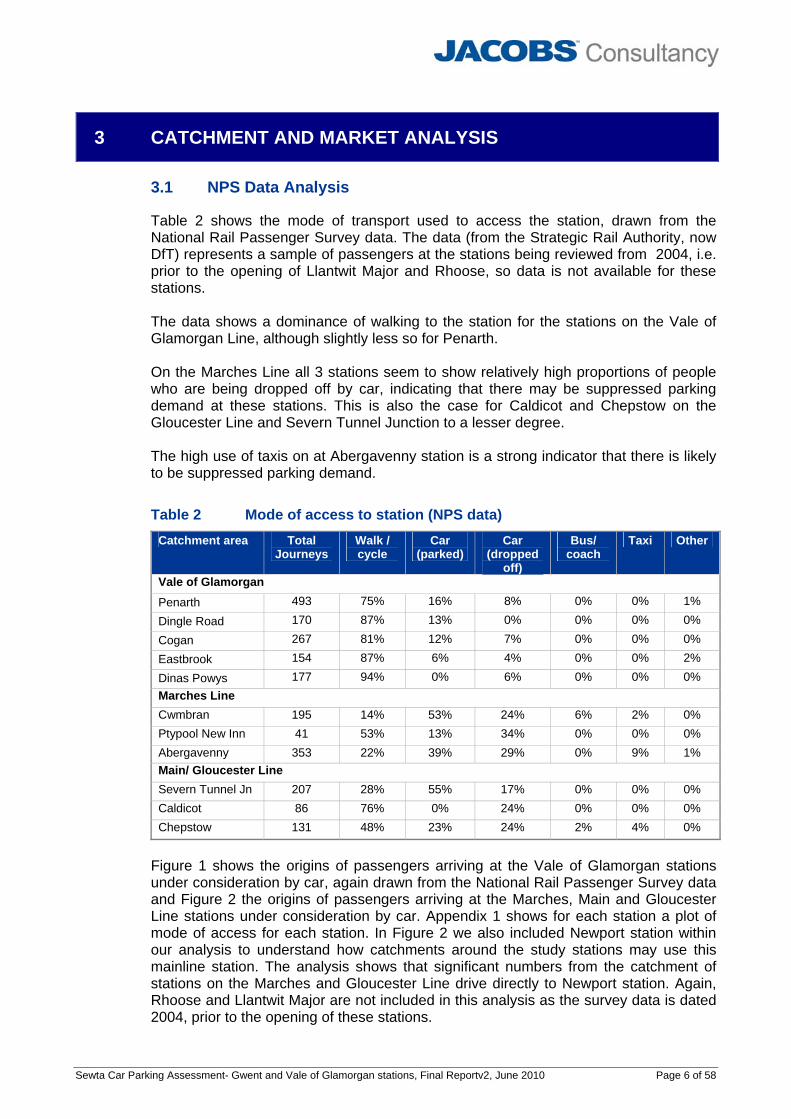
Table 2 shows the mode of transport used to access the station, drawn from the National Rail Passenger Survey data. The data (from the Strategic Rail Authority, now DfT) represents a sample of passengers at the stations being reviewed from 2004, i.e. prior to the opening of Llantwit Major and Rhoose, so data is not available for these stations. The data shows a dominance of walking to the station for the stations on the Vale of Glamorgan Line, although slightly less so for Penarth. On the Marches Line all 3 stations seem to show relatively high proportions of people who are being dropped off by car, indicating that there may be suppressed parking demand at these stations. This is also the case for Caldicot and Chepstow on the Gloucester Line and Severn Tunnel Junction to a lesser degree. The high use of taxis on at Abergavenny station is a strong indicator that there is likely to be suppressed parking demand.
Table 2 Mode of access to station (NPS data) Catchment area Total
Journeys Walk / cycle
Car (parked)
Car (dropped
off)
Bus/ coach
Taxi Other
Vale of Glamorgan
Penarth 493 75% 16% 8% 0% 0% 1%
Dingle Road 170 87% 13% 0% 0% 0% 0%
Cogan 267 81% 12% 7% 0% 0% 0%
Eastbrook 154 87% 6% 4% 0% 0% 2%
Dinas Powys 177 94% 0% 6% 0% 0% 0% Marches Line Cwmbran 195 14% 53% 24% 6% 2% 0% Ptypool New Inn 41 53% 13% 34% 0% 0% 0% Abergavenny 353 22% 39% 29% 0% 9% 1% Main/ Gloucester Line Severn Tunnel Jn 207 28% 55% 17% 0% 0% 0% Caldicot 86 76% 0% 24% 0% 0% 0% Chepstow 131 48% 23% 24% 2% 4% 0%
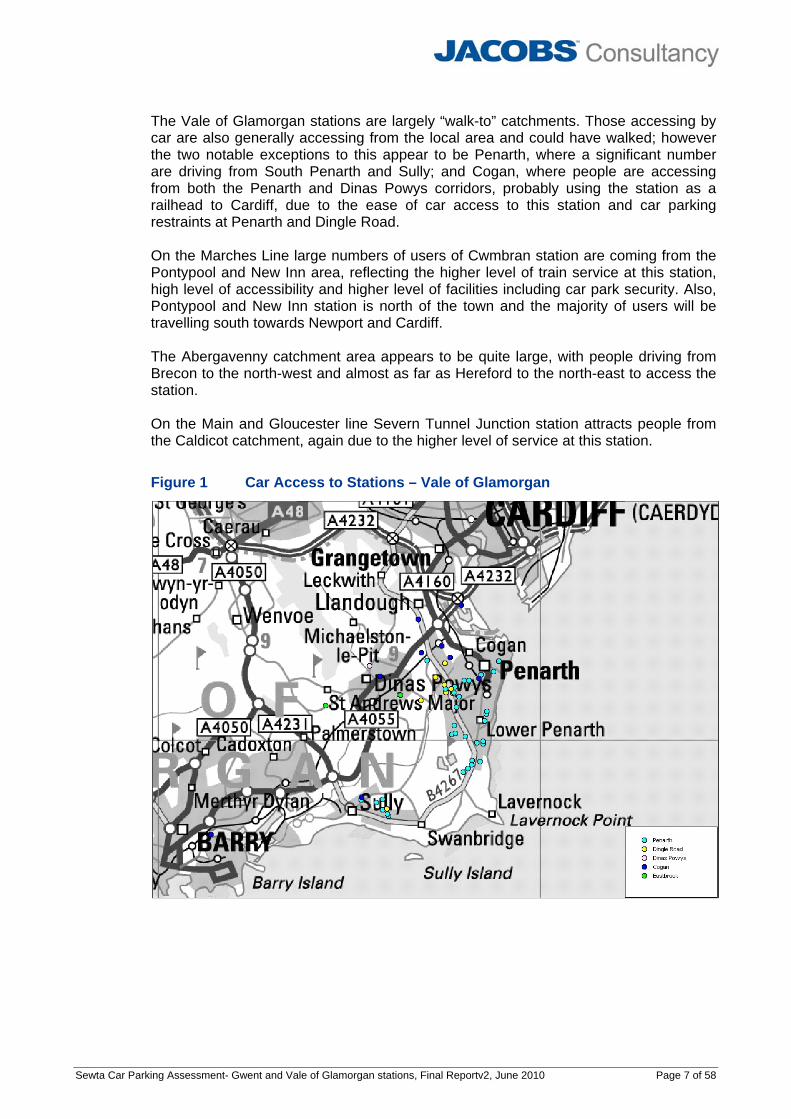
Figure 1 shows the origins of passengers arriving at the Vale of Glamorgan stations under consideration by car, again drawn from the National Rail Passenger Survey data and Figure 2 the origins of passengers arriving at the Marches, Main and Gloucester Line stations under consideration by car. Appendix 1 shows for each station a plot of mode of access for each station. In Figure 2 we also included Newport station within our analysis to understand how catchments around the study stations may use this mainline station. The analysis shows that significant numbers from the catchment of stations on the Marches and Gloucester Line drive directly to Newport station. Again, Rhoose and Llantwit Major are not included in this analysis as the survey data is dated 2004, prior to the opening of these stations.
Sewta Car Parking Assessment- Gwent and Vale of Glamorgan stations, Final Reportv2, June 2010 Page 7 of 58
The Vale of Glamorgan stations are largely “walk-to” catchments. Those accessing by car are also generally accessing from the local area and could have walked; however the two notable exceptions to this appear to be Penarth, where a significant number are driving from South Penarth and Sully; and Cogan, where people are accessing from both the Penarth and Dinas Powys corridors, probably using the station as a railhead to Cardiff, due to the ease of car access to this station and car parking restraints at Penarth and Dingle Road. On the Marches Line large numbers of users of Cwmbran station are coming from the Pontypool and New Inn area, reflecting the higher level of train service at this station, high level of accessibility and higher level of facilities including car park security. Also, Pontypool and New Inn station is north of the town and the majority of users will be travelling south towards Newport and Cardiff. The Abergavenny catchment area appears to be quite large, with people driving from Brecon to the north-west and almost as far as Hereford to the north-east to access the station. On the Main and Gloucester line Severn Tunnel Junction station attracts people from the Caldicot catchment, again due to the higher level of service at this station.
Figure 1 Car Access to Stations – Vale of Glamorgan

Sewta Car Parking Assessment- Gwent and Vale of Glamorgan stations, Final Reportv2, June 2010 Page 8 of 58
Figure 2 Car Access to stations- Marches, Main and Gloucester Line
3.2 Census Data Analysis
From the analysis of the locations of the origins of people arriving by car at stations, station catchment areas were defined for the analysis of Census data. Figure 3 shows the defined catchment for the Vale of Glamorgan east stations, Figure 4 the Vale of Glamorgan west stations and Figure 5 the Marches, Main and Gloucester Line stations. On the Vale of Glamorgan Line we have defined an area for a potential new station at St Athans as we understand this is an aspiration. For the Gloucester Line we have not marked a catchment for Caldicot, but instead include this in the Severn Tunnel catchment as this the data indicates people are driving to Severn Tunnel Junction from the Caldicot area and there is no potential to expand at Caldicot. We have not defined a catchment for Llanwern within this analysis, although it is likely that some of the Magor users would transfer to this station and this is considered in our station specific analysis in section 4.

Sewta Car Parking Assessment- Gwent and Vale of Glamorgan stations, Final Reportv2, June 2010 Page 9 of 58
Figure 3 Defined Parking Catchment Area – Vale of Glamorgan (East)
Figure 4 Defined Parking Catchment area – Vale of Glamorgan (West)
Sewta Car Parking Assessment- Gwent and Vale of Glamorgan stations, Final Reportv2, June 2010 Page 10 of 58
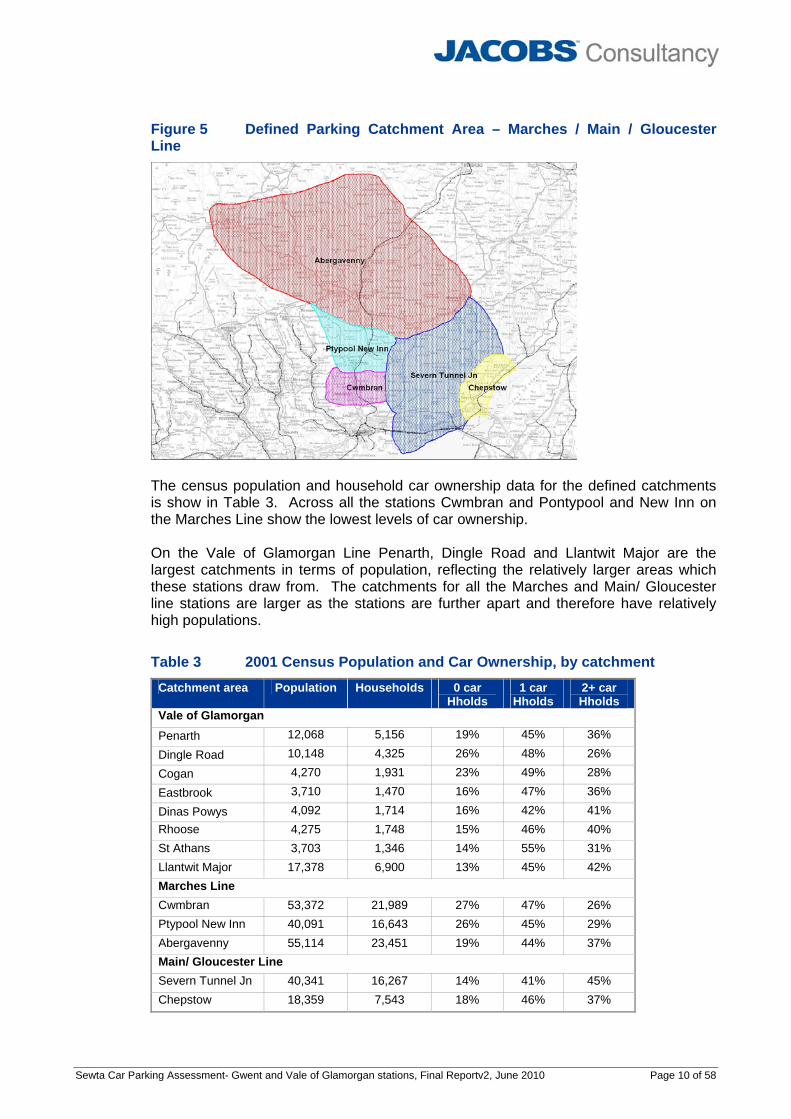
Figure 5 Defined Parking Catchment Area – Marches / Main / Gloucester Line
The census population and household car ownership data for the defined catchments is show in Table 3. Across all the stations Cwmbran and Pontypool and New Inn on the Marches Line show the lowest levels of car ownership. On the Vale of Glamorgan Line Penarth, Dingle Road and Llantwit Major are the largest catchments in terms of population, reflecting the relatively larger areas which these stations draw from. The catchments for all the Marches and Main/ Gloucester line stations are larger as the stations are further apart and therefore have relatively high populations.
Table 3 2001 Census Population and Car Ownership, by catchment Catchment area Population Households 0 car
Hholds 1 car
Hholds 2+ car Hholds
Vale of Glamorgan
Penarth 12,068 5,156 19% 45% 36%
Dingle Road 10,148 4,325 26% 48% 26%
Cogan 4,270 1,931 23% 49% 28%
Eastbrook 3,710 1,470 16% 47% 36%
Dinas Powys 4,092 1,714 16% 42% 41% Rhoose 4,275 1,748 15% 46% 40% St Athans 3,703 1,346 14% 55% 31% Llantwit Major 17,378 6,900 13% 45% 42% Marches Line Cwmbran 53,372 21,989 27% 47% 26% Ptypool New Inn 40,091 16,643 26% 45% 29% Abergavenny 55,114 23,451 19% 44% 37% Main/ Gloucester Line Severn Tunnel Jn 40,341 16,267 14% 41% 45% Chepstow 18,359 7,543 18% 46% 37%

Sewta Car Parking Assessment- Gwent and Vale of Glamorgan stations, Final Reportv2, June 2010 Page 11 of 58
Table 4 shows the breakdown of journeys to work by travel mode for journeys from each catchment area to Cardiff City Centre. For the purposes of our analysis Cardiff City Centre has been defined as within walking distance of the central rail stations, including the University. This shows a relatively high level of train use as a result of the high level of rail access to the City Centre. Note that the mode share by public transport to the whole of Cardiff would be significantly lower. We have excluded Rhoose and Llantwit Major from this analysis as the Census 2001 data is prior to these stations opening and therefore the results would not be representative.
Table 4 2001 Census Journey to Work in Cardiff City Centre Station Catchment
% car driven
and parked
% car passen
gers
% Train % Bus
% walk/ cycle
% Other *
Total Journeys
Vale of Glamorgan Penarth 66% 8% 10% 11% 3% 1% 1549 Dingle Road 61% 10% 13% 10% 4% 2% 1382 Cogan 57% 10% 3% 15% 9% 6% 880 Eastbrook 63% 11% 17% 4% 2% 2% 525 Dinas Powys 71% 10% 14% 3% 0% 2% 548 Marches Line Cwmbran 73% 6% 13% 6% 0% 2% 632 Ptypool & New Inn 74% 5% 9% 11% 0% 1% 392 Abergavenny 81% 3% 16% 0% 0% 1% 339 Main/Gloucester Line Severn Tunnel Junction
82% 5% 10% 1% 0% 2% 651
Chepstow 79% 6% 13% 1% 0% 1% 202 Total 69% 8% 10% 9% 3% 2% 8739
* Majority relates to people who work mainly at home. Table 5 shows the breakdown of journeys to work by travel mode for journeys from each catchment area to Bristol City Centre. For the purposes of our analysis Bristol City centre has been defined as the 800m walk catchment around Bristol Temple Meads, Bristol Parkway and Filton Abbey Wood stations.
Table 5 2001 Census Journey to Work in Bristol City Centre Station Catchment
% car driven
and parked
% car passen
gers
% Train % Bus % motorcycle
Total Journeys
Vale of Glamorgan Penarth 91% 0% 0% 0% 9% 1 Dingle Road 62% 0% 9% 0% 29% 9 Cogan 87% 0% 3% 10% 0% 3 Eastbrook 0% 0% 85% 15% 0% 0 Dinas Powys 0% 0% 100% 0% 0% 2 Marches Line Cwmbran 79% 4% 16% 0% 1% 31 Ptypool & New Inn 78% 0% 22% 0% 0% 22 Abergavenny 80% 0% 20% 0% 0% 18

Sewta Car Parking Assessment- Gwent and Vale of Glamorgan stations, Final Reportv2, June 2010 Page 12 of 58
Main/Gloucester Line Severn Tunnel Jn 74% 2% 14% 5% 5% 182 Chepstow 72% 7% 3% 15% 3% 131 Total 73% 4% 11% 7% 4% 405
The Vale of Glamorgan catchments have been included within this analysis for completeness, but as might be expected due to the distance to Bristol there are a very low number of journeys from these areas. Again, Rhoose and Llantwit Major stations have been excluded from our analysis as the Census 2001 data is prior to these stations opening. The Marches Line also shows a relatively low number of journeys, but a reasonable high share of these are made by rail. Chepstow shows a high number of journeys, but a low share for rail, as opposed to Severn Tunnel Junction where, again, there are a high number of journeys and rail captures 14% of the share. Table 6 shows the proportion of employed people in the corridor working in either Cardiff City Centre or Bristol City Centre. On the Vale of Glamorgan Line, where the vast majority of trips are to Cardiff the results are much as we might expect, with the proportions falling in relation to the distance of the station from the city. On this table the results for Rhoose, Llantwit Major and St Athans are shown, although these results should be treated with caution as they are likely to have increased since the opening of the rail stations at Rhoose and Llantwit Major. On the Marches line the majority of demand is to Cardiff and the proportions are low, as might be expected given the distance from Cardiff. On the Main/ Gloucester Line around the half the demand at Chepstow is to Bristol and half to Cardiff, at Severn Tunnel Junction 3% is to Cardiff and 1% to Bristol.
Table 6 2001 Census Journey to Work in Cardiff vs Employed Station Catchment Employed Persons Journeys to work in
Cardiff CC or Bristol CC
% working in Cardiff CC or Bristol CC
Vale of Glamorgan Penarth 5,119 1,550 30% Dingle Road 4,552 1,391 31% Cogan 2,144 883 41% Eastbrook 1,683 525 31% Dinas Powys 1,884 550 29% Rhoose 2,020 366 18% St Athans 1,849 224 12% Llantwit Major 7,998 1,055 13% Marches Line Cwmbran 22,035 663 3% Ptypool & New Inn 16,247 414 3% Abergavenny 24,081 357 1%
Sewta Car Parking Assessment- Gwent and Vale of Glamorgan stations, Final Reportv2, June 2010 Page 13 of 58
Main/Gloucester Line Severn Tunnel Jn 18,891 833 4% Chepstow 8,607 333 4% Total 117,110 9,144 8%
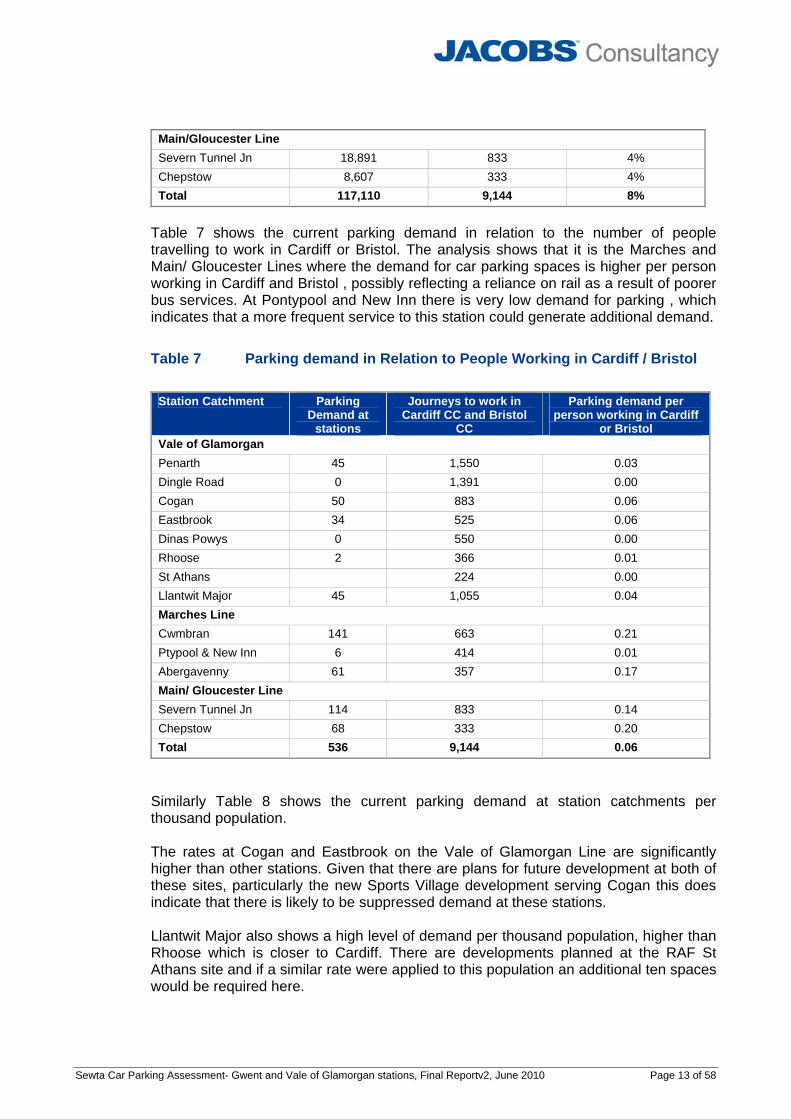
Table 7 shows the current parking demand in relation to the number of people travelling to work in Cardiff or Bristol. The analysis shows that it is the Marches and Main/ Gloucester Lines where the demand for car parking spaces is higher per person working in Cardiff and Bristol , possibly reflecting a reliance on rail as a result of poorer bus services. At Pontypool and New Inn there is very low demand for parking , which indicates that a more frequent service to this station could generate additional demand.
Table 7 Parking demand in Relation to People Working in Cardiff / Bristol
Station Catchment Parking Demand at
stations
Journeys to work in Cardiff CC and Bristol
CC
Parking demand per person working in Cardiff
or Bristol Vale of Glamorgan Penarth 45 1,550 0.03 Dingle Road 0 1,391 0.00 Cogan 50 883 0.06 Eastbrook 34 525 0.06 Dinas Powys 0 550 0.00 Rhoose 2 366 0.01 St Athans 224 0.00 Llantwit Major 45 1,055 0.04 Marches Line Cwmbran 141 663 0.21 Ptypool & New Inn 6 414 0.01 Abergavenny 61 357 0.17 Main/ Gloucester Line Severn Tunnel Jn 114 833 0.14 Chepstow 68 333 0.20 Total 536 9,144 0.06
Similarly Table 8 shows the current parking demand at station catchments per thousand population. The rates at Cogan and Eastbrook on the Vale of Glamorgan Line are significantly higher than other stations. Given that there are plans for future development at both of these sites, particularly the new Sports Village development serving Cogan this does indicate that there is likely to be suppressed demand at these stations. Llantwit Major also shows a high level of demand per thousand population, higher than Rhoose which is closer to Cardiff. There are developments planned at the RAF St Athans site and if a similar rate were applied to this population an additional ten spaces would be required here.

Sewta Car Parking Assessment- Gwent and Vale of Glamorgan stations, Final Reportv2, June 2010 Page 14 of 58
Table 8 Parking Demand per Thousand Population
Station Catchment Parking Demand at stations
Population Parking demand/000s population
Vale of Glamorgan Penarth 45 12,068 3.73 Dingle Road 0 10,148 0.00 Cogan 50 4,270 11.71 Eastbrook 34 3,710 9.16 Dinas Powys 0 4,092 0.00 Rhoose 2 4,275 0.47 St Athans 3,703 0.00 Llantwit Major 45 17,378 2.59 Marches Line Cwmbran 141 53,372 2.64 Ptypool & New Inn 6 40,091 0.15 Abergavenny 61 55,114 1.11 Main/ Gloucester Line Severn Tunnel Jn 114 40,341 2.83 Chepstow 68 18,359 3.70
3.3 Rail Demand Data Analysis
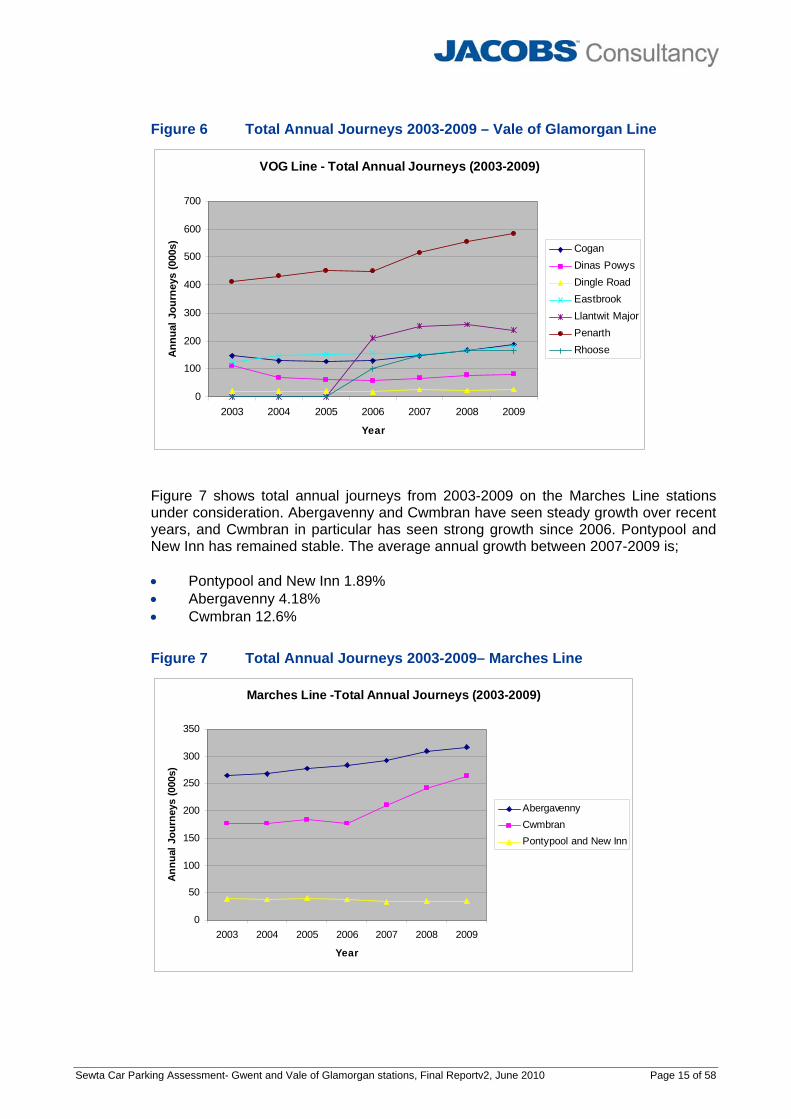
We have used MOIRA (2002/03 to 2008/09 data) to analyse the current and historical demand at the study stations. Figure 6 shows total annual journeys from 2003-2009 on the Vale of Glamorgan stations under consideration. The VOG stations have seen variable performances over recent years. The average annual growth between 2007-2009 by station is • Llantwit Major -3.24% • Dingle Road 0.2% • Rhoose 1.89% • Penarth 6.91% • Eastbrook 10.25% • Dinas Powys 11.46% • Cogan 13.64%
Sewta Car Parking Assessment- Gwent and Vale of Glamorgan stations, Final Reportv2, June 2010 Page 15 of 58
Figure 6 Total Annual Journeys 2003-2009 – Vale of Glamorgan Line
VOG Line - Total Annual Journeys (2003-2009)
0
100
200
300
400
500
600
700
2003 2004 2005 2006 2007 2008 2009
Year
Ann
ual J
ourn
eys
(000
s) CoganDinas PowysDingle RoadEastbrookLlantwit MajorPenarthRhoose
Figure 7 shows total annual journeys from 2003-2009 on the Marches Line stations under consideration. Abergavenny and Cwmbran have seen steady growth over recent years, and Cwmbran in particular has seen strong growth since 2006. Pontypool and New Inn has remained stable. The average annual growth between 2007-2009 is; • Pontypool and New Inn 1.89% • Abergavenny 4.18% • Cwmbran 12.6%
Figure 7 Total Annual Journeys 2003-2009– Marches Line
Marches Line -Total Annual Journeys (2003-2009)
0
50
100
150
200
250
300
350
2003 2004 2005 2006 2007 2008 2009
Year
Annu
al J
ourn
eys
(000
s)
AbergavennyCwmbranPontypool and New Inn

Sewta Car Parking Assessment- Gwent and Vale of Glamorgan stations, Final Reportv2, June 2010 Page 16 of 58
Figure 8 shows total annual journeys from 2003-2009 on the Main and Gloucester Line stations under consideration. Caldicot, Chepstow and Severn Tunnel Junction have all seen steady growth over recent years, and Chepstow in particular has seen strong growth in the last couple of years. The average annual growth between 2007-2009 is; • Severn Tunnel Junction 5.52% • Caldicot 6.82% • Chepstow 15.42%
Figure 8 Total Annual Journeys 2003-2009 – Main/ Gloucester Line
Main / Gloucester Line - Total Annual Journeys ( 2003-2009)
0
20
40
60
80
100
120
140
160
180
2003 2004 2005 2006 2007 2008 2009
Year
Ann
ual J
ourn
eys
(000
s)
CaldicotChepstowSevern Tunnel Junction
3.4 Suppressed Parking Demand and Future Requirements
3.4.1 Implied demand from NPS data
Table 2 in section 3.1 above shows from National Passenger Survey data the percentage of people who drive and park at or near the station. Applying these percentages to the actual demand at the station, assuming that 85% of demand occurs on a weekday, provides an implied car parking demand for each station and so an indication of suppressed demand. The results of this analysis are shown in Table 9. Rhoose and Llantwit Major are excluded from this analysis as the NPS data is prior to these stations opening. The analysis shows that at 3 stations; Penarth, Cwmbran and Abergavenny there are large shortfalls between the observed parking demand and that which we would expect from the NPS data. Given that at all three of these stations the car park is at or very close to capacity this does indicate that there is currently suppressed demand at these stations, with people parking close by rather than at the station car park or railheading and driving from this catchment to another rail station. The highest shortfall is at Abergavenny and the car park charge at this station probably plays a part in some users choosing to park free nearby and walk, rather than at the station car park. A shortfall can also be seen, albeit to a lesser degree at Severn Tunnel Junction.

Sewta Car Parking Assessment- Gwent and Vale of Glamorgan stations, Final Reportv2, June 2010 Page 17 of 58
Table 9 Implied demand and potential suppressed demand from NPS analysis
Station Total annual
journeys 2009 (000s)
% who drive to station
Implied daily
demand
Actual daily
demand
Implied Surplus/ shortfall -
suppressed demand
Vale of Glamorgan
Penarth 585 16% 153 45 -108
Dingle Road 26 13% 5 0 -5
Cogan 188 12% 37 50 13
Eastbrook 182 6% 18 34 16
Dinas Powys 81 0% 0 0 0 Marches Line Cwmbran 263 53% 228 141 -87 Ptypool New Inn 35 13% 7 6 -1 Abergavenny 316 39% 202 61 -141 Main/ Gloucester Line Severn Tunnel Jn 149 55% 134 114 -20 Chepstow 169 23% 63 68 5
3.4.2 Future parking requirements
In order to assess the future car parking demand we have taken the existing demand and assumed that this grows in line with forecast rail demand. We have tested a range of rail demand growth forecasts:
1. RUS forecasts; 2.35% to 2018, 0.93% 2019-2026, no growth beyond 2026. 2. SEWTA forecasts; 2.25% each year with no cut off.
3. RPA “High” forecasts; 4.18% to 2018, 2.3% 2018-2026, no growth beyond
2026.
4. Station actual average growth 2007-2009 applied until 2018, SEWTA growth of 2.25% applied for all years beyond this.
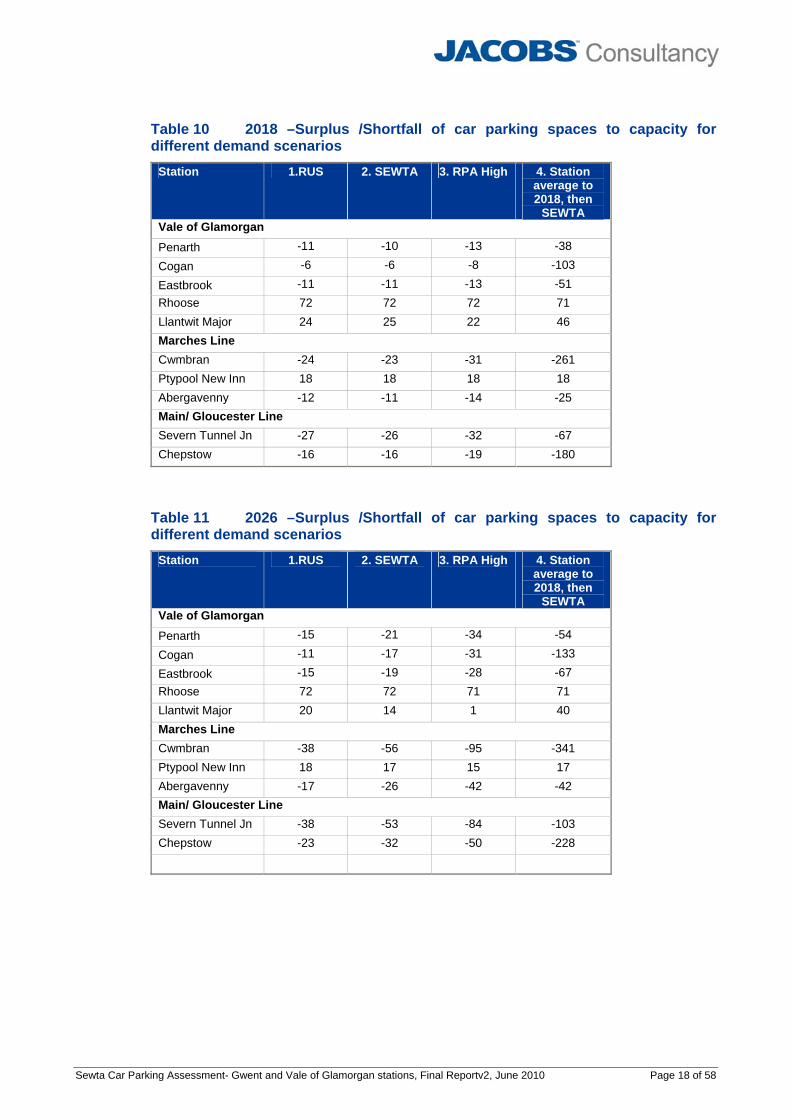
We have taken the existing car park demand, uplifted by the relevant growth rate year on year, and then compared this to the car parking capacity at the site to evaluate the surplus / shortfall of car parking spaces. This analysis does not take account of the potential existing shortfall in supply identified in the section above, which would be additional. The analysis results are shown in Table 10 for 2018 and Table 11 for 2026.
Sewta Car Parking Assessment- Gwent and Vale of Glamorgan stations, Final Reportv2, June 2010 Page 18 of 58
Table 10 2018 –Surplus /Shortfall of car parking spaces to capacity for different demand scenarios
Station 1.RUS 2. SEWTA 3. RPA High 4. Station average to 2018, then
SEWTA Vale of Glamorgan
Penarth -11 -10 -13 -38
Cogan -6 -6 -8 -103
Eastbrook -11 -11 -13 -51 Rhoose 72 72 72 71 Llantwit Major 24 25 22 46 Marches Line Cwmbran -24 -23 -31 -261 Ptypool New Inn 18 18 18 18 Abergavenny -12 -11 -14 -25 Main/ Gloucester Line Severn Tunnel Jn -27 -26 -32 -67 Chepstow -16 -16 -19 -180
Table 11 2026 –Surplus /Shortfall of car parking spaces to capacity for different demand scenarios
Station 1.RUS 2. SEWTA 3. RPA High 4. Station average to 2018, then
SEWTA Vale of Glamorgan
Penarth -15 -21 -34 -54
Cogan -11 -17 -31 -133
Eastbrook -15 -19 -28 -67 Rhoose 72 72 71 71 Llantwit Major 20 14 1 40 Marches Line Cwmbran -38 -56 -95 -341 Ptypool New Inn 18 17 15 17 Abergavenny -17 -26 -42 -42 Main/ Gloucester Line Severn Tunnel Jn -38 -53 -84 -103 Chepstow -23 -32 -50 -228

Sewta Car Parking Assessment- Gwent and Vale of Glamorgan stations, Final Reportv2, June 2010 Page 19 of 58
4 STATION SPECIFIC ANALYSIS
This section analyses and discusses for each of the stations being reviewed: • The location of the station and potential land for car park development; • The key findings from the analysis above; • An analysis of the key flows at the station, based on a review of the top flows (
over 1,000 journeys per annum) from Moira 2009 data; • Discussion of station specific issues and objectives raised by the relevant local
councils, and; • Recommendations for the site. 4.1 Vale of Glamorgan
4.1.1 Penarth
Penarth station has a small (15 spaces) station car park, with car parking directly in front of the station building. In addition to this there is a further highways owned car park for approximately 30 vehicles on the approach to the station. We have been advised that these car parks both have short term (2 hour) parking restrictions. Observations suggest that this car park is more commonly used for local shopping rather than for station traffic. The station is served by 4 trains an hour to Cardiff, 3 of which go on to Bargoed, with 1 continuing onto Rhymney.
Figure 9 Aerial photograph of Penarth Station

Sewta Car Parking Assessment- Gwent and Vale of Glamorgan stations, Final Reportv2, June 2010 Page 20 of 58
An aerial photo of the site indicates that there is limited potential for the development of further car parking. Any development is likely to be on the road directly to the south of the station building, where cars can be seen to be parked in a somewhat haphazard way. These cars relate to the industrial units and development is likely to be opposed. Station statistics indicate: • 585k journeys per annum ( which equates to around 940 return trips a day) • 65% of all journeys are to Cardiff BR • A further 24% of all journeys are within the valleys, 5% to main line stations to the
east of Cardiff ( Newport, Bristol and Bath) and 2% to stations to main line stations to the west of Cardiff ( Bridgend, Swansea). The remaining flows are below 1,000 journeys per annum.
• NPS data indicates that 75% walk or cycle to the station, with 16% parking at or near the station and 8% being dropped off. This is the highest level of car access for all the VOG stations being assessed.
• Journey to work data indicates that train accounts for 10% of the market to Cardiff, with 11% using bus, 66% driving and parking, 8% being driven and 4% walking or cycling.
• Applying NPS data to total journeys indicates a high level (over 100 cars a day) of parking suppression and / or people parking at nearby locations or using another rail station.
• Applying growth rates to existing capacity and usage levels indicates that in 2018 the shortfall in car parking is between the range of 11-38 cars and in 2026 between 15 and 54.
The Vale of Glamorgan Council believe that any development of parking facilities which would increase car access to the station and therefore traffic congestion within the town centre which would be strongly opposed. Strategically, they intend to continue to promote this station as a location to be accessed by walk/ cycle and public transport and have no plans or aspirations to develop parking at this site. Recommendation : Although significant levels of parking suppression have been identified there is no scheme to progress due to a shortage of land and opposition to car park development at this town centre location. We would recommend that alternative solutions are developed, such as alternative park and ride solutions at neighbouring stations, connecting bus shuttle services or even a new station to the south east of Penarth, towards Sully. 4.1.2 Dingle Road
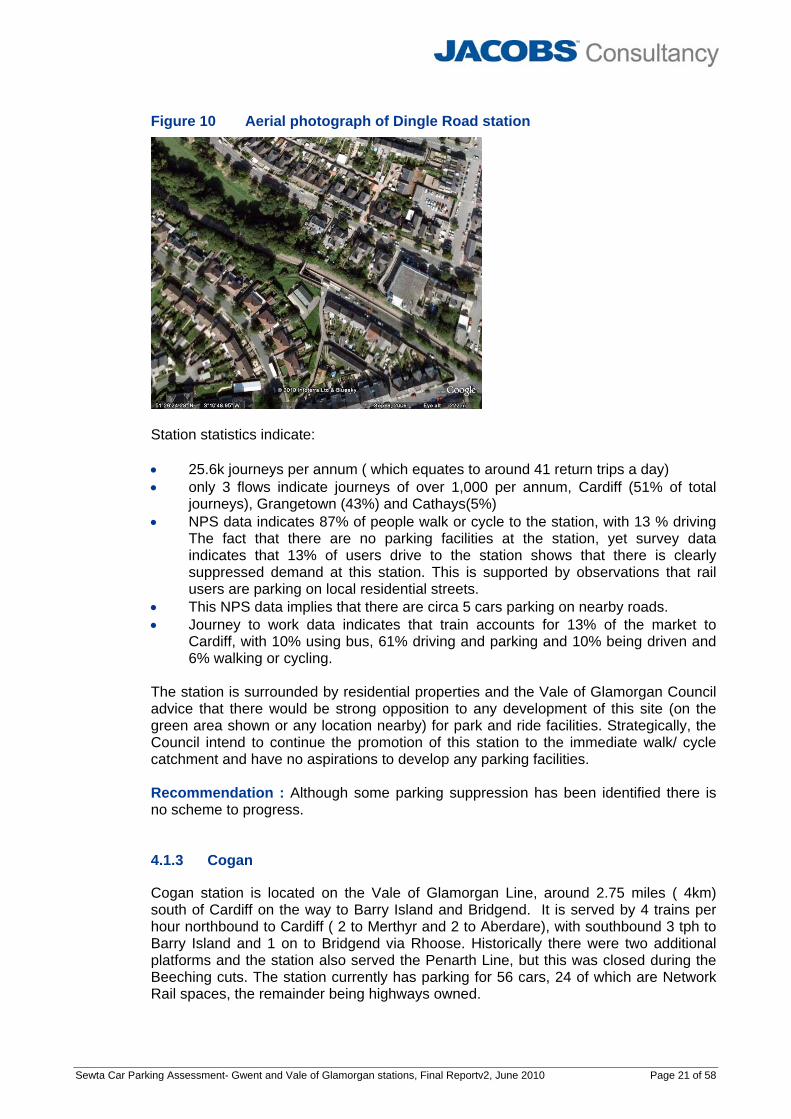
Dingle Road railway station is a halt station located on a fairly steep gradient and surrounded by residential housing. The station is served by 4 trains an hour to Cardiff, 3 of which go on to Bargoed, with 1 continuing on to Rhymney. There are no car parking facilities at Dingle Road. The aerial photograph below indicates that there would be little scope to provide car parking facilities as the station seems to be surrounded by all sides by residential property; there is a small amount of green, undeveloped land to the west of the station, but the Council are of the opinion that the development of this land would be strongly opposed.
Sewta Car Parking Assessment- Gwent and Vale of Glamorgan stations, Final Reportv2, June 2010 Page 21 of 58
Figure 10 Aerial photograph of Dingle Road station
Station statistics indicate: • 25.6k journeys per annum ( which equates to around 41 return trips a day) • only 3 flows indicate journeys of over 1,000 per annum, Cardiff (51% of total
journeys), Grangetown (43%) and Cathays(5%) • NPS data indicates 87% of people walk or cycle to the station, with 13 % driving
The fact that there are no parking facilities at the station, yet survey data indicates that 13% of users drive to the station shows that there is clearly suppressed demand at this station. This is supported by observations that rail users are parking on local residential streets.
• This NPS data implies that there are circa 5 cars parking on nearby roads. • Journey to work data indicates that train accounts for 13% of the market to
Cardiff, with 10% using bus, 61% driving and parking and 10% being driven and 6% walking or cycling.
The station is surrounded by residential properties and the Vale of Glamorgan Council advice that there would be strong opposition to any development of this site (on the green area shown or any location nearby) for park and ride facilities. Strategically, the Council intend to continue the promotion of this station to the immediate walk/ cycle catchment and have no aspirations to develop any parking facilities. Recommendation : Although some parking suppression has been identified there is no scheme to progress. 4.1.3 Cogan
Cogan station is located on the Vale of Glamorgan Line, around 2.75 miles ( 4km) south of Cardiff on the way to Barry Island and Bridgend. It is served by 4 trains per hour northbound to Cardiff ( 2 to Merthyr and 2 to Aberdare), with southbound 3 tph to Barry Island and 1 on to Bridgend via Rhoose. Historically there were two additional platforms and the station also served the Penarth Line, but this was closed during the Beeching cuts. The station currently has parking for 56 cars, 24 of which are Network Rail spaces, the remainder being highways owned.
Sewta Car Parking Assessment- Gwent and Vale of Glamorgan stations, Final Reportv2, June 2010 Page 22 of 58
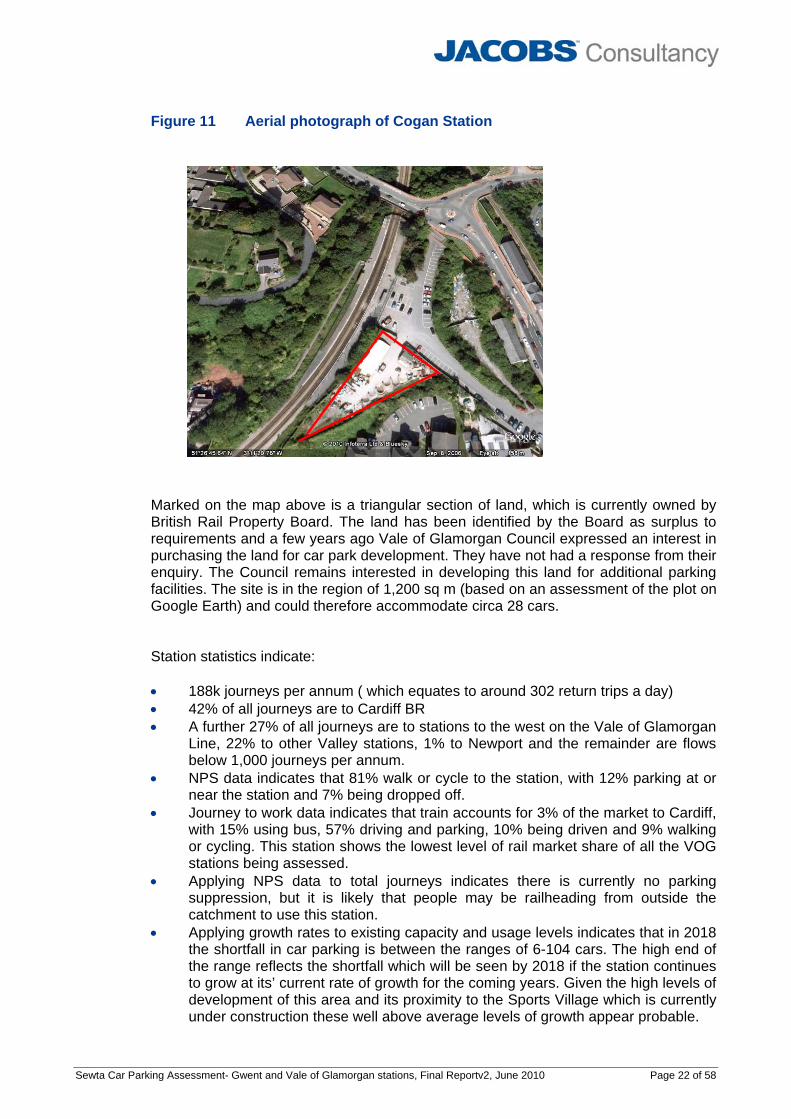
Figure 11 Aerial photograph of Cogan Station
Marked on the map above is a triangular section of land, which is currently owned by British Rail Property Board. The land has been identified by the Board as surplus to requirements and a few years ago Vale of Glamorgan Council expressed an interest in purchasing the land for car park development. They have not had a response from their enquiry. The Council remains interested in developing this land for additional parking facilities. The site is in the region of 1,200 sq m (based on an assessment of the plot on Google Earth) and could therefore accommodate circa 28 cars. Station statistics indicate: • 188k journeys per annum ( which equates to around 302 return trips a day) • 42% of all journeys are to Cardiff BR • A further 27% of all journeys are to stations to the west on the Vale of Glamorgan
Line, 22% to other Valley stations, 1% to Newport and the remainder are flows below 1,000 journeys per annum.
• NPS data indicates that 81% walk or cycle to the station, with 12% parking at or near the station and 7% being dropped off.
• Journey to work data indicates that train accounts for 3% of the market to Cardiff, with 15% using bus, 57% driving and parking, 10% being driven and 9% walking or cycling. This station shows the lowest level of rail market share of all the VOG stations being assessed.
• Applying NPS data to total journeys indicates there is currently no parking suppression, but it is likely that people may be railheading from outside the catchment to use this station.
• Applying growth rates to existing capacity and usage levels indicates that in 2018 the shortfall in car parking is between the ranges of 6-104 cars. The high end of the range reflects the shortfall which will be seen by 2018 if the station continues to grow at its’ current rate of growth for the coming years. Given the high levels of development of this area and its proximity to the Sports Village which is currently under construction these well above average levels of growth appear probable.
Sewta Car Parking Assessment- Gwent and Vale of Glamorgan stations, Final Reportv2, June 2010 Page 23 of 58
Recommendation : Although the NPS analysis indicates that there is currently no suppressed parking this station it is likely that it is already being used as a railhead station by those outside the catchment (particularly Penarth and Dingle Road catchments) and this could be built upon by developing the car parking facilities. The station has seen growth well above average in the last few years and this is likely to continue given the development plans in the local area. The obvious site is the area immediately to the south of the existing parking, as this would require little in the way of access costs and has been earmarked as surplus to requirements by BRBR. We have therefore undertaken an economic appraisal of the marked site. 4.1.4 Eastbrook
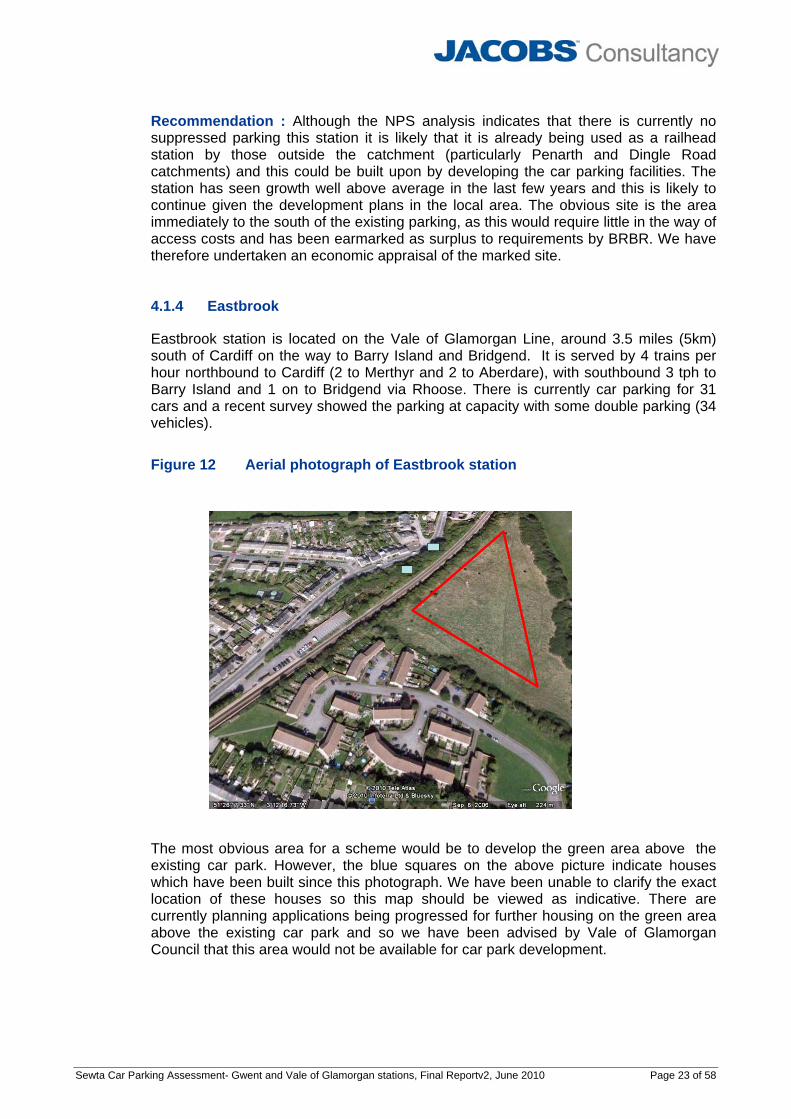
Eastbrook station is located on the Vale of Glamorgan Line, around 3.5 miles (5km) south of Cardiff on the way to Barry Island and Bridgend. It is served by 4 trains per hour northbound to Cardiff (2 to Merthyr and 2 to Aberdare), with southbound 3 tph to Barry Island and 1 on to Bridgend via Rhoose. There is currently car parking for 31 cars and a recent survey showed the parking at capacity with some double parking (34 vehicles).
Figure 12 Aerial photograph of Eastbrook station
The most obvious area for a scheme would be to develop the green area above the existing car park. However, the blue squares on the above picture indicate houses which have been built since this photograph. We have been unable to clarify the exact location of these houses so this map should be viewed as indicative. There are currently planning applications being progressed for further housing on the green area above the existing car park and so we have been advised by Vale of Glamorgan Council that this area would not be available for car park development.

Sewta Car Parking Assessment- Gwent and Vale of Glamorgan stations, Final Reportv2, June 2010 Page 24 of 58
An alternative location for a park and ride site, agreed in discussion with the VOG council is the field over the railway line from the station entrance and marked in red on the photograph above. This site is in the region of 9,000 sq m (based on an assessment of the plot on Google Earth) and could therefore accommodate circa 214 cars. Station statistics indicate: • 182k journeys per annum ( which equates to around 292 return trips a day) • 67% of all journeys are to Cardiff BR • A further 7% of all journeys are to Cathays, 10% between the 3 Barry stations
and Cadoxton, 10% to other valley stations, 1% to Newport and the remainder are flows below 1,000 journeys per annum.
• NPS data indicates that 87% walk or cycle to the station, with 12% parking at or near the station and 7% being dropped off.
• Journey to work data indicates that train accounts for 17% of the market to Cardiff, with 4% using bus, 63% driving and parking, 11% being driven and 2% walking or cycling.
• Applying NPS data to total journeys indicates there is currently no car parking suppression.
• Applying growth rates to existing capacity and usage levels indicates that in 2018 the shortfall in car parking is between the ranges of 11-53 cars. The high end of the range reflects the shortfall which will be seen by 2018 if the station continues to grow at its’ current rate of growth for the coming years. Similar to Cogan station ( although to a slightly lesser degree) Eastbrook station has seen higher than average growth over the last couple of years. By 2026 the shortfall is in the range 15-67 cars.
Recommendation : The analysis indicates that, although there is currently no suppressed parking, this station has seen growth above average in the last few years. The areas immediately adjacent to the existing car park have already or are in the process of being developed, so the proposed site is a field the other side of the railway line to the station. This would require a short access road and a footbridge crossing to the station. The existing footbridge crossing is to the south of the station and would be too far for car park users to utilise. Benchmark costs of £1m have been applied to this scheme for a ramped footbridge and pedestrian access from the car park. The proposed site could be surfaced for car parking on an as required basis; our appraisal costs for the development of half of the site (4,500 sq m and 107 spaces) in 2012. 4.1.5 Dinas Powys
Dinas Powys station is located on the Vale of Glamorgan Line, around 4.5 miles (7km) south west of Cardiff on the way to Barry Island and Bridgend. The station is to the south but within the centre of the town. It is served by 4 trains per hour northbound to Cardiff (2 to Merthyr and 2 to Aberdare), with southbound 3 tph to Barry Island and 1 on to Bridgend via Rhoose. There is currently no car park at Dinas Powys.

Sewta Car Parking Assessment- Gwent and Vale of Glamorgan stations, Final Reportv2, June 2010 Page 25 of 58
Figure 13 Aerial photograph of Dinas Powys station
Station statistics indicate: • 81k journeys per annum ( which equates to around 129 return trips a day) • 46% of all journeys are to Cardiff BR • A further 21% of all journeys are to stations to the west on the Vale of Glamorgan
Line to Rhoose, 12% to stations between Dinas Powys and Cardiff, 5% to other valley stations and the remainder are flows below 1,000 journeys per annum.
• NPS data indicates that 94% walk or cycle to the station, with 6% being dropped off.
• Journey to work data indicates that train accounts for 14% of the market to Cardiff, with 3% using bus, 71% driving and parking, 10% being driven and 0% walking or cycling.
Recommendation : Our analysis does not indicate that there is any suppressed parking demand, although some may be railheading from this catchment to other stations such as Eastbrook. There is no obvious location for a car parking site and any development is likely to be strongly opposed. No scheme to progress. 4.1.6 Rhoose - for Cardiff International Airport (CIA)
Rhoose Cardiff International railway station is located on the Vale of Glamorgan Line, around 11.5 miles (19km) west of Cardiff and was opening in 2005. A dedicated shuttle bus connects the station with the airport terminal building. It is served by an hourly Monday- Saturday service to the east , serving Cardiff Central and on to Merthyr Tydfil and to the west to Bridgend. The service is two- hourly on a Sunday. There is currently a car park with capacity for 74 cars and this is very poorly utilised.

Sewta Car Parking Assessment- Gwent and Vale of Glamorgan stations, Final Reportv2, June 2010 Page 26 of 58
Figure 14 Aerial photograph of Rhoose station
The red square on the figure above marks the existing car park and the station is shown by the red line. Station statistics indicate: • 163k journeys per annum ( which equates to around 261 return trips a day) • 38% of all journeys are to Cardiff BR • A further 10% of all journeys are to Llantwit Major, 22% of all journeys to stations
between Rhoose and Cardiff, 10% to Bridgend , 3% to Swansea, 5% to other valley stations and the remainder are flows below 1,000 journeys per annum.
• There is no NPS data available for the station. • Applying growth rates to existing capacity and usage levels there is no need for
additional car parking capacity.
We have undertaken a simple desk-top based analysis, using the top 16 flows ( those over 1,000 journeys per annum) per which account for 90% of all journeys to understand the impact of a service frequency increase from hourly to half hourly. Applying the journey interval penalties given in PDFH Table B3.5 for non London Interurban flows and an elasticity of -0.9, such a frequency improvement would result in a 12% increase in demand at this station. This level of growth would not warrant an increase in car park capacity in the medium term. Recommendation : The analysis indicates that there is little car park use at this relatively new station. The station has indeed seen a decline in demand in the last couple of years compared to the demand seen on opening in 2005. We would recommend that the focus for this station is to promote the existing facilities. We would also recommend a Station User Survey at this station, where there is no NPS data available.

Sewta Car Parking Assessment- Gwent and Vale of Glamorgan stations, Final Reportv2, June 2010 Page 27 of 58
4.1.7 Llantwit Major
Llantwit Major station is located on the Vale of Glamorgan Line, around 18.25 miles (29km) west of Cardiff. It is served by an hourly Monday- Saturday service to the east , serving Cardiff Central and on to Merthyr Tydfil and to the west to Bridgend. The service is two- hourly on a Sunday. The station opened on 12 June 2005, when passenger services were restored on the section of line between Barry and Bridgend. We have confirmed with Vale of Glamorgan Council that the station car park has capacity for 79 cars, although the National Rail site only reports 40 spaces. The most recent Council survey ( Autumn 2009) shows 45 cars are using the car park, although in Autumn 2007 61 were using the car park.
Figure 15 Aerial photograph of Llantwit Major station
. Station statistics indicate: • 238k journeys per annum ( which equates to around 382 return trips a day). • 37% of all journeys are to Bridgend, which is the top flow rather than Cardiff. • A further 32% of all journeys are to Cardiff, 18% to stations between Llantwit
Major and Cardiff, 3% to other Valley stations, 1% to Swansea, 1% to mainline stations to the east ( Newport and London) and the remainder are flows below 1,000 journeys per annum.
• There is no NPS data available for the station. • Over the medium term (until 2026) the capacity at this relatively new station
appears to be met by the current supply. However, this station has seen an 8% decline in usage between 2008 and 2009 and this could be as a result of car park suppression. As the station only opened in 2005 we do not have NPS data available to analyse to confirm this. In the high growth scenario the existing car park will be full by 2026.
Sewta Car Parking Assessment- Gwent and Vale of Glamorgan stations, Final Reportv2, June 2010 Page 28 of 58
We have undertaken a simple desk-top based analysis, using the top 15 flows ( those over 1,000 journeys per annum) per which account for 92% of all journeys to understand the impact of a service frequency increase from hourly to half hourly. Applying the journey interval penalties given in PDFH Table B3.5 for non London Interurban flows and an elasticity of -0.9, such a frequency improvement would result in a 13% increase in demand at this station. This level of growth would not warrant an increase in car park capacity in the medium term. Recommendation : Any further development of this site to encourage access to the town by car is likely to be strongly opposed. Our analysis indicates that, with the current level of service there is not a need for additional parking until 2026; however the recent decline in usage of this station may be in part be due to car parking suppression, but we have been unable to confirm this due to a lack of survey data at this recently opened station. It is recommended that the short-term strategy for this station should be to promote the station and its’ facilities, followed by a further review of car parking facilities. We would recommend a Station User Survey at this station where no NPS data is available. 4.1.8 St Athans
A full appraisal of a new station at this site is outside the scope of this study. However, we have assessed the impact of a new station at the old site, to the south of St Athans, which would largely serve the village of St Athans and the RAF base. There are plans to develop this military site over the coming years. From a car parking perspective pro rated against the catchment size the new station would require car parking for 10 cars if it were to be used in a similar manner as Llantwit Major. It is likely that those travelling from the west would continue to use Llantwit Major. It is our view that a new station at this site would have a minimal impact in terms of parking requirements at either Llantwit Major or Rhoose. We are advised by VOG Council that a new station at this site is not a current priority. 4.2 Marches Line
4.2.1 Cwmbran
Cwmbran station on the Marches line north of Newport has undergone a recent refurbishment ( in 2008) and this included a larger car park, which now has capacity for 150 cars, a new ticket hall, modern sheltered seating areas and new live departure boards. The train service is hourly to Manchester and West Wales and two- hourly between Holyhead and Cardiff. There are two sites, shown on the figure below, which might be considered as having potential for development. The first is a disused site to the north of the approach road, north of the existing bus depot. We have estimated that preparing this site for use could cost in the region of £200k. It is circa 1,200 sq m and so could accommodate 29 cars. The second is a site south of the station and across the main road, which is at a higher level than the railway. An underpass for pedestrian access may be required at this site and we have estimated that this will have a capital cost of circa £1m. A signalised pedestrian crossing with stairs to access and egress the road has also been tested, with a capital cost of circa £250k. It is 2,700 sq m and so could accommodate 64 cars.

Sewta Car Parking Assessment- Gwent and Vale of Glamorgan stations, Final Reportv2, June 2010 Page 29 of 58
The costs quoted are exclusive of Optimism Bias, risk and Market Price adjustments.
Figure 16 Aerial photograph of Cwmbran station
Station statistics indicate: • 263k journeys per annum ( which equates to around 422 return trips a day) • 17 flows are over 1,000 journeys per annum, with the top 3 accounting for 72% of
all journeys; Cardiff 58%, Newport 6% and Abergavenny 6%. • A further 5% of all journeys are to other stations north on the Marches line, 5% to
main line stations west of Cardiff and valley line stations, 5% to mainline stations east of the bridge ( such as Bristol, Filton and London) and the remainder are flows below 1,000 journeys per annum.
• NPS data indicates that 53% access the station by parking at or near the station, 24% are dropped off, 14% walk or cycle, 6% use the bus and 2% a taxi.
• Journey to work data indicates that train accounts for 13% of the market to Cardiff, with 6% using bus, 73% driving and parking and 6% being driven.
• Applying NPS data to total journeys indicates there is currently an implied car parking suppression of 87 cars.
• Applying growth rates to existing capacity and usage levels indicates that in 2018 the shortfall in car parking is between the ranges of 24-261 cars. The high end of the range reflects the shortfall which will be seen by 2018 if the station continues to grow at its’ current rate of growth for the coming years, which has been much higher than average (12.6% average growth between 2007 and 2009). This high growth must in part be as a result of the station refurbishment and recent car park expansion, which will have released some suppressed demand. By 2026 the shortfall is in the range 38-341 cars.
In addition, it should be noted that there is significant railheading to Cwmbran Station from the vicinity of Pontypool and New Inn Station and the corridors to the North East and North West. Up to a third of Cwmbran car park demand could be originating in those areas and development of the Pontypool and New Inn services and facilities could reduce the pressure for additional parking provision at Cwmbran.

Sewta Car Parking Assessment- Gwent and Vale of Glamorgan stations, Final Reportv2, June 2010 Page 30 of 58
Recommendation : Our analysis indicates that there is a significant level of suppressed demand despite the recent car park expansion and that should the station continue to develop at its existing rate for the next few years there will be a high shortfall in car parking spaces. An economic appraisal has been undertaken on both of the potential schemes. We would also recommend a Station User survey at this station, where the degree of railheading from the Pontypool and New Inn catchment needs to be assessed. 4.2.2 Pontypool and New Inn station
Pontypool and New Inn station is served by a less frequent train service than its neighbouring stations, Cwmbran to the south and Abergavenny to the north. In the off-peak only the two hourly Holyhead service calls at the station, in the peak there is an hourly service. There is a free car park for approximately 25 cars.
Figure 17 Aerial photograph of Pontypool and New Inn Station
There are two potential car park development schemes at Pontypool and New Inn. The first is an expansion at south east side of the current car park and the second is to build a car park between the railway lines on other side of the station, accessing through extending an existing underpass. Station statistics indicate: • 35k journeys per annum ( which equates to around 56 return trips a day). • Only four flows are over 1,000 journeys per annum; Cardiff 58%, Newport 9%,
Bristol Temple Meads 5% and Abergavenny 3%. • NPS data indicates that 53% walk or cycle to the station, with 13% parking at or
near the station and 34% being dropped off. This is a particularly high percentage of people being dropped off, but there is plenty of parking capacity at the station so this is likely to be because the station is on the outskirts of the town, rather than due to a car park shortage.
• Journey to work data indicates that train accounts for 9% of the market to Cardiff, with 11% using bus, 74% driving and parking and 5% being driven.
• Applying NPS data to total journeys indicates that more people are parking nearby than the station car park usage figures imply.
Sewta Car Parking Assessment- Gwent and Vale of Glamorgan stations, Final Reportv2, June 2010 Page 31 of 58
• Applying growth rates to existing capacity and usage levels indicates that there is no shortfall in car parking provision for the existing service levels at the station.
We have undertaken a simple desk-top based analysis, using the top 4 flows ( over 1,000 journeys per annum) which account for 75% of all journeys to understand the impact of a service frequency increase from two hourly to hourly. Applying the journey interval penalties given in PDFH Table B3.5 for non London Interurban flows and an elasticity of -0.9, such a frequency improvement would result in a 20% increase in demand at this station. Such a level of demand increase would not warrant a car park extension in the medium (until 2026) term.
Tables 3 and 6 showed that the Pontypool and New Inn Station catchment has similar levels of car ownership and proportion of people working in Cardiff as Cwmbran station. However, Table 4 shows 4% less access to Cardiff by train, supporting anecdotal customer evidence of a preference to drive to Cardiff or to try and park at Cwmbran. This suggests a subdued demand for parking and use of Pontypool and New Inn Station due to the poor service level and inhospitable parking arrangements.
We have compared the journeys at Pontypool to stations on the Ebbw Vale line where there is a higher service frequency. The total journeys at Ebbw Vale Parkway are 7 times higher than at Pontypool, for intermediate stations the journeys are similar at Llanhilleth, twice as high at Crosskeys and Rogerstone and three times at Newbridge. This does indicate that demand may grow at a higher level than PDFH would predict if there were a service frequency and station facility improvements. However, this would need to be implemented and the results assessed prior to any car park improvement. In the short term even such significant increases could be accommodated by the existing car park. Recommendation : Our analysis indicates that there is currently suppressed demand for use of this station limiting the use of the existing car park. A service frequency increase would increase the use of this station, PDFH based forecasts indicate by circa 20%. However, further analysis would need to be undertaken of the potential to reduce railheading to Cwmbran and Abergavenny Stations and wider benefits. It is recommended that marketing activity is undertaken to grow rail use from this station. Also, further analysis of the potential for frequency improvements, coupled with access and facility improvements should be investigated in parallel to the investigation of providing further parking at Cwmbran station.
4.2.3 Abergavenny
Abergavenny on the Marches line is situated to the south east of the town centre. With a few exceptions the train service is hourly to Manchester and West Wales and two- hourly between Holyhead and Cardiff. The station currently has a car park with capacity for 64 cars which observations suggest is close to capacity and the station charge is £2.
Sewta Car Parking Assessment- Gwent and Vale of Glamorgan stations, Final Reportv2, June 2010 Page 32 of 58
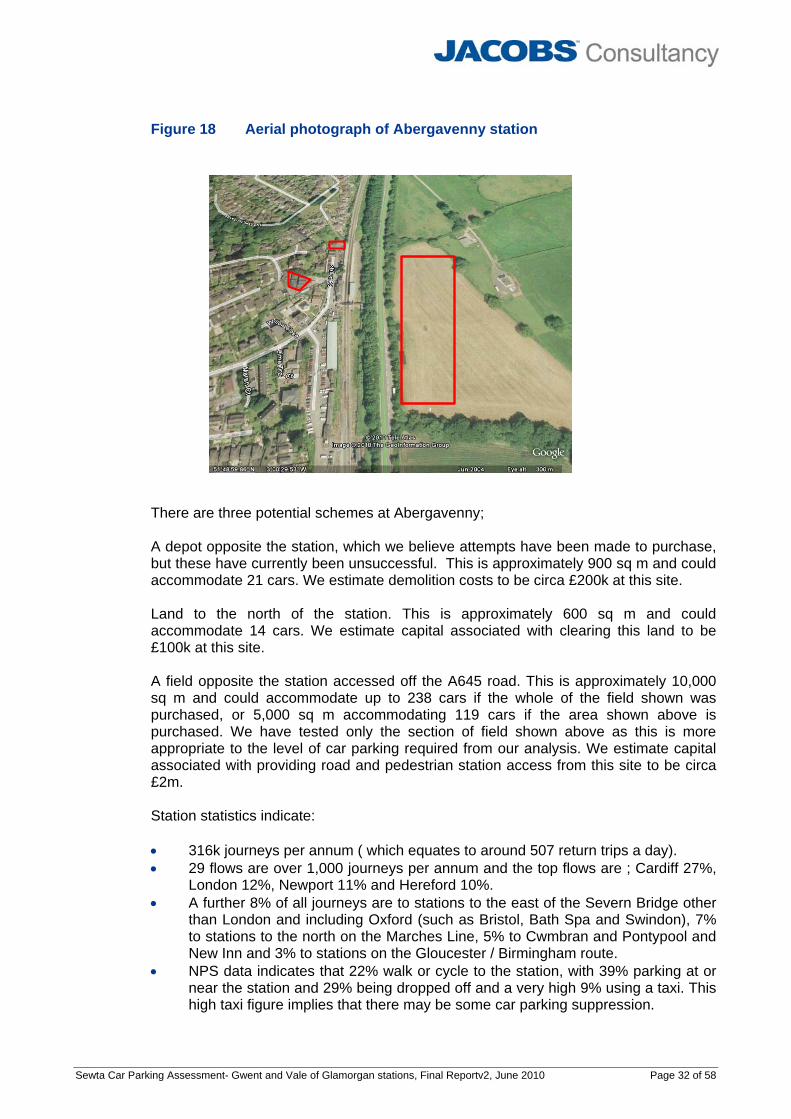
Figure 18 Aerial photograph of Abergavenny station
There are three potential schemes at Abergavenny; A depot opposite the station, which we believe attempts have been made to purchase, but these have currently been unsuccessful. This is approximately 900 sq m and could accommodate 21 cars. We estimate demolition costs to be circa £200k at this site. Land to the north of the station. This is approximately 600 sq m and could accommodate 14 cars. We estimate capital associated with clearing this land to be £100k at this site. A field opposite the station accessed off the A645 road. This is approximately 10,000 sq m and could accommodate up to 238 cars if the whole of the field shown was purchased, or 5,000 sq m accommodating 119 cars if the area shown above is purchased. We have tested only the section of field shown above as this is more appropriate to the level of car parking required from our analysis. We estimate capital associated with providing road and pedestrian station access from this site to be circa £2m. Station statistics indicate: • 316k journeys per annum ( which equates to around 507 return trips a day). • 29 flows are over 1,000 journeys per annum and the top flows are ; Cardiff 27%,
London 12%, Newport 11% and Hereford 10%. • A further 8% of all journeys are to stations to the east of the Severn Bridge other
than London and including Oxford (such as Bristol, Bath Spa and Swindon), 7% to stations to the north on the Marches Line, 5% to Cwmbran and Pontypool and New Inn and 3% to stations on the Gloucester / Birmingham route.
• NPS data indicates that 22% walk or cycle to the station, with 39% parking at or near the station and 29% being dropped off and a very high 9% using a taxi. This high taxi figure implies that there may be some car parking suppression.
Sewta Car Parking Assessment- Gwent and Vale of Glamorgan stations, Final Reportv2, June 2010 Page 33 of 58
• Journey to work data indicates that train accounts for 17% of the market to Cardiff, with 4% using bus, 63% driving and parking, 11% being driven and 2% walking or cycling.
• Applying NPS data to total journeys indicates there is an implied shortfall in car parking of 141 cars.
• Applying growth rates to existing capacity and usage levels indicates that in 2018 the shortfall in car parking is between the range of 12 -25 cars. By 2026 the shortfall is in the range 17-42 cars. This shortfall does not include the implied shortfall of 141 cars identified in the analysis above.
Recommendation : Our analysis indicates that there is a significant level of suppressed demand currently (141 cars). These cars are likely to be parking on local streets to avoid car parking charges and / or to avoid the anxiety of finding a space at the station car park. By 2018 there will be a shortfall of parking at this station assuming current parking levels continue. An economic appraisal has been undertaken for all three potential schemes. We would recommend a Station User survey at this station, where there has been significant growth since the NPS survey and there is a need to understand users’ willingness to pay car park charges.
4.3 Main / Gloucester Line
4.3.1 Severn Tunnel Junction
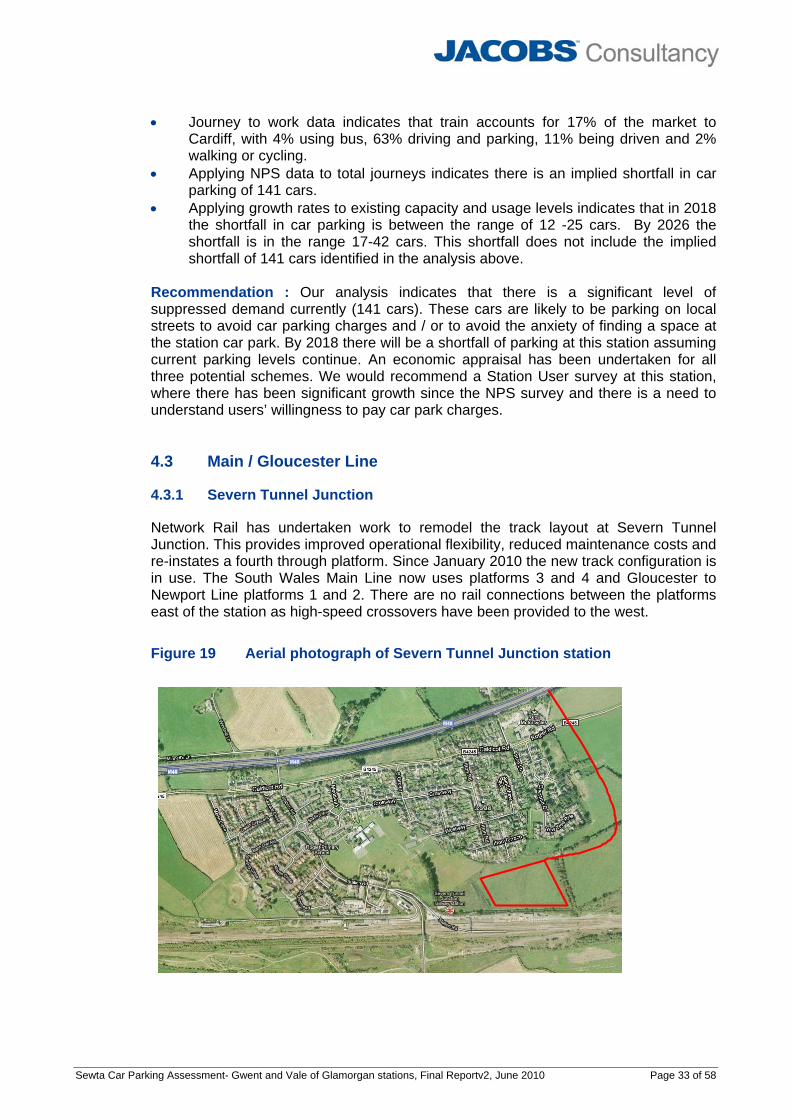
Network Rail has undertaken work to remodel the track layout at Severn Tunnel Junction. This provides improved operational flexibility, reduced maintenance costs and re-instates a fourth through platform. Since January 2010 the new track configuration is in use. The South Wales Main Line now uses platforms 3 and 4 and Gloucester to Newport Line platforms 1 and 2. There are no rail connections between the platforms east of the station as high-speed crossovers have been provided to the west.
Figure 19 Aerial photograph of Severn Tunnel Junction station

Sewta Car Parking Assessment- Gwent and Vale of Glamorgan stations, Final Reportv2, June 2010 Page 34 of 58
The potential scheme for this station is a strategic Park and Ride facility on land to the north west of the station, shown by the red rectangle, accessed by providing a new junction on the M48. The exact location and access to the site of this new motorway link road is not known and is shown on the map for illustrative purposes only. We have been advised that this scheme is estimated at a cost of £10m. The site could be as large as circa 29k sq m, accommodating just over 700 cars. Clearly a smaller site than this, or development of the site on a phased basis could be considered. Station statistics indicate: • 149k journeys per annum ( which equates to around 239 return trips a day) • 9 flows are over 1,000 journeys per annum, and account for 91% of all journeys;
Bristol Temple Meads 39%, Cardiff 27%, Newport 9%, Filton Abbey Wood 6%, Bath Spa 5%, Chepstow 2%, London 1%, Cathays 1% and Gloucester 1%.
• NPS data indicates that 28% walk or cycle to the station, with 55% parking at or near the station and 17% being dropped off.
• Journey to work data indicates that train accounts for 10% of the market to Cardiff, with 1% using bus, 82% driving and parking and 5% being driven.
• Journey to work data indicates that train accounts for 14% of the market to Bristol, with 5% using bus, 74% driving and parking, 2% being driven and 5% using a motorcycle.
• Applying NPS data to total journeys indicates there is an implied shortfall in car parking of 20 cars.
• Applying growth rates to existing capacity and usage levels indicates that in 2018 the shortfall in car parking is between the range of 27 -67 cars. By 2026 the shortfall is in the range 38-103 cars and by 2070 could be as high a 462 cars. Severn Tunnel Junction station has seen higher than average annual growth of 5.27% per annum between 2007 and 2009. This shortfall does not include the implied shortfall of 20 cars identified in the analysis above.
The significant step change in access to the station from a new motorway junction would require a similar step change in the train service provision at the station and would fundamentally change the usage pattern at the station. In our base case we have made the following assumptions: • Capital costs of £10m for the new motorway junction and access road. • All London trains call and incur a two minute journey time loss as a result of this
call for all users east of Severn Tunnel Junction. • The car park fee is increased to £5.00 a day (in reality this would need to be a
phased increase). • The average fare and journey length is assumed as at Newport station at £9.72
and 41 miles, rather than the £4.15 and 19 miles currently seen. Newport station is considered a good proxy station to the usage patterns which may be achieved at such a parkway station, with high levels of London commuting and business travel.
A MOIRA run, the standard industry forecasting model, has been used to assess the impact at stopping all trains at the station. The results indicate: • A net loss of £671k revenue per annum ( 2009 prices), as a result of increasing
the journey time by two minutes to allow for the train to stop for all users to the west of Severn Tunnel Junction.
• A user time disbenefit associated with the increase in journey time for users west of Severn Tunnel Junction of £1,447k per annum (2009 prices).
Sewta Car Parking Assessment- Gwent and Vale of Glamorgan stations, Final Reportv2, June 2010 Page 35 of 58
• Train operating costs would also be incurred as a result of stopping the trains; with marginal increases to fuel, brake and staff costs; but these have been excluded from our analysis.
We have assessed the scale of the potential market that would be required to break even against these revenue losses as 100 new London to Severn Tunnel Junction commuters a day, or over 500 new commuters to either Cardiff or Bristol. Our assessment of journeys to work in Bristol and Cardiff from Cwmbran, Abergavenny, Pontypool and New Inn, Severn Tunnel Junction, Chepstow and Caldicot catchments shows there are 2,600 trips in total a day and 309 of these are made by rail already. Rail would need to capture a further 20% of this market (520 trips) at Severn Tunnel Junction to break even on journey time losses. The new station car park is likely to abstract from Newport station for journeys to the east. This has capacity for 354 cars and is congested with a car park charge of £6.50. It is also likely to abstract to a lesser degree from Cardiff station, which has capacity for 400 cars and is congested with a car park charge of £8.50. Abstraction from Bristol Parkway, which has capacity for 1,100 cars and is again congested with a car park charge of £6.90, is very unlikely as the majority of users would be more likely to drive all the way with a small proportion switching to accessing Bristol Parkway by public transport or taxi due to parking capacity concerns. We have assumed a car park fee of £5 a day, which is competitive against nearby parkway stations, but would need to be introduced gradually and will be unpopular with existing users as the current charge is £2.10. These base assumptions give an indication of the economic case for the scheme, but we would recommend that should the scheme be progressed further a full study is undertaken to quantify all the potential markets identified above, the accessibility benefits through the new M48 junction for the A48 and A466 corridors and the wider economic benefits of the scheme, including relief to local roads and junctions provided by the access road and the improved accessibility provided by the new motorway junction. The study would also need to review alternatives, such as other options at Severn Tunnel Junction and / or alternatives at other Mainline stations. The results of sensitivity tests showed that for the benefit cost ratio to meet the Governments requirements for investment in some projects (above 1.5:1) the capital costs would need to be accurate at £10m (no optimism bias), a higher number of rail passengers would need to be new to rail (20%) and the wider economic benefits of traffic reduction from roads would need to be at a higher rate. In addition, a stronger case results from reducing the stops in long distance services (focusing on Newport / Cardiff trips rather than impacting on London journeys). Recommendation : Our analysis indicates that there is a relatively small (20 cars) shortfall in car parking facilities currently. By 2026 the shortfall could be over 100 cars if the station continues to grow at its’ current rate. An economic appraisal has been undertaken on the base case we identify above. It should be noted that this is a “top-level” assessment and we would recommend that a further study should be undertaken to quantify all the potential markets and / or alternative schemes. We would also recommend a Station User survey at this station, where NPS data is out of date and there has been significant growth at the station.

Sewta Car Parking Assessment- Gwent and Vale of Glamorgan stations, Final Reportv2, June 2010 Page 36 of 58
4.3.2 Caldicot
At Caldicot the main question is whether there is a case to make any provision for car parking given the close proximity of Severn Tunnel Junction station, which a greater choice of destinations and frequency of train service. The station is on the southern end of the town and does not have a car park, although there is a social club car park nearby which observations suggest that rail passengers use. The train service at this station is somewhat sporadic, with an hourly service at best. NPS data indicates that the majority of users from the town are driving to Severn Tunnel Junction and so catchment analysis has not been undertaken for this station and the area has instead been applied to Severn Tunnel Junction catchment. The aerial photograph below shows the proximity of the two stations, with Severn Tunnel Junction shown in red and Caldicot in blue.
Figure 20 Aerial photograph of Caldicot station
Station statistics indicate: • 70k journeys per annum ( which equates to around 128 return trips a day) • 39% of all journeys are to Cardiff, 35% to Newport, 10% to Chepstow, 4% to
Cheltenham and Gloucester, with the remaining 12% to various destinations of less than 1,000 journeys a year.
• NPS data indicates that 76% walk or cycle to the station, with 0% parking at or near the station and 24% being dropped off.
Recommendation : Without a significant increase in train service provision and the associated costs of this there appears to be little scope for development of car parking facilities at this station. No scheme to progress
Sewta Car Parking Assessment- Gwent and Vale of Glamorgan stations, Final Reportv2, June 2010 Page 37 of 58
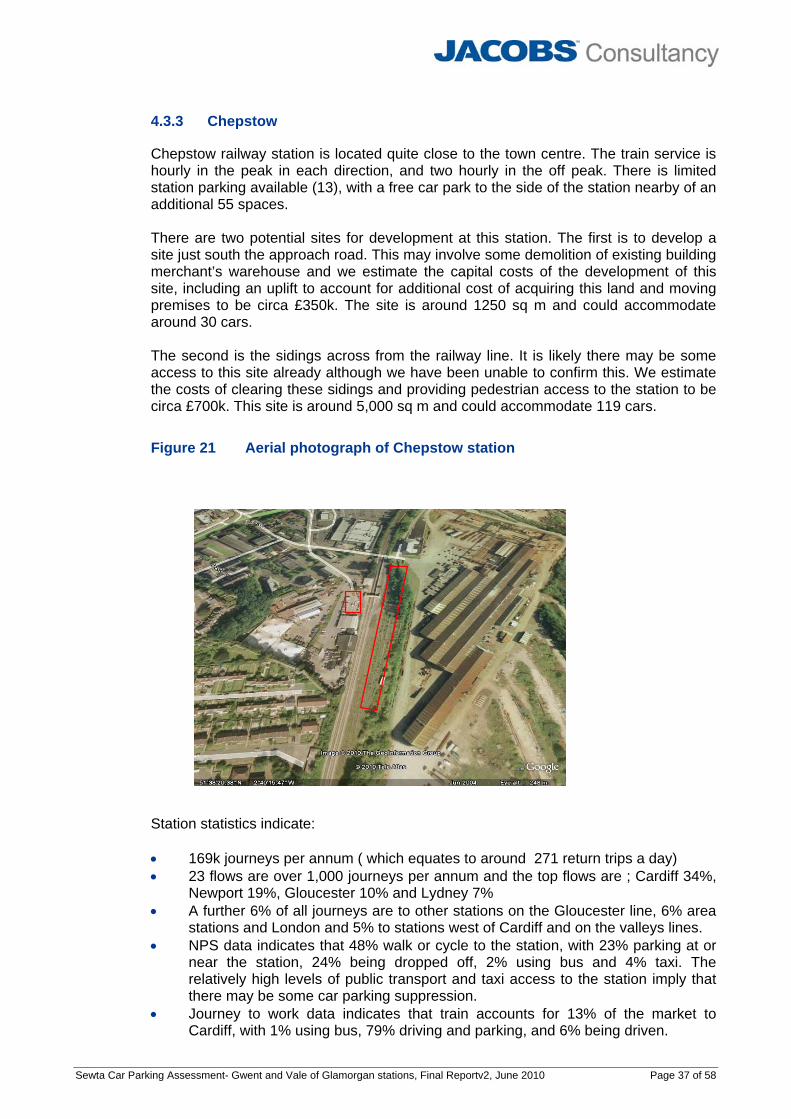
4.3.3 Chepstow
Chepstow railway station is located quite close to the town centre. The train service is hourly in the peak in each direction, and two hourly in the off peak. There is limited station parking available (13), with a free car park to the side of the station nearby of an additional 55 spaces. There are two potential sites for development at this station. The first is to develop a site just south the approach road. This may involve some demolition of existing building merchant’s warehouse and we estimate the capital costs of the development of this site, including an uplift to account for additional cost of acquiring this land and moving premises to be circa £350k. The site is around 1250 sq m and could accommodate around 30 cars. The second is the sidings across from the railway line. It is likely there may be some access to this site already although we have been unable to confirm this. We estimate the costs of clearing these sidings and providing pedestrian access to the station to be circa £700k. This site is around 5,000 sq m and could accommodate 119 cars.
Figure 21 Aerial photograph of Chepstow station
Station statistics indicate: • 169k journeys per annum ( which equates to around 271 return trips a day) • 23 flows are over 1,000 journeys per annum and the top flows are ; Cardiff 34%,
Newport 19%, Gloucester 10% and Lydney 7% • A further 6% of all journeys are to other stations on the Gloucester line, 6% area
stations and London and 5% to stations west of Cardiff and on the valleys lines. • NPS data indicates that 48% walk or cycle to the station, with 23% parking at or
near the station, 24% being dropped off, 2% using bus and 4% taxi. The relatively high levels of public transport and taxi access to the station imply that there may be some car parking suppression.
• Journey to work data indicates that train accounts for 13% of the market to Cardiff, with 1% using bus, 79% driving and parking, and 6% being driven.

Sewta Car Parking Assessment- Gwent and Vale of Glamorgan stations, Final Reportv2, June 2010 Page 38 of 58
• Journey to work data indicates that train accounts for only 3% of the market to Bristol, with 15% using bus, 72% driving and parking, 7% being driven and 3% using a motorcycle. The low market share at Bristol rather than Cardiff is due to there being no direct train service. It is reasonable to assume that a direct service would increase the market share to closer to 14% as seen at Severn Tunnel Junction.
• Applying NPS data to total journeys indicates that the station is at full capacity and suppression, if not occurring currently, is imminent.
• Applying growth rates to existing capacity and usage levels indicates that in 2018 the shortfall in car parking is between the range of 16 -180 cars. The station has seen very high average annual growth of 15.42% per annum between 2007– 2009. This is the highest level of growth seen at any of the stations being assessed. By 2026 the shortfall is in the range 23-228 cars.
Recommendation : Our analysis indicates that although there is currently no shortfall by 2018 the shortfall could be 180 cars if the station continues to grow at its’ current rate. An economic appraisal has been undertaken on the two schemes identified. We would recommend a Station User Survey at this station, where there has been significant growth at the station since the NPS data and there is a need to understand users’ willingness to pay car park charges. 4.3.4 Llanwern Station
Llanwern station is to the east of Newport and may abstract from Severn Tunnel Junction station, particularly for those travelling to the west to Cardiff and beyond, the majority of trips. We undertook the economic appraisal at Severn Tunnel Junction without allowing for any abstraction and the results did not indicate a strong case for the scheme (see Chapter 5 below). Including abstraction at Llanwern will only serve to worsen the business case.

Sewta Car Parking Assessment- Gwent and Vale of Glamorgan stations, Final Reportv2, June 2010 Page 39 of 58
5 ECONOMIC EVALUATION
5.1 Cost / Benefit Analysis
From the preceding evidence there is justification to assume that the provision of additional parking at the following stations will generate additional rail travel and switch traffic from the congested highway network to rail. • Vale of Glamorgan
• Cogan • Eastbrook
• Marches Line • Cwmbran ( 2 options) • Abergavenny (3 options)
• Main/ Gloucester Line • Severn Tunnel Junction • Chepstow (2 options)
5.1.1 Appraisal Assumptions
(a) Demand / Revenue
Revenues and benefits estimates are based on the additional demand generated by the car parking provision, based on the following assumptions. • Each space is used once a day • Only 16% is new rail demand (based on PDFH1) • Annual factor of 300 • Car occupancy of 1.2 • Revenue factors, based on Moira to March 2009 data average fare for the
station. • Car park charge of £2 at Abergavenny and £2.10 at Severn Tunnel Junction. All
other stations are assumed to be free. • 20.9% market price adjustment factor • No growth in demand over time – assuming all car park spaces taken from day
one. This may not be the case for all schemes, and will need to be revised as schemes progress through feasibility stages however for the purposes of this study it allows schemes to be compared on a like-for-like basis.
• Growth in rail fares of RPI +1% • Revenue elasticity to fares of +0.4 The assumption (from PDFH) of 16% of demand being new rail demand is a key assumption. Additional evidence from post implementation evaluations was sought. Centro revealed evidence for 6 stations2 gave a range of 14% to 21% of car park users new to using the station since the car park expansion.
1 PDFH Section 50 Car Parking at Network South East Stations, Survey of P&R users at Milton Keynes asked what alternative action they would have taken if no car park space available. 2 Selly Oak 21%, Hall Green 19%, Stourbridge Junction 16%, Whitlocks End 19%, Chester Road 14% and Acocks Green 17%.

Sewta Car Parking Assessment- Gwent and Vale of Glamorgan stations, Final Reportv2, June 2010 Page 40 of 58
(b) Costs
The assumptions employed in the treatment of costs and benefits in the Appraisal are; • Capital costs are based on an average of £4.5k per space (Rhymney Car park
Study). • Capital costs for access roads are based on a benchmark cost of £750k per km. • Land costs are based on a benchmark cost of £25 per sqm. These costs will vary
dramatically by site and we aim to model this in sensitivity tests. • Additional station specific costs are discussed by station in section 4 above. • 35% risk added • 40% Optimism Bias • 20.9% market price adjustment factor • Maintenance costs of £100 per space per annum; this is based on the Rhymney
study. • Access road maintenance costs are assumed at £10k per km. • Growth in operating costs of 1% per annum; we have applied a sensitivity test
without this growth assumption. • Rail safety benefits (costs) based on DfT guidance • No optimism bias applied to operating costs ( only MPA) (c) User Time benefits
• Nominal 5 minute time saving for non ‘new rail user’ trips assuming reduced walk time from surrounding streets and reduced car search time, etc.
• Value of time £4.46/hour • Market Price Adjustment assuming 5% business travel (d) Non-User benefits
• Assume trip lengths based on average from Moira for the station • Applied to the ‘new’ rail demand only • Car Occupancy 1.2 • Congestion, infrastructure, accident, local air quality and greenhouse gases
benefits resulting from the assumed transfer of trips from car for 2008 and 2025 estimated through application of spreadsheets incorporating recommended values for external impacts based on DfT Guidance on Rail Appraisal: External Costs of Car Use (Transport Analysis Guidance Unit 3.13.2, April 2007). For the Vale of Glamorgan sites we have used rates applicable for urban A roads. For the Marches, Main and Gloucester Line station our base case assumes that 34% of the journey is on urban A roads and 66% is on less congested rural A roads. We have applied a sensitivity test to this assumption, where 66% of mileage is assumed on the congested urban roads.
(e) Other assumptions
The economic appraisal has been undertaken in accordance with the Guidance on Rail Appraisal. Key assumptions were; • 2002 price base and 2002 prices, deflating values using RPI factors sourced from
National Statistics; • Capital costs assumed as 2009 for all sites. • Discounted over 60 years of operation from year of appraisal 2009/10, (assumed
year of operation is 2012) to a 2002 base assuming a discount rate of 3.5% from 2002 to 2037 and 3.0% for the remaining years;
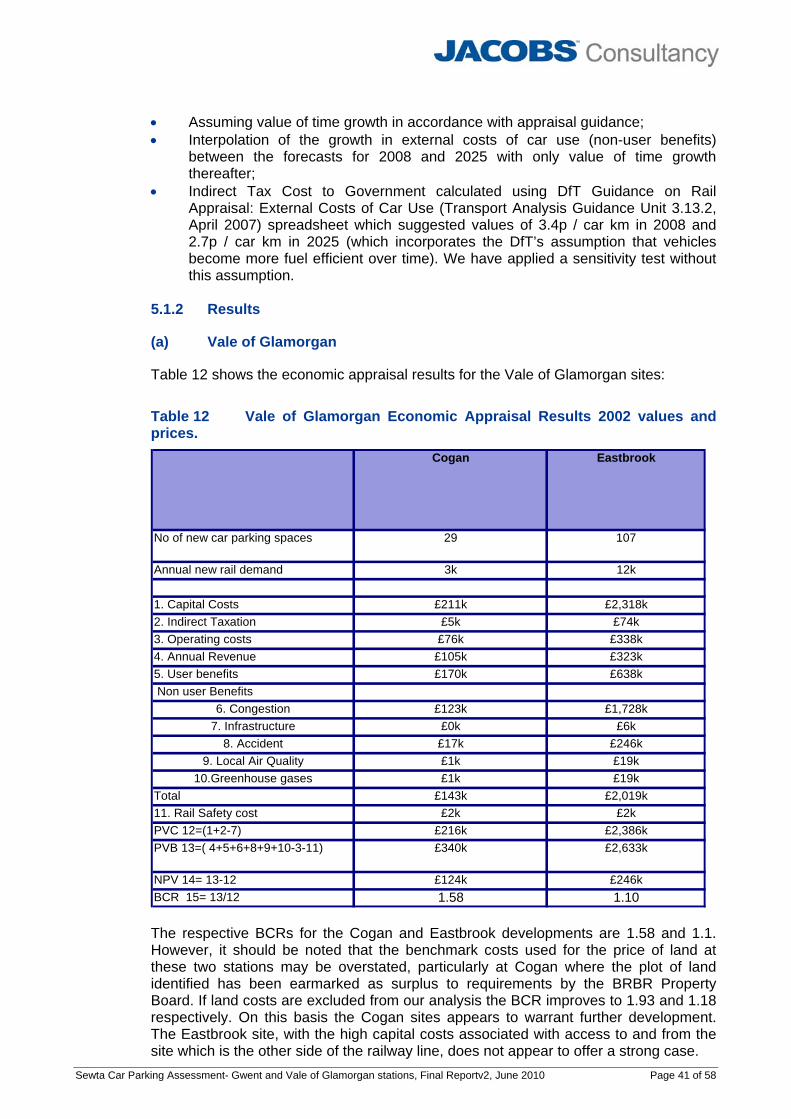
Sewta Car Parking Assessment- Gwent and Vale of Glamorgan stations, Final Reportv2, June 2010 Page 41 of 58
• Assuming value of time growth in accordance with appraisal guidance; • Interpolation of the growth in external costs of car use (non-user benefits)
between the forecasts for 2008 and 2025 with only value of time growth thereafter;
• Indirect Tax Cost to Government calculated using DfT Guidance on Rail Appraisal: External Costs of Car Use (Transport Analysis Guidance Unit 3.13.2, April 2007) spreadsheet which suggested values of 3.4p / car km in 2008 and 2.7p / car km in 2025 (which incorporates the DfT’s assumption that vehicles become more fuel efficient over time). We have applied a sensitivity test without this assumption.
5.1.2 Results
(a) Vale of Glamorgan
Table 12 shows the economic appraisal results for the Vale of Glamorgan sites:
Table 12 Vale of Glamorgan Economic Appraisal Results 2002 values and prices.
Cogan Eastbrook
No of new car parking spaces 29 107
Annual new rail demand 3k 12k
1. Capital Costs £211k £2,318k2. Indirect Taxation £5k £74k3. Operating costs £76k £338k4. Annual Revenue £105k £323k5. User benefits £170k £638k Non user Benefits
6. Congestion £123k £1,728k7. Infrastructure £0k £6k
8. Accident £17k £246k9. Local Air Quality £1k £19k
10.Greenhouse gases £1k £19kTotal £143k £2,019k11. Rail Safety cost £2k £2kPVC 12=(1+2-7) £216k £2,386kPVB 13=( 4+5+6+8+9+10-3-11) £340k £2,633k
NPV 14= 13-12 £124k £246kBCR 15= 13/12 1.58 1.10 The respective BCRs for the Cogan and Eastbrook developments are 1.58 and 1.1. However, it should be noted that the benchmark costs used for the price of land at these two stations may be overstated, particularly at Cogan where the plot of land identified has been earmarked as surplus to requirements by the BRBR Property Board. If land costs are excluded from our analysis the BCR improves to 1.93 and 1.18 respectively. On this basis the Cogan sites appears to warrant further development. The Eastbrook site, with the high capital costs associated with access to and from the site which is the other side of the railway line, does not appear to offer a strong case.

Sewta Car Parking Assessment- Gwent and Vale of Glamorgan stations, Final Reportv2, June 2010 Page 42 of 58
(b) Cwmbran
Table 13 shows the results for Cwmbran station:
Table 13 Cwmbran station Economic Appraisal Results 2002 values and prices.
Cwmbran -North site above bus depot
Cwmbran -South site across road
No of new car parking spaces 29 64Annual new rail demand 3k 7k
1. Capital Costs £576k £2,002k2. Indirect Taxation £26k £59k3. Operating costs £103k £224k4. Annual Revenue £324k £730k5. User benefits £170k £383k Non user Benefits
6. Congestion £238k £535k7. Infrastructure £2k £3k
8. Accident £42k £94k9. Local Air Quality £5k £11k
10.Greenhouse gases £7k £16kTotal £293k £659k11. Rail Safety cost £10k £22kPVC 12=(1+2-7) £601k £2,058kPVB 13=( 4+5+6+8+9+10-3-11) £674k £1,522k
NPV 14= 13-12 £73k -£536kBCR 15= 13/12 1.12 0.74 Neither of these schemes produces a strong economic case, but of the two sites at Cwmbran it is the site to the north of the station approach which produces the highest results. As this site is on disused land the land price may be nominal and if we exclude this from our analysis the BCR improves to 1.2. The weaker case for the site across the road from station (BCR 0.74) is driven by the high capital costs associated with this scheme. If a reduced scheme cost of £250k is tested, assuming a signalled pedestrian crossing with steps accessing and egressing the road, the BCR increases to 1.47. This scheme would not offer disabled access; however, there are sufficient disabled spaces at the station entrance. (c) Abergavenny
Table 14 shows the results for Abergavenny station:

Sewta Car Parking Assessment- Gwent and Vale of Glamorgan stations, Final Reportv2, June 2010 Page 43 of 58
Table 14 Abergavenny station Economic Appraisal Results 2002 values and prices.
Abergavenny -site opposite station entrance
Abergavenny -site north of station
Abergavenny -field site across the railway line
No of new car parking spaces 21 14 119Annual new rail demand 2k 2k 14k
1. Capital Costs £523k £338k £3,635k2. Indirect Taxation £44k £29k £246k3. Operating costs £84k £65k £343k4. Annual Revenue £770k £513k £4,278k5. User benefits £128k £85k £709k Non user Benefits
6. Congestion £399k £266k £2,216k7. Infrastructure £3k £2k £14k
8. Accident £70k £46k £387k9. Local Air Quality £8k £6k £46k
10.Greenhouse gases £12k £8k £65kTotal £491k £327k £2,729k11. Rail Safety cost £17k £11k £92kPVC 12=(1+2-7) £565k £366k £3,867kPVB 13=( 4+5+6+8+9+10-3-11) £1,286k £849k £7,267k
NPV 14= 13-12 £721k £483k £3,400kBCR 15= 13/12 2.28 2.32 1.88 Two of the sites at Abergavenny show a strong economic case (over 2) and the third site, over the road from the station gives a reasonable economic case. These strong results are driven by the relatively high average fares and journey lengths and the car park charges applied at this station. It should however be noted that the benchmark land costs used are likely to be understated at this town centre location. If the land costs were to increase ten fold (£225k, £150k and £1,250k for the three sites respectively), the BCRs fall to 1.54, 1.56 and 1.36. This still presents a reasonable economic case for the first two sites. Wider economic benefits, which are not quantified within our analysis, will further improve these schemes. (d) Severn Tunnel Junction and Chepstow
Table 15 shows the results for Severn Tunnel Junction and Chepstow station:
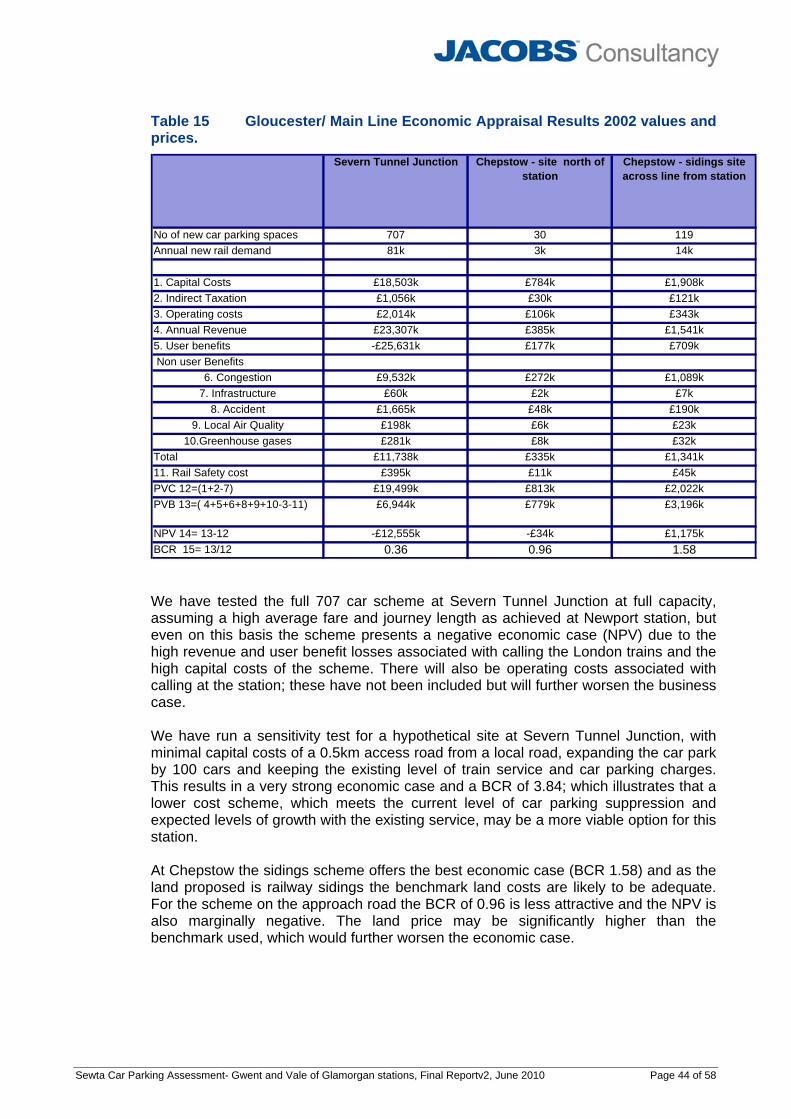
Sewta Car Parking Assessment- Gwent and Vale of Glamorgan stations, Final Reportv2, June 2010 Page 44 of 58
Table 15 Gloucester/ Main Line Economic Appraisal Results 2002 values and prices.
Severn Tunnel Junction Chepstow - site north of station
Chepstow - sidings site across line from station
No of new car parking spaces 707 30 119Annual new rail demand 81k 3k 14k
1. Capital Costs £18,503k £784k £1,908k2. Indirect Taxation £1,056k £30k £121k3. Operating costs £2,014k £106k £343k4. Annual Revenue £23,307k £385k £1,541k5. User benefits -£25,631k £177k £709k Non user Benefits
6. Congestion £9,532k £272k £1,089k7. Infrastructure £60k £2k £7k
8. Accident £1,665k £48k £190k9. Local Air Quality £198k £6k £23k
10.Greenhouse gases £281k £8k £32kTotal £11,738k £335k £1,341k11. Rail Safety cost £395k £11k £45kPVC 12=(1+2-7) £19,499k £813k £2,022kPVB 13=( 4+5+6+8+9+10-3-11) £6,944k £779k £3,196k
NPV 14= 13-12 -£12,555k -£34k £1,175kBCR 15= 13/12 0.36 0.96 1.58 We have tested the full 707 car scheme at Severn Tunnel Junction at full capacity, assuming a high average fare and journey length as achieved at Newport station, but even on this basis the scheme presents a negative economic case (NPV) due to the high revenue and user benefit losses associated with calling the London trains and the high capital costs of the scheme. There will also be operating costs associated with calling at the station; these have not been included but will further worsen the business case. We have run a sensitivity test for a hypothetical site at Severn Tunnel Junction, with minimal capital costs of a 0.5km access road from a local road, expanding the car park by 100 cars and keeping the existing level of train service and car parking charges. This results in a very strong economic case and a BCR of 3.84; which illustrates that a lower cost scheme, which meets the current level of car parking suppression and expected levels of growth with the existing service, may be a more viable option for this station. At Chepstow the sidings scheme offers the best economic case (BCR 1.58) and as the land proposed is railway sidings the benchmark land costs are likely to be adequate. For the scheme on the approach road the BCR of 0.96 is less attractive and the NPV is also marginally negative. The land price may be significantly higher than the benchmark used, which would further worsen the economic case.
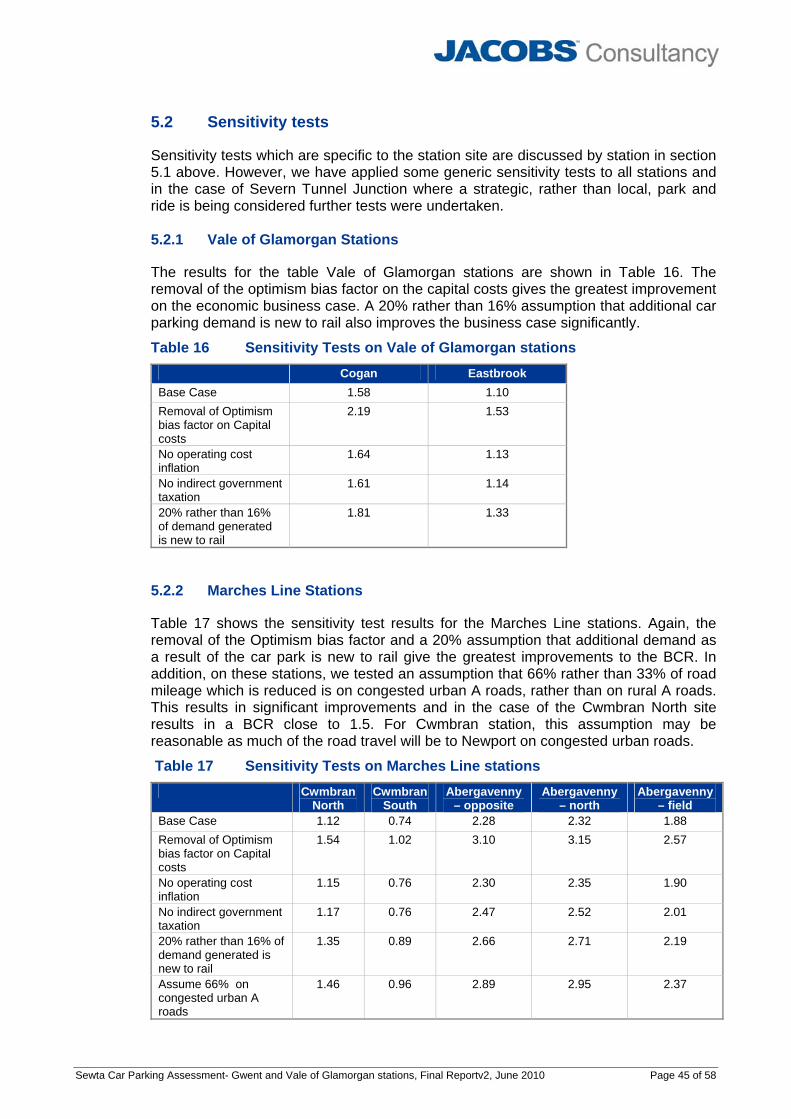
Sewta Car Parking Assessment- Gwent and Vale of Glamorgan stations, Final Reportv2, June 2010 Page 45 of 58
5.2 Sensitivity tests
Sensitivity tests which are specific to the station site are discussed by station in section 5.1 above. However, we have applied some generic sensitivity tests to all stations and in the case of Severn Tunnel Junction where a strategic, rather than local, park and ride is being considered further tests were undertaken. 5.2.1 Vale of Glamorgan Stations
The results for the table Vale of Glamorgan stations are shown in Table 16. The removal of the optimism bias factor on the capital costs gives the greatest improvement on the economic business case. A 20% rather than 16% assumption that additional car parking demand is new to rail also improves the business case significantly.
Table 16 Sensitivity Tests on Vale of Glamorgan stations Cogan Eastbrook Base Case 1.58 1.10 Removal of Optimism bias factor on Capital costs
2.19 1.53
No operating cost inflation
1.64 1.13
No indirect government taxation
1.61 1.14
20% rather than 16% of demand generated is new to rail
1.81 1.33
5.2.2 Marches Line Stations
Table 17 shows the sensitivity test results for the Marches Line stations. Again, the removal of the Optimism bias factor and a 20% assumption that additional demand as a result of the car park is new to rail give the greatest improvements to the BCR. In addition, on these stations, we tested an assumption that 66% rather than 33% of road mileage which is reduced is on congested urban A roads, rather than on rural A roads. This results in significant improvements and in the case of the Cwmbran North site results in a BCR close to 1.5. For Cwmbran station, this assumption may be reasonable as much of the road travel will be to Newport on congested urban roads.
Table 17 Sensitivity Tests on Marches Line stations Cwmbran
North Cwmbran
South Abergavenny
– opposite Abergavenny
– north Abergavenny
– field Base Case 1.12 0.74 2.28 2.32 1.88 Removal of Optimism bias factor on Capital costs
1.54 1.02 3.10 3.15 2.57
No operating cost inflation
1.15 0.76 2.30 2.35 1.90
No indirect government taxation
1.17 0.76 2.47 2.52 2.01
20% rather than 16% of demand generated is new to rail
1.35 0.89 2.66 2.71 2.19
Assume 66% on congested urban A roads
1.46 0.96 2.89 2.95 2.37
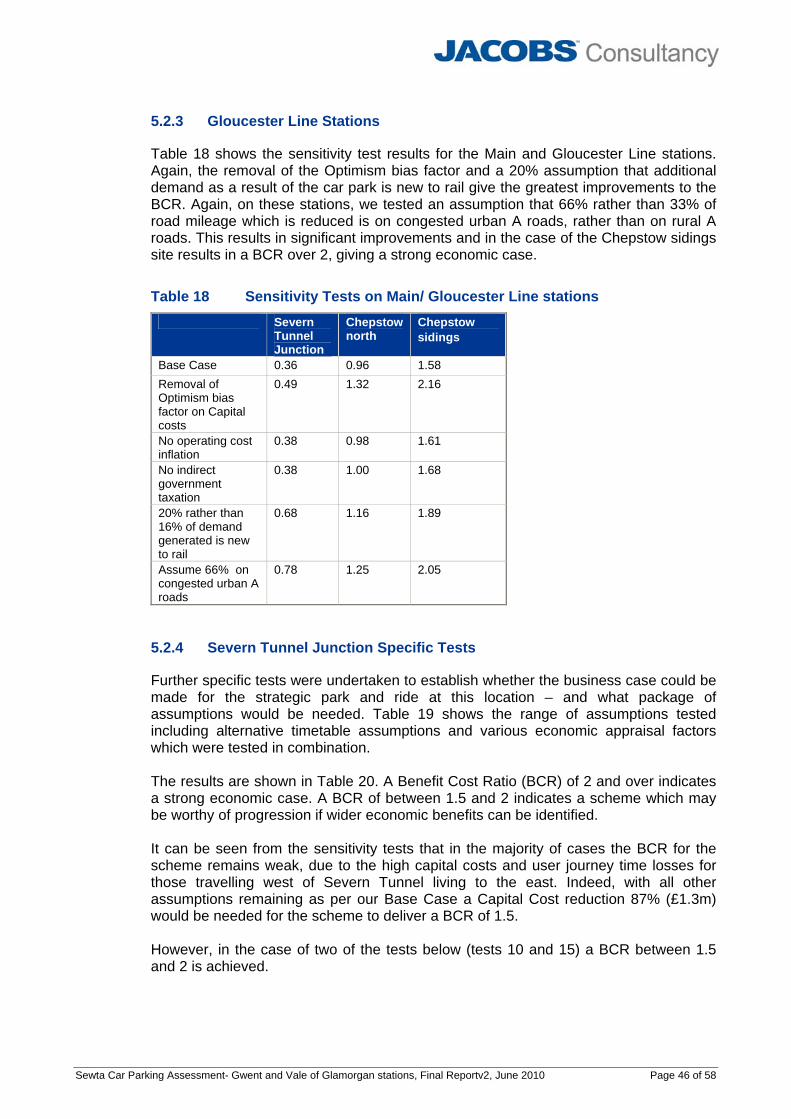
Sewta Car Parking Assessment- Gwent and Vale of Glamorgan stations, Final Reportv2, June 2010 Page 46 of 58
5.2.3 Gloucester Line Stations
Table 18 shows the sensitivity test results for the Main and Gloucester Line stations. Again, the removal of the Optimism bias factor and a 20% assumption that additional demand as a result of the car park is new to rail give the greatest improvements to the BCR. Again, on these stations, we tested an assumption that 66% rather than 33% of road mileage which is reduced is on congested urban A roads, rather than on rural A roads. This results in significant improvements and in the case of the Chepstow sidings site results in a BCR over 2, giving a strong economic case.
Table 18 Sensitivity Tests on Main/ Gloucester Line stations Severn
Tunnel Junction
Chepstow north
Chepstow sidings
Base Case 0.36 0.96 1.58 Removal of Optimism bias factor on Capital costs
0.49 1.32 2.16
No operating cost inflation
0.38 0.98 1.61
No indirect government taxation
0.38 1.00 1.68
20% rather than 16% of demand generated is new to rail
0.68 1.16 1.89
Assume 66% on congested urban A roads
0.78 1.25 2.05
5.2.4 Severn Tunnel Junction Specific Tests
Further specific tests were undertaken to establish whether the business case could be made for the strategic park and ride at this location – and what package of assumptions would be needed. Table 19 shows the range of assumptions tested including alternative timetable assumptions and various economic appraisal factors which were tested in combination. The results are shown in Table 20. A Benefit Cost Ratio (BCR) of 2 and over indicates a strong economic case. A BCR of between 1.5 and 2 indicates a scheme which may be worthy of progression if wider economic benefits can be identified. It can be seen from the sensitivity tests that in the majority of cases the BCR for the scheme remains weak, due to the high capital costs and user journey time losses for those travelling west of Severn Tunnel living to the east. Indeed, with all other assumptions remaining as per our Base Case a Capital Cost reduction 87% (£1.3m) would be needed for the scheme to deliver a BCR of 1.5. However, in the case of two of the tests below (tests 10 and 15) a BCR between 1.5 and 2 is achieved.

Sewta Car Parking Assessment- Gwent and Vale of Glamorgan stations, Final Reportv2, June 2010 Page 47 of 58
Table 19 Details of Sensitivity Tests No: Detail and Commentary 1 Assume the peak morning trains to London and the peak evening departures from London
do not call additionally at STJ. Specifically, we have excluded morning peak arrivals at London between 0700 and 1000 and evening peak departures from London between 1600 and 1900 from calling at Severn Tunnel Junction additionally if they currently do not. This test assumes that the average fare remains equivalent to that achieved at Newport, which is unlikely to be the case as there are fewer peak journey opportunities to London.
2 Assume the peak morning trains to London and the peak evening departures from London do not call additionally at STJ, and in the off peak one train an hour calls. This test assumes that the average fare will fall to £7, mid way between that achieved at STJ now and the Newport fare, which is probably a more realistic assumption
3 Removal of 40% Optimism bias on Capital costs 4 Removal of 40% Optimism bias and 35% risk on Capital costs 5 Break even analysis – What capital cost is required to obtain a BCR of 1.5 (with no risk and
optimism bias applied) 6 20% rather than 16% are assumed to be new users to rail 7 Assume 66% ( rather than 33%) of congestion to be to be on urban A roads 8 3& 7 ; remove optimism bias on capital costs and assume 66% on congested A roads 9 6& 7 ; assume 20% new users and 66% on congested A roads 10 3&6&7 remove optimism bias on capital costs ,20% new users and 66% on congested A
roads 11 2&3 no peak to/ from London service and no optimism bias on capital costs 12 2&6 no peak to/ from London service and 20% assumed to be new users 13 2&7 no peak to/ from London service and 66% assumed to be on congested roads 14 2 &6 &7 no peak to/ from London service , 20 % new users an 66% on congested roads 15 2&3&6&7 no peak to/ from London service , no optimism bias applied to capital costs, 20 %
new users an 66% on congested roads
Table 20 Sensitivity test Results Test No: Detail BCR Capital cost Base March 2010 Report 0.36 1 No peak service to/from London, but average fare
maintained 0.85
2 No peak service to/from London, average fare assumed at £7
0.6
3 Remove Optimism Bias 0.49 4 Remove Optimism Bias and Risk 0.64 5. Capital cost need to give BCR of 1.5 £1.3m 6. 20% new users 0.68 7 66% on congested roads 0.78 8 3&7 1.07 9 6&7 1.20 10 3&6&7 1.64 11 2&3 0.83 12 2&6 0.87 13 2&7 1.03 14 2 &6 &7 1.39 15 2&3&6&7 1.90
Sewta Car Parking Assessment- Gwent and Vale of Glamorgan stations, Final Reportv2, June 2010 Page 48 of 58
The assumptions necessary to produce a reasonable business case are; • No optimism bias is applied to the Capital costs, further development and
refinement of the scheme costs will reduce risk in this area; • 20% of new users are assumed to be new to rail; this is a figure which has been
achieved at some Centro stations based on post implementation surveys at new stations, and;
• The non user benefits are calculated by assuming 66% of mileage is on
congested urban rural roads and 33% on rural A roads, rather than the other way around in the base case. Over time roads around this area will become further congested so the application of a higher congestion rate may become appropriate.
In test 15 we also assume no peak service to and from London, with a reduced average fare aligned to this assumption. Our appraisal does not take full account of the wider economic, social and environmental benefits associated with the scheme, in particular; • Benefits to Roget residents as a result of the M48 link road effectively bypassing
the village, and; • Benefits to residents of Chepstow and the surrounding areas if the new M48
junction is progressed. The range of tests results above indicate that further work would be required in order for a feasible scheme to be progressed. We would recommend further work to look at the potential markets for the station and the wider economic benefits of the scheme. We understand that WAG is undertaking analysis to understand the demand for park and ride for existing M4 users, this information would be useful to validate the demand assumptions and the results could be combined with our results. Further work which might also be considered in developing the schemes are; further refinement of the capital costs; analysis of wider benefits in the local area, and; opportunities for expansion of the current car park at low cost which would have a strong business case.

Sewta Car Parking Assessment- Gwent and Vale of Glamorgan stations, Final Reportv2, June 2010 Page 49 of 58
6 CONCLUSIONS & RECOMMENDED FURTHER WORKSTREAMS
6.1 Conclusions
Our analysis indicates that schemes which produce a strong economic case which we would recommend are further developed are: • Cogan – BRBR Property Board site • Cwmbran – north site • Abergavenny – all three proposed sites • Chepstow – sidings site.
6.2 Summary of Findings
A summary of our findings are: (a) Penarth
We have identified that there is significant suppressed demand at Penarth station. Our analysis indicates that users are driving from south Penarth and Sully to this station. However, at this town centre station, there is very little if any scope to develop further car parking and it is the view of the Vale of Glamorgan Council that any development which would increase the number of cars accessing the town centre would be strongly opposed and would exacerbate already high levels of traffic congestion. We would recommend alternative solutions to alleviate the parking suppression should be sought. Improvements to parking facilities at Cogan may alleviate the suppression at Penarth. (b) Dingle Road
A largely “walk to” catchment with no scheme to progress. (c) Cogan
Our analysis suggests that currently there is no suppressed demand at Cogan station, but this station has seen much higher than average growth in the last couple of years and the development of this area is likely to see this high level of growth continue. If current levels of growth continue there will be a shortage of parking by 2018. An economic appraisal of this site produces a BCR close to 2 if the land proposed can be purchased at a nominal price. (d) Eastbrook
Our analysis suggests that currently there is no suppressed demand at Eastbrook station, but this station has seen much higher than average growth in the last couple of years and the development of this area is likely to see this high level of growth continue. If current levels of growth continue there will be a shortage of parking by 2018. However, the only site which appears to be available is across the line from the station, with high access capital costs associated with it. This prevents this scheme from being economically viable. (e) Dinas Powys
A “walk to” catchment with no scheme to progress.
Sewta Car Parking Assessment- Gwent and Vale of Glamorgan stations, Final Reportv2, June 2010 Page 50 of 58
(f) Rhoose
No parking suppression or further parking requirement over the medium term. Station has seen dip in usage in last couple of years and growing demand through marketing activity and / or frequency improvements should be the short- medium term objective for this station. We would recommend a Station User Survey at this station, where there is no NPS data available. (g) Llantwit Major
This station has seen a dip in usage in the last year and this may, in part, be due to parking suppression in previous years, but there is no survey data available at this newly opened station to collaborate this. Growing demand through marketing activity and / or frequency improvements should be short- term objective for this station, followed by a further review of parking facilities. We would recommend a Station User Survey at this station, where there is no NPS data available. (h) Cwmbran
Our analysis indicates that there is significant (87 cars) parking suppression at this station and if the high levels of growth seen in recent years continue at this station the shortfall could be over 200 cars by 2018. Two sites were tested at this location; the site north of the station approach gave the strongest economic case as the capital costs associated with the scheme to the south across the road from the station were high. If capital costs can be reduced on the south site there is a stronger economic case, and so we would recommend that both schemes are worthy of progression to a feasibility study. We would also recommend a Station User Survey at this station, where the degree of railheading from the Pontypool and New Inn catchment needs to be assessed. (i) Pontypool and New Inn
Our analysis has indicated that there is no parking suppression at this site, even with a frequency improvement the existing car parking facilities will suffice over the medium term. We would recommend marketing activity and / or frequency improvements as the short- medium term objective for this station. (j) Abergavenny
Our analysis identified that high levels of car parking suppression at this station will only be exacerbated over time. All three potential schemes evaluated at this station produced a strong economic case and we would recommend that they are further developed. We would also recommend a Station User Survey at this station, which has seen significant growth since the NPS survey and where users’ willingness to pay car parking charges needs to be understood. (k) Severn Tunnel Junction
Our analysis suggests that currently there is a degree of suppressed demand at Severn Tunnel Junction station and with anticipated growth the shortfall could be as high as 100 cars by 2026. A strategic Park and Ride with a junction off the M48, estimated at £10m was tested, assuming full occupancy of a 700 space site and that all London trains call at the station. A “top-level” assessment of the scheme results in a weak economic case. We would recommend a further detailed study looking at the potential markets for the station and the wider economic benefits of the scheme.
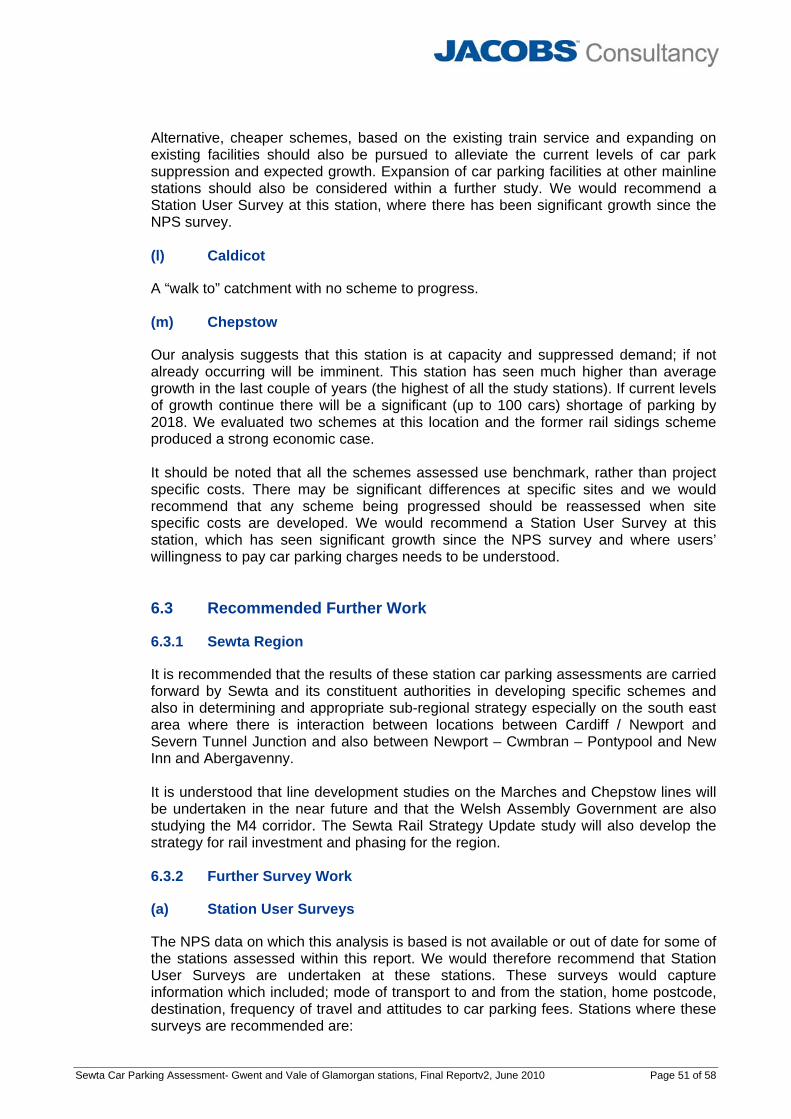
Sewta Car Parking Assessment- Gwent and Vale of Glamorgan stations, Final Reportv2, June 2010 Page 51 of 58
Alternative, cheaper schemes, based on the existing train service and expanding on existing facilities should also be pursued to alleviate the current levels of car park suppression and expected growth. Expansion of car parking facilities at other mainline stations should also be considered within a further study. We would recommend a Station User Survey at this station, where there has been significant growth since the NPS survey. (l) Caldicot
A “walk to” catchment with no scheme to progress. (m) Chepstow
Our analysis suggests that this station is at capacity and suppressed demand; if not already occurring will be imminent. This station has seen much higher than average growth in the last couple of years (the highest of all the study stations). If current levels of growth continue there will be a significant (up to 100 cars) shortage of parking by 2018. We evaluated two schemes at this location and the former rail sidings scheme produced a strong economic case. It should be noted that all the schemes assessed use benchmark, rather than project specific costs. There may be significant differences at specific sites and we would recommend that any scheme being progressed should be reassessed when site specific costs are developed. We would recommend a Station User Survey at this station, which has seen significant growth since the NPS survey and where users’ willingness to pay car parking charges needs to be understood. 6.3 Recommended Further Work
6.3.1 Sewta Region
It is recommended that the results of these station car parking assessments are carried forward by Sewta and its constituent authorities in developing specific schemes and also in determining and appropriate sub-regional strategy especially on the south east area where there is interaction between locations between Cardiff / Newport and Severn Tunnel Junction and also between Newport – Cwmbran – Pontypool and New Inn and Abergavenny. It is understood that line development studies on the Marches and Chepstow lines will be undertaken in the near future and that the Welsh Assembly Government are also studying the M4 corridor. The Sewta Rail Strategy Update study will also develop the strategy for rail investment and phasing for the region. 6.3.2 Further Survey Work
(a) Station User Surveys
The NPS data on which this analysis is based is not available or out of date for some of the stations assessed within this report. We would therefore recommend that Station User Surveys are undertaken at these stations. These surveys would capture information which included; mode of transport to and from the station, home postcode, destination, frequency of travel and attitudes to car parking fees. Stations where these surveys are recommended are:

Sewta Car Parking Assessment- Gwent and Vale of Glamorgan stations, Final Reportv2, June 2010 Page 52 of 58
• Llantwit Major, where no NPS data is available, • Rhoose, where no NPS data is available, • Cwmbran, where the degree of railheading from the Pontypool and New Inn
catchment needs to be understood, • Abergavenny, where there has been significant growth since the NPS survey and
users’ willingness to pay car parking charges needs to be understood, • Severn Tunnel Junction, where there has been significant growth and
redevelopment of the station since the NPS survey, and the level of car parking charges users’ are willing to pay needs to be understood, and
• Chepstow, where there has been significant growth since the NPS survey and users’ willingness to pay the car parking charges needs to be understood.
(b) Post Implementation Evaluation Surveys
In addition to these Station User Surveys we would also recommend that post implementation evaluation surveys are undertaken where new or expanded car park schemes have been implemented. These surveys would provide evidence of the proportion of new users of the car park which are new to rail as a mode of transport, having switched from road. Appropriate sites for these surveys would be agreed would be agreed with Sewta, but might include Llanharen and Ebbw Vale, although the later is a completely new station. On completion of the Abercynon Park and Ride scheme a post implementation survey would also be recommended at this station.
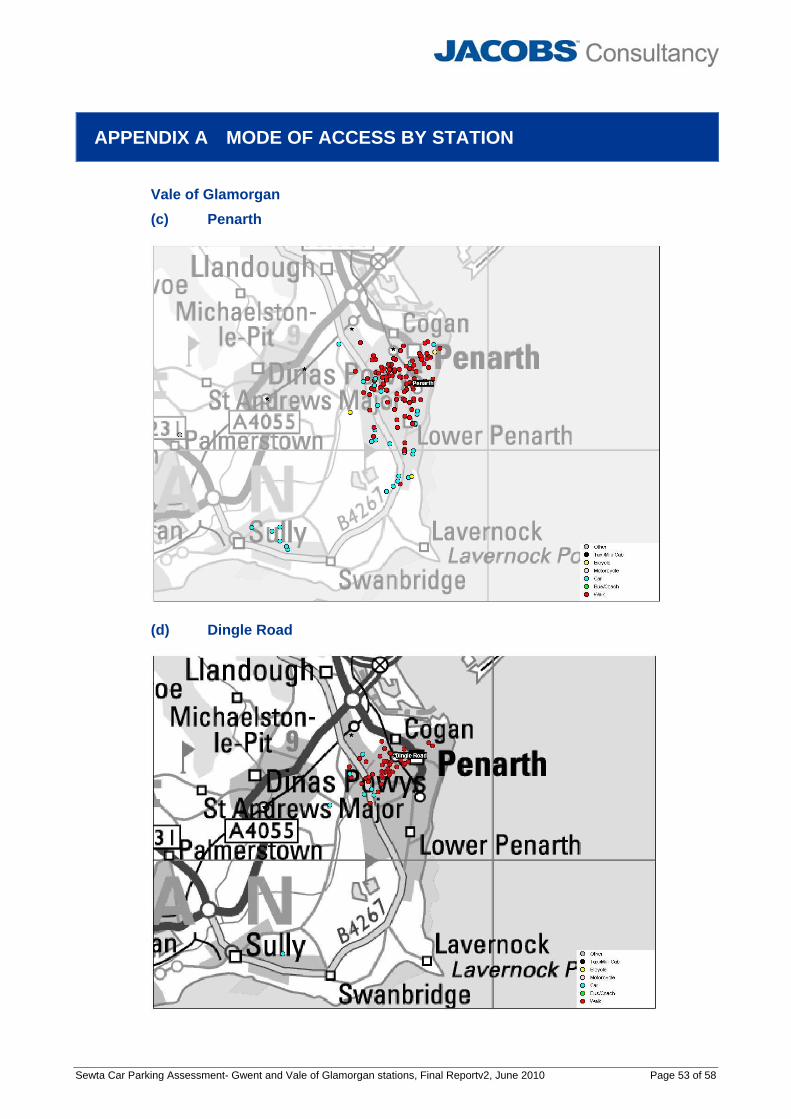
Sewta Car Parking Assessment- Gwent and Vale of Glamorgan stations, Final Reportv2, June 2010 Page 53 of 58
APPENDIX A MODE OF ACCESS BY STATION
Vale of Glamorgan (c) Penarth
(d) Dingle Road

Sewta Car Parking Assessment- Gwent and Vale of Glamorgan stations, Final Reportv2, June 2010 Page 54 of 58
(e) Cogan
(f) Eastbrook

Sewta Car Parking Assessment- Gwent and Vale of Glamorgan stations, Final Reportv2, June 2010 Page 55 of 58
(g) Dinas Powys
Marches Line (including Newport and Bristol Parkway for comparison) (h) Newport

Sewta Car Parking Assessment- Gwent and Vale of Glamorgan stations, Final Reportv2, June 2010 Page 56 of 58
(i) Cwmbran
(j) Pontypool and New Inn

Sewta Car Parking Assessment- Gwent and Vale of Glamorgan stations, Final Reportv2, June 2010 Page 57 of 58
(k) Abergavenny
Main / Gloucester Line (l) Severn Tunnel Junction

Sewta Car Parking Assessment- Gwent and Vale of Glamorgan stations, Final Reportv2, June 2010 Page 58 of 58
(m) Caldicot
(n) Chepstow