Embed Size (px)
Citation preview
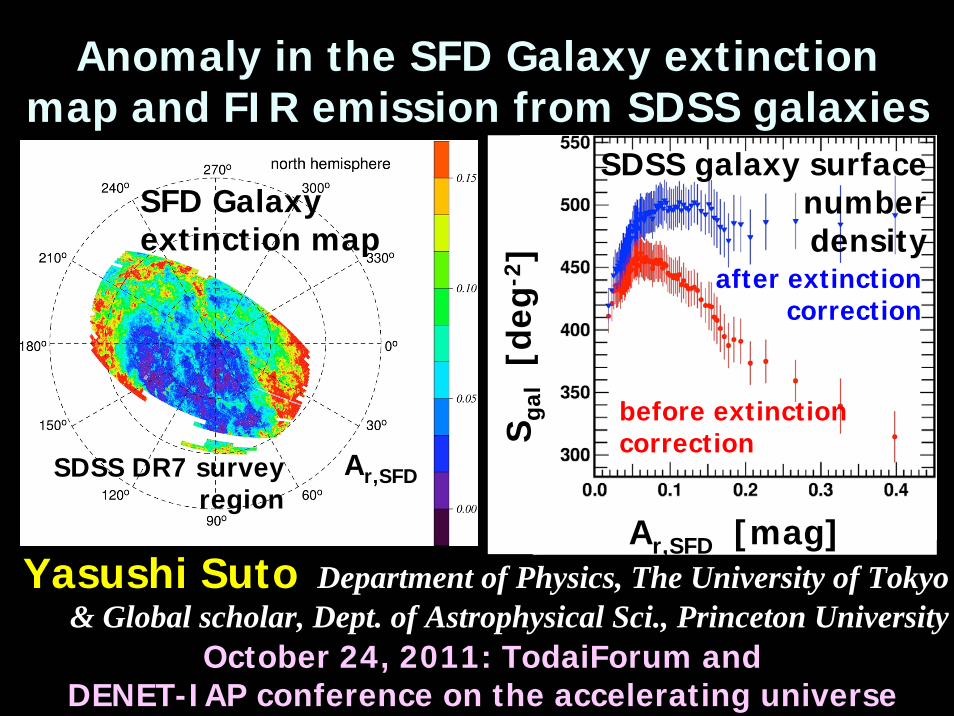
Anomaly in the SFD Galaxy extinction map and FIR emission from SDSS galaxies
Yasushi Suto Department of Physics, The University of Tokyo& Global scholar, Dept. of Astrophysical Sci., Princeton University
October 24, 2011: TodaiForum andDENET-IAP conference on the accelerating universe
SFD Galaxy extinction map
Ar,SFDSDSS DR7 surveyregion
Ar,SFD [mag]S g
al[d
eg-2
]
after extinctioncorrection
SDSS galaxy surfacenumberdensity
before extinctioncorrection
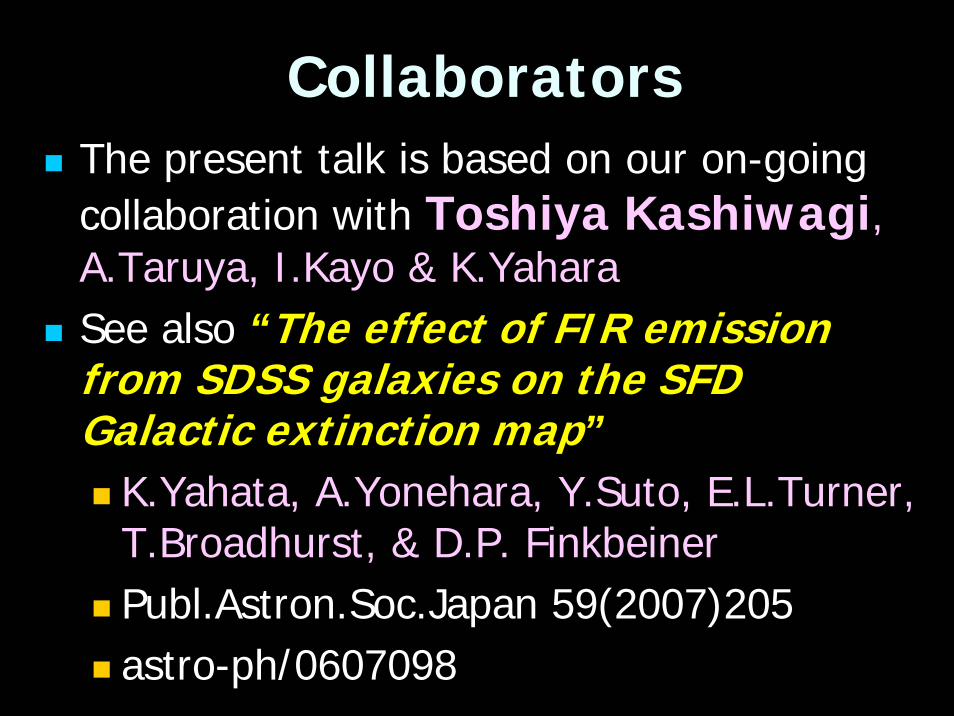
CollaboratorsThe present talk is based on our on-going collaboration with Toshiya Kashiwagi, A.Taruya, I.Kayo & K.YaharaSee also “The effect of FIR emission from SDSS galaxies on the SFD Galactic extinction map”
K.Yahata, A.Yonehara, Y.Suto, E.L.Turner, T.Broadhurst, & D.P. FinkbeinerPubl.Astron.Soc.Japan 59(2007)205astro-ph/0607098
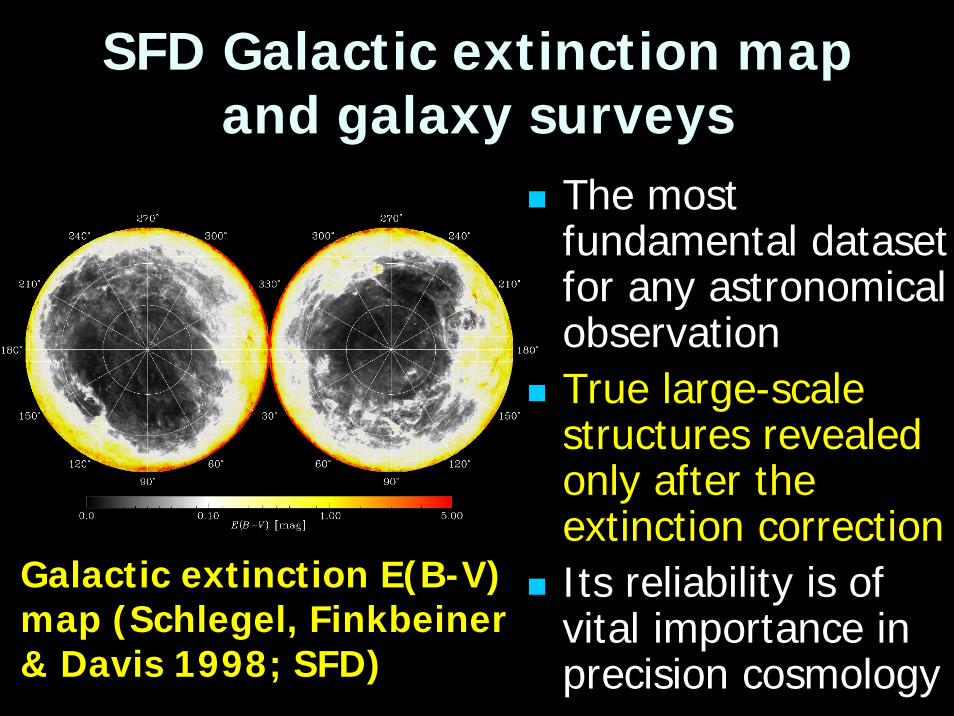
SFD Galactic extinction map and galaxy surveys
The most fundamental dataset for any astronomical observationTrue large-scale structures revealed only after the extinction correctionIts reliability is of vital importance in precision cosmology
Galactic extinction E(B-V) map (Schlegel, Finkbeiner& Davis 1998; SFD)
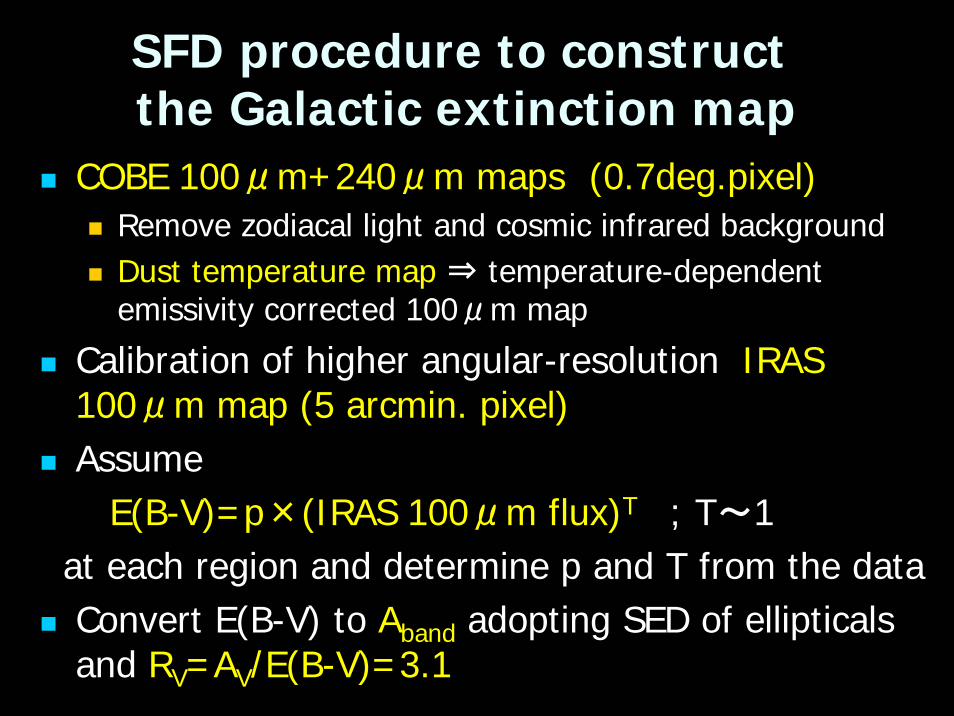
SFD procedure to construct the Galactic extinction map
COBE 100μm+240μm maps (0.7deg.pixel)Remove zodiacal light and cosmic infrared backgroundDust temperature map ⇒ temperature-dependent emissivity corrected 100μm map
Calibration of higher angular-resolution IRAS 100μm map (5 arcmin. pixel)Assume
E(B-V)=p×(IRAS 100μm flux)T ; T~1at each region and determine p and T from the dataConvert E(B-V) to Aband adopting SED of ellipticalsand RV=AV/E(B-V)=3.1
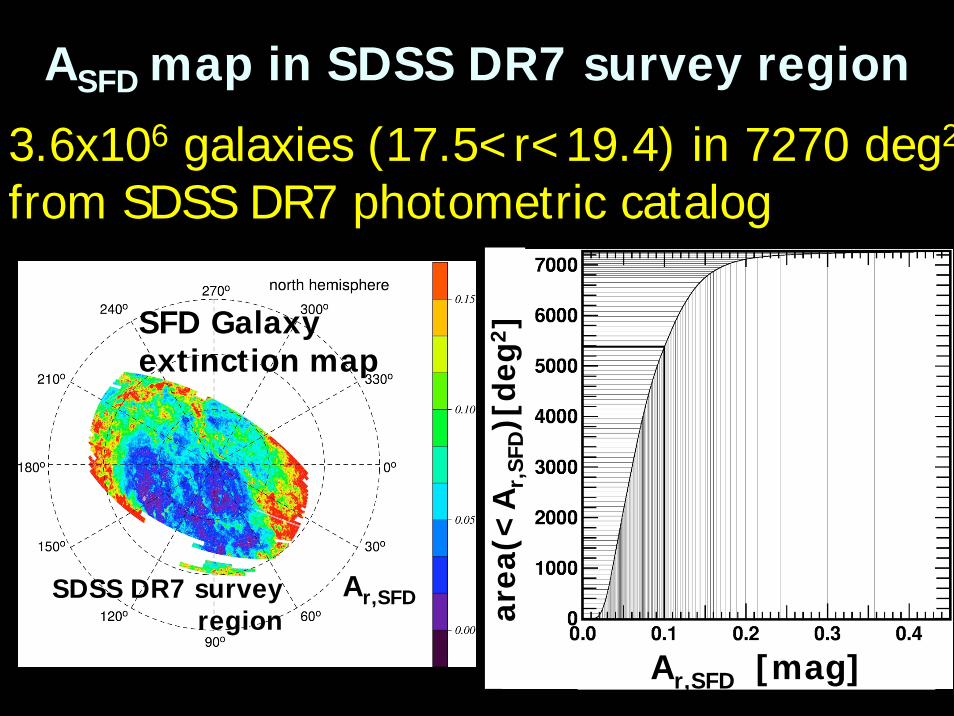
ASFD map in SDSS DR7 survey region
3.6x10⁶ galaxies (17.5<r<19.4) in 7270 deg2
from SDSS DR7 photometric catalog
SFD Galaxy extinction map
Ar,SFDSDSS DR7 surveyregion
Ar,SFD [mag]
area
(<A
r,SF
D)[
deg2
]
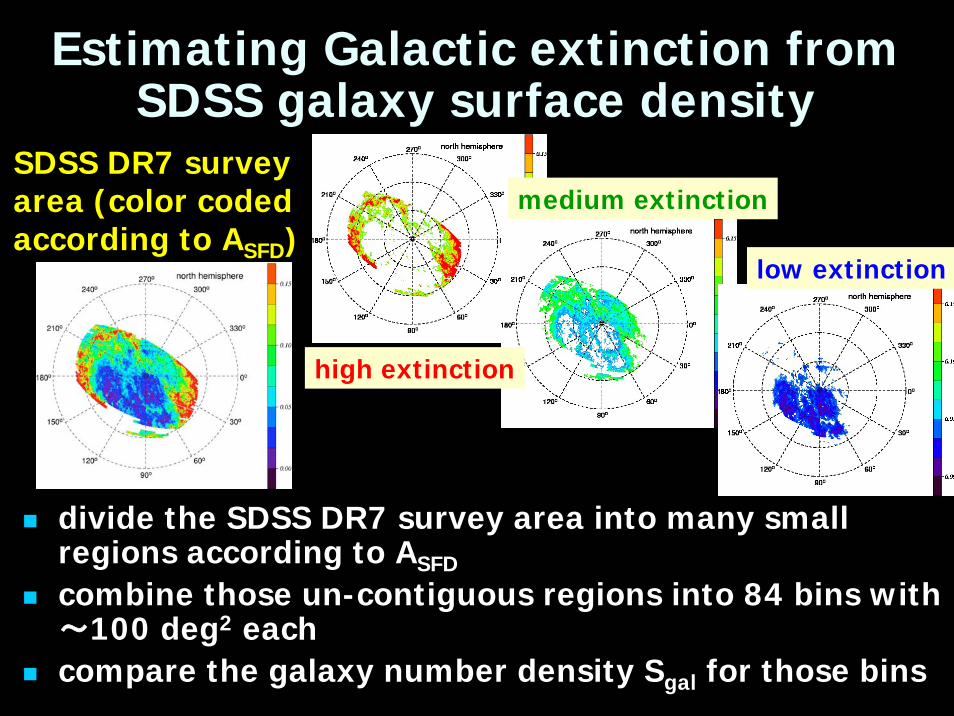
Estimating Galactic extinction from SDSS galaxy surface density
divide the SDSS DR7 survey area into many small regions according to ASFD
combine those un-contiguous regions into 84 bins with ~100 deg2 eachcompare the galaxy number density Sgal for those bins
SDSS DR7 survey area (color coded according to ASFD)
medium extinction
low extinction
high extinction
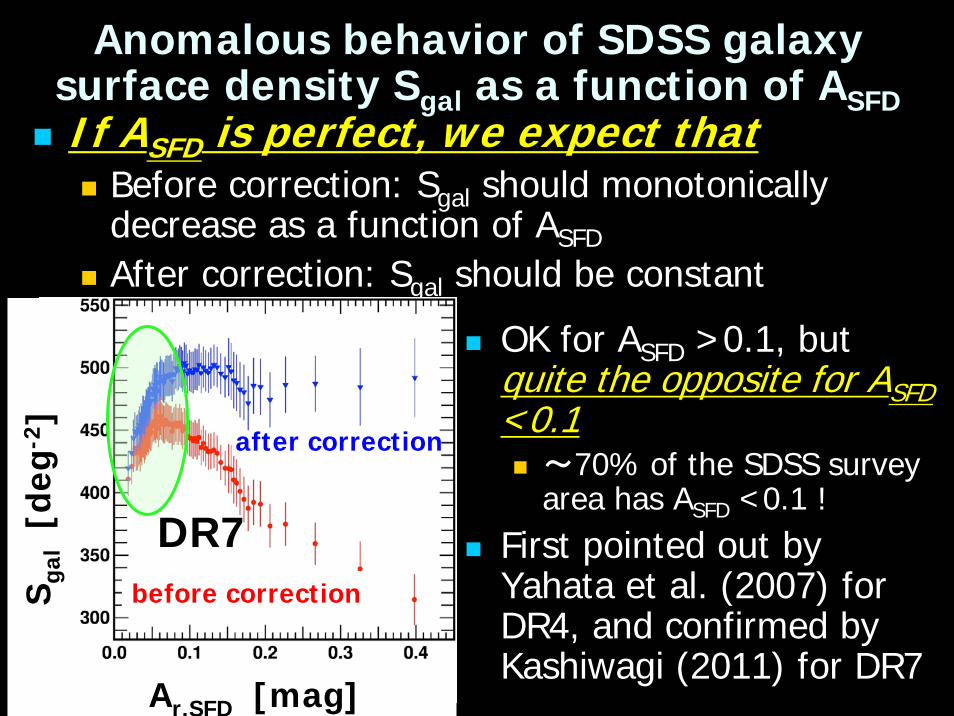
Anomalous behavior of SDSS galaxy surface density Sgal as a function of ASFDIf ASFD is perfect, we expect that
Before correction: Sgal should monotonically decrease as a function of ASFD
After correction: Sgal should be constant
OK for ASFD >0.1, but quite the opposite for ASFD<0.1
~70% of the SDSS survey area has ASFD <0.1 !
First pointed out by Yahata et al. (2007) for DR4, and confirmed by Kashiwagi (2011) for DR7
Ar,SFD [mag]
S gal
[deg
-2]
before correction
after correction
DR7

Origin of the anomalyASFD is estimated assuming that the reddening is proportional to the FIR emission flux (100μm)
the anomaly indicates the positive correlation between galaxy surface density and the FIR flux at least where the real extinction is small
100μm flux = Galactic dust + galaxiescontamination by the FIR emission from galaxies proposed by Yahata et al. (2007)
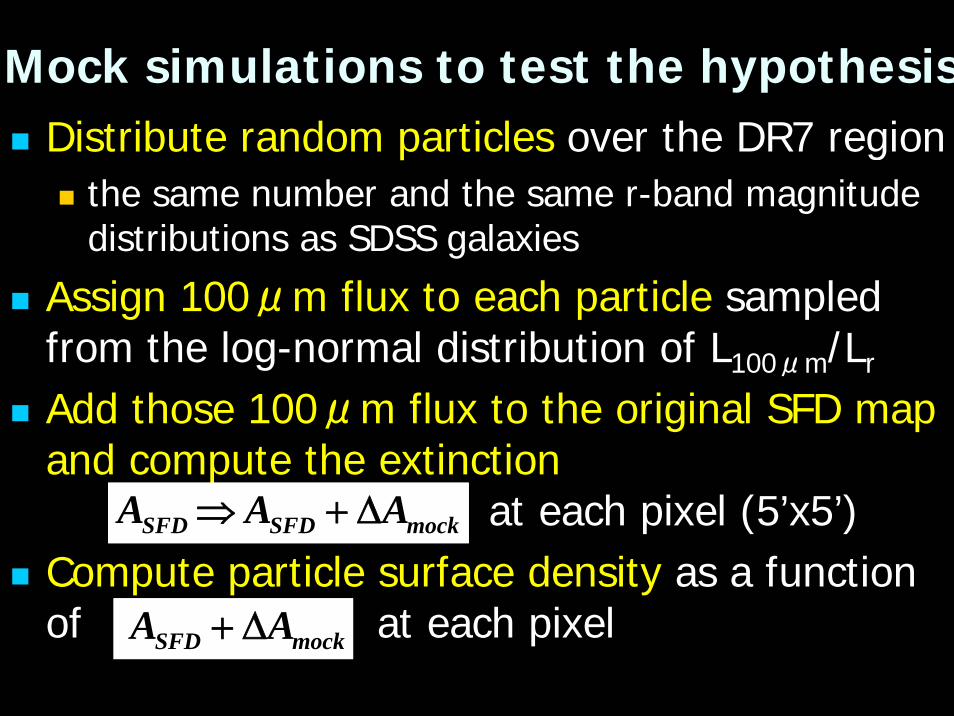
Mock simulations to test the hypothesisDistribute random particles over the DR7 region
the same number and the same r-band magnitude distributions as SDSS galaxies
Assign 100μm flux to each particle sampled from the log-normal distribution of L100μm/Lr
Add those 100μm flux to the original SFD map and compute the extinction
at each pixel (5’x5’)Compute particle surface density as a function of at each pixel
mockSFDSFD AAA Δ+⇒
mockSFD AA Δ+
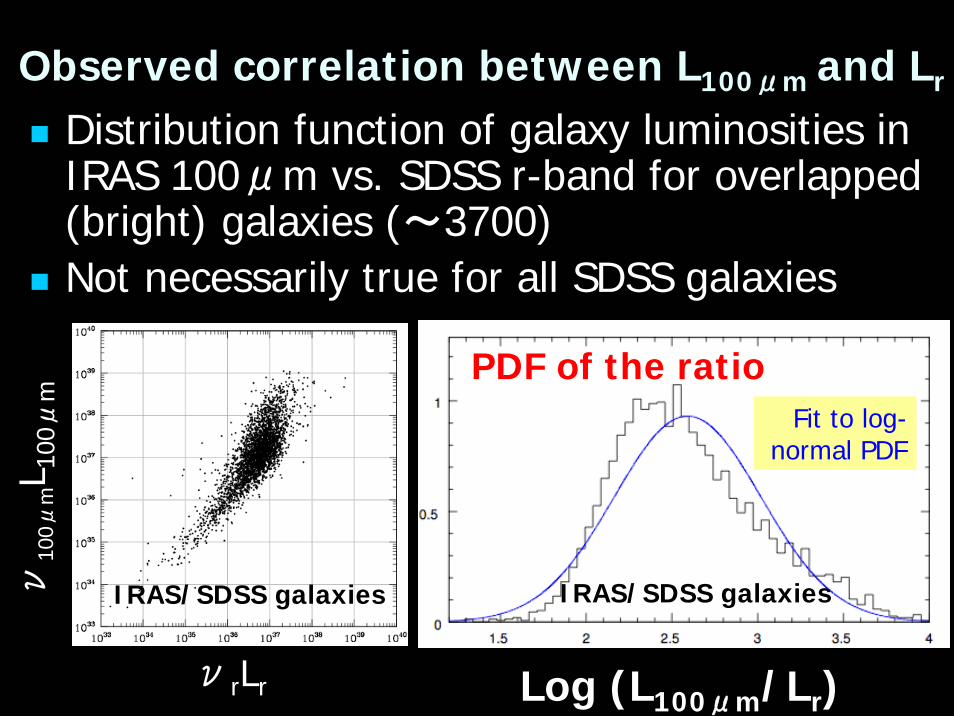
Observed correlation between L100μm and Lr
Distribution function of galaxy luminosities in IRAS 100μm vs. SDSS r-band for overlapped (bright) galaxies (~3700)Not necessarily true for all SDSS galaxies
Log (L100μm/Lr)
PDF of the ratioFit to log-
normal PDF
νrLr
IRAS/SDSS galaxiesν10
0μmL 1
00μ
m
IRAS/SDSS galaxies
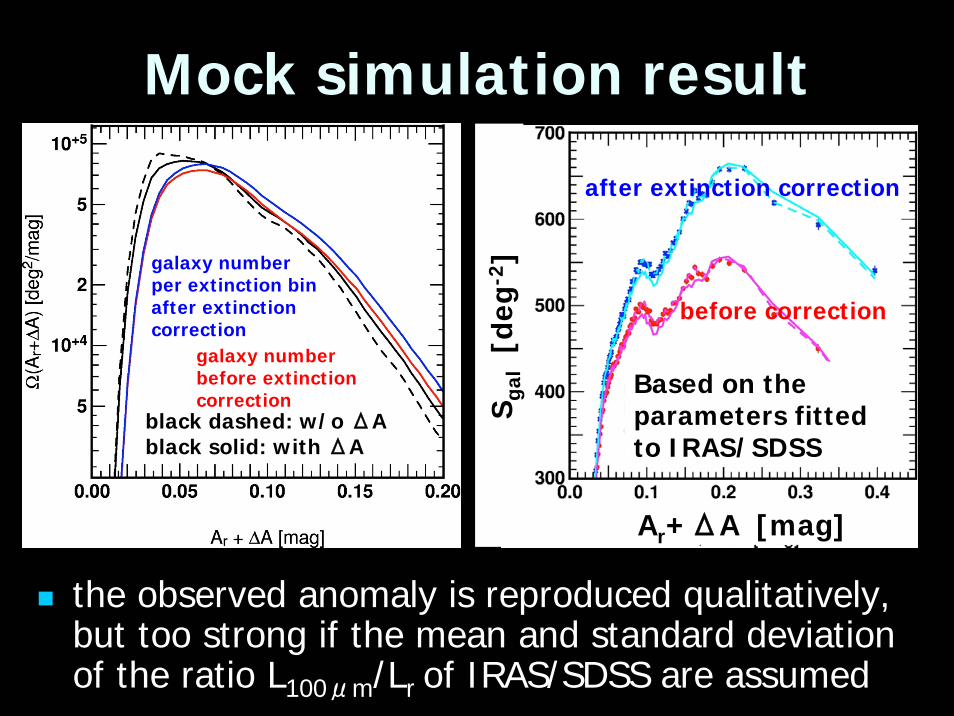
Mock simulation result
the observed anomaly is reproduced qualitatively, but too strong if the mean and standard deviation of the ratio L100μm/Lr of IRAS/SDSS are assumed
black dashed: w/o ΔAblack solid: with ΔA
galaxy number per extinction bin after extinction correction
galaxy number before extinction correction
after extinction correction
before correction
Ar+ΔA [mag]S g
al[d
eg-2
]
Based on the parameters fitted to IRAS/SDSS
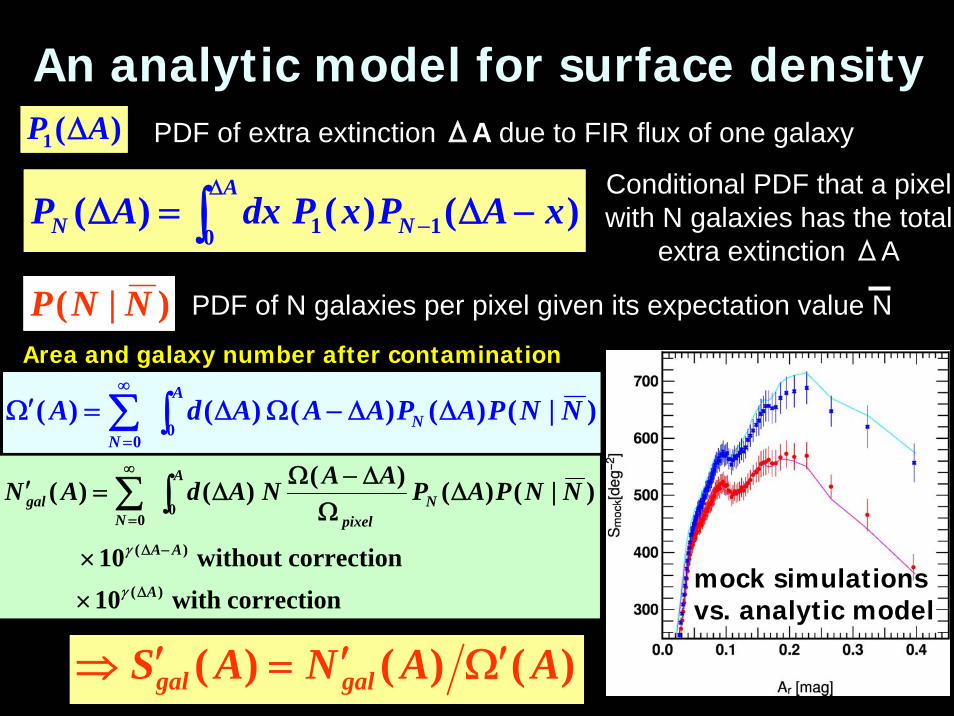
An analytic model for surface densityPDF of extra extinction ΔA due to FIR flux of one galaxy
PDF of N galaxies per pixel given its expectation value N
Conditional PDF that a pixel with N galaxies has the total
extra extinction ΔA
)(1 AP Δ
)|( NNP
)()()( 110xAPxPdxAP N
A
N −Δ=Δ −
Δ
∫
)|()()()()(0
0
NNPAPAAAdA N
A
N
ΔΔ−ΩΔ=Ω′ ∫∑∞
=
correctionwith10correctionwithout10
)|()()()()(
)(
)(
00
A
AA
Npixel
A
Ngal NNPAPAANAdAN
Δ
−Δ
∞
=
×
×
ΔΩ
Δ−ΩΔ=′ ∫∑
γ
γ
)()()( AANAS galgal Ω′′=′⇒
mock simulationsvs. analytic model
Area and galaxy number after contamination
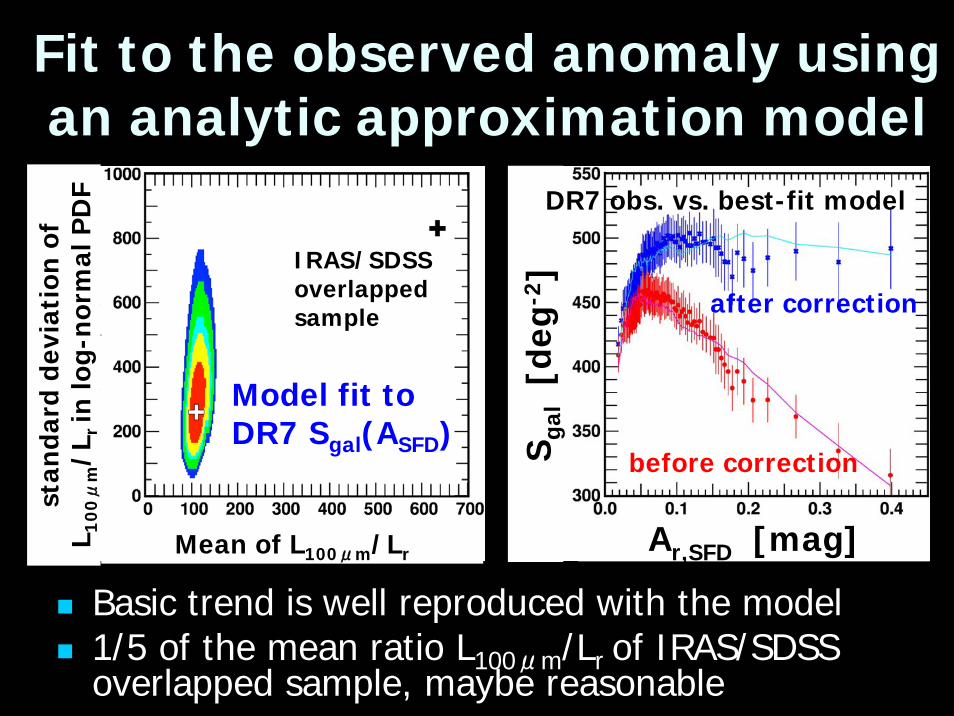
Fit to the observed anomaly using an analytic approximation model
Basic trend is well reproduced with the model1/5 of the mean ratio L100μm/Lr of IRAS/SDSS overlapped sample, maybe reasonable
Ar,SFD [mag]S g
al[d
eg-2
]
before correction
after correction
DR7 obs. vs. best-fit model
IRAS/SDSS overlapped sample
Model fit to DR7 Sgal(ASFD)
Mean of L100μm/Lr
stan
dard
dev
iati
on o
f L 1
00μ
m/L
r in
log-
nor
mal
PD
F
ConclusionsAn anomaly in the SFD Galactic extinction map is confirmed with SDSS DR7 analysisThe anomaly would be due to FIR emission from galaxies
Implications on precision cosmology remain to be studied
More accurate Galactic extinction map with higher angular resolution AKARI IR map and/or Planck IR/temperature map