Embed Size (px)
Citation preview
SFD Promotion Initiative
Delhi
India
Final Report
This SFD Report was created through field-based research by Centre for Science and Environment (CSE)
as part of the SFD Promotion Initiative.
Date of production: 08/02/2016
Last update: 20/02/2016
Last Update: 20/02/2016
Delhi
India Produced by:CSE SFD Report
SFD Report Delhi, India, 2016
Produced by:
Suresh Kumar Rohilla, CSE
Bhitush Luthra, CSE
Rahul Sanka Varma, CSE
Shantanu Kumar Padhi, CSE
Anil Yadav, CSE
©Copyright All SFD Promotion Initiative materials are freely available following the open-source concept for capacity development
and non-profit use, so long as proper acknowledgement of the source is made when used. Users should always give
credit in citations to the original author, source and copyright holder.
This Executive Summary and SFD Report are available from:
www.sfd.susana.org
Last Update: 20/02/2016 i
Delhi
India
Produced by: CSE Executive Summary
1. The Diagram
2. Diagram information
Desk or field based:
This is a field based SFD
Produced by:
Centre for Science and Environment (CSE), New Delhi
Status:
This is a final SFD
Date of production:
08/02/2016
3. General city information
Delhi is the capital of India, the largest democracy of the world. It is officially known as the National Capital Territory (NCT) of Delhi, The NCT of Delhi is a special union territory of India jointly administered by the Central government, the NCT elected government, three municipal corporations, New Delhi Municipal Council and Delhi Cantonment Board.
The population of NCT of Delhi as per the Census 2011 is 16,787,941. The density of city is 11,320 persons per sq.km. Total slum population is 1,785,390 which is 10.6% of the total population (Census of India, 2011). The floating population is around 0.4 to 0.5 million. NCT of Delhi comprises of an area of 1484 sq.km. Delhi Urban Agglomeration has been chosen for the current study. It comprises of population of 16,349,831.
Last Update: 20/02/2016 ii
Delhi
India
Produced by: CSE Executive Summary
4. Service delivery context
In 2008, the Ministry of Urban Development (MoUD) issued the National Urban Sanitation Policy (NUSP). The policy aims to: raise awareness, promote behavior change; achieve open defecation free cities; develop citywide sanitation plans; and provide 100% safe confinement, transport, treatment and disposal of human excreta and liquid wastes. The NUSP mandates states to develop state urban sanitation strategies and work with cities to develop City Sanitation Plans (CSPs). Furthermore, it explicitly states that cities and states must issue policies and technical solutions that address onsite sanitation, including the safe confinement of faecal sludge (FS) (USAID, 2010).
The objectives of NUSP are to be realized through CSPs and state sanitation strategies. As of now there are very few cities which have finalized their CSPs. This remains a major drawback in implementation of NUSP.
The advisory note on septage management in urban India, issued by MoUD in 2013, recommends supplementing CSPs with Septage Management Sub-Plan (SMP). Still septage management in India is not prominent due to lack of knowledge, consideration of septage management as an interim solution, lack of sufficient funding and many other socio-political issues.
There are no specific legal provisions relating to septage management, but there are a number of provisions relating to sanitation services and environmental regulations, which majorly stems from, The Environment (Protection) Act, 1986 and the Water (Prevention and Control of Pollution) Acts. Municipal acts and regulations usually refer to management of solid and liquid wastes but may not provide detailed rules for septage management (MoUD, 2013).
5. Service outcomes
Overview on technologies and methods used
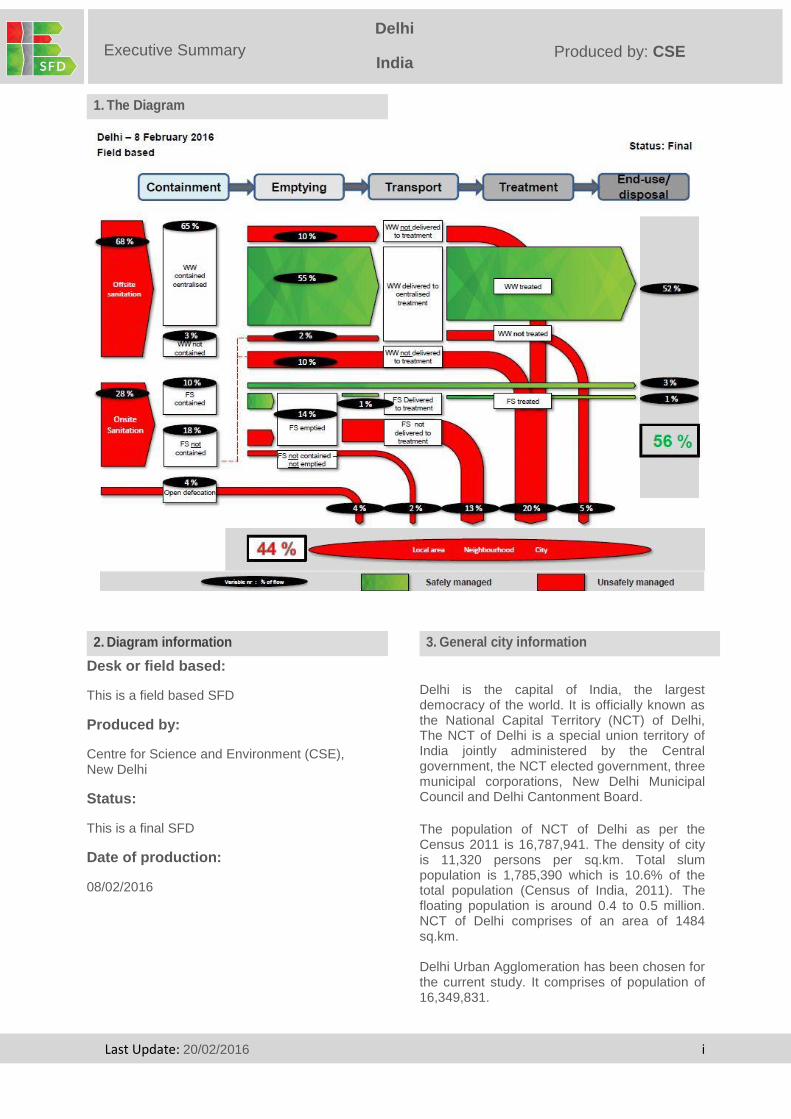
for different sanitation systems through the sanitation service chain is as follows: Containment: According to the field based study and census, 2011, 68% of the city population is dependent on offsite sanitation system. Nearly 28 % is dependent on onsite sanitation systems. Rest 4% of the population practices open defecation. Generally low to middle income group households have single chamber septic/fully lined tanks. Double chamber septic tanks are prevalent in middle to high income groups and apartments. Due to space
constraints, households are compelled to have minimal sanitation facilities within their premises. Due to non availability of sewerage network, fully lined tanks in few unplanned settlements in Delhi are designed with an outlet connected to open drains. Containment system is maintained by individual owners and drains are maintained by Municipal Corporation of Delhi (MCD). According to the survey, size of a septic tank/ fully lined tanks in individual houses ranges from 3 to 8 m
3, the size of a septic tank
in office or apartment buildings are much larger and vary widely in size depending on the users. Emptying: In Delhi, septage emptying services are not managed or regulated by the state government. Recently, DJB has initiated a step towards regularization of private emptying service and issued a public notification on procedure of acquiring license for private emptiers. Households are dependent on private service providers for OSS emptying service. According to survey conducted with private emptiers it is estimated that 350-400 vacuum tankers are running in the city. Private emptiers work in informal way either in unions or individuals. The emptying vehicle used is a tractor or a mini truck with a tank attached. The emptying fee ranges from INR 500 to 3000 (7.36 - 44.16 USD). It depends upon the factors like size of tank, length of pipe used to reach the septic tank and distance travelled for emptying service.
Transport: The sewerage network comprises of 7,000 km of sewers including trunk sewers and branch sewers (peripheral/internal sewers). This includes main trunk sewers of total length of 192 km (DJB, 2014). Septage is generally transported through truck or tractor mounted vacuum tankers. During the Focus Group Discussions (FGDs) with private emptiers, it was reported that at-least two trips are done per day and the service is provided within 10 km radius to make business economically viable. Effluent from the OSS is generally discharged in storm water drain/open drain.
Treatment: It is reported that Delhi’s sewage generation is 3800 MLD (CPCB, 2015). According to the CPCB the overall treatment capacity of the STPs is 3049 MLD and operational capacity is 2671 MLD (CPCB, 2015). According to DJB’s press release; 30 STPs are operational and are treating 2025 MLD of wastewater (WW) which also includes WW from intercepted open drains (DJB, 2015). There is no separate septage treatment plant. During FGDs with private emptiers in Dwarka, it is reported that emptiers in Dwarka sector-18 discharge septage to the Pappan Kallan STP.
Last Update: 20/02/2016 iii
Delhi
India
Produced by: CSE Executive Summary
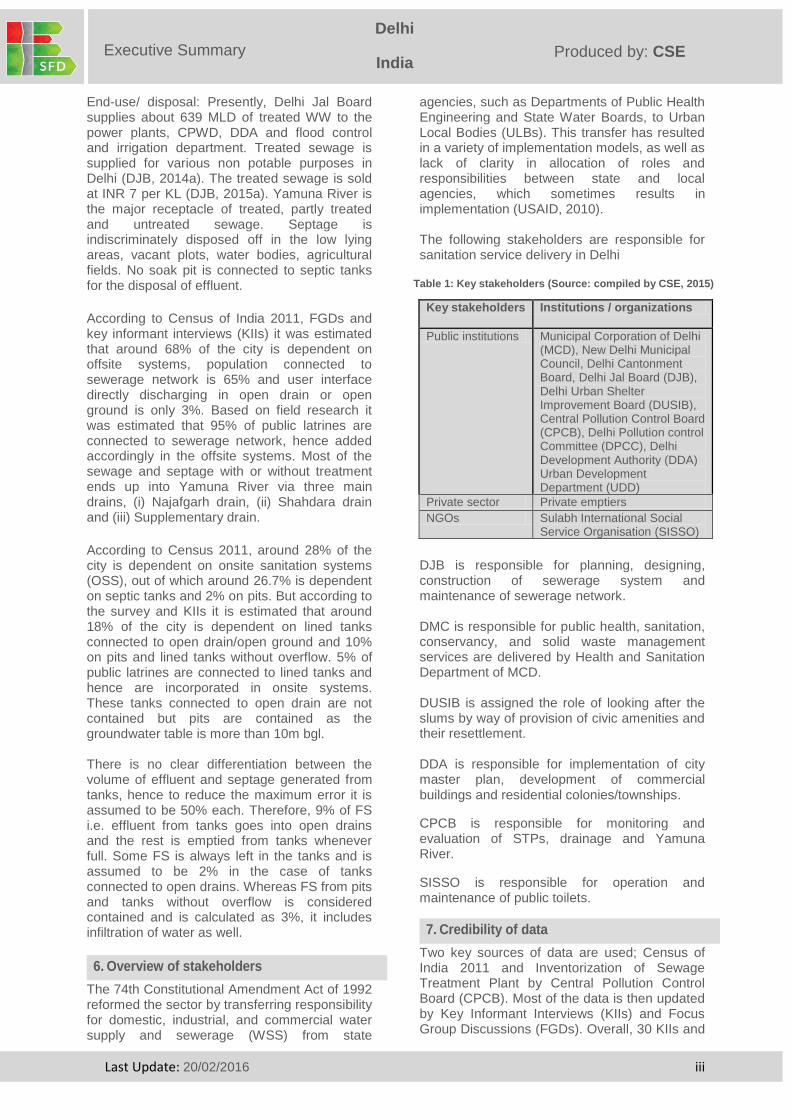
End-use/ disposal: Presently, Delhi Jal Board supplies about 639 MLD of treated WW to the power plants, CPWD, DDA and flood control and irrigation department. Treated sewage is supplied for various non potable purposes in Delhi (DJB, 2014a). The treated sewage is sold at INR 7 per KL (DJB, 2015a). Yamuna River is the major receptacle of treated, partly treated and untreated sewage. Septage is indiscriminately disposed off in the low lying areas, vacant plots, water bodies, agricultural fields. No soak pit is connected to septic tanks for the disposal of effluent.
According to Census of India 2011, FGDs and key informant interviews (KIIs) it was estimated that around 68% of the city is dependent on offsite systems, population connected to sewerage network is 65% and user interface directly discharging in open drain or open ground is only 3%. Based on field research it was estimated that 95% of public latrines are connected to sewerage network, hence added accordingly in the offsite systems. Most of the sewage and septage with or without treatment ends up into Yamuna River via three main drains, (i) Najafgarh drain, (ii) Shahdara drain and (iii) Supplementary drain.
According to Census 2011, around 28% of the city is dependent on onsite sanitation systems (OSS), out of which around 26.7% is dependent on septic tanks and 2% on pits. But according to the survey and KIIs it is estimated that around 18% of the city is dependent on lined tanks connected to open drain/open ground and 10% on pits and lined tanks without overflow. 5% of public latrines are connected to lined tanks and hence are incorporated in onsite systems. These tanks connected to open drain are not contained but pits are contained as the groundwater table is more than 10m bgl. There is no clear differentiation between the volume of effluent and septage generated from tanks, hence to reduce the maximum error it is assumed to be 50% each. Therefore, 9% of FS i.e. effluent from tanks goes into open drains and the rest is emptied from tanks whenever full. Some FS is always left in the tanks and is assumed to be 2% in the case of tanks connected to open drains. Whereas FS from pits and tanks without overflow is considered contained and is calculated as 3%, it includes infiltration of water as well.
6. Overview of stakeholders
The 74th Constitutional Amendment Act of 1992 reformed the sector by transferring responsibility for domestic, industrial, and commercial water supply and sewerage (WSS) from state
agencies, such as Departments of Public Health Engineering and State Water Boards, to Urban Local Bodies (ULBs). This transfer has resulted in a variety of implementation models, as well as lack of clarity in allocation of roles and responsibilities between state and local agencies, which sometimes results in implementation (USAID, 2010). The following stakeholders are responsible for sanitation service delivery in Delhi
Table 1: Key stakeholders (Source: compiled by CSE, 2015)
DJB is responsible for planning, designing, construction of sewerage system and maintenance of sewerage network. DMC is responsible for public health, sanitation, conservancy, and solid waste management services are delivered by Health and Sanitation Department of MCD. DUSIB is assigned the role of looking after the slums by way of provision of civic amenities and their resettlement. DDA is responsible for implementation of city master plan, development of commercial buildings and residential colonies/townships.
CPCB is responsible for monitoring and evaluation of STPs, drainage and Yamuna River.
SISSO is responsible for operation and maintenance of public toilets.
7. Credibility of data
Two key sources of data are used; Census of India 2011 and Inventorization of Sewage Treatment Plant by Central Pollution Control Board (CPCB). Most of the data is then updated by Key Informant Interviews (KIIs) and Focus Group Discussions (FGDs). Overall, 30 KIIs and
Key stakeholders Institutions / organizations
Public institutions Municipal Corporation of Delhi (MCD), New Delhi Municipal Council, Delhi Cantonment Board, Delhi Jal Board (DJB), Delhi Urban Shelter Improvement Board (DUSIB), Central Pollution Control Board (CPCB), Delhi Pollution control Committee (DPCC), Delhi Development Authority (DDA) Urban Development Department (UDD)
Private sector Private emptiers
NGOs Sulabh International Social Service Organisation (SISSO)
Last Update: 20/02/2016 iv
Delhi
India
Produced by: CSE Executive Summary
4 FGDs were conducted with different stakeholders. There were three major challenges to develop the SFD. Census and published/unpublished reports were not able to provide (i) up-to-date data on containment (ii) detailed typology of containment and (iii) actual information about FSM services provided to households. For this reason, field based studies were conducted to validate the data provided by secondary sources. The Census and published/ unpublished reports mostly differentiate between different types of user interfaces or between septic tanks and pit latrines but not about the design of the actual containment systems on ground level. Therefore, a sample household survey was conducted in OSS dependent wards of the city to identify and cross check the data collected from the Census, 2011. The objective of the survey conducted was to obtain a more accurate measure of how excreta is managed through stages of sanitation service chain (from containment to end-use or disposal).
8. Process of SFD development
Data is collected through secondary sources. The city is visited to conduct the surveys, FGDs and KIIs with relevant stakeholders, to fill in the data gap and to crosscheck the data collected. To start with, a relationship between sanitation technologies defined in Census of India and that defined in the project is established. The survey data is quantified and crosschecked with FGDs and KIIs.
The data is fed into the calculation tool to calculate the excreta flow in terms of percentage of the population. Overall, 56% of excreta is safely managed in the city and rest 44% is unsafely discharged into the environment.
9. List of data sources
Below is the list of data sources used for the development of SFD.
o Published reports and books: Census of India 2011, House listing
and housing data, Government of India
Service levels in water and sanitation sector, MoUD, 2012
Inventorization of Sewage Treatment Plant by CPCB, 2015
o KIIs with representatives from Government agencies: DJB,
DUSIB, CPCB Service providers: SISSO New Delhi railway station Health
Inspector, Community representatives Local masons
o FGDs
DJB Private emptiers
o Survey Educational institutions Commercial establishments
Delhi, India, 2016 Produced by: Suresh Kumar Rohilla, CSE Bhitush Luthra, CSE Rahul Sanka Varma, CSE Shantanu Kumar Padhi, CSE Anil Yadav, CSE
© Copyright All SFD Promotion Initiative materials are freely available following the open-source concept for capacity development and non-profit use, so long as proper acknowledgement of the source is made when used. Users should always give credit in citations to the original author, source and copyright holder. This Executive Summary and SFD Report are
available from:
www.sfd.susana.org
Last Update: 20/02/2016 v
Delhi
India
India
Produced by: CSE SFD Report
Solapur
Table of contents
Executive summary....................................................................................................................i
Table of contents.......................................................................................................................v
List of tables………………………………………………….…………………………….………... vii
List of figures………………………………………………….……………………………………...viii
Abbreviations……………………………………………………………………………………...…..ix
1 City context ..................................................................................................................... 1
2 Service delivery context description/analysis ................................................................... 3
2.1 Policy, legislation and regulation .............................................................................. 3
2.1.1 Policies, legislations and regulations at national level........................................ 3
2.1.2 Policies, legislations and regulations at state level and ULB level ..................... 4
2.1.3 Institutional roles ............................................................................................... 5
2.1.4 Service provision ............................................................................................... 7
2.2 Planning ................................................................................................................... 7
2.2.1 Service targets .................................................................................................. 7
2.2.2 Investments ....................................................................................................... 8
2.3 Reducing inequity ..................................................................................................... 9
2.3.1 Current choice of services for the urban poor .................................................... 9
2.3.2 Plans and measures to reduce inequity ............................................................. 9
2.4 Outputs .................................................................................................................. 10
2.4.1 Capacity to meet service needs, demands and targets ................................... 10
2.4.2 Monitoring and reporting access to services .................................................... 10
2.5 Expansion .............................................................................................................. 10
2.5.1 Stimulating demand for services ..................................................................... 10
2.5.2 Strengthening service provider roles ............................................................... 11
2.5.3 Service standards ........................................................................................... 11
3 Service outcomes .......................................................................................................... 12
3.1 Overview ................................................................................................................ 12
3.1.1 Sanitation facilities .......................................................................................... 13
3.1.2 Containment .................................................................................................... 13
3.1.3 Emptying services ........................................................................................... 17
3.1.4 Treatment ........................................................................................................ 20
3.1.5 End use/ disposal ............................................................................................ 20
3.1.6 Risk of contamination of groundwater ............................................................. 23
Last Update: 20/02/2016 vi
Delhi
India
India
Produced by: CSE SFD Report
Solapur
3.2 SFD matrix ............................................................................................................. 24
3.2.1 SFD matrix explanation ................................................................................... 24
3.3 Discussion of certainty/uncertainty levels of associated data used for the SFD matrix 29
4 Stakeholder engagement .............................................................................................. 30
4.1 Key informant interviews ............................................................................................. 30
4.2 Field observations ....................................................................................................... 30
4.3 Focus group discussions ............................................................................................. 33
5 Acknowledgement ......................................................................................................... 34
6 References .................................................................................................................... 35
7 Appendix ....................................................................................................................... 38
7.1 Appendix 1: Stakeholder identification .................................................................... 38
7.2 Appendix 2: Tracking of engagement ..................................................................... 39
7.3 Appendix 3: SFD matrix ......................................................................................... 41
7.4 Appendix 4: SFD calculation tool ............................................................................ 42
7.5 Appendix 5: Raw water sources and water production ........................................... 43
7.6 Appendix 6: Organogram of Delhi Jal Board .......................................................... 44
7.7 Appendix 7: Maps of Delhi...................................................................................... 45
7.8 Appendix 8: Public toilet survey .............................................................................. 48
7.9 Appendix 9: Sanitation facilities in commercial and educational establishments ..... 49
7.10 Appendix 10: Details of STPs based on KII ............................................................ 50
7.11 Appendix 11: Photographs of community and public toilets in slums and markets .. 51
7.12 Appendix 12: Photographs of household survey in slums ...................................... 53
7.13 Appendix 13: Survey with private emptiers ............................................................. 54
7.14 Appendix 14: Application for the license to run emptying business and dispose
septage in pumping stations ............................................................................................. 55
Last Update: 20/02/2016 vii
Delhi
India
India
Produced by: CSE SFD Report
Solapur
List of tables
Table 1: Population growth rate ............................................................................................. 1
Table 2: Roles and responsibilities ........................................................................................ 6
Table 3: Service delivery targets in accordance with SLBs .................................................... 8
Table 4: Proposed investments for sewerage network .......................................................... 8
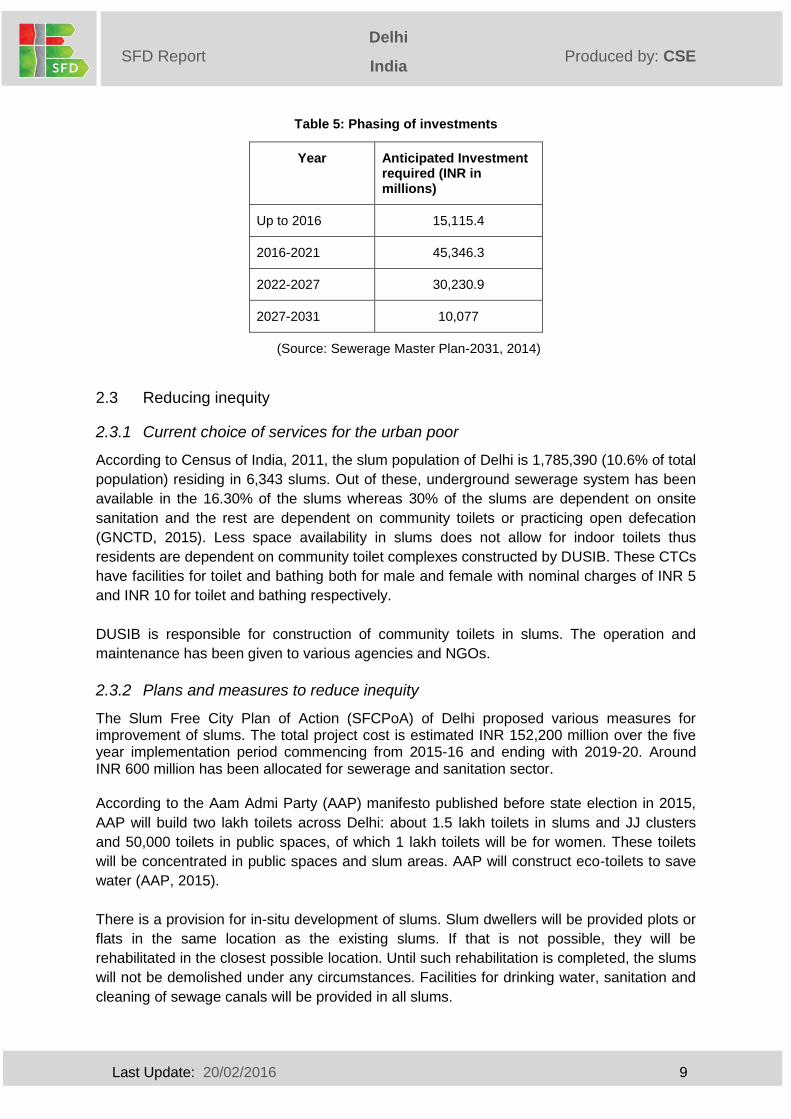
Table 5: Phasing of investments ............................................................................................ 9
Table 6: Sanitation technologies and contribution of excreta in terms of percentage of
population.............................................................................................................................12
Table 7: STPs in Delhi: technology and status .....................................................................14
Table 8: Treated sewage supply for various purposes ..........................................................20
Table 9: Containment systems and corresponding percentage of population using these
systems ................................................................................................................................25
Table 10: Estimation for the SFD matrix calculations on containment ...................................26
Table 11: Description and estimation of variables used in SFD for containment systems .....27
Table 12: Description and estimation of variables used in SFD for emptying and
transportation .......................................................................................................................27
Table 13: Description and estimation of variables used in SFD for treatment and disposal ..28
Table 14: Data on generation, capacity and treatment (in MLD) ...........................................29
Table 15: Range of emptying period .....................................................................................31
Table 16: Stakeholder identification ......................................................................................38
Table 17: Tracking of engagement .......................................................................................39
Table 18: Sanitation containment system of Delhi as in the SFD calculation tool..................42
Table 19: Raw water sources and water production .............................................................43
Table 20: Public toilet survey ................................................................................................48
Table 21: Sanitation facilities in NDLS and schools ..............................................................49
Table 22: Sanitation facilities in markets ...............................................................................49
Table 23: STPs survey .........................................................................................................50
Last Update: 20/02/2016 viii
Delhi
India
India
Produced by: CSE SFD Report
Solapur
List of figures
Figure 1: Ward map of Delhi .................................................................................................. 2
Figure 2: Type of discharge from household ........................................................................15
Figure 3: Type of containment systems observed during field based study .........................16
Figure 4: Truck mounted vacuum tanker .............................................................................17
Figure 5: Tractor mounted vacuum tanker ............................................................................18
Figure 6: Emptying process followed by private service provider ..........................................18
Figure 7: Type of vacuum tankers and their capacity ............................................................19
Figure 8: Disposal of septage ...............................................................................................21
Figure 9: Sewage disposal in the environment ....................................................................21
Figure 10: Septage disposal in the environment ...................................................................22
Figure 11: Vehicle ownership ...............................................................................................31
Figure 12: Emptying fee .......................................................................................................31
Figure 13: Average distance travelled by emptying vehicle ..................................................32
Figure 14: Age of vehicle ......................................................................................................32
Figure 15: Map of OSS dependence area ............................................................................33
Figure 16: SFD matrix ..........................................................................................................41
Figure 17: Organogram of Delhi Jal Board ...........................................................................44
Figure 18: Drainage map of Delhi .........................................................................................45
Figure 19: STPs command area ...........................................................................................46
Figure 20: Groundwater potential ........................................................................................47
Figure 21: Public toilets .......................................................................................................51
Figure 22: Prefabricated bio-digester toilets in night shelters ................................................52
Figure 23: Household survey in slums .................................................................................53
Figure 24: Survey with private emptiers ................................................................................54
Last Update: 20/02/2016 ix
Delhi
India
India
Produced by: CSE SFD Report
Solapur Abbreviations
AAP Aam Aadmi Party
ASP Activated Sludge Process
BGL Below Ground Level
BPL Below Poverty Line
BIO-FOR Biological Filtration Oxygenated Reactor
BIS Bureau of Indian Standard
CDP City Development Plan
CETP Common effluent treatment plant
CGWB Central Ground Water Board
CPCB Central Pollution Control Board
CPHEEO Central Public Health and Environmental Engineering Organisation
CPR Centre for Policy Research
CPWD Central Public Works Department
CSE Centre for Science and Environment
CSP City Sanitation Plan
DDA Delhi Development Authority
DJB Delhi Jal Board
DPCC Delhi Pollution Control Committee
DRDO Defence Research Development Organisation
DUSIB Delhi Urban Shelter Improvement Board
EA Extended Aeration
EDMC East Delhi Municipal Corporation
EWS Economically Weaker Section
FS Faecal Sludge
GNCTD Government of National Capital Territory of Delhi
INR Indian Rupees (1 USD= 68.8 INR)
Last Update: 20/02/2016 x
Delhi
India
India
Produced by: CSE SFD Report
Solapur
JJC Jhuggi Jhopadi Clusters
MBR Membrane Biological Reactor
MCD Municipal Corporation of Delhi
MoEF Ministry of Environment and Forest
MoUD Ministry of Urban Development
NCR National Capital Region
NCT National Capital Territory
NDMC North Delhi Municipal Corporation
NGO Non-governmental Organization
NIUA National Institute of Urban Affairs
OP Oxidation Pond
OSS On-site Sanitation System
SBR Sequential Batch Reactor
SDMC South Delhi Municipal Corporation
SFCPoA Slum Free City Plan of Action
SISSO Sulabh International Social Service Organisation
SLB Service Level Benchmarks
SMP Septage Management Plan
STP Sewage Treatment Plant
SWM Solid Waste Management
UA Urban Agglomeration
UDD Department of Urban Development
USAID United States Agency for International Department
USD United States Dollar
WTP Water Treatment Plant
WSSD Water Supply and Sanitation Department
WW Waste Water
WWTP Waste Water Treatment Plant
Last Update: 20/02/2016 1
Delhi
India
India
Produced by: CSE SFD Report
Solapur
1 City context
Delhi is the capital of India, the largest democracy of the world. It is officially known as the
National Capital Territory (NCT) of Delhi. The NCT of Delhi is a special union territory of
India jointly administered by the Central government, the NCT elected government, three
municipal corporations, New Delhi Municipal Council and Delhi Cantonment Board. Delhi is
the biggest trading center and the largest center for small industries in northern India; it
attracts migrants from neighboring states and other parts of the country.
Delhi is rapidly emerging as a world-class metropolis. It has one of the fastest growing
economies in the country and it has the largest commercial center in northern India. The per
capita income of Delhi is estimated to be INR 219,979. Delhi‟s economy is driven by the
services sector which provides employment to 58% of the labour force (GNCTD, 2014).
The population of NCT of Delhi is 16,787,941 and Delhi Urban Agglomeration (UA) is
16,349,831 persons. Delhi UA has been considered for the current study. The annual
average exponential growth rate of population of Delhi was the highest (6.42%) during 1941-
1951 due to large-scale migration from Pakistan to India after partition in 1947. As per the
1991 census, the annual growth of Delhi‟s population during 1981-91 (4.25%) was almost
double the national average (2.16%) (GNCTD, 2014). The overall population density of Delhi
has increased from 9340 persons per sq.km in 2001 to 11,320 persons per sq.km in 2011.
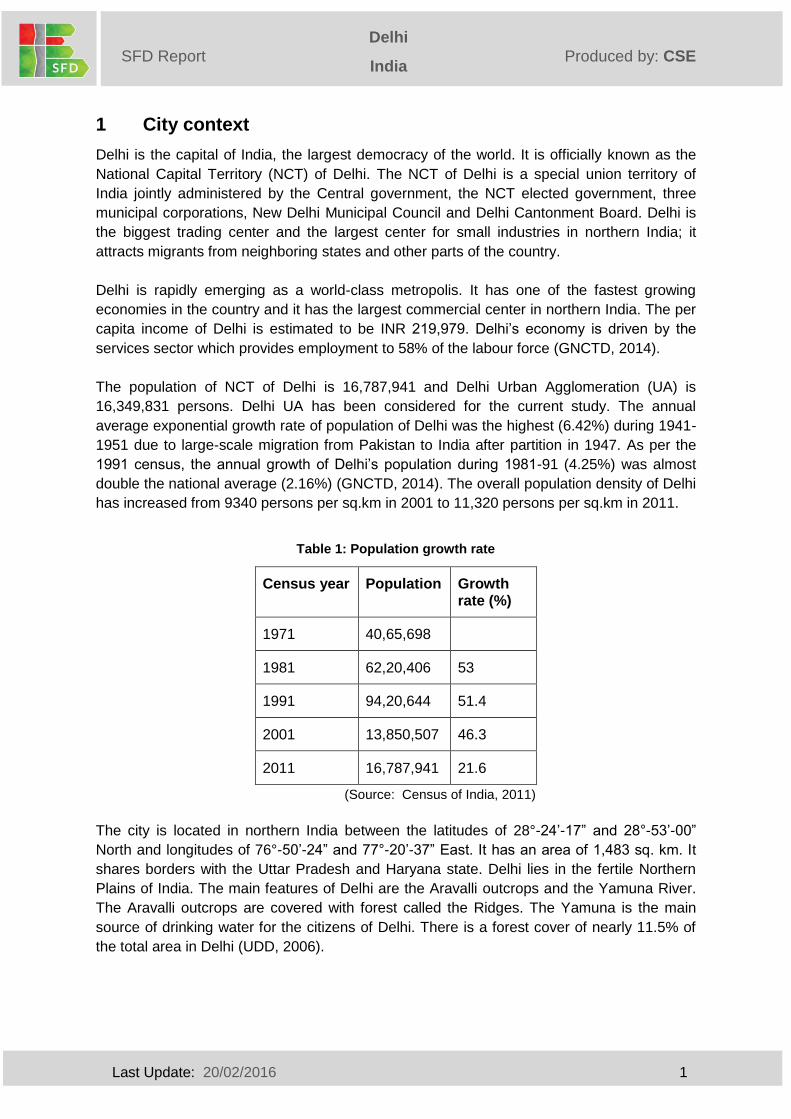
Table 1: Population growth rate
Census year Population Growth rate (%)
1971 40,65,698
1981 62,20,406 53
1991 94,20,644 51.4
2001 13,850,507 46.3
2011 16,787,941 21.6
(Source: Census of India, 2011)
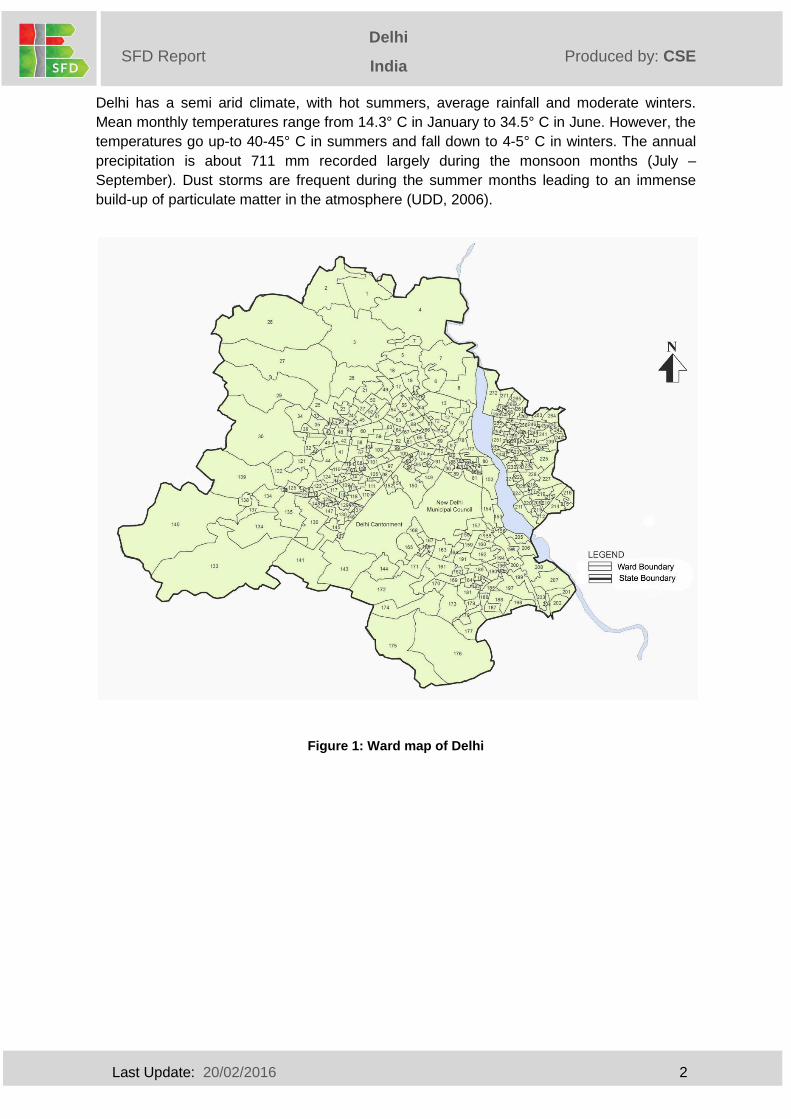
The city is located in northern India between the latitudes of 28°-24‟-17” and 28°-53‟-00”
North and longitudes of 76°-50‟-24” and 77°-20‟-37” East. It has an area of 1,483 sq. km. It
shares borders with the Uttar Pradesh and Haryana state. Delhi lies in the fertile Northern
Plains of India. The main features of Delhi are the Aravalli outcrops and the Yamuna River.
The Aravalli outcrops are covered with forest called the Ridges. The Yamuna is the main
source of drinking water for the citizens of Delhi. There is a forest cover of nearly 11.5% of
the total area in Delhi (UDD, 2006).
Last Update: 20/02/2016 2
Delhi
India
India
Produced by: CSE SFD Report
Solapur
Delhi has a semi arid climate, with hot summers, average rainfall and moderate winters.
Mean monthly temperatures range from 14.3° C in January to 34.5° C in June. However, the
temperatures go up-to 40-45° C in summers and fall down to 4-5° C in winters. The annual
precipitation is about 711 mm recorded largely during the monsoon months (July –
September). Dust storms are frequent during the summer months leading to an immense
build-up of particulate matter in the atmosphere (UDD, 2006).
Figure 1: Ward map of Delhi
Last Update: 20/02/2016 3
Delhi
India
India
Produced by: CSE SFD Report
Solapur
2 Service delivery context description/analysis
2.1 Policy, legislation and regulation
2.1.1 Policies, legislations and regulations at national level
In 2008, the Ministry of Urban Development (MoUD) issued the National Urban Sanitation
Policy (NUSP). The policy aims to: raise awareness, promote behavior change; achieve
open defecation free cities; develop citywide sanitation plans; and provide 100% safe
confinement, transport, treatment and disposal of human excreta and liquid wastes. The
NUSP mandates states to develop state urban sanitation strategies and work with cities to
develop City Sanitation Plans (CSPs). NUSP specifically highlights the importance of safe
and hygienic facilities with proper disposal and treatment of sludge from on-site installations
(septic tanks, pit latrines, etc.) and proper operation and maintenance (O&M) of all sanitary
facilities. Furthermore, it explicitly states that cities and states must issue policies and
technical solutions that address onsite sanitation, including the safe confinement of faecal
sludge (FS) (USAID, 2010). The objectives of NUSP are to be realized through CSPs and
state sanitation strategies. As of now there are very few cities, which have finalized their
CSPs, and those plans are also not implemented. This remains a major drawback in
implementation of NUSP.
The advisory note on septage management in urban India, issued by MoUD in 2013,
recommends supplementing CSPs with Septage Management Sub-Plan (SMP) as a part of
the CSP, being prepared and implemented by cities. Septage here broadly refers to not only
FS removed from septic tanks but also that removed from pit latrines and similar on-site
toilets. This advisory provides references to Central Public Health and Environmental
Engineering Organisation (CPHEEO) guidelines, Bureau of Indian Standard (BIS) standards,
and other resources that users of this advisory may refer for details while preparing their
SMP (MOUD, 2013a).It clearly discusses on techno- managerial and socio- economic
aspects of septage management in India and provides guidelines for Urban Local Bodies
(ULBs) to plan and implement SMP.
There are no specific legal provisions relating to septage management, but there are a
number of provisions relating to sanitation services and environmental regulations, which
majorly stems from, The Environment (Protection) Act, 1986 and the Water (Prevention and
Control of Pollution) Act, 1974. It also applies to households and cities with regard to
disposing wastes into the environment. ULBs/ utilities also have to comply with discharge
norms for effluent released from sewage treatment plants and to pay water cess under the
Water Cess Act, 1977. The ULB is responsible for ensuring the safe handling and disposal
of septage generated within its boundaries, for complying with the Water Act for meeting all
state permit requirements and regulations (CSE, 2010). Municipal acts and regulations
usually refer to management of solid and liquid wastes but may not provide detailed rules for
septage management (MOUD, 2013a).
The Prohibition of Employment as Manual Scavengers and their Rehabilitation Act is
enacted in 2013. This act prohibits employment of manual scavengers, insanitary latrines. It
has laid strong emphasis on rehabilitation of manual scavengers. The act has become
instrumental in eradicating manual scavenging from India.
Last Update: 20/02/2016 4
Delhi
India
India
Produced by: CSE SFD Report
Solapur
2.1.2 Policies, legislations and regulations at state level and ULB level
According to Constitution of India, water and sanitation is a state subject. Statutory powers
are conferred to the state for making laws on water and sanitation. The NCT Delhi does not
have a state sanitation policy, but the state follows the approaches advocated in the NUSP.
In 2002, the Government of NCT Delhi amended the 1998 Delhi Water Board Bill, which
delegated responsibilities related to water supply, sewerage and sewage disposal and
drainage. It also positioned the Delhi Water Board in an advisory role to the Delhi Municipal
Corporation and the Delhi Cantonment Board. In addition, provisions in this amendment
regulate the exploitation of groundwater, relevant user fees and the installation or deepening
of tube wells.
The Delhi Jal Board (DJB) notified the Delhi Water Board Septic Tank Waste Management
Regulations 2015 under Delhi Water Board Act-1998 for the collection, transportation and
disposal of septage. As per the regulations, septage shall be collected and transported only
by an agency/individual having a valid license issued by DJB. Working without a valid
license or/and dumping the septic tank waste at any non-designated location will be
punishable as per law. The regulations have established criteria for procuring license. The
license will be issued only to the individuals or agencies with a leak-proof, odor and spill
proof transporting vehicle equipped with a proper vacuum/suction and discharging
arrangement. The emptying fee will be prescribed by the DJB. The licensee is responsible
for taking all the safety measures including provision of gas detectors, gas masks, protective
gear, oxygen mask with oxygen cylinder and first aid box etc. The licensee will be obliged to
dispose septage only at the designated locations notified by the DJB.
Each Municipal council/corporation is entitled to make its own bylaws for various aspects of
city governance and Building Bylaws. The Delhi Municipal Corporation Act of 1957 and its
amendments represent most of the bylaws relevant to sanitation in the NCT. Under this act,
the Commissioner is responsible for providing public latrines and urinals, and must approve
the building of latrines or urinals, whether they use a service or a flush system for any
premises (DMC, 1957). In addition, this act rules that any new building must have latrine and
bathing accommodations.
Toilets, bathrooms and kitchens are part of a building and are governed by Building Bylaws.
The office of the development authority is responsible for issuing permits for construction of
new buildings and/or repairs/renovation of old buildings (DDA, 1983). A permit is not
required for minor alternations, as laid out in the bylaws. In order to obtain a permit, one
must submit all plans and ownership documents or the like to the authority for approval of all
relevant bodies.
The Delhi Cleanliness and Sanitation Bylaws were created by the Municipal Corporation of
Delhi in 2009. The Bylaw outlines the responsibilities of the Municipal Corporation vis-à-vis
keeping the city clean and outlaw certain unsafe sanitation practices including open
defecation and urination. Under these bylaws, the Municipal Corporation is required to
provide community toilets for slums and equip public places with latrine facilities.
Last Update: 20/02/2016 5
Delhi
India
India
Produced by: CSE SFD Report
Solapur
2.1.3 Institutional roles
The MoUD is the nodal ministry for policy formulation and guidance for the urban water
supply and sewerage sector. The ministry‟s responsibilities include broad policy formulation,
institutional and legal frameworks, setting standards and norms, monitoring, promotion of
new strategies, coordination and support to state programmes through institutional expertise
and finance. The ministry is also responsible for managing international sources of finance.
The CPHEEO, created in 1953, is the technical wing of the MoUD, which advises the
ministry in all technical matters and collaborates with the State Agencies about water supply
and sanitation activities. CPHEEO plays a critical role in externally funded and special
programmes. CPHEEO also plays a central role in setting design standards and norms for
urban water supply and sanitation (Planning Commission, 2002).
The 74th Constitutional Amendment Act of 1992 reformed the sector by transferring
responsibility for domestic, industrial, and commercial water supply and sewerage (WSS)
from state agencies, such as Departments of Public Health Engineering and State Water
Boards, to ULBs. This transfer has resulted in a variety of implementation models, as well as
lack of clarity in allocation of roles and responsibilities between state and local agencies,
which sometimes results in gaps in implementation (USAID, 2010).
The governance of NCT Delhi is shared responsibility of the union, state and the local
governments. The shared responsibility of the governments in this context implies certain
responsibilities and competence of each of the governments. The local governance
structures in Delhi are loaded with the responsibilities of development and maintenance of
the city to a larger extent. Service delivery to the people in the city is ensured and facilitated
by the local governments. There are many overlapping areas where the state and the local
governments are involved. The union government has its own jurisdiction over the
governance of the city.
Delhi is governed through three different local bodies having their own geographical
demarcation and areas of operation. The New Delhi Municipal Council is one of the
structures of local governance. The jurisdiction of the council falls within the major areas of
central Delhi. This area is considered important given its geographical jurisdiction. This is an
area where the President resides, the parliament assembles and the cabinet meets. Its area
of jurisdiction includes the headquarters of all major government offices and ministries of the
Union government. The New Delhi Municipal Council is under the control of the Union
government. The Delhi Cantonment Board is another local body of governance in Delhi. It
was created through an Act called, “The Cantonment Act 1924”. It looks after an area where
armed forces are stationed. The Cantonment Board is under the Ministry of Defence. The
municipal corporation of Delhi was established in 1958, under the provision of an Act of
Parliament, known as “The Delhi Municipal Corporation Act 1957”.
The Municipal Corporation of Delhi, the second largest civic body, was trifurcated in the year
2012 into the South Delhi Municipal Corporation (SDMC - 656.91 sq.km), the North Delhi
Municipal Corporation (NDMC- 636.37 sq.km) and the East Delhi Municipal Corporation
(EDMC – 105.98 sq.km) (MCD, 2015).
Last Update: 20/02/2016 6
Delhi
India
India
Produced by: CSE SFD Report
Solapur
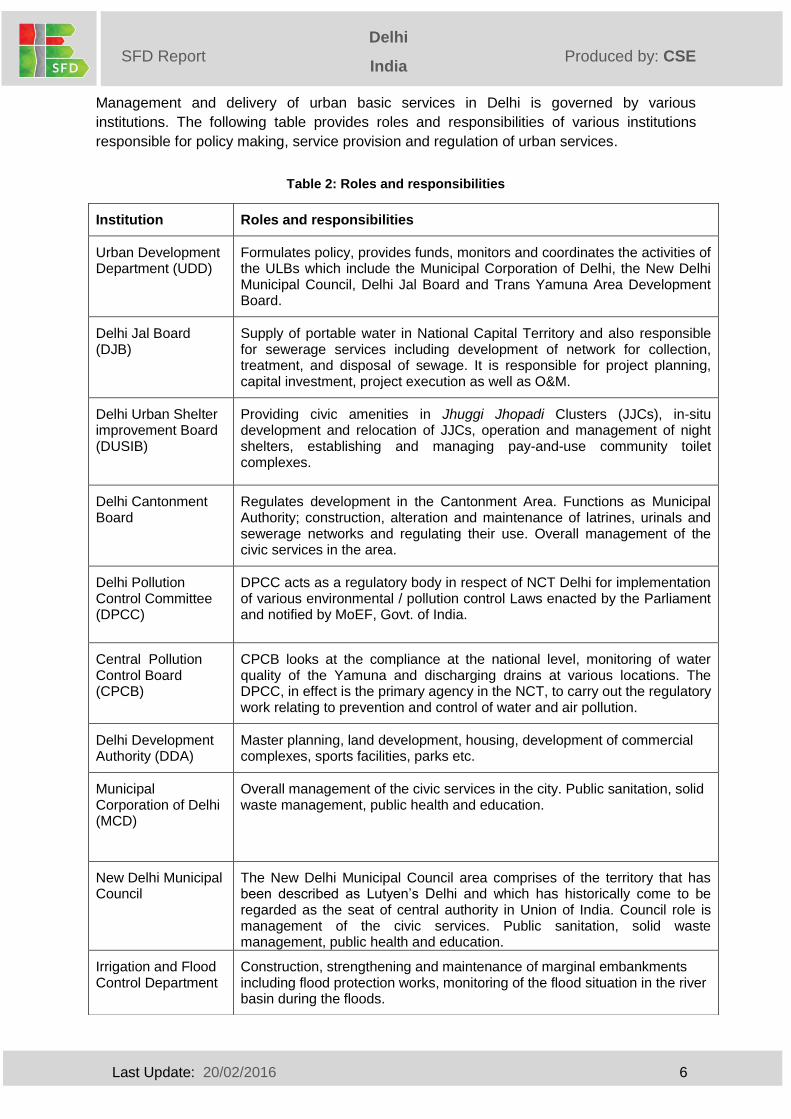
Management and delivery of urban basic services in Delhi is governed by various
institutions. The following table provides roles and responsibilities of various institutions
responsible for policy making, service provision and regulation of urban services.
Table 2: Roles and responsibilities
Institution Roles and responsibilities
Urban Development Department (UDD)
Formulates policy, provides funds, monitors and coordinates the activities of the ULBs which include the Municipal Corporation of Delhi, the New Delhi Municipal Council, Delhi Jal Board and Trans Yamuna Area Development Board.
Delhi Jal Board (DJB)
Supply of portable water in National Capital Territory and also responsible for sewerage services including development of network for collection, treatment, and disposal of sewage. It is responsible for project planning, capital investment, project execution as well as O&M.
Delhi Urban Shelter improvement Board (DUSIB)
Providing civic amenities in Jhuggi Jhopadi Clusters (JJCs), in-situ development and relocation of JJCs, operation and management of night shelters, establishing and managing pay-and-use community toilet complexes.
Delhi Cantonment Board
Regulates development in the Cantonment Area. Functions as Municipal Authority; construction, alteration and maintenance of latrines, urinals and sewerage networks and regulating their use. Overall management of the civic services in the area.
Delhi Pollution Control Committee (DPCC)
DPCC acts as a regulatory body in respect of NCT Delhi for implementation of various environmental / pollution control Laws enacted by the Parliament and notified by MoEF, Govt. of India.
Central Pollution Control Board (CPCB)
CPCB looks at the compliance at the national level, monitoring of water quality of the Yamuna and discharging drains at various locations. The DPCC, in effect is the primary agency in the NCT, to carry out the regulatory work relating to prevention and control of water and air pollution.
Delhi Development Authority (DDA)
Master planning, land development, housing, development of commercial complexes, sports facilities, parks etc.
Municipal Corporation of Delhi (MCD)
Overall management of the civic services in the city. Public sanitation, solid waste management, public health and education.
New Delhi Municipal Council
The New Delhi Municipal Council area comprises of the territory that has been described as Lutyen‟s Delhi and which has historically come to be regarded as the seat of central authority in Union of India. Council role is management of the civic services. Public sanitation, solid waste management, public health and education.
Irrigation and Flood Control Department
Construction, strengthening and maintenance of marginal embankments including flood protection works, monitoring of the flood situation in the river basin during the floods.
Last Update: 20/02/2016 7
Delhi
India
India
Produced by: CSE SFD Report
Solapur
Several institutions are involved in management of sanitation activities with varying roles.
While most of the state level institutions are responsible for policy setting, oversight and
monitoring, DJB and MCD are responsible for actual implementation. The role of various
institutions is overlapping many times.
2.1.4 Service provision
Institutional arrangements for water supply and sanitation in Indian cities vary greatly.
Typically, a state-level agency is in charge of planning and investment, while the local
government (ULBs) is in charge of operation and maintenance (NIUA, 2005). Some of the
larger cities have developed municipal water and sanitation utilities that are legally and
financially separated from the local government. However, these utilities remain weak in
terms of financial capacity. In spite of decentralization, ULBs remain dependent on capital
subsidies from state governments. Tariffs are also set by state governments, which often
even subsidize operating costs (Planning Commission, 2002a).
Furthermore, when no separate utility exists, there is no separation of accounts for different
activities within a municipality. Some states and cities have non-typical institutional
arrangements. For example, in Rajasthan the sector is more centralized and the state
government is also in charge of operation and maintenance, while in Mumbai the sector is
more decentralized and local government is also in charge of planning and investment
(NIUA, 2005).
In Delhi, public health, sanitation, conservancy, and solid waste management services are
delivered by Engineering Department of MCD. Water supply and sewerage is the
responsibility of DJB. It is also responsible for licensing private emptiers, tariff setting,
identification of disposal sites, and construction of infrastructure to receive and treat septage.
Licensed private emptiers are responsible for emptying. The private emptier has to pay INR
1000/- (15 USD) as licensing fees and INR 10000 (147 USD) as performance guarantee
which is valid for three years.
2.2 Planning
2.2.1 Service targets
A sewerage master plan has been prepared by DJB for design horizon of 2031. This plan
includes construction of 9807 km sewer lines, 101 pumping stations, 75 waste water
treatment plants (WWTP) with 374 MGD capacity. According to the SLBs, the benchmark for
coverage of sewerage system is 100%. The Swachh Bharat Mission (SBM) aims to eliminate
open defecation by 2019. The provision of individual toilets to households is the main
component of the mission. SBM plans to build 16,000 toilets including community and public
toilets by 2019 (DUSIB, 2015).Delhi Jal Board aims to increase use of recycled water to 40
per cent from the present 25 per cent. DJB is planning a city-wide network for supply of
recycled water from WWTPs to different areas of the city (TOI, 2015).
Last Update: 20/02/2016 8
Delhi
India
India
Produced by: CSE SFD Report
Solapur
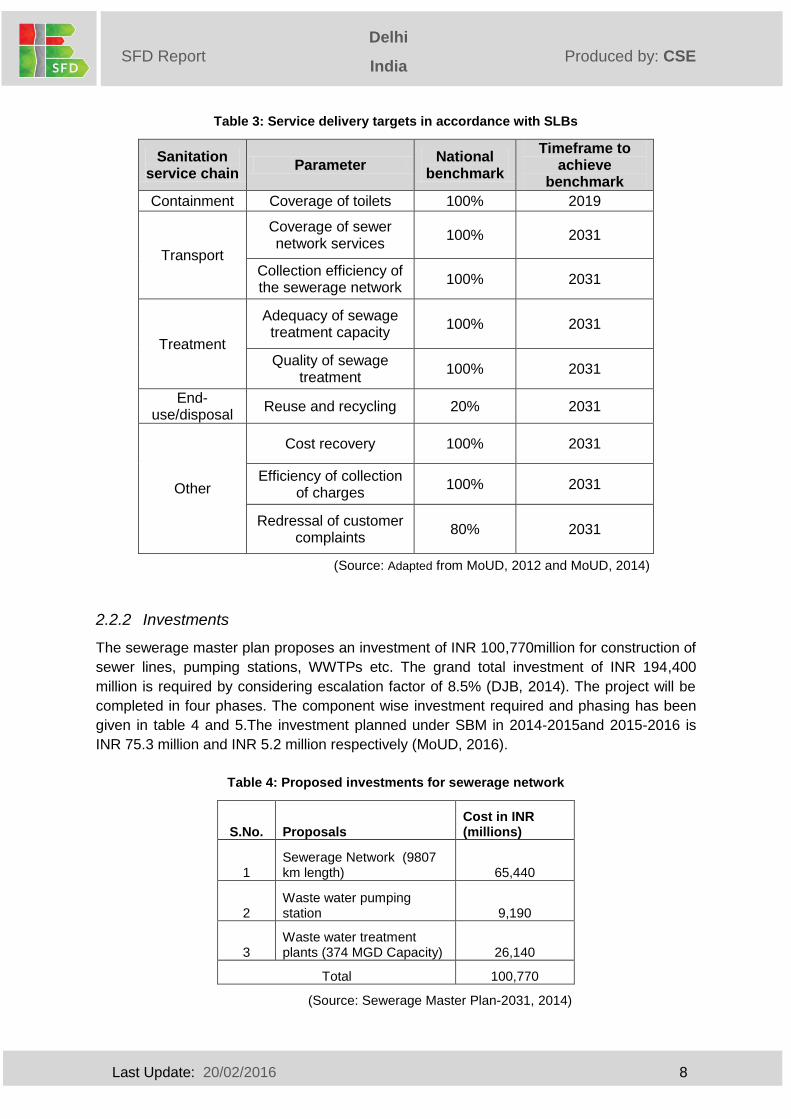
Table 3: Service delivery targets in accordance with SLBs
Sanitation service chain
Parameter National
benchmark
Timeframe to achieve
benchmark
Containment Coverage of toilets 100% 2019
Transport
Coverage of sewer network services
100% 2031
Collection efficiency of the sewerage network
100% 2031
Treatment
Adequacy of sewage treatment capacity
100% 2031
Quality of sewage treatment
100% 2031
End-use/disposal
Reuse and recycling 20% 2031
Other
Cost recovery 100% 2031
Efficiency of collection of charges
100% 2031
Redressal of customer complaints
80% 2031
(Source: Adapted from MoUD, 2012 and MoUD, 2014)
2.2.2 Investments
The sewerage master plan proposes an investment of INR 100,770million for construction of
sewer lines, pumping stations, WWTPs etc. The grand total investment of INR 194,400
million is required by considering escalation factor of 8.5% (DJB, 2014). The project will be
completed in four phases. The component wise investment required and phasing has been
given in table 4 and 5.The investment planned under SBM in 2014-2015and 2015-2016 is
INR 75.3 million and INR 5.2 million respectively (MoUD, 2016).
Table 4: Proposed investments for sewerage network
S.No. Proposals Cost in INR (millions)
1 Sewerage Network (9807 km length) 65,440
2 Waste water pumping station 9,190
3 Waste water treatment plants (374 MGD Capacity) 26,140
Total 100,770
(Source: Sewerage Master Plan-2031, 2014)
Last Update: 20/02/2016 9
Delhi
India
India
Produced by: CSE SFD Report
Solapur
Table 5: Phasing of investments
Year Anticipated Investment required (INR in millions)
Up to 2016 15,115.4
2016-2021 45,346.3
2022-2027 30,230.9
2027-2031 10,077
(Source: Sewerage Master Plan-2031, 2014)
2.3 Reducing inequity
2.3.1 Current choice of services for the urban poor
According to Census of India, 2011, the slum population of Delhi is 1,785,390 (10.6% of total
population) residing in 6,343 slums. Out of these, underground sewerage system has been
available in the 16.30% of the slums whereas 30% of the slums are dependent on onsite
sanitation and the rest are dependent on community toilets or practicing open defecation
(GNCTD, 2015). Less space availability in slums does not allow for indoor toilets thus
residents are dependent on community toilet complexes constructed by DUSIB. These CTCs
have facilities for toilet and bathing both for male and female with nominal charges of INR 5
and INR 10 for toilet and bathing respectively.
DUSIB is responsible for construction of community toilets in slums. The operation and
maintenance has been given to various agencies and NGOs.
2.3.2 Plans and measures to reduce inequity
The Slum Free City Plan of Action (SFCPoA) of Delhi proposed various measures for improvement of slums. The total project cost is estimated INR 152,200 million over the five year implementation period commencing from 2015-16 and ending with 2019-20. Around INR 600 million has been allocated for sewerage and sanitation sector.
According to the Aam Admi Party (AAP) manifesto published before state election in 2015,
AAP will build two lakh toilets across Delhi: about 1.5 lakh toilets in slums and JJ clusters
and 50,000 toilets in public spaces, of which 1 lakh toilets will be for women. These toilets
will be concentrated in public spaces and slum areas. AAP will construct eco-toilets to save
water (AAP, 2015).
There is a provision for in-situ development of slums. Slum dwellers will be provided plots or
flats in the same location as the existing slums. If that is not possible, they will be
rehabilitated in the closest possible location. Until such rehabilitation is completed, the slums
will not be demolished under any circumstances. Facilities for drinking water, sanitation and
cleaning of sewage canals will be provided in all slums.
Last Update: 20/02/2016 10
Delhi
India
India
Produced by: CSE SFD Report
Solapur
2.4 Outputs
2.4.1 Capacity to meet service needs, demands and targets
ULBs have insufficient financial resources. Municipal expenditures in India account for 1.1%
of the country‟s GDP, compared to 6.9% in South Africa and 9.7% in Switzerland. ULBs
therefore rely mainly on national or state grants (AFD, 2014).In the financial year 2013-2014,
the total revenue and expenditure of DJB was INR 19,263 million and INR 31,509.7 million
respectively. This has a huge gap of INR 1,224,670 million. Around 98% of revenue comes
from state government as grant (GNCTD, 2014a). DJB passed its annual budget for the
fiscal year 2015-16 amounting to INR 35,948.3 million which consisted of plan budget of INR
14,300 million and non-plan budget of INR 21,648.3 million. The majority of funds for capital
works of infrastructure come from different central and state government‟s schemes and
external lending from bilateral agencies.
2.4.2 Monitoring and reporting access to services
The SLBs have to be revised yearly. Data on service levels should be collected, documented
and reported to MoUD according to the format prescribed by SLB framework. Service level
improvement plans (SLIPs) are prepared with yearly targets. It has to be reviewed each year
and progress has to be monitored. The planning documents like City Development Plan
(CDP) and CSP have to be reviewed once in 5 years. This gives an opportunity to monitor
the progress on service level improvement.
According to Septic Tank Waste Management Regulations 2015 of DJB, the private emptiers
have to install GPS system; this enables DJB officials to track the emptiers. Emptiers have to
dispose septage only in designated sites, licensing may monitor and regulate emptiers. At
present, DJB has invited applications from private emptiers for granting licenses. There is no
database of private emptiers with DJB. Sanitary inspectors have to inspect the design of
septic tanks and their adherence to standards at the time of construction. The construction of
septic tank adhering to the standards is not enforced.
2.5 Expansion
2.5.1 Stimulating demand for services
The following activities can stimulate demand for services.
Awareness generation on septic tank construction, regular desludging of septic tanks through awareness campaigns
Capacity building for ULB staff on septage management
Skill development of local masons
Monitoring and regulation of private emptiers
DJB is in the process of regularizing the emptying services. But, there are no plans for taking
up responsibility of emptying.
Last Update: 20/02/2016 11
Delhi
India
India
Produced by: CSE SFD Report
Solapur
2.5.2 Strengthening service provider roles
Private emptiers are the only service provider for the emptying services. DUSIB is
responsible for construction, operation and maintenance of community toilets. Community
toilets in the slums can also be built and maintained based on the Sulabh International
Social Service Organisation (SISSO) model. Partnership with SISSO in providing emptying
service in slums can improve efficiency of services. DJB can take up emptying services.
Funding is available for septage management initiatives under AMRUT programme. These
funds can be used to buy vacuum tankers, building treatment facility etc., As DJB is a
parastatal, it is not eligible for funding from this programme. But, the municipal corporations
(NDMC, SDMC and EDMC can make use of these funds to take up emptying services.
2.5.3 Service standards
1. Service Level Benchmarks (SLB), 2008: Issued by the Ministry of Urban Development in
2008, which seeks to:-
i. Identify a minimum set of standard performance parameters for the water and sanitation sector that are commonly understood and used by all stakeholders across the country.
ii. Define a common minimum framework for monitoring and reporting on these indicators.
iii. Set out guidelines on how to operationalize this framework in a phased manner.SLB refers to improving service through better provision and delivery. It evaluates the performance of ULBs in providing urban services.
2. General Standards for Discharge of Environmental Pollutants Part-A: Effluents-The
Environment (Protection) Rules, 1986 (Schedule VI): Issued by Central Pollution Control
Board (CPCB), a statutory organisation constituted in September, 1974 under the Water
(Prevention and Control of Pollution) Act, 1974.
3. Code of Practice for Installation of Septic Tanks, 1985: Issued by Bureau of Indian
standards, national standards setting body of India. The code specifies standards and
design consideration for installation of septic tanks.
4. Manual on Sewerage and Sewage Treatment, Second Edition, 2013: This manual has
been developed by Central Public Health and Environmental Engineering Organization
(CPHEEO).It provides detailed design and guidelines for various technologies of
wastewater management.

Last Update: 20/02/2016 12
Delhi
India
India
Produced by: CSE SFD Report
Solapur
3 Service outcomes
3.1 Overview
Two key sources of data are used; Census of India, 2011 and Inventorization of Sewage
Treatment Plant (STP) by Central Pollution Control Board (CPCB), 2015. Most of the data is
then updated by survey, published/unpublished documents, Key Informant Interviews (KIIs)
and Focus Group Discussions (FGD). Data on containment is available in the Census. Data
on type of containment actually prevalent in the wards according to SFD promotion initiative
is updated through survey. Data on emptying and transport of septage is collected through
KIIs with private emptiers. Data on transport and treatment of sewage is collected through
published/unpublished reports and news article. This section presents the range of
infrastructure/ technologies, methods and services designed to support the management of
FS and WW through sanitation service chain in Delhi.
To start with, a relationship between sanitation technologies defined in Census of India and
the variables defined in the project is established. Then the population dependent on those
systems is represented in terms of percentage of population, as shown in Table 6.
Table 6: Sanitation technologies and contribution of excreta in terms of percentage of population
S.No.
Sanitation technologies and systems as defined by: SFD reference
variable
Percentage of
population Census of India SFD promotion initiative
1 Piped sewer system User interface discharges directly to centralized
separate sewer T1A1C2
57.6%
2 Septic tank Septic tank connected to open drain or storm
sewer T1A2C6
26.7%
3 Other systems User interface discharges directly to open ground
T1A1C8 1.0%
4 Pit latrine with slab Lined pit with semi-permeable walls and open
bottom, no outlet or overflow, general situation T1A5C10
1.7%
5 Pit latrine without slab
Unlined pit no outlet or overflow, general situation
T1A6C10 0.2%
6 Night soil disposed into open drain
User interface discharges directly to open drain or storm drain
T1A1C6 2.3%
7 Service latrine User interface discharges directly to „don‟t know
where‟ T1A1C9
0.02%
8
Public latrine User interface discharges directly to centralized separate sewer
Septic tank connected to open drain or storm sewer
T1A1C2
T1A2C6
7%
9 Open defecation Open defecation T1B11C7
TO C9 3.5%
Last Update: 20/02/2016 13
Delhi
India
India
Produced by: CSE SFD Report
Solapur
3.1.1 Sanitation facilities
This section presents on existing sanitation facilities: community/public toilets, institution,
industries and commercial establishments.
Community toilets/ public toilets: NDMC, SDMC, EDMC, DUSIB, New Delhi Municipal
Council and Delhi Cantonment Board are responsible for the construction of public/
community toilets. 3000 public pay-and-use toilets and free public toilets are currently being
operated and maintained by an NGO, SISSO popularly known as Sulabh complex and
SulabhSouchalya(SISSO, 2015).In pay-and-use toilets,INR 5 is charged for a use per
individual. 1,500 public/community toilets are operated and maintained by the Municipal
Corporations/Council. At present,DUSIB has 536 community toilets.There are three types of
community toilets provided by DUSIB:
1. Mobile toilet vans
2. Prefabricated toilets
3. Conventional toilets
The toilets constructed by DUSIB are outsourced to NGOs for operation and maintenance
(DUSIB, 2015). User charge is INR 1 for one use per adult. Out of 536 community toilets,
354are connected to sewer network, 106 connected to septic tank, 18 are connected to
nullah, and no data is available on discharge of 58 community toilets. On a pilot scale, few
toilets of night shelters are installed with DRDO developed bio-digester toilets.
Approximately 95-97% of community/public toilets are connected to sewerage network
(SISSO, 2015. DUSIB, 2015).
Institutions and commercial establishments
Delhi is hub for various institutions like public and private offices, educational institutions,
hotels, restaurants and market. The city is poised to be one of the largest conglomerations of
professional services in the world, due to the globalization of services and the explosive
growth potential it entails. A survey has been conducted to observe the sanitation facilities
available in markets, malls, schools and New Delhi railway station (Please refer appendix 7).
Due to the lack of data on excreta generated from institutions, industrial areas, restaurants
and hotels. These establishments have not been taken into consideration for production of
SFD. Whereas excreta generated from community/public toilets and residential area is
considered for the SFD production.
3.1.2 Containment
Overall, 68% of the city population is dependent on offsite sanitation system. Nearly 28% is
dependent on onsite sanitation systems. Rest 4% of the population practices open
defecation.
Sewerage network
According to the field based study, 65% of the population is dependent on sewerage
systems. According to CPCB reports 34 STPs based on various technologies is explained in
table 7: -
Last Update: 20/02/2016 14
Delhi
India
India
Produced by: CSE SFD Report
Solapur
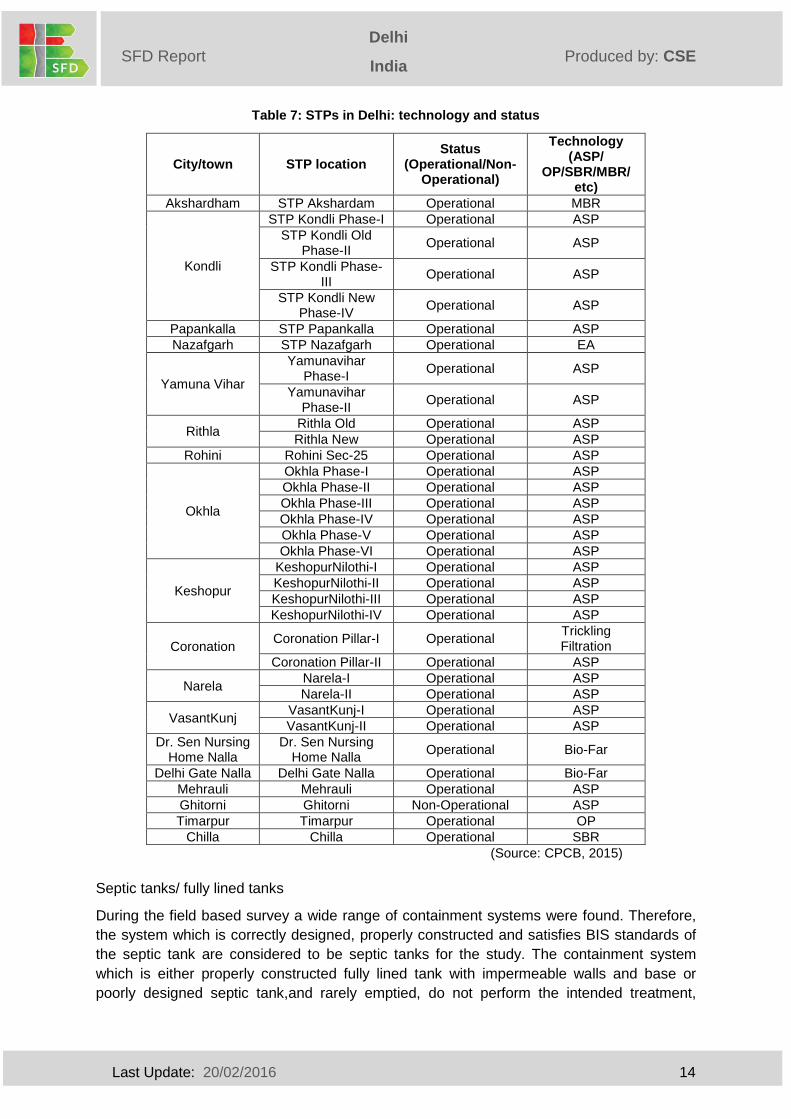
Table 7: STPs in Delhi: technology and status
City/town STP location Status
(Operational/Non-Operational)
Technology (ASP/
OP/SBR/MBR/ etc)
Akshardham STP Akshardam Operational MBR
Kondli
STP Kondli Phase-I Operational ASP
STP Kondli Old Phase-II
Operational ASP
STP Kondli Phase-III
Operational ASP
STP Kondli New Phase-IV
Operational ASP
Papankalla STP Papankalla Operational ASP
Nazafgarh STP Nazafgarh Operational EA
Yamuna Vihar
Yamunavihar Phase-I
Operational ASP
Yamunavihar Phase-II
Operational ASP
Rithla Rithla Old Operational ASP
Rithla New Operational ASP
Rohini Rohini Sec-25 Operational ASP
Okhla
Okhla Phase-I Operational ASP
Okhla Phase-II Operational ASP
Okhla Phase-III Operational ASP
Okhla Phase-IV Operational ASP
Okhla Phase-V Operational ASP
Okhla Phase-VI Operational ASP
Keshopur
KeshopurNilothi-I Operational ASP
KeshopurNilothi-II Operational ASP
KeshopurNilothi-III Operational ASP
KeshopurNilothi-IV Operational ASP
Coronation Coronation Pillar-I Operational
Trickling Filtration
Coronation Pillar-II Operational ASP
Narela Narela-I Operational ASP
Narela-II Operational ASP
VasantKunj VasantKunj-I Operational ASP
VasantKunj-II Operational ASP
Dr. Sen Nursing Home Nalla
Dr. Sen Nursing Home Nalla
Operational Bio-Far
Delhi Gate Nalla Delhi Gate Nalla Operational Bio-Far
Mehrauli Mehrauli Operational ASP
Ghitorni Ghitorni Non-Operational ASP
Timarpur Timarpur Operational OP
Chilla Chilla Operational SBR
(Source: CPCB, 2015)
Septic tanks/ fully lined tanks
During the field based survey a wide range of containment systems were found. Therefore,
the system which is correctly designed, properly constructed and satisfies BIS standards of
the septic tank are considered to be septic tanks for the study. The containment system
which is either properly constructed fully lined tank with impermeable walls and base or
poorly designed septic tank,and rarely emptied, do not perform the intended treatment,
Last Update: 20/02/2016 15
Delhi
India
India
Produced by: CSE SFD Report
Solapur
acting as a sealed vault and serve as holding tanks are considered fully lined tanks for the
study.
Generally low to middle income group households have single chamber septic/fully lined
tanks. Double chamber septic tanks are prevalent in middle to high income groups and
apartments. It is reported that 76.3% of urban settlements are unplanned (CPR, 2015). Due
to space constraints, households are compelled to have minimal sanitation facilities within
their premises. Due to non availability of sewerage network, fully lined tanks in few
unplanned settlements in Delhi are deliberately designed with an outlet connected to open
drains. Containment system is maintained by individual owners and drains are maintained by
MCD. Awareness about operation and maintenance of septic tanks is sub-optimal.
The sizes and designs of septic tank/fully lined tanks vary from one place to another. Type
and size of containment are largely influenced by (BMGF, 2011):-
i) Space availability
ii) Cost
iii) Local construction standards
iv) Skills of mason
According to the survey, size of a septic tank/ fully lined tanks in individual houses ranges
from 3 to 8 m3, the size of a septic tank in office or apartment buildings are much larger and
vary widely in size depending on the number of users.
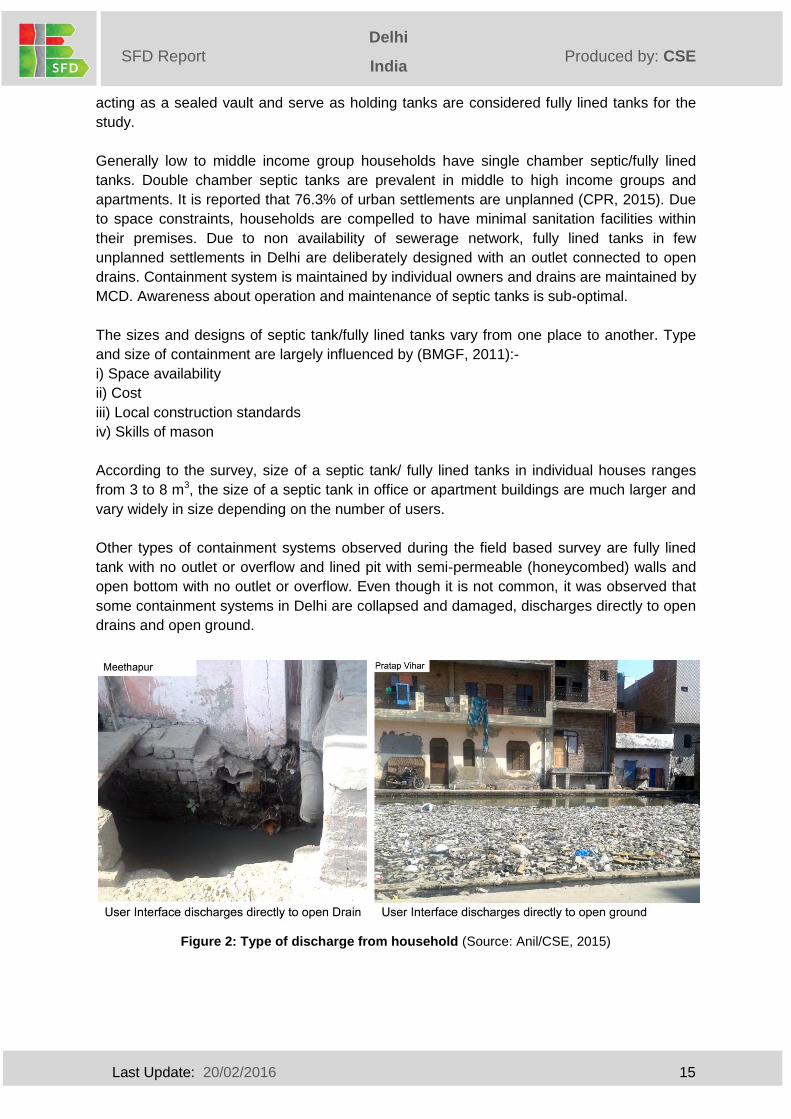
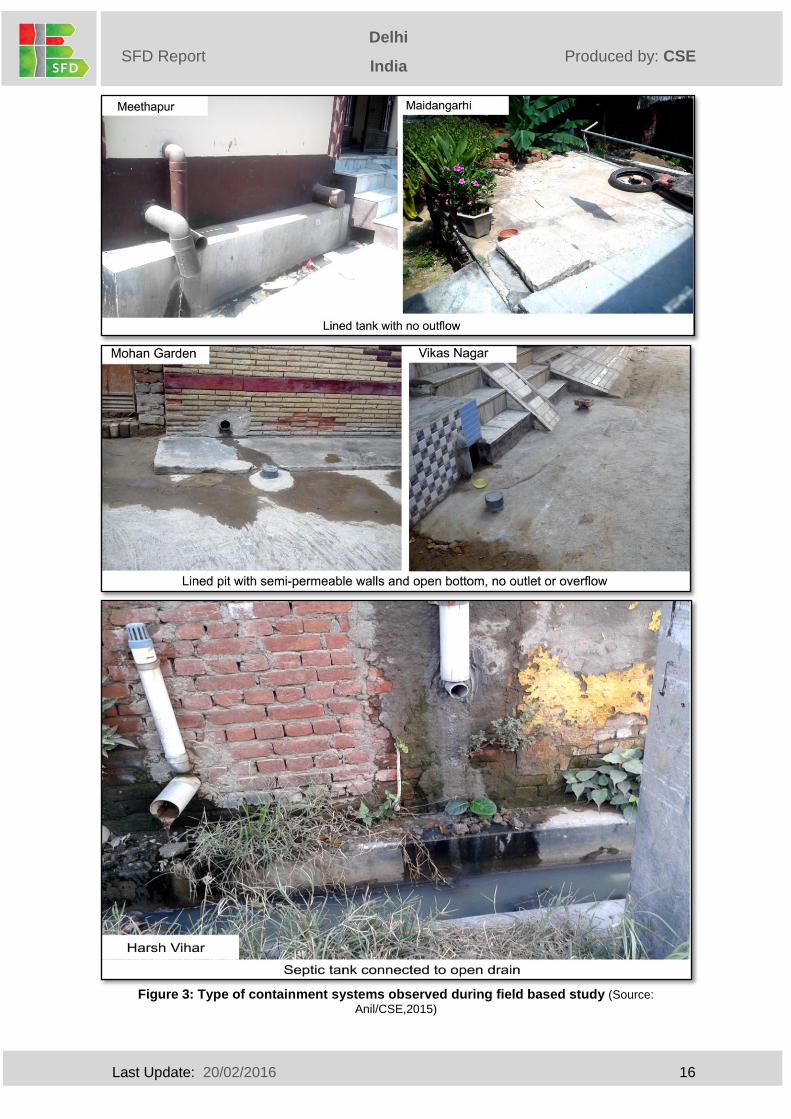
Other types of containment systems observed during the field based survey are fully lined
tank with no outlet or overflow and lined pit with semi-permeable (honeycombed) walls and
open bottom with no outlet or overflow. Even though it is not common, it was observed that
some containment systems in Delhi are collapsed and damaged, discharges directly to open
drains and open ground.
Figure 2: Type of discharge from household (Source: Anil/CSE, 2015)
Last Update: 20/02/2016 16
Delhi
India
India
Produced by: CSE SFD Report
Solapur
Figure 3: Type of containment systems observed during field based study (Source:
Anil/CSE,2015)
Last Update: 20/02/2016 17
Delhi
India
India
Produced by: CSE SFD Report
Solapur
3.1.3 Emptying services
In Delhi, septage emptying services are not managed and regulated by the state
government. Recently, DJB has initiated a step towards regularization of private emptying
service and has put up a public notification on procedure of acquiring license for private
emptiers (discussed in detail in chapter 2). Households are dependent on private service
providers for OSS emptying service. Emptying frequencies vary across city depending upon
the type and size of containment and road access to the household. Emptying is done only
when the tank is overloaded or chocked.
It is reported that few households have never emptied their containments till now. The
reasons are (BMGF, 2011):-
i) Many households owning septic tanks/fully lined tanks have migrated only about eight to
ten years ago in search of employment opportunities and shifted from open defecation
practices to relatively safer option of using septic tanks/fully lined tanks.
ii) People with higher affordability construct oversized septic tanks to avoid frequent
emptying (an option pushed by local masons).
iii) Lack of awareness about the need for periodical emptying.
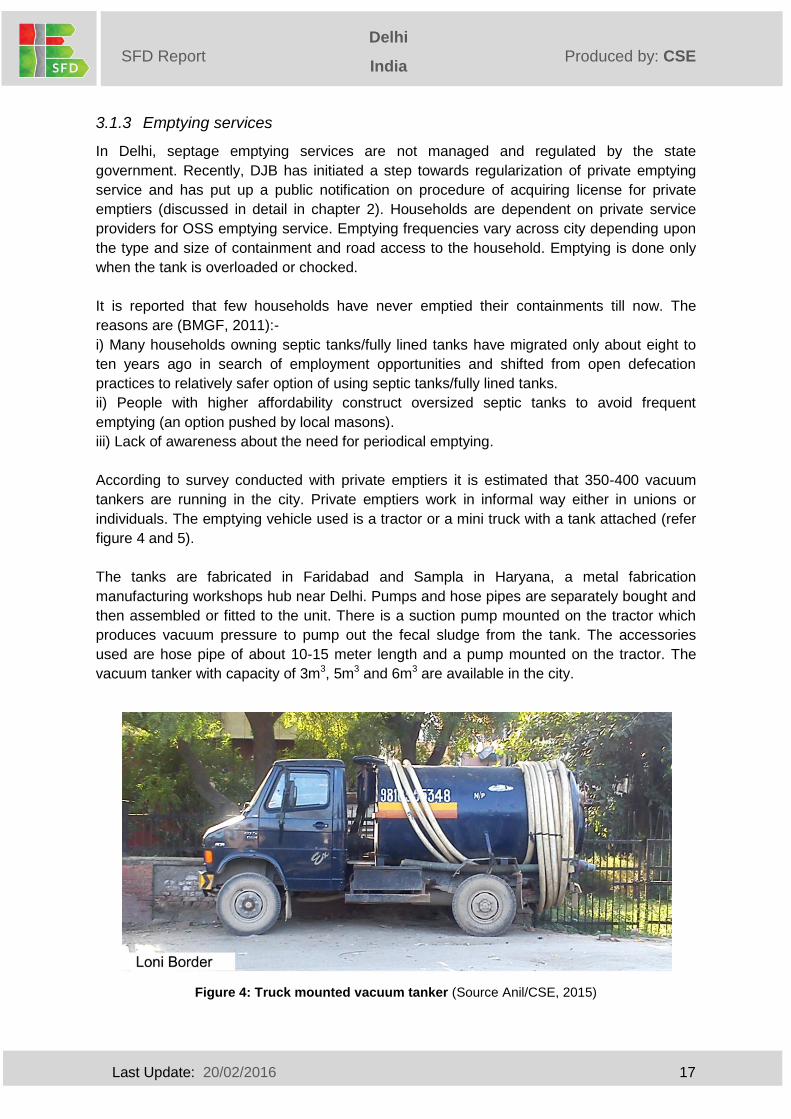
According to survey conducted with private emptiers it is estimated that 350-400 vacuum
tankers are running in the city. Private emptiers work in informal way either in unions or
individuals. The emptying vehicle used is a tractor or a mini truck with a tank attached (refer
figure 4 and 5).
The tanks are fabricated in Faridabad and Sampla in Haryana, a metal fabrication
manufacturing workshops hub near Delhi. Pumps and hose pipes are separately bought and
then assembled or fitted to the unit. There is a suction pump mounted on the tractor which
produces vacuum pressure to pump out the fecal sludge from the tank. The accessories
used are hose pipe of about 10-15 meter length and a pump mounted on the tractor. The
vacuum tanker with capacity of 3m3, 5m3 and 6m3 are available in the city.
Figure 4: Truck mounted vacuum tanker (Source Anil/CSE, 2015)
Last Update: 20/02/2016 18
Delhi
India
India
Produced by: CSE SFD Report
Solapur
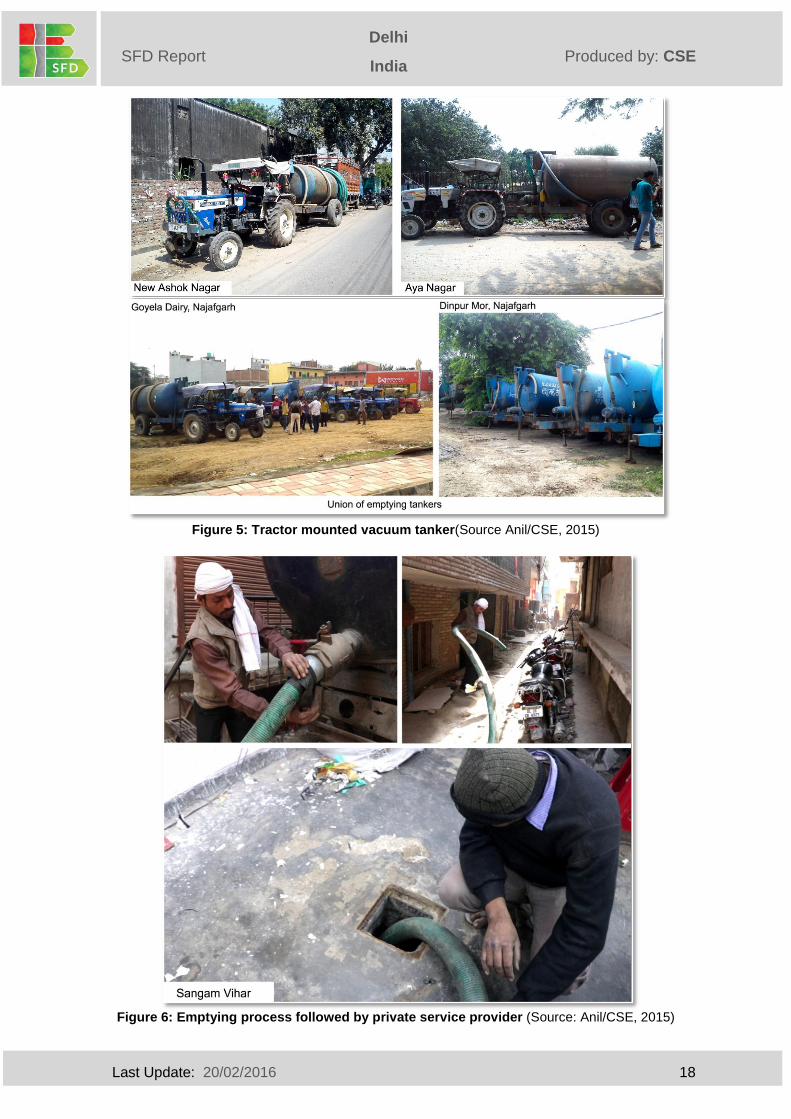
Figure 5: Tractor mounted vacuum tanker(Source Anil/CSE, 2015)
Figure 6: Emptying process followed by private service provider (Source: Anil/CSE, 2015)
Last Update: 20/02/2016 19
Delhi
India
India
Produced by: CSE SFD Report
Solapur
Tractor mounted
85%
Truck mounted
15%
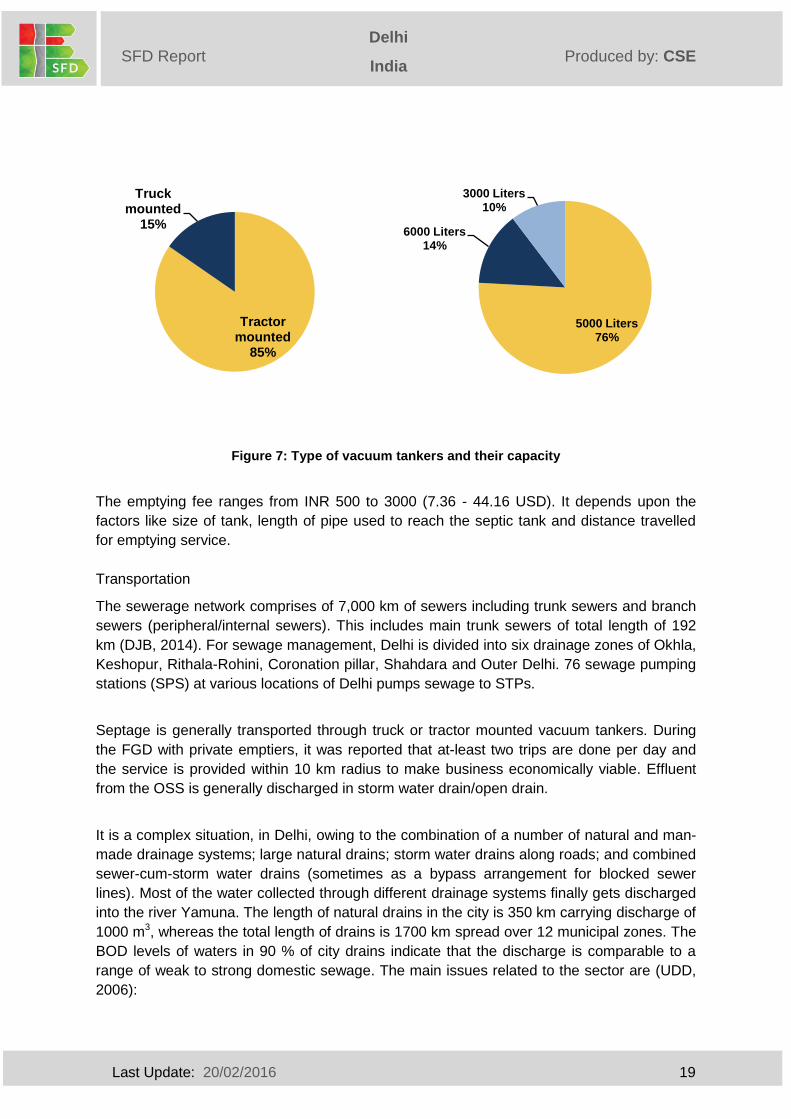
Figure 7: Type of vacuum tankers and their capacity
The emptying fee ranges from INR 500 to 3000 (7.36 - 44.16 USD). It depends upon the
factors like size of tank, length of pipe used to reach the septic tank and distance travelled
for emptying service.
Transportation
The sewerage network comprises of 7,000 km of sewers including trunk sewers and branch
sewers (peripheral/internal sewers). This includes main trunk sewers of total length of 192
km (DJB, 2014). For sewage management, Delhi is divided into six drainage zones of Okhla,
Keshopur, Rithala-Rohini, Coronation pillar, Shahdara and Outer Delhi. 76 sewage pumping
stations (SPS) at various locations of Delhi pumps sewage to STPs.
Septage is generally transported through truck or tractor mounted vacuum tankers. During
the FGD with private emptiers, it was reported that at-least two trips are done per day and
the service is provided within 10 km radius to make business economically viable. Effluent
from the OSS is generally discharged in storm water drain/open drain.
It is a complex situation, in Delhi, owing to the combination of a number of natural and man-
made drainage systems; large natural drains; storm water drains along roads; and combined
sewer-cum-storm water drains (sometimes as a bypass arrangement for blocked sewer
lines). Most of the water collected through different drainage systems finally gets discharged
into the river Yamuna. The length of natural drains in the city is 350 km carrying discharge of
1000 m3, whereas the total length of drains is 1700 km spread over 12 municipal zones. The
BOD levels of waters in 90 % of city drains indicate that the discharge is comparable to a
range of weak to strong domestic sewage. The main issues related to the sector are (UDD,
2006):
5000 Liters76%
6000 Liters14%
3000 Liters10%
Last Update: 20/02/2016 20
Delhi
India
India
Produced by: CSE SFD Report
Solapur
Storm water drains carry considerable quantities of raw and untreated effluents
Lack of maintenance, leading to chocked drains.
Lack of coordination in planning and construction of roads and drains
3.1.4 Treatment
It is reported that Delhi‟s sewage generation is 3800 MLD (CPCB, 2015). According to the
CPCB the overall treatment capacity of the STPs is 3049 MLD and operational capacity is
2671 MLD (CPCB, 2015). According to DJB‟s press release; 30 STPs are operational and
are treating 2025 MLD of wastewater (WW) which also includes WW from intercepted open
drains (DJB, 2015).
There is no separate septage treatment plant. During FGDs with private emptiers in Dwarka,
it is reported that emptiers discharge septage to the Pappankalla (Dwarka) STP.
3.1.5 End use/ disposal
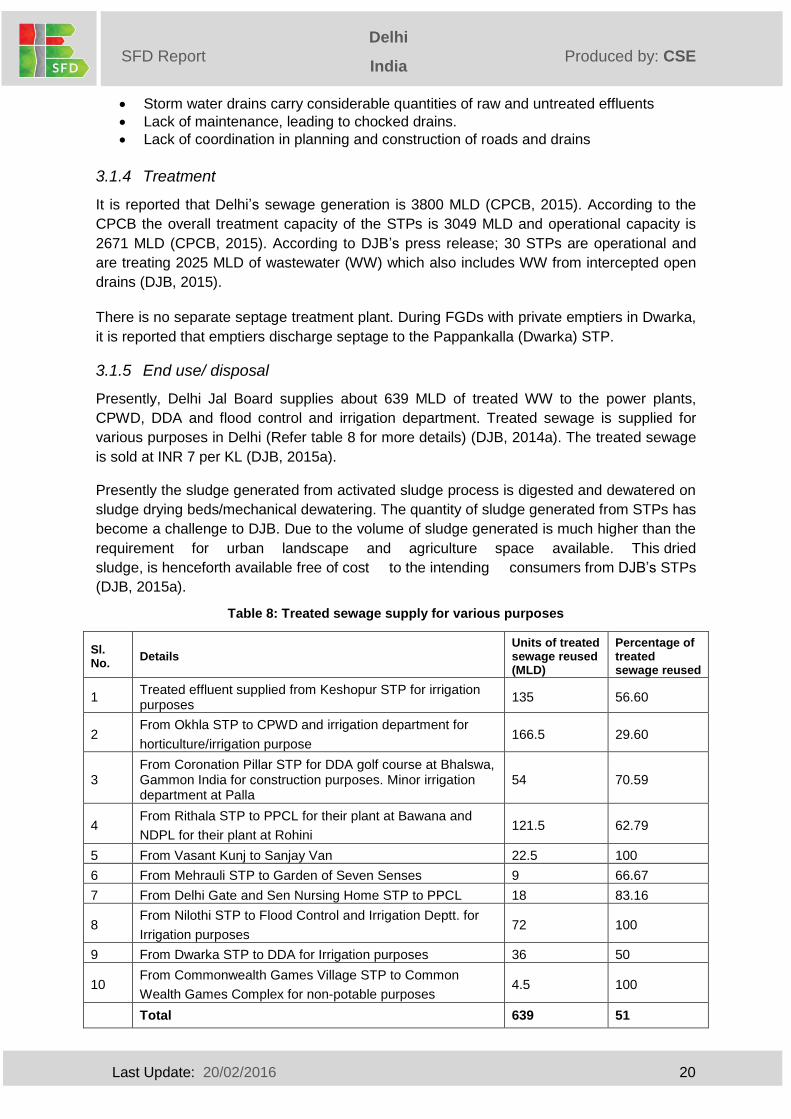
Presently, Delhi Jal Board supplies about 639 MLD of treated WW to the power plants,
CPWD, DDA and flood control and irrigation department. Treated sewage is supplied for
various purposes in Delhi (Refer table 8 for more details) (DJB, 2014a). The treated sewage
is sold at INR 7 per KL (DJB, 2015a).
Presently the sludge generated from activated sludge process is digested and dewatered on
sludge drying beds/mechanical dewatering. The quantity of sludge generated from STPs has
become a challenge to DJB. Due to the volume of sludge generated is much higher than the
requirement for urban landscape and agriculture space available. This dried
sludge, is henceforth available free of cost to the intending consumers from DJB‟s STPs
(DJB, 2015a).
Table 8: Treated sewage supply for various purposes
Sl. No.
Details Units of treated sewage reused (MLD)
Percentage of treated sewage reused
1 Treated effluent supplied from Keshopur STP for irrigation purposes
135 56.60
2 From Okhla STP to CPWD and irrigation department for
horticulture/irrigation purpose 166.5 29.60
3 From Coronation Pillar STP for DDA golf course at Bhalswa, Gammon India for construction purposes. Minor irrigation department at Palla
54 70.59
4 From Rithala STP to PPCL for their plant at Bawana and
NDPL for their plant at Rohini 121.5 62.79
5 From Vasant Kunj to Sanjay Van 22.5 100
6 From Mehrauli STP to Garden of Seven Senses 9 66.67
7 From Delhi Gate and Sen Nursing Home STP to PPCL 18 83.16
8 From Nilothi STP to Flood Control and Irrigation Deptt. for
Irrigation purposes 72 100
9 From Dwarka STP to DDA for Irrigation purposes 36 50
10 From Commonwealth Games Village STP to Common
Wealth Games Complex for non-potable purposes 4.5 100
Total 639 51
Last Update: 20/02/2016 21
Delhi
India
India
Produced by: CSE SFD Report
Solapur
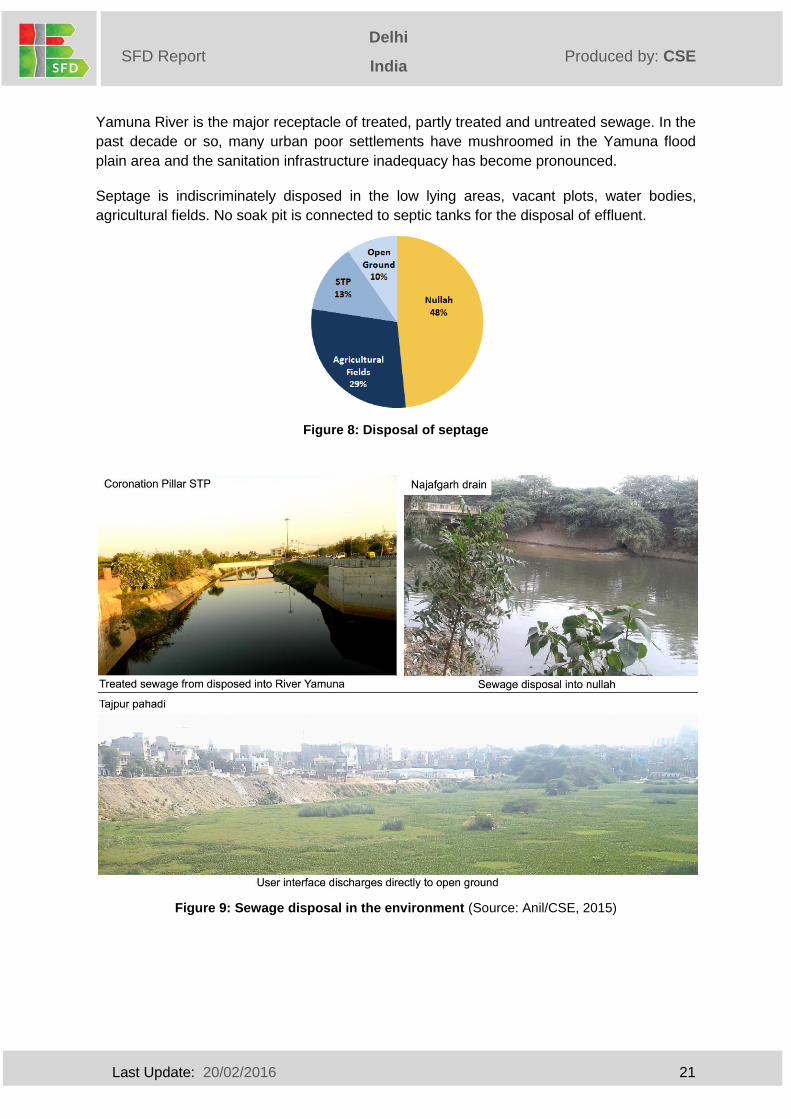
Yamuna River is the major receptacle of treated, partly treated and untreated sewage. In the
past decade or so, many urban poor settlements have mushroomed in the Yamuna flood
plain area and the sanitation infrastructure inadequacy has become pronounced.
Septage is indiscriminately disposed in the low lying areas, vacant plots, water bodies,
agricultural fields. No soak pit is connected to septic tanks for the disposal of effluent.
Figure 8: Disposal of septage
Figure 9: Sewage disposal in the environment (Source: Anil/CSE, 2015)
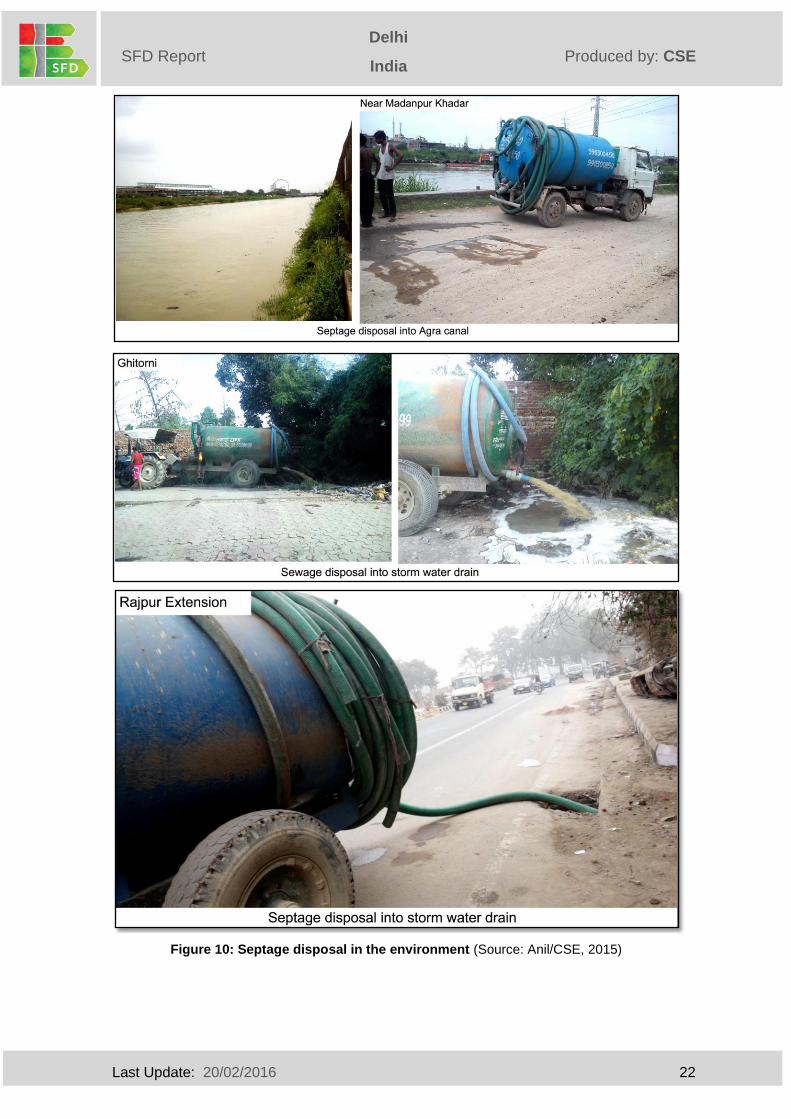
Last Update: 20/02/2016 22
Delhi
India
India
Produced by: CSE SFD Report
Solapur
Figure 10: Septage disposal in the environment (Source: Anil/CSE, 2015)
Last Update: 20/02/2016 23
Delhi
India
India
Produced by: CSE SFD Report
Solapur
3.1.6 Risk of contamination of groundwater
Currently, Delhi sources the majority of its drinking water from the Yamuna River, but
considering the city‟s population growth and projections of future water scarcity, groundwater
too represents an important resource. It is also, however, under threat. The areas under the
tail end of supply chain are generally overexploited. Most of the districts in the NCT are
overexploiting their groundwater resources (Shekhar et al.). The region‟s shallow aquifers
(from 5 to 10 m), are usually quite saline, hence use is limited to the deeper aquifers, which
vary between 20-50 m (CPCB, 2007). The water table has been steadily declining for years
and a 4 m decline has been observed over the last few decades (CPCB, 2007). Much of the
city is paved, which prevents natural groundwater recharge, and leads to storm water runoff
to the Yamuna.
Many industrial activities are taking place in the peri-urban areas, which releases pollutants
including insecticides and plastics into the environment (CPCB, 2007). In addition, fluoride
levels are quite high in the south and southwest districts of the city, which are typically home
to deeper aquifers, and the release of domestic effluents into open unlined drains has led to
unsafe levels of nitrates in some parts of Delhi (Shekhar et al). A CPCB study showed that
the levels of faecal coliforms and iron in Delhi‟s groundwater were also above the BIS
standards for drinking water (CPCB, 2008).
The Quaternary deposits constitute the major repository of ground water. Total ground water
resources in the NCT Delhi are estimated around as 28156.32 ha m (Central Ground Water
Board). The annual extraction of ground water is estimated around 47945.18 ha m.
About 81.9% households of Delhi have now access to piped water supply. Water Production
during the summer season is being maintained at 830 - 835 million gallons per day
consistently. Water is supplied through a water supply network comprising of 11,350 kms
long pipelines and now 105 underground reservoirs will be functioning for rationalized
distribution of supply in Delhi (DJB, 2015a). Refer Table 19 in appendix for more details.
Last Update: 20/02/2016 24
Delhi
India
India
Produced by: CSE SFD Report
Solapur
3.2 SFD matrix
The final SFD for the Delhi is presented in appendix 7.3.
3.2.1 SFD matrix explanation
According to Census of India 2011, FGDs and KIIs it was estimated that around 68% of the
city is dependent on offsite systems. Population connected to sewerage network is 65% and
user interface directly discharging in open drain or open ground is only 3%. Based on field
research it was estimated that 95% of public latrines are connected to sewerage network,
hence added accordingly in the offsite systems. Most of the sewage and septage with or
without treatment ends up into Yamuna River via three main drains, (i) Najafgarh drain, (ii)
Shahdara drain and (iii) Supplementary drain.
According to Census 2011, around 28% of the city is dependent on onsite sanitation
systems (OSS), out of which around 26.7% is dependent on septic tanks and 2% on pits. But
according to the survey and KIIs it is estimated that around 18% of the city is dependent on
lined tanks connected to open drain/open ground and 10% on pits and lined tanks without
overflow. Around 5% of public latrines are connected to lined tanks and hence are
incorporated in onsite systems. These tanks connected to open drain are not contained but
pits are contained as the groundwater table is more than 10mbgl.
There is no clear differentiation between the volume of effluent and septage generated from
tanks, hence to reduce the maximum error it is assumed to be 50% each. Therefore, 9% of
FS i.e. effluent from tanks goes into open drains and the rest is emptied from tanks
whenever full. Some FS is always left in the tanks and is assumed to be 2% in the case of
tanks connected to open drains. Whereas FS from pits and tanks without overflow is
considered contained and is calculated as 3%, it includes infiltration of water as well.
According to Census 2011, FGDs and KIIs it is estimated that around 3.5% of the population
still practices open defecation. Definition and estimation of different variables (used to make
SFD) are explained below.
Containment system:
Census divides sanitation systems into eight types of containment systems but field based
research revealed that there are around 13 types of systems prevalent in Delhi. The septic
tanks prevalent in the city are not adhering to the design prescribed by Bureau of Indian
Standards (BIS). All the 13 types of systems are listed below.
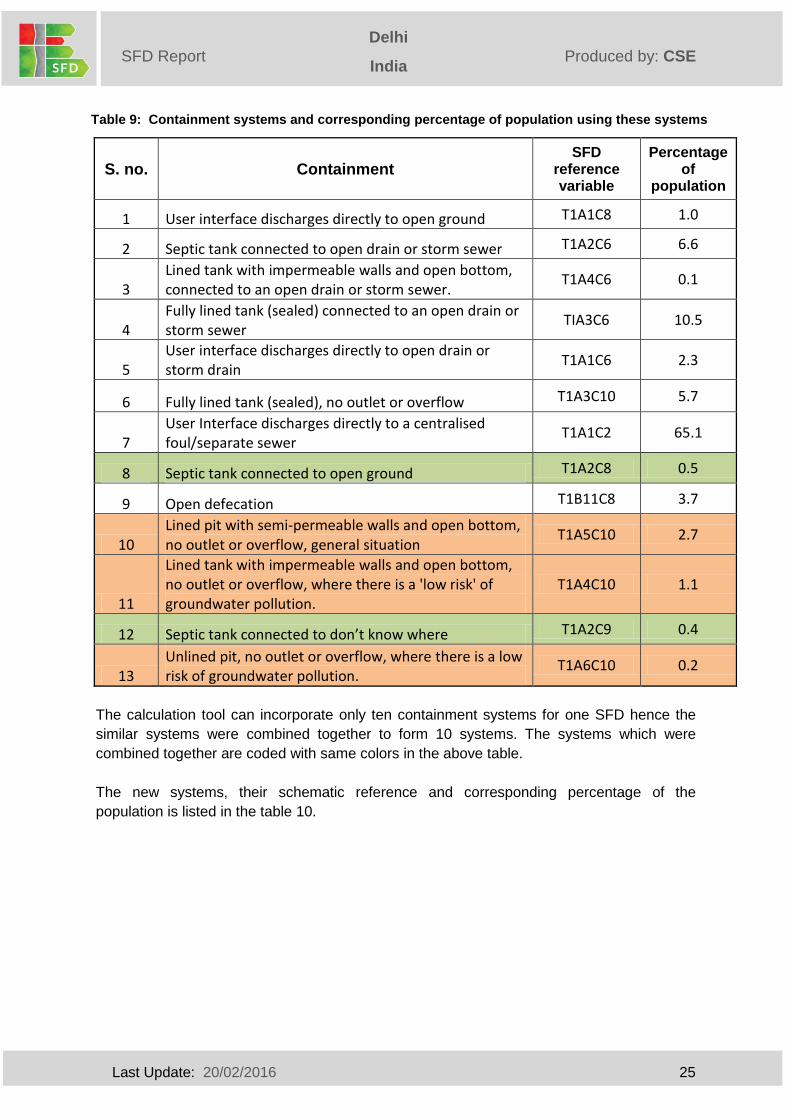
Last Update: 20/02/2016 25
Delhi
India
India
Produced by: CSE SFD Report
Solapur
Table 9: Containment systems and corresponding percentage of population using these systems
S. no. Containment SFD
reference variable
Percentage of
population
1 User interface discharges directly to open ground T1A1C8 1.0
2 Septic tank connected to open drain or storm sewer T1A2C6 6.6
3 Lined tank with impermeable walls and open bottom, connected to an open drain or storm sewer.
T1A4C6 0.1
4 Fully lined tank (sealed) connected to an open drain or storm sewer
TIA3C6 10.5
5 User interface discharges directly to open drain or storm drain
T1A1C6 2.3
6 Fully lined tank (sealed), no outlet or overflow T1A3C10 5.7
7 User Interface discharges directly to a centralised foul/separate sewer
T1A1C2 65.1
8 Septic tank connected to open ground T1A2C8 0.5
9 Open defecation T1B11C8 3.7
10 Lined pit with semi-permeable walls and open bottom, no outlet or overflow, general situation
T1A5C10 2.7
11
Lined tank with impermeable walls and open bottom, no outlet or overflow, where there is a 'low risk' of groundwater pollution.
T1A4C10 1.1
12 Septic tank connected to don’t know where T1A2C9 0.4
13 Unlined pit, no outlet or overflow, where there is a low risk of groundwater pollution.
T1A6C10 0.2
The calculation tool can incorporate only ten containment systems for one SFD hence the
similar systems were combined together to form 10 systems. The systems which were
combined together are coded with same colors in the above table.
The new systems, their schematic reference and corresponding percentage of the
population is listed in the table 10.
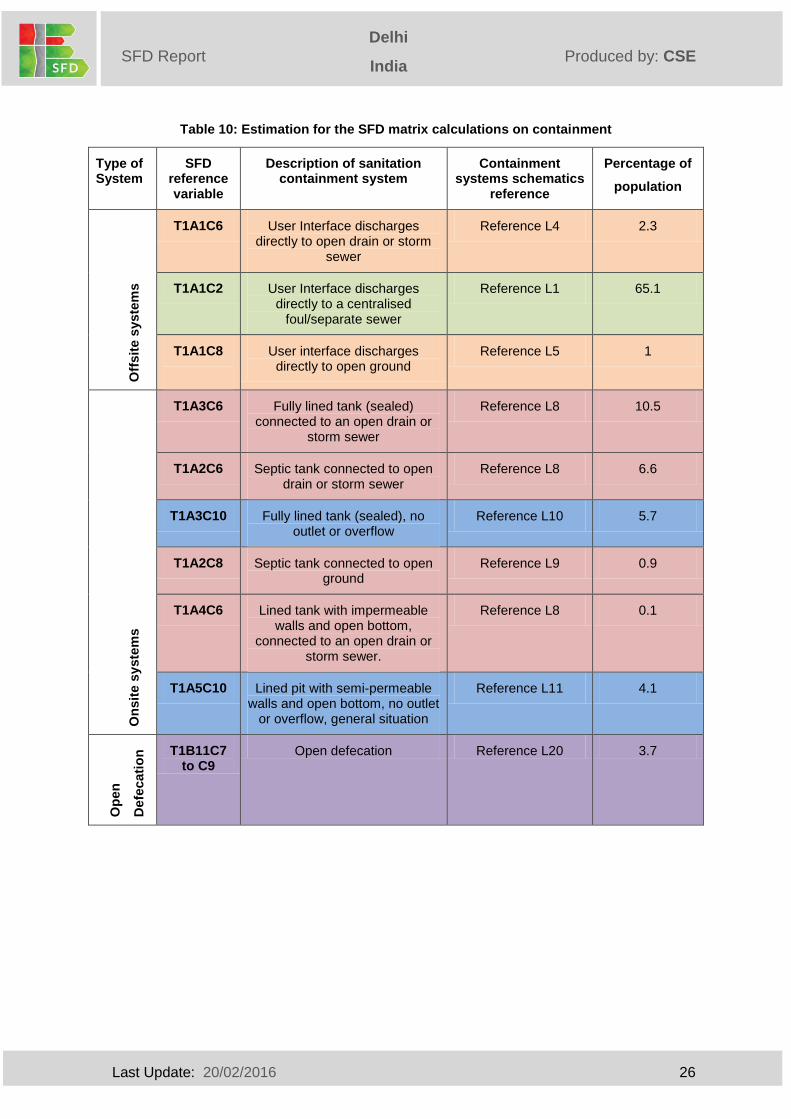
Last Update: 20/02/2016 26
Delhi
India
India
Produced by: CSE SFD Report
Solapur
Table 10: Estimation for the SFD matrix calculations on containment
Type of System
SFD reference variable
Description of sanitation containment system
Containment systems schematics
reference
Percentage of
population
Off
sit
e s
yste
ms
T1A1C6 User Interface discharges directly to open drain or storm
sewer
Reference L4 2.3
T1A1C2 User Interface discharges directly to a centralised
foul/separate sewer
Reference L1 65.1
T1A1C8
User interface discharges directly to open ground
Reference L5 1
On
sit
e s
yste
ms
T1A3C6 Fully lined tank (sealed) connected to an open drain or
storm sewer
Reference L8 10.5
T1A2C6 Septic tank connected to open drain or storm sewer
Reference L8 6.6
T1A3C10 Fully lined tank (sealed), no outlet or overflow
Reference L10 5.7
T1A2C8 Septic tank connected to open ground
Reference L9 0.9
T1A4C6 Lined tank with impermeable walls and open bottom,
connected to an open drain or storm sewer.
Reference L8 0.1
T1A5C10 Lined pit with semi-permeable walls and open bottom, no outlet
or overflow, general situation
Reference L11 4.1
Op
en
Defe
cati
on
T1B11C7 to C9
Open defecation Reference L20 3.7
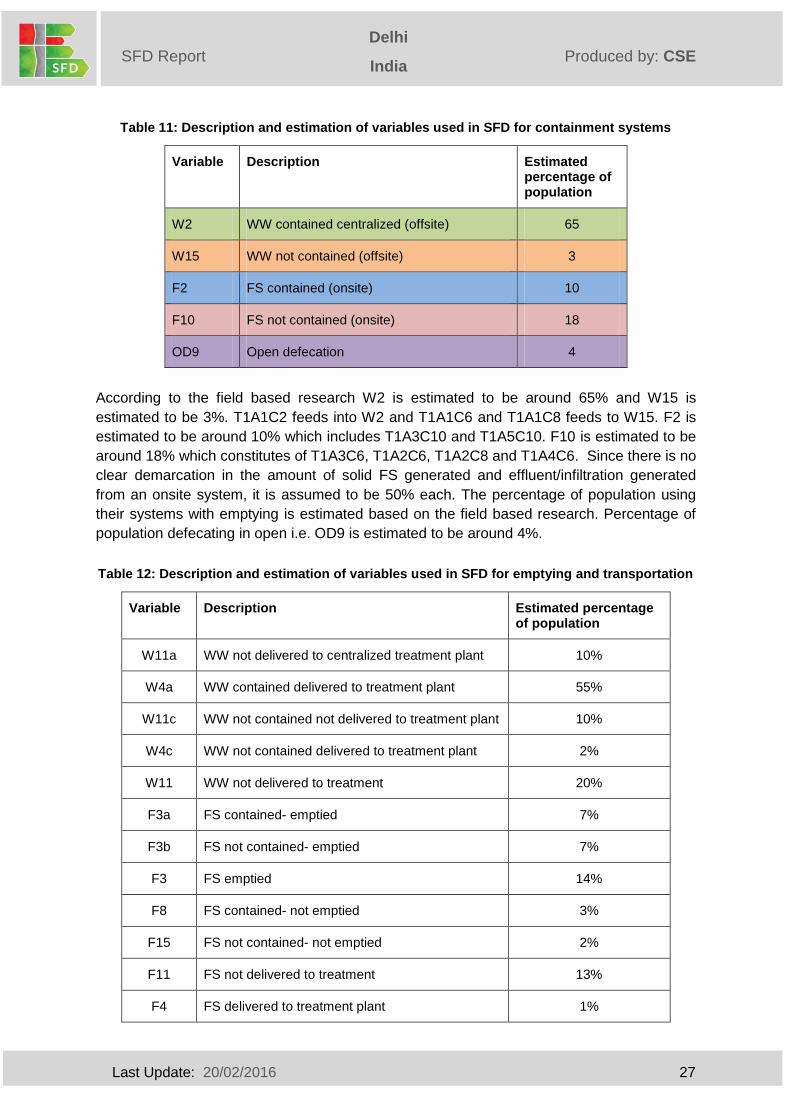
Last Update: 20/02/2016 27
Delhi
India
India
Produced by: CSE SFD Report
Solapur
Table 11: Description and estimation of variables used in SFD for containment systems
Variable Description Estimated percentage of population
W2 WW contained centralized (offsite) 65
W15 WW not contained (offsite) 3
F2 FS contained (onsite) 10
F10 FS not contained (onsite) 18
OD9 Open defecation 4
According to the field based research W2 is estimated to be around 65% and W15 is
estimated to be 3%. T1A1C2 feeds into W2 and T1A1C6 and T1A1C8 feeds to W15. F2 is
estimated to be around 10% which includes T1A3C10 and T1A5C10. F10 is estimated to be
around 18% which constitutes of T1A3C6, T1A2C6, T1A2C8 and T1A4C6. Since there is no
clear demarcation in the amount of solid FS generated and effluent/infiltration generated
from an onsite system, it is assumed to be 50% each. The percentage of population using
their systems with emptying is estimated based on the field based research. Percentage of
population defecating in open i.e. OD9 is estimated to be around 4%.
Table 12: Description and estimation of variables used in SFD for emptying and transportation
Variable Description Estimated percentage of population
W11a WW not delivered to centralized treatment plant 10%
W4a WW contained delivered to treatment plant 55%
W11c WW not contained not delivered to treatment plant 10%
W4c WW not contained delivered to treatment plant 2%
W11 WW not delivered to treatment 20%
F3a FS contained- emptied 7%
F3b FS not contained- emptied 7%
F3 FS emptied 14%
F8 FS contained- not emptied 3%
F15 FS not contained- not emptied 2%
F11 FS not delivered to treatment 13%
F4 FS delivered to treatment plant 1%
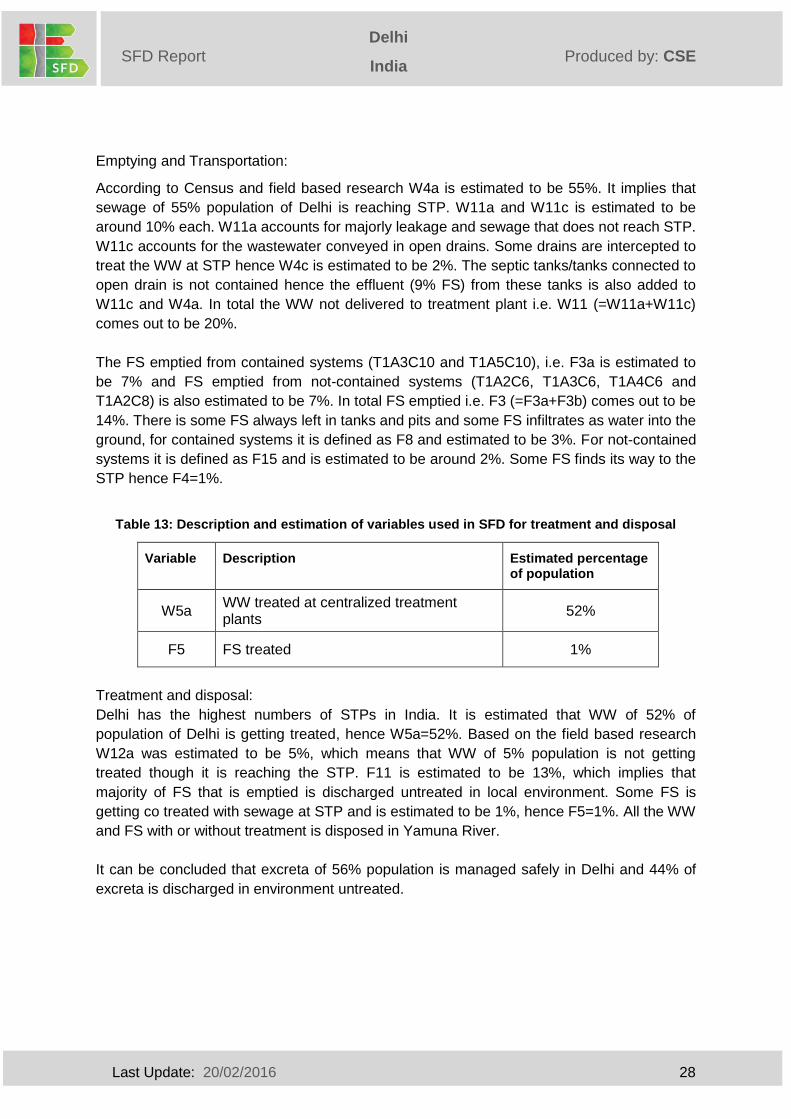
Last Update: 20/02/2016 28
Delhi
India
India
Produced by: CSE SFD Report
Solapur
Emptying and Transportation:
According to Census and field based research W4a is estimated to be 55%. It implies that
sewage of 55% population of Delhi is reaching STP. W11a and W11c is estimated to be
around 10% each. W11a accounts for majorly leakage and sewage that does not reach STP.
W11c accounts for the wastewater conveyed in open drains. Some drains are intercepted to
treat the WW at STP hence W4c is estimated to be 2%. The septic tanks/tanks connected to
open drain is not contained hence the effluent (9% FS) from these tanks is also added to
W11c and W4a. In total the WW not delivered to treatment plant i.e. W11 (=W11a+W11c)
comes out to be 20%.
The FS emptied from contained systems (T1A3C10 and T1A5C10), i.e. F3a is estimated to
be 7% and FS emptied from not-contained systems (T1A2C6, T1A3C6, T1A4C6 and
T1A2C8) is also estimated to be 7%. In total FS emptied i.e. F3 (=F3a+F3b) comes out to be
14%. There is some FS always left in tanks and pits and some FS infiltrates as water into the
ground, for contained systems it is defined as F8 and estimated to be 3%. For not-contained
systems it is defined as F15 and is estimated to be around 2%. Some FS finds its way to the
STP hence F4=1%.
Table 13: Description and estimation of variables used in SFD for treatment and disposal
Variable Description Estimated percentage of population
W5a WW treated at centralized treatment plants
52%
F5 FS treated 1%
Treatment and disposal:
Delhi has the highest numbers of STPs in India. It is estimated that WW of 52% of
population of Delhi is getting treated, hence W5a=52%. Based on the field based research
W12a was estimated to be 5%, which means that WW of 5% population is not getting
treated though it is reaching the STP. F11 is estimated to be 13%, which implies that
majority of FS that is emptied is discharged untreated in local environment. Some FS is
getting co treated with sewage at STP and is estimated to be 1%, hence F5=1%. All the WW
and FS with or without treatment is disposed in Yamuna River.
It can be concluded that excreta of 56% population is managed safely in Delhi and 44% of
excreta is discharged in environment untreated.
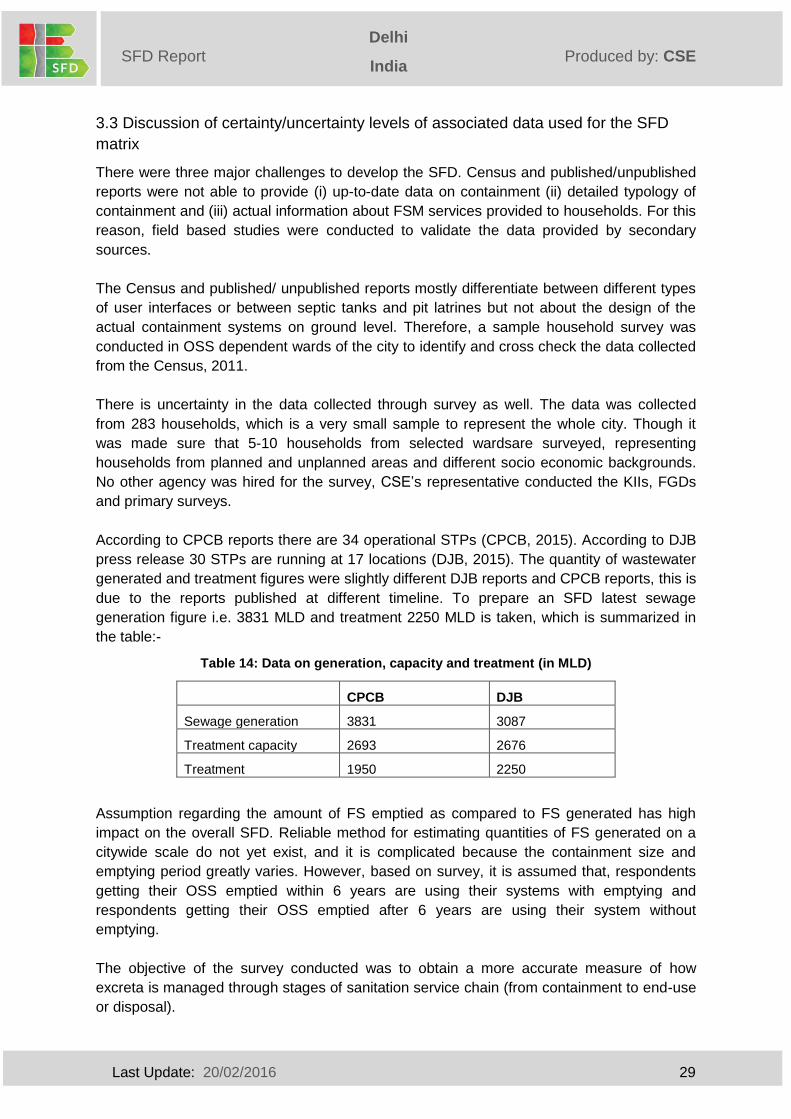
Last Update: 20/02/2016 29
Delhi
India
India
Produced by: CSE SFD Report
Solapur
3.3 Discussion of certainty/uncertainty levels of associated data used for the SFD
matrix
There were three major challenges to develop the SFD. Census and published/unpublished
reports were not able to provide (i) up-to-date data on containment (ii) detailed typology of
containment and (iii) actual information about FSM services provided to households. For this
reason, field based studies were conducted to validate the data provided by secondary
sources.
The Census and published/ unpublished reports mostly differentiate between different types
of user interfaces or between septic tanks and pit latrines but not about the design of the
actual containment systems on ground level. Therefore, a sample household survey was
conducted in OSS dependent wards of the city to identify and cross check the data collected
from the Census, 2011.
There is uncertainty in the data collected through survey as well. The data was collected
from 283 households, which is a very small sample to represent the whole city. Though it
was made sure that 5-10 households from selected wardsare surveyed, representing
households from planned and unplanned areas and different socio economic backgrounds.
No other agency was hired for the survey, CSE‟s representative conducted the KIIs, FGDs
and primary surveys.
According to CPCB reports there are 34 operational STPs (CPCB, 2015). According to DJB
press release 30 STPs are running at 17 locations (DJB, 2015). The quantity of wastewater
generated and treatment figures were slightly different DJB reports and CPCB reports, this is
due to the reports published at different timeline. To prepare an SFD latest sewage
generation figure i.e. 3831 MLD and treatment 2250 MLD is taken, which is summarized in
the table:-
Table 14: Data on generation, capacity and treatment (in MLD)
CPCB DJB
Sewage generation 3831 3087
Treatment capacity 2693 2676
Treatment 1950 2250
Assumption regarding the amount of FS emptied as compared to FS generated has high
impact on the overall SFD. Reliable method for estimating quantities of FS generated on a
citywide scale do not yet exist, and it is complicated because the containment size and
emptying period greatly varies. However, based on survey, it is assumed that, respondents
getting their OSS emptied within 6 years are using their systems with emptying and
respondents getting their OSS emptied after 6 years are using their system without
emptying.
The objective of the survey conducted was to obtain a more accurate measure of how
excreta is managed through stages of sanitation service chain (from containment to end-use
or disposal).
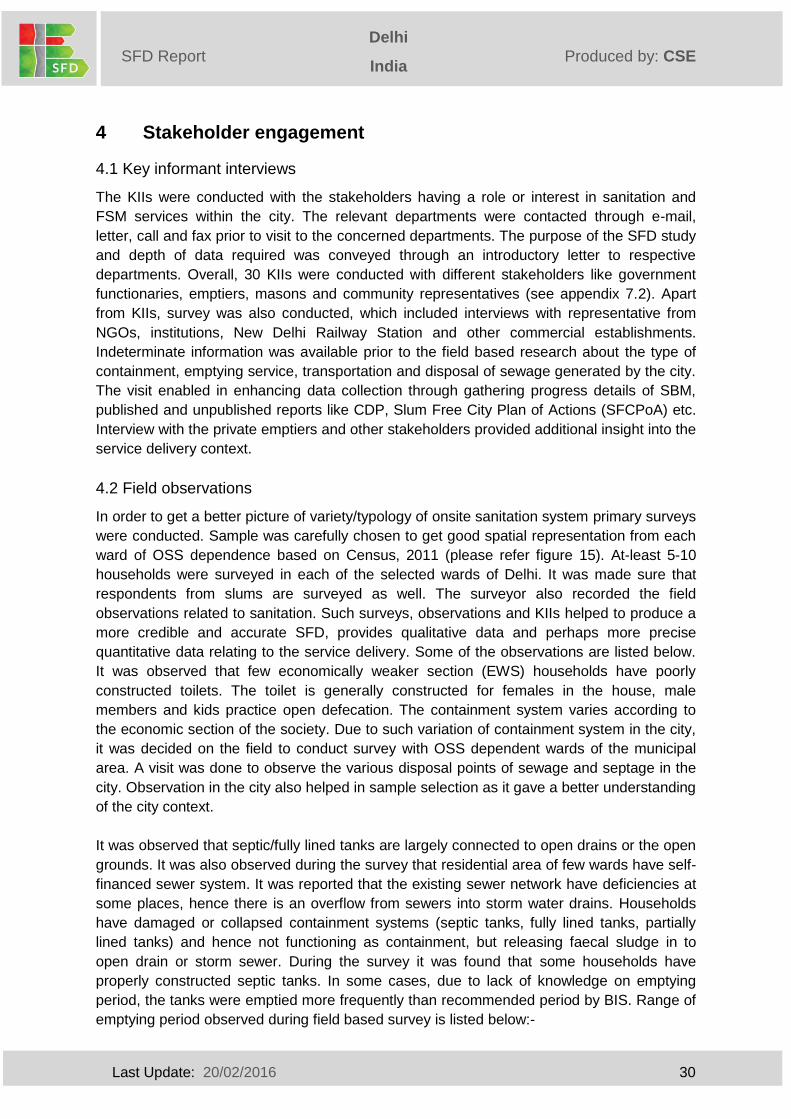
Last Update: 20/02/2016 30
Delhi
India
India
Produced by: CSE SFD Report
Solapur
4 Stakeholder engagement
4.1 Key informant interviews
The KIIs were conducted with the stakeholders having a role or interest in sanitation and
FSM services within the city. The relevant departments were contacted through e-mail,
letter, call and fax prior to visit to the concerned departments. The purpose of the SFD study
and depth of data required was conveyed through an introductory letter to respective
departments. Overall, 30 KIIs were conducted with different stakeholders like government
functionaries, emptiers, masons and community representatives (see appendix 7.2). Apart
from KIIs, survey was also conducted, which included interviews with representative from
NGOs, institutions, New Delhi Railway Station and other commercial establishments.
Indeterminate information was available prior to the field based research about the type of
containment, emptying service, transportation and disposal of sewage generated by the city.
The visit enabled in enhancing data collection through gathering progress details of SBM,
published and unpublished reports like CDP, Slum Free City Plan of Actions (SFCPoA) etc.
Interview with the private emptiers and other stakeholders provided additional insight into the
service delivery context.
4.2 Field observations
In order to get a better picture of variety/typology of onsite sanitation system primary surveys
were conducted. Sample was carefully chosen to get good spatial representation from each
ward of OSS dependence based on Census, 2011 (please refer figure 15). At-least 5-10
households were surveyed in each of the selected wards of Delhi. It was made sure that
respondents from slums are surveyed as well. The surveyor also recorded the field
observations related to sanitation. Such surveys, observations and KIIs helped to produce a
more credible and accurate SFD, provides qualitative data and perhaps more precise
quantitative data relating to the service delivery. Some of the observations are listed below.
It was observed that few economically weaker section (EWS) households have poorly
constructed toilets. The toilet is generally constructed for females in the house, male
members and kids practice open defecation. The containment system varies according to
the economic section of the society. Due to such variation of containment system in the city,
it was decided on the field to conduct survey with OSS dependent wards of the municipal
area. A visit was done to observe the various disposal points of sewage and septage in the
city. Observation in the city also helped in sample selection as it gave a better understanding
of the city context.
It was observed that septic/fully lined tanks are largely connected to open drains or the open
grounds. It was also observed during the survey that residential area of few wards have self-
financed sewer system. It was reported that the existing sewer network have deficiencies at
some places, hence there is an overflow from sewers into storm water drains. Households
have damaged or collapsed containment systems (septic tanks, fully lined tanks, partially
lined tanks) and hence not functioning as containment, but releasing faecal sludge in to
open drain or storm sewer. During the survey it was found that some households have
properly constructed septic tanks. In some cases, due to lack of knowledge on emptying
period, the tanks were emptied more frequently than recommended period by BIS. Range of
emptying period observed during field based survey is listed below:-
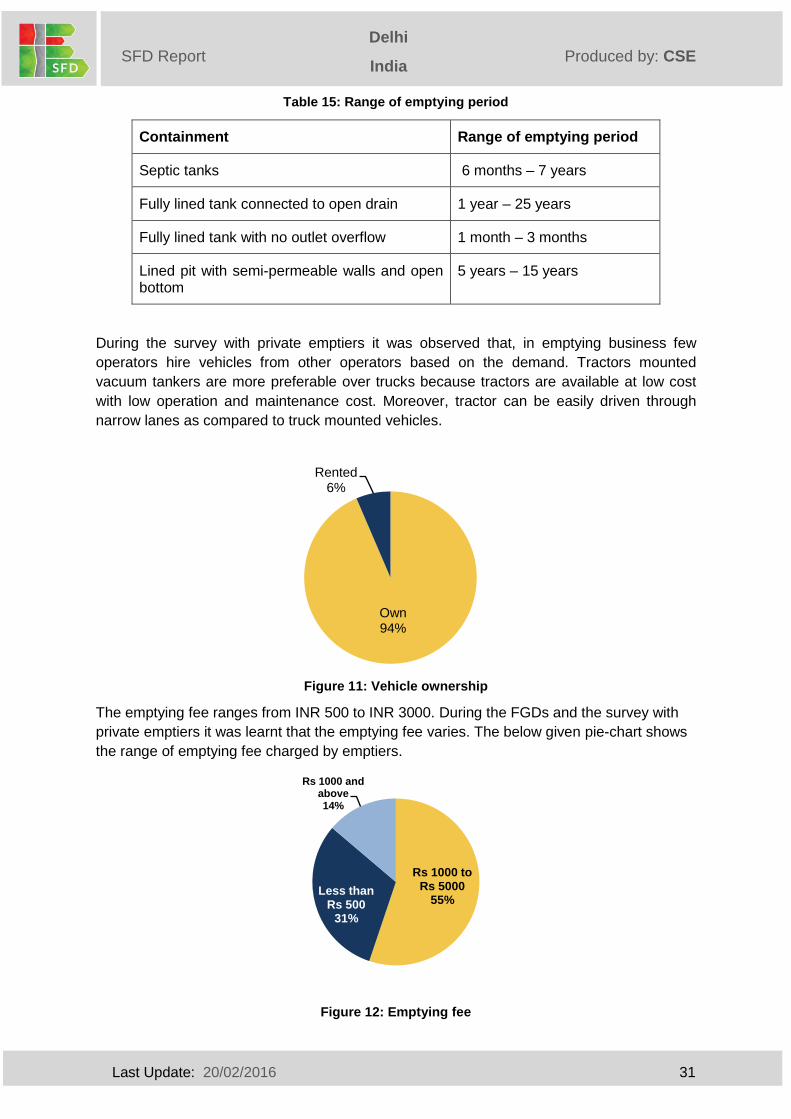
Last Update: 20/02/2016 31
Delhi
India
India
Produced by: CSE SFD Report
Solapur
Table 15: Range of emptying period
Containment Range of emptying period
Septic tanks 6 months – 7 years
Fully lined tank connected to open drain 1 year – 25 years
Fully lined tank with no outlet overflow 1 month – 3 months
Lined pit with semi-permeable walls and open bottom
5 years – 15 years
During the survey with private emptiers it was observed that, in emptying business few
operators hire vehicles from other operators based on the demand. Tractors mounted
vacuum tankers are more preferable over trucks because tractors are available at low cost
with low operation and maintenance cost. Moreover, tractor can be easily driven through
narrow lanes as compared to truck mounted vehicles.
Figure 11: Vehicle ownership
The emptying fee ranges from INR 500 to INR 3000. During the FGDs and the survey with
private emptiers it was learnt that the emptying fee varies. The below given pie-chart shows
the range of emptying fee charged by emptiers.
Figure 12: Emptying fee
Own94%
Rented6%
Rs 1000 to Rs 5000
55%Less than
Rs 50031%
Rs 1000 and above14%
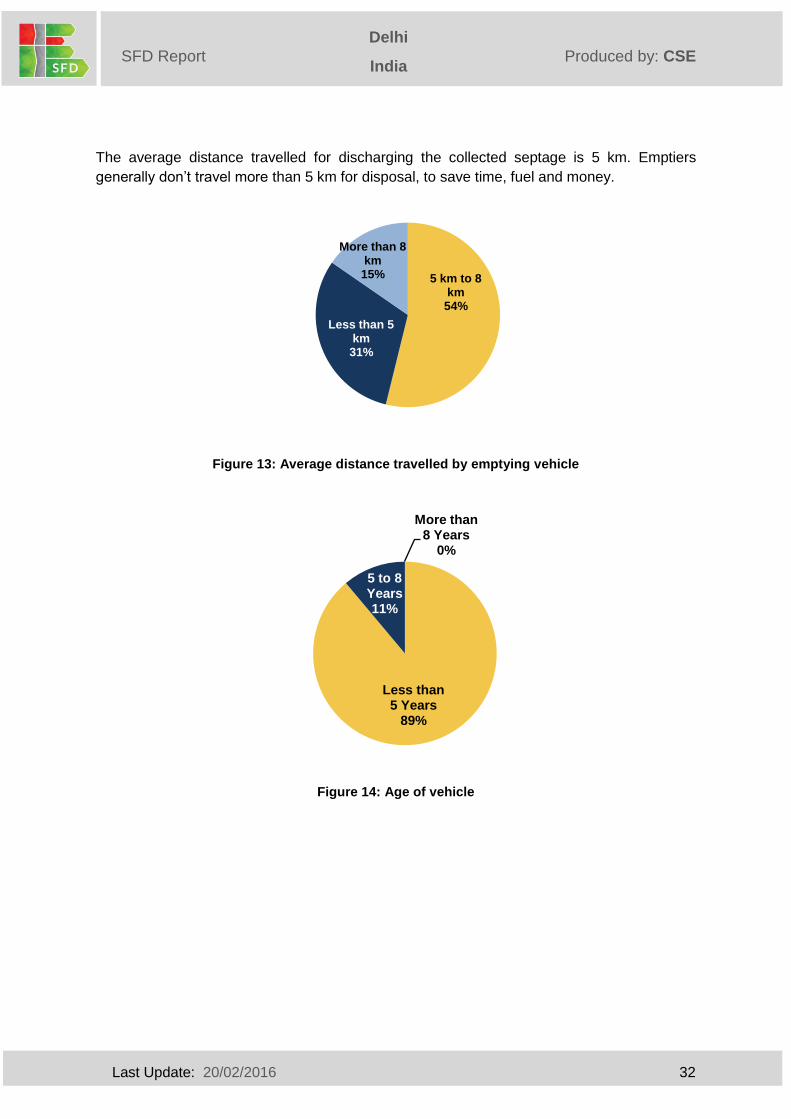
Last Update: 20/02/2016 32
Delhi
India
India
Produced by: CSE SFD Report
Solapur
The average distance travelled for discharging the collected septage is 5 km. Emptiers
generally don‟t travel more than 5 km for disposal, to save time, fuel and money.
Figure 13: Average distance travelled by emptying vehicle
Figure 14: Age of vehicle
5 km to 8 km54%
Less than 5 km31%
More than 8 km15%
Less than 5 Years
89%
5 to 8 Years11%
More than 8 Years
0%
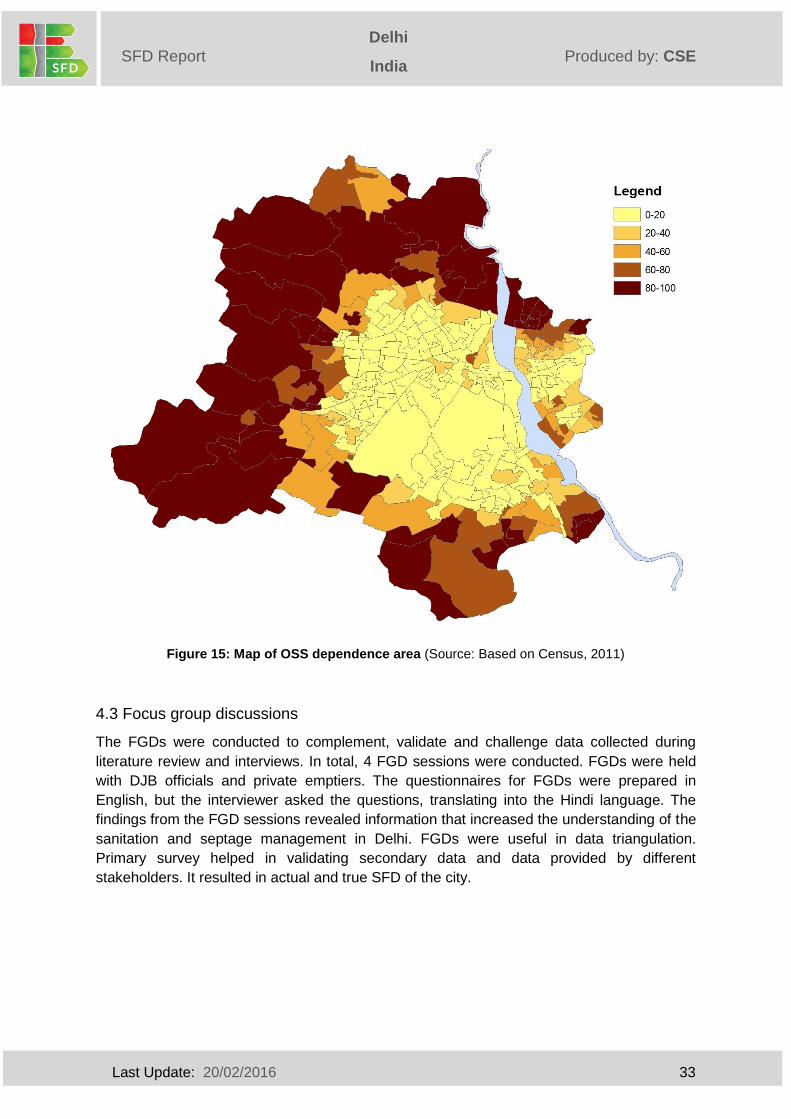
Last Update: 20/02/2016 33
Delhi
India
India
Produced by: CSE SFD Report
Solapur
Figure 15: Map of OSS dependence area (Source: Based on Census, 2011)
4.3 Focus group discussions
The FGDs were conducted to complement, validate and challenge data collected during
literature review and interviews. In total, 4 FGD sessions were conducted. FGDs were held
with DJB officials and private emptiers. The questionnaires for FGDs were prepared in
English, but the interviewer asked the questions, translating into the Hindi language. The
findings from the FGD sessions revealed information that increased the understanding of the
sanitation and septage management in Delhi. FGDs were useful in data triangulation.
Primary survey helped in validating secondary data and data provided by different
stakeholders. It resulted in actual and true SFD of the city.
Last Update: 20/02/2016 34
Delhi
India
India
Produced by: CSE SFD Report
Solapur
5 Acknowledgement
This report was compiled as part of the SFD promotion initiative project funded by the Bill
and Melinda Gates foundation (BMGF). We would like to thank Mr B.M. Dhaul, Member
(Drainage), DJB, Mr R.S. Tyagi, Member (Water Supply), DJB, Mr S.K. Mahajan,
Superintendent Engineer, DUSIB, Dr D. D Basu Former Scientist, CPCB for providing
information for this assessment. Ms Shambhavi Shukla and Mr Pradip Mishra, Research
interns at CSE helped in conducting in primary survey and FGDs on ground, without their
help this report would not have been possible. A special thanks to Dr. Suresh Kumar Rohilla,
Programme Director, CSE, for his supervision and guidance at every step of the assessment
and report writing.
Last Update: 20/02/2016 35
Delhi
India
India
Produced by: CSE SFD Report
Solapur
6 References
AAP. 2015. 70- Point Action plan Delhi Assembly Election 2015 by Aam Aadmi Party
(AAP), New Delhi
AFD. 2014. Panorama of the Urban and Municipal Sector in India: Agence Française de Développement (AFD).
BIS.1986.Code of Practice for Installation of Septic Tanks – Part 1 Design criteria
and construction: Bureau of Indian Standards (BIS).
BMGF. 2011. Final report: Landscape Analysis and Business Model Assessment in
Fecal Sludge Extraction and Transportation Models in India.
Census of India. 2011. Houselisting and housing data: Households by availability of type of latrine facility. [Online]. [Accessed 29 May 2015]. Available from:http://www.censusindia.gov.in/DigitalLibrary/TablesSeries2001.aspx CGWB. 2007. Manual on artificial recharge of ground water: Central Ground Water
Board (CGWB), Ministry of Water Resources, Government of India.
CPCB.1986.The Environment (Protection) Rules, 1986.Schedule 6: Central Pollution
Control Board (CPCB), Government of India.
CPCB. 2007. Status of Groundwater Quality in India – Part-I: Central Pollution
Control Board (CPCB), Government of India.
CPCB. 2008. Status of Groundwater Quality in India – Part-II: Central Pollution
Control Board (CPCB), Government of India.
CPHEEO.2013.Manual on Sewerage and Sewage Treatment. Second Edition:
Central Public Health and Environmental Engineering Organization (CPHEEO).
CSE. 2011. Policy Paper on Septage Management in India. New Delhi: Centre for
Science and Environment (CSE).
DDA, 1983.Building Bye - Laws, 1983: Delhi Development Authority (DDA). DJB. 2014. Final report on Sewerage Master Plan for Delhi-2031. Delhi Jal Board (DJB). June 2014. DJB. 2014a. Economic survey of Delhi: Delhi Jal Board (DJB).Government of Delhi DJB. 2015. Press Release by Delhi Jal Board (DJB) dated 20.9.2015. DJB. 2015a. About us: Delhi Jal Board. [Online].[Accessed 08 February 2016]. Available from: http://www.delhi.gov.in/wps/wcm/connect/doit_djb/DJB/Home/About+Us
Last Update: 20/02/2016 36
Delhi
India
India
Produced by: CSE SFD Report
Solapur
DMC, 1957.Delhi Municipal Corporation Act, 1957 from:http://mcdonline.gov.in/tri/sdmc_mcdportal/publications/DMC%20Act.v.11.pdf DUSIB, 2015. Interview with Superintendent Engineer of Delhi Urban Shelter Improvement Board (DUSIB). New Delhi. October 2015. GNCTD.2014. Statistical Abstract of Delhi: Directorate of Economics and statistics, Government of National capital territory of Delhi GNCTD. GNCTD.2014a. Economic Classification of Budgetary Transactions of Delhi Jal Board: Directorate of Economics and Statistic, Government of National Capital Territory of Delhi (GNCTD). GNCTD. 2015. Urban slums in Delhi: Directorate of Economics and Statistic, Government of National Capital Territory of Delhi (GNCTD). MCD.2015.South Delhi Municipal corporation-Know your Corporation. Municipal Corporation of Delhi. [Accessed 30 January 2015]. Available from:http://mcdonline.gov.in/tri/sdmc_mcdportal/knwyourCrop.php MoUD. 2013a. Advisory Note: Septage Management in Urban India. New Delhi: Ministry of Urban Development, Government of India. MoUD.2008C. Service Level Benchmarking Data book: Ministry of Urban Development (MoUD), Government of India. MoUD.2016. Swachh Bharat Urban: State wise allocation. Online.[Accessed 8 February 2016]. Available from: https://swachhbharaturban.gov.in/sanction.aspx?id=a385a59c35cbb622af29f2009ca4c111 Nema, Asit and Dr Lalit Agrawal. 2003. Wastewater Management in Najafgarh Drainage Basin – Key to Water Quality Improvement in River Yamuna. New Delhi: Indian Association of Environment Management Annual Conference.
NIUA. 2005. Status of Water Supply, Sanitation and Solid Waste Management. New Delhi: National Institute of Urban Affairs (NIUA). Planning commission.2002a. India Assessment 2002 – Water supply and Sanitation: Government of India. Planning commission.2002b. Tenth Five Year Plan- 2002 to 2007.Vol 2: Government of India. Shekhar.S. and Sarkar, A., 2013. Hydrogeological characterization and assessment of groundwater quality in shallow aquifers in vicinity of Najafgarh drain of NCT Delhi. Journal of Earth System Science, 122(1), pp.43-54 SISSO, 2015. Interview with Deputy controller of SulabhInternatinalSociol Service Organistion (SISSO) New Delhi. August 2015. TOI. 2015.DJB to increase use of recycled water in Delhi. The Times of India.[Online]. 16 August. [Accessed 8 February 2016]. Available from:http://timesofindia.indiatimes.com/city/delhi/DJB-to-increase-use-of-recycled-water-in-Delhi/articleshow/48500615.cms
Last Update: 20/02/2016 37
Delhi
India
India
Produced by: CSE SFD Report
Solapur
UDD. 2006. City Development Plan of Delhi: Department of Urban Development (UDD). Government of Delhi USAID. 2010. A Rapid Assessment of Septage Management in Asia: Policies and Practices in India, Indonesia, Malaysia, the Philippines, Sri Lanka, Thailand, and Vietnam. Bangkok: United States Agency for International Development (USAID).
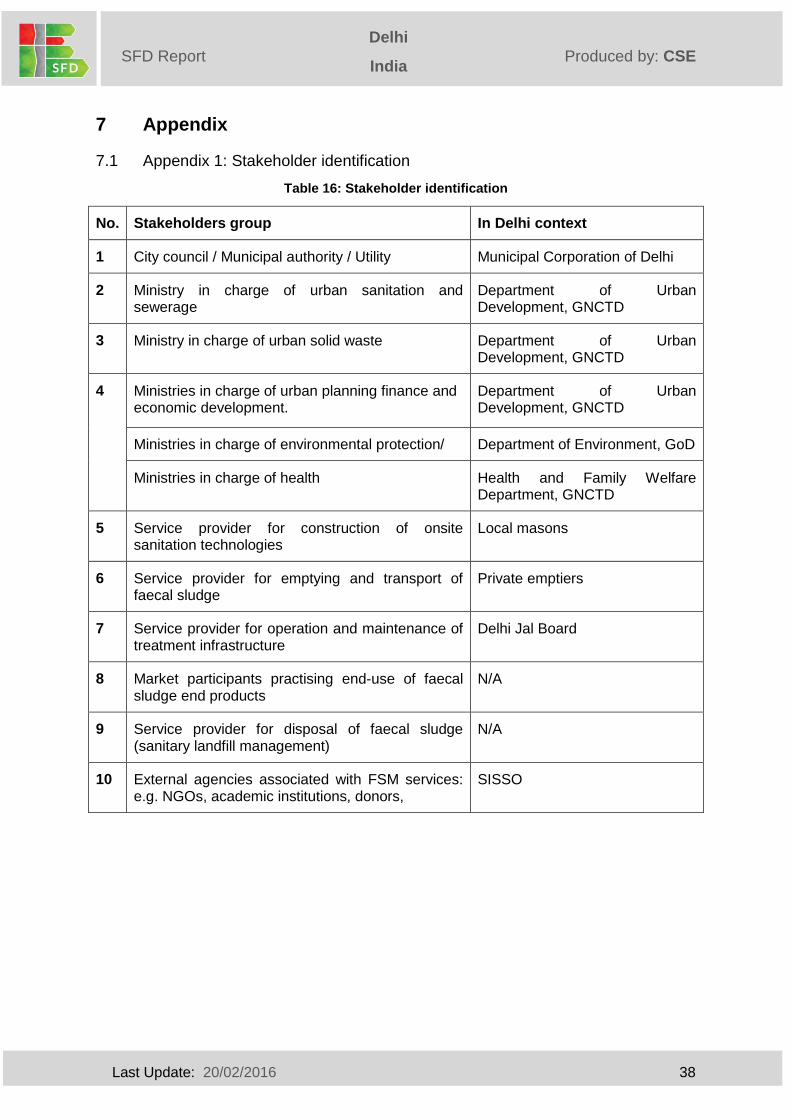
Last Update: 20/02/2016 38
Delhi
India
India
Produced by: CSE SFD Report
Solapur
7 Appendix
7.1 Appendix 1: Stakeholder identification
Table 16: Stakeholder identification
No. Stakeholders group In Delhi context
1 City council / Municipal authority / Utility Municipal Corporation of Delhi
2 Ministry in charge of urban sanitation and sewerage
Department of Urban Development, GNCTD
3 Ministry in charge of urban solid waste Department of Urban Development, GNCTD
4 Ministries in charge of urban planning finance and economic development.
Department of Urban Development, GNCTD
Ministries in charge of environmental protection/ Department of Environment, GoD
Ministries in charge of health Health and Family Welfare Department, GNCTD
5 Service provider for construction of onsite sanitation technologies
Local masons
6 Service provider for emptying and transport of faecal sludge
Private emptiers
7 Service provider for operation and maintenance of treatment infrastructure
Delhi Jal Board
8 Market participants practising end-use of faecal sludge end products
N/A
9 Service provider for disposal of faecal sludge (sanitary landfill management)
N/A
10 External agencies associated with FSM services: e.g. NGOs, academic institutions, donors,
SISSO
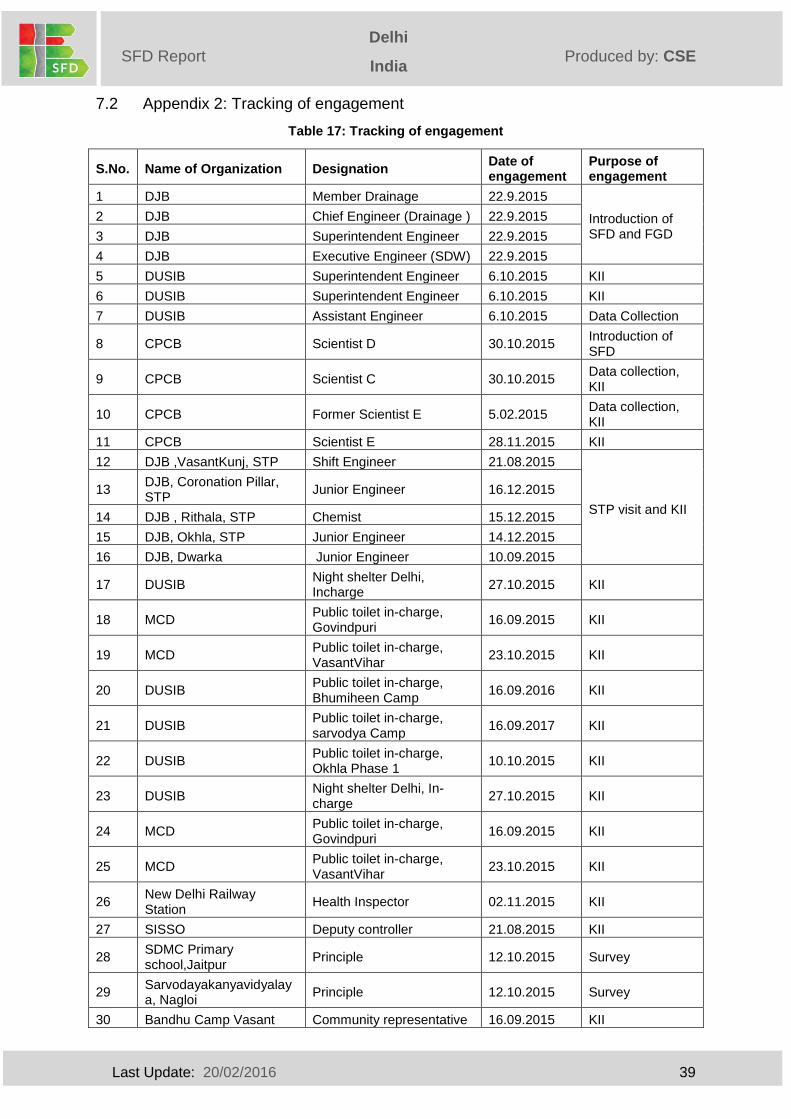
Last Update: 20/02/2016 39
Delhi
India
India
Produced by: CSE SFD Report
Solapur
7.2 Appendix 2: Tracking of engagement
Table 17: Tracking of engagement
S.No. Name of Organization Designation Date of engagement
Purpose of engagement
1 DJB Member Drainage 22.9.2015
Introduction of SFD and FGD
2 DJB Chief Engineer (Drainage ) 22.9.2015
3 DJB Superintendent Engineer 22.9.2015
4 DJB Executive Engineer (SDW) 22.9.2015
5 DUSIB Superintendent Engineer 6.10.2015 KII
6 DUSIB Superintendent Engineer 6.10.2015 KII
7 DUSIB Assistant Engineer 6.10.2015 Data Collection
8 CPCB Scientist D 30.10.2015 Introduction of SFD
9 CPCB Scientist C 30.10.2015 Data collection, KII
10 CPCB Former Scientist E 5.02.2015 Data collection, KII
11 CPCB Scientist E 28.11.2015 KII
12 DJB ,VasantKunj, STP Shift Engineer 21.08.2015
STP visit and KII
13 DJB, Coronation Pillar, STP
Junior Engineer 16.12.2015
14 DJB , Rithala, STP Chemist 15.12.2015
15 DJB, Okhla, STP Junior Engineer 14.12.2015
16 DJB, Dwarka Junior Engineer 10.09.2015
17 DUSIB Night shelter Delhi, Incharge
27.10.2015 KII
18 MCD Public toilet in-charge, Govindpuri
16.09.2015 KII
19 MCD Public toilet in-charge, VasantVihar
23.10.2015 KII
20 DUSIB Public toilet in-charge, Bhumiheen Camp
16.09.2016 KII
21 DUSIB Public toilet in-charge, sarvodya Camp
16.09.2017 KII
22 DUSIB Public toilet in-charge, Okhla Phase 1
10.10.2015 KII
23 DUSIB Night shelter Delhi, In-charge
27.10.2015 KII
24 MCD Public toilet in-charge, Govindpuri
16.09.2015 KII
25 MCD Public toilet in-charge, VasantVihar
23.10.2015 KII
26 New Delhi Railway Station
Health Inspector 02.11.2015 KII
27 SISSO Deputy controller 21.08.2015 KII
28 SDMC Primary school,Jaitpur
Principle 12.10.2015 Survey
29 Sarvodayakanyavidyalaya, Nagloi
Principle 12.10.2015 Survey
30 Bandhu Camp Vasant Community representative 16.09.2015 KII
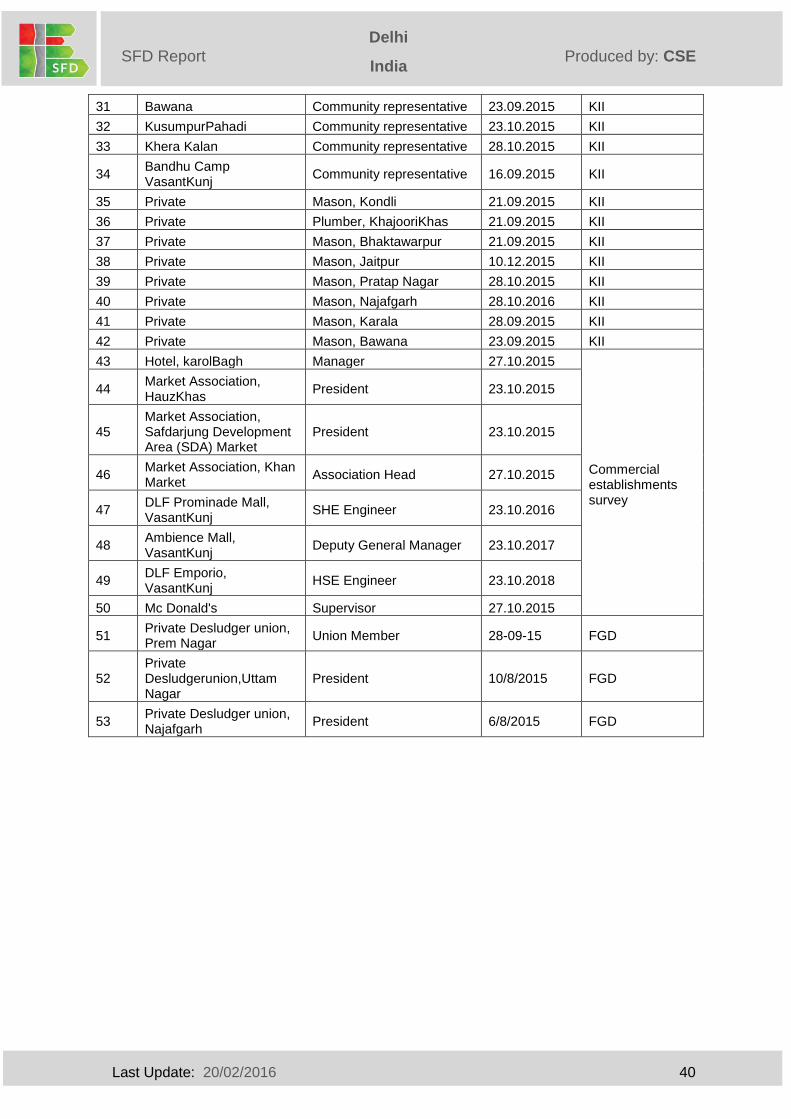
Last Update: 20/02/2016 40
Delhi
India
India
Produced by: CSE SFD Report
Solapur
31 Bawana Community representative 23.09.2015 KII
32 KusumpurPahadi Community representative 23.10.2015 KII
33 Khera Kalan Community representative 28.10.2015 KII
34 Bandhu Camp VasantKunj
Community representative 16.09.2015 KII
35 Private Mason, Kondli 21.09.2015 KII
36 Private Plumber, KhajooriKhas 21.09.2015 KII
37 Private Mason, Bhaktawarpur 21.09.2015 KII
38 Private Mason, Jaitpur 10.12.2015 KII
39 Private Mason, Pratap Nagar 28.10.2015 KII
40 Private Mason, Najafgarh 28.10.2016 KII
41 Private Mason, Karala 28.09.2015 KII
42 Private Mason, Bawana 23.09.2015 KII
43 Hotel, karolBagh Manager 27.10.2015
Commercial establishments survey
44 Market Association, HauzKhas
President 23.10.2015
45 Market Association, Safdarjung Development Area (SDA) Market
President 23.10.2015
46 Market Association, Khan Market
Association Head 27.10.2015
47 DLF Prominade Mall, VasantKunj
SHE Engineer 23.10.2016
48 Ambience Mall, VasantKunj
Deputy General Manager 23.10.2017
49 DLF Emporio, VasantKunj
HSE Engineer 23.10.2018
50 Mc Donald's Supervisor 27.10.2015
51 Private Desludger union, Prem Nagar
Union Member 28-09-15 FGD
52 Private Desludgerunion,Uttam Nagar
President 10/8/2015 FGD
53 Private Desludger union, Najafgarh
President 6/8/2015 FGD
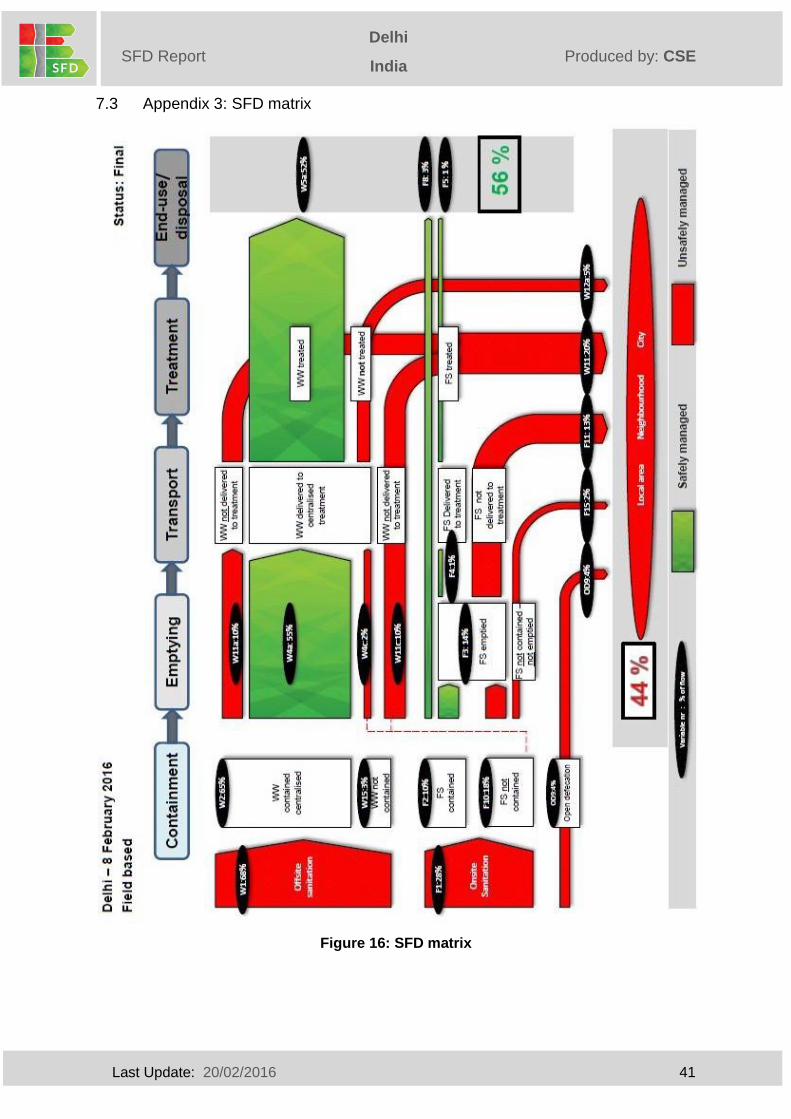
Last Update: 20/02/2016 41
Delhi
India
India
Produced by: CSE SFD Report
Solapur
7.3 Appendix 3: SFD matrix
Figure 16: SFD matrix
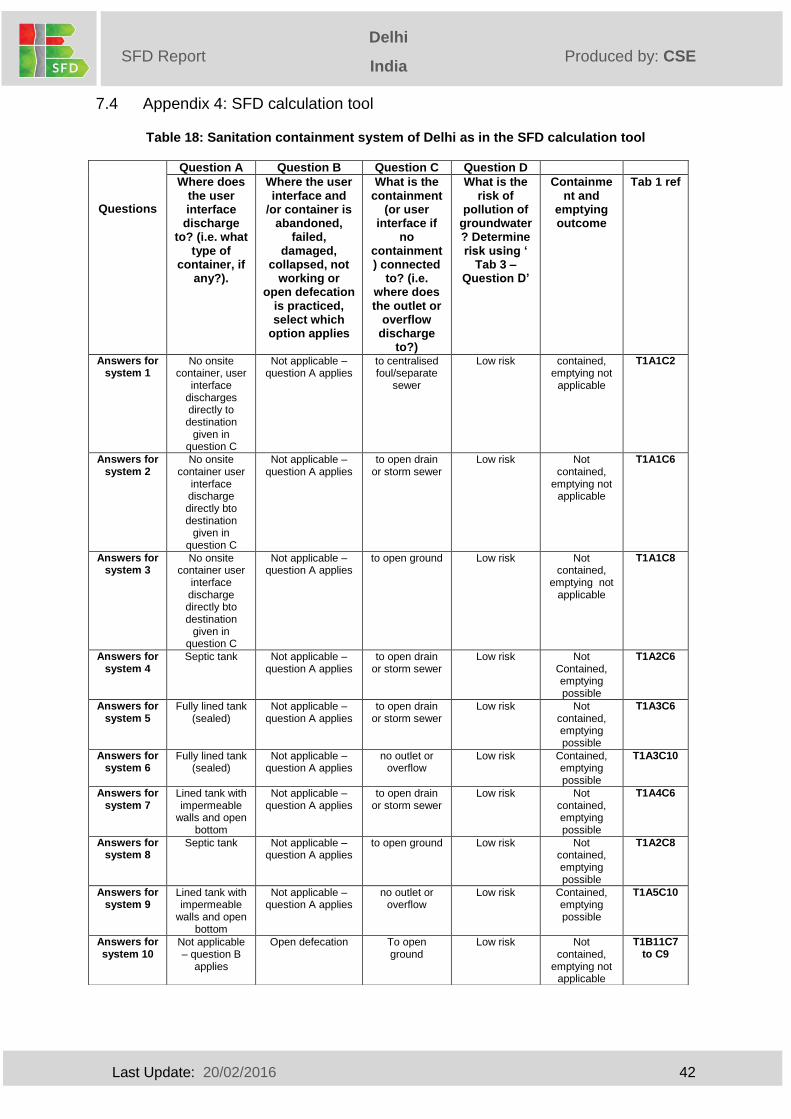
Last Update: 20/02/2016 42
Delhi
India
India
Produced by: CSE SFD Report
Solapur
7.4 Appendix 4: SFD calculation tool
Table 18: Sanitation containment system of Delhi as in the SFD calculation tool
Questions
Question A Question B Question C Question D
Where does the user interface
discharge to? (i.e. what
type of container, if
any?).
Where the user interface and
/or container is abandoned,
failed, damaged,
collapsed, not working or
open defecation is practiced, select which
option applies
What is the containment
(or user interface if
no containment) connected
to? (i.e. where does the outlet or
overflow discharge
to?)
What is the risk of
pollution of groundwater? Determine risk using ‘
Tab 3 – Question D’
Containment and
emptying outcome
Tab 1 ref
Answers for system 1
No onsite container, user
interface discharges directly to destination
given in question C
Not applicable – question A applies
to centralised foul/separate
sewer
Low risk contained, emptying not
applicable
T1A1C2
Answers for system 2
No onsite container user
interface discharge directly bto destination
given in question C
Not applicable – question A applies
to open drain or storm sewer
Low risk Not contained,
emptying not applicable
T1A1C6
Answers for system 3
No onsite container user
interface discharge directly bto destination
given in question C
Not applicable – question A applies
to open ground Low risk Not contained,
emptying not applicable
T1A1C8
Answers for system 4
Septic tank Not applicable – question A applies
to open drain or storm sewer
Low risk Not Contained, emptying possible
T1A2C6
Answers for system 5
Fully lined tank (sealed)
Not applicable – question A applies
to open drain or storm sewer
Low risk Not contained, emptying possible
T1A3C6
Answers for system 6
Fully lined tank (sealed)
Not applicable – question A applies
no outlet or overflow
Low risk Contained, emptying possible
T1A3C10
Answers for system 7
Lined tank with impermeable
walls and open bottom
Not applicable – question A applies
to open drain or storm sewer
Low risk Not contained, emptying possible
T1A4C6
Answers for system 8
Septic tank Not applicable – question A applies
to open ground Low risk Not contained, emptying possible
T1A2C8
Answers for system 9
Lined tank with impermeable
walls and open bottom
Not applicable – question A applies
no outlet or overflow
Low risk Contained, emptying possible
T1A5C10
Answers for system 10
Not applicable – question B
applies
Open defecation To open ground
Low risk Not contained,
emptying not applicable
T1B11C7 to C9
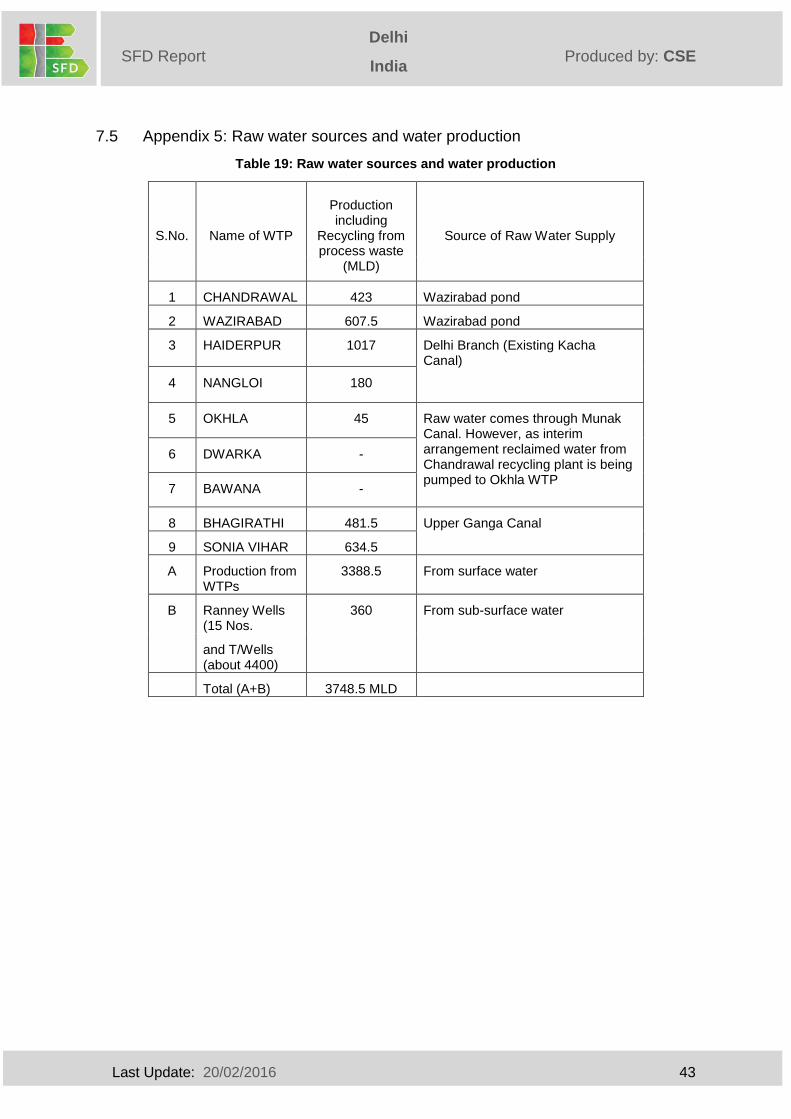
Last Update: 20/02/2016 43
Delhi
India
India
Produced by: CSE SFD Report
Solapur
7.5 Appendix 5: Raw water sources and water production
Table 19: Raw water sources and water production
S.No. Name of WTP
Production including
Recycling from process waste
(MLD)
Source of Raw Water Supply
1 CHANDRAWAL 423 Wazirabad pond
2 WAZIRABAD 607.5 Wazirabad pond
3 HAIDERPUR 1017 Delhi Branch (Existing Kacha Canal)
4 NANGLOI 180
5 OKHLA 45 Raw water comes through Munak Canal. However, as interim arrangement reclaimed water from Chandrawal recycling plant is being pumped to Okhla WTP
6 DWARKA -
7 BAWANA -
8 BHAGIRATHI 481.5 Upper Ganga Canal
9 SONIA VIHAR 634.5
A Production from WTPs
3388.5 From surface water
B Ranney Wells (15 Nos.
360 From sub-surface water
and T/Wells (about 4400)
Total (A+B) 3748.5 MLD
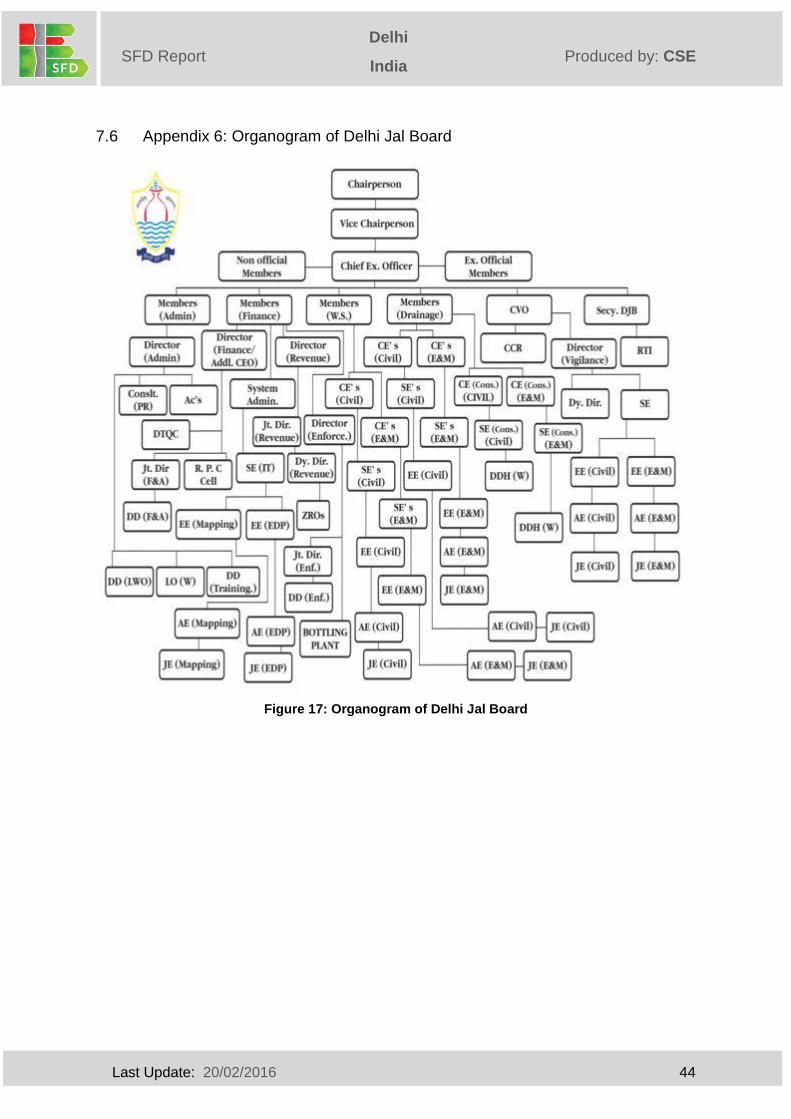
Last Update: 20/02/2016 44
Delhi
India
India
Produced by: CSE SFD Report
Solapur
7.6 Appendix 6: Organogram of Delhi Jal Board
Figure 17: Organogram of Delhi Jal Board
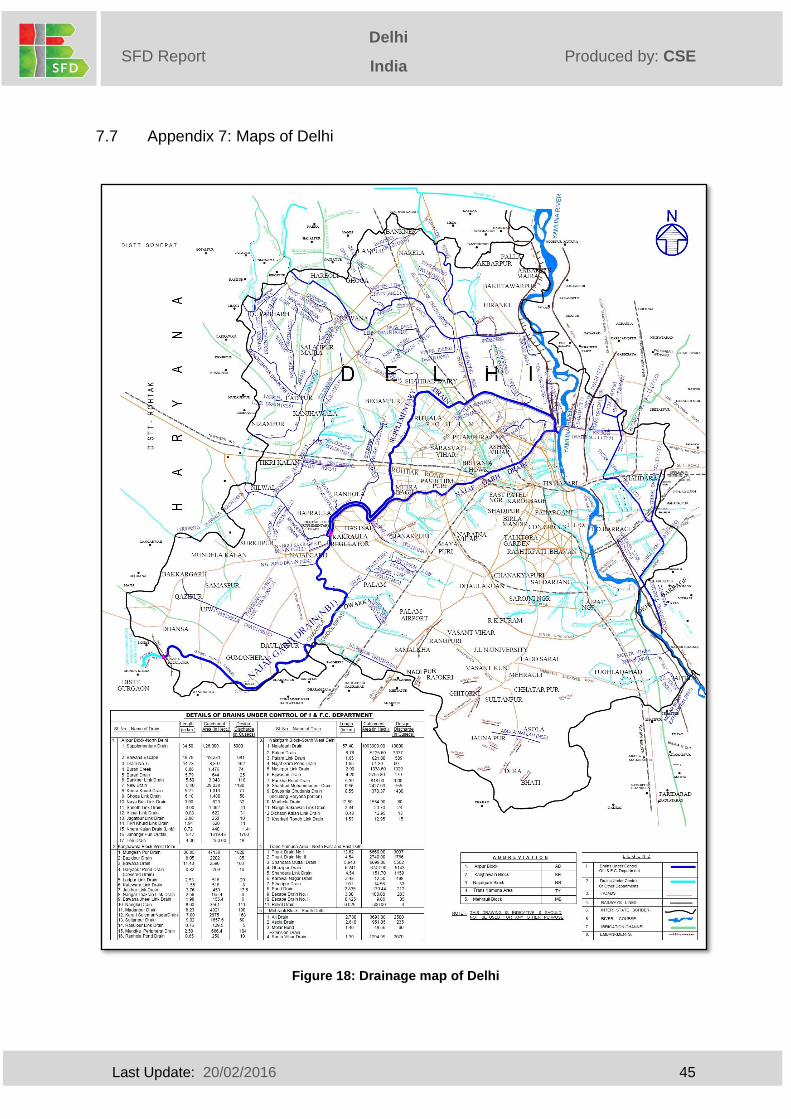
Last Update: 20/02/2016 45
Delhi
India
India
Produced by: CSE SFD Report
Solapur
7.7 Appendix 7: Maps of Delhi
Figure 18: Drainage map of Delhi
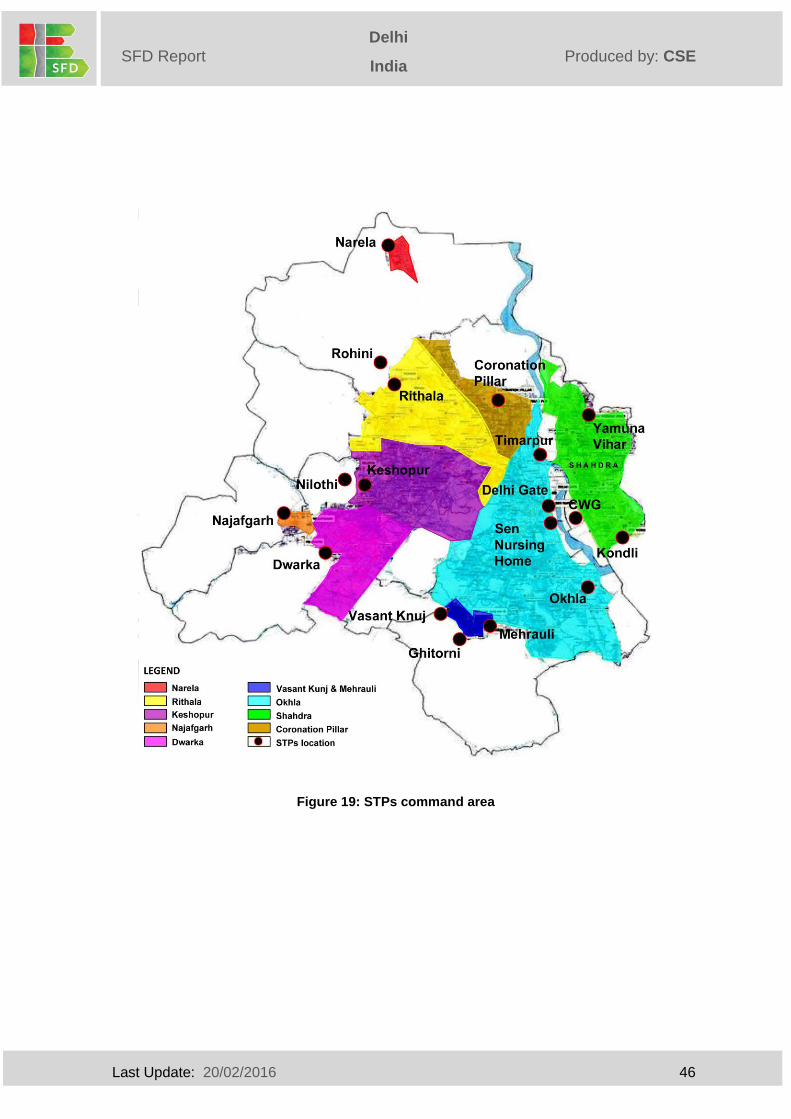
Last Update: 20/02/2016 46
Delhi
India
India
Produced by: CSE SFD Report
Solapur
Figure 19: STPs command area
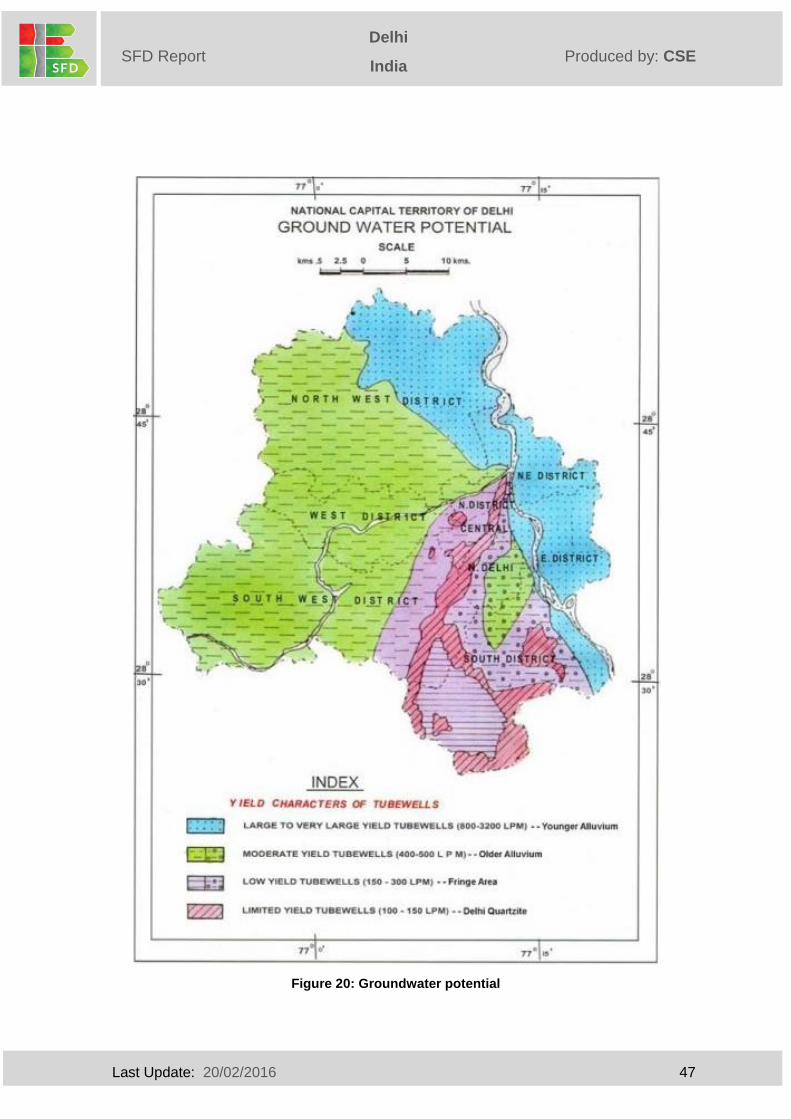
Last Update: 20/02/2016 47
Delhi
India
India
Produced by: CSE SFD Report
Solapur
Figure 20: Groundwater potential
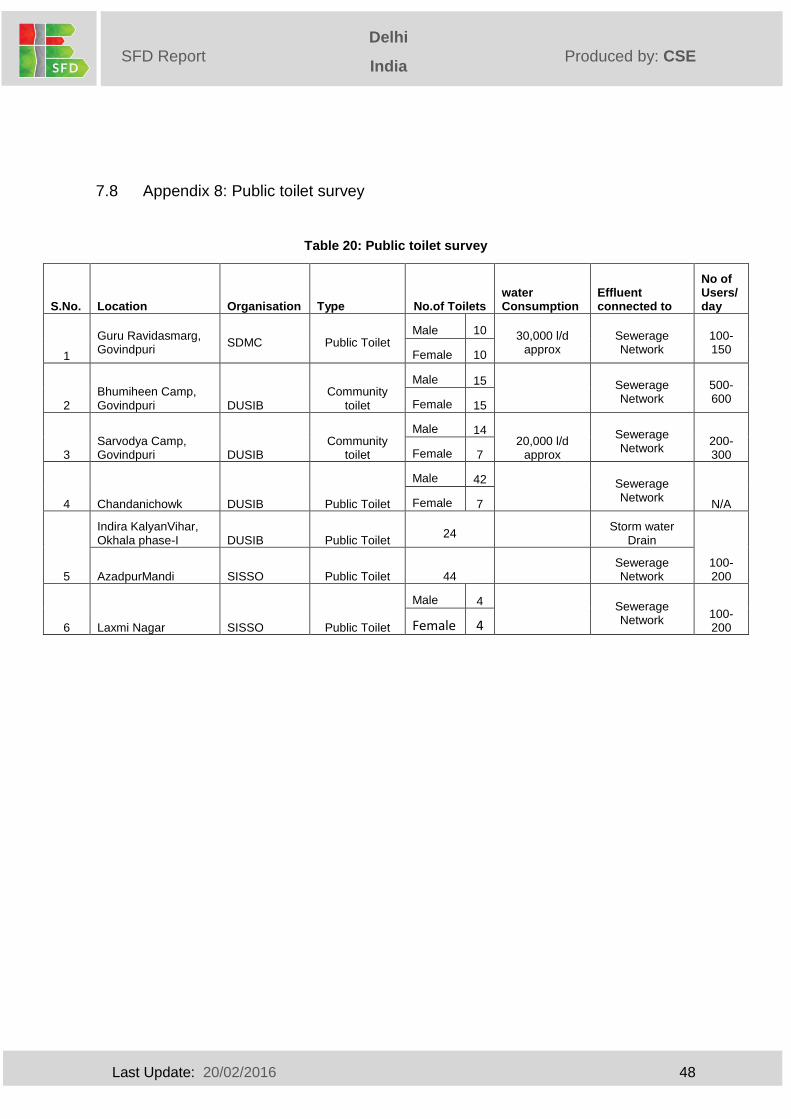
Last Update: 20/02/2016 48
Delhi
India
India
Produced by: CSE SFD Report
Solapur
7.8 Appendix 8: Public toilet survey
Table 20: Public toilet survey
S.No. Location Organisation Type No.of Toilets water Consumption
Effluent connected to
No of Users/ day
1
Guru Ravidasmarg, Govindpuri
SDMC Public Toilet Male 10 30,000 l/d
approx Sewerage Network
100-150 Female 10
2 Bhumiheen Camp, Govindpuri DUSIB
Community toilet
Male 15
Sewerage Network
500-600 Female 15
3 Sarvodya Camp, Govindpuri DUSIB
Community toilet
Male 14 20,000 l/d
approx
Sewerage Network
200-300 Female 7
4 Chandanichowk DUSIB Public Toilet
Male 42
Sewerage Network
N/A Female 7
5
Indira KalyanVihar, Okhala phase-I DUSIB Public Toilet
24
Storm water Drain
100-200 AzadpurMandi SISSO Public Toilet 44
Sewerage Network
6 Laxmi Nagar SISSO Public Toilet
Male 4
Sewerage Network
100-200 Female 4
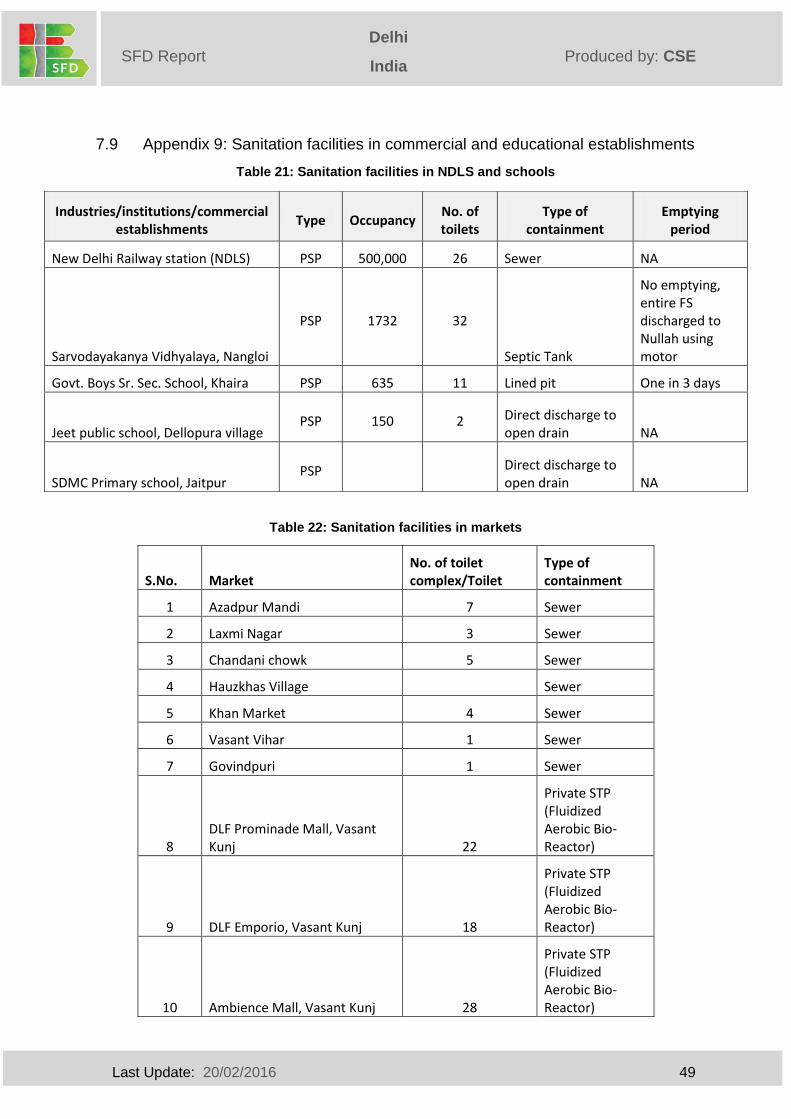
Last Update: 20/02/2016 49
Delhi
India
India
Produced by: CSE SFD Report
Solapur
7.9 Appendix 9: Sanitation facilities in commercial and educational establishments
Table 21: Sanitation facilities in NDLS and schools
Table 22: Sanitation facilities in markets
S.No. Market No. of toilet complex/Toilet
Type of containment
1 Azadpur Mandi 7 Sewer
2 Laxmi Nagar 3 Sewer
3 Chandani chowk 5 Sewer
4 Hauzkhas Village Sewer
5 Khan Market 4 Sewer
6 Vasant Vihar 1 Sewer
7 Govindpuri 1 Sewer
8 DLF Prominade Mall, Vasant Kunj 22
Private STP (Fluidized Aerobic Bio-Reactor)
9 DLF Emporio, Vasant Kunj 18
Private STP (Fluidized Aerobic Bio-Reactor)
10 Ambience Mall, Vasant Kunj 28
Private STP (Fluidized Aerobic Bio-Reactor)
Industries/institutions/commercial establishments
Type Occupancy No. of toilets
Type of containment
Emptying period
New Delhi Railway station (NDLS) PSP 500,000 26 Sewer NA
Sarvodayakanya Vidhyalaya, Nangloi
PSP 1732 32
Septic Tank
No emptying, entire FS discharged to Nullah using motor
Govt. Boys Sr. Sec. School, Khaira PSP 635 11 Lined pit One in 3 days
Jeet public school, Dellopura village PSP 150 2 Direct discharge to
open drain NA
SDMC Primary school, Jaitpur PSP Direct discharge to
open drain NA
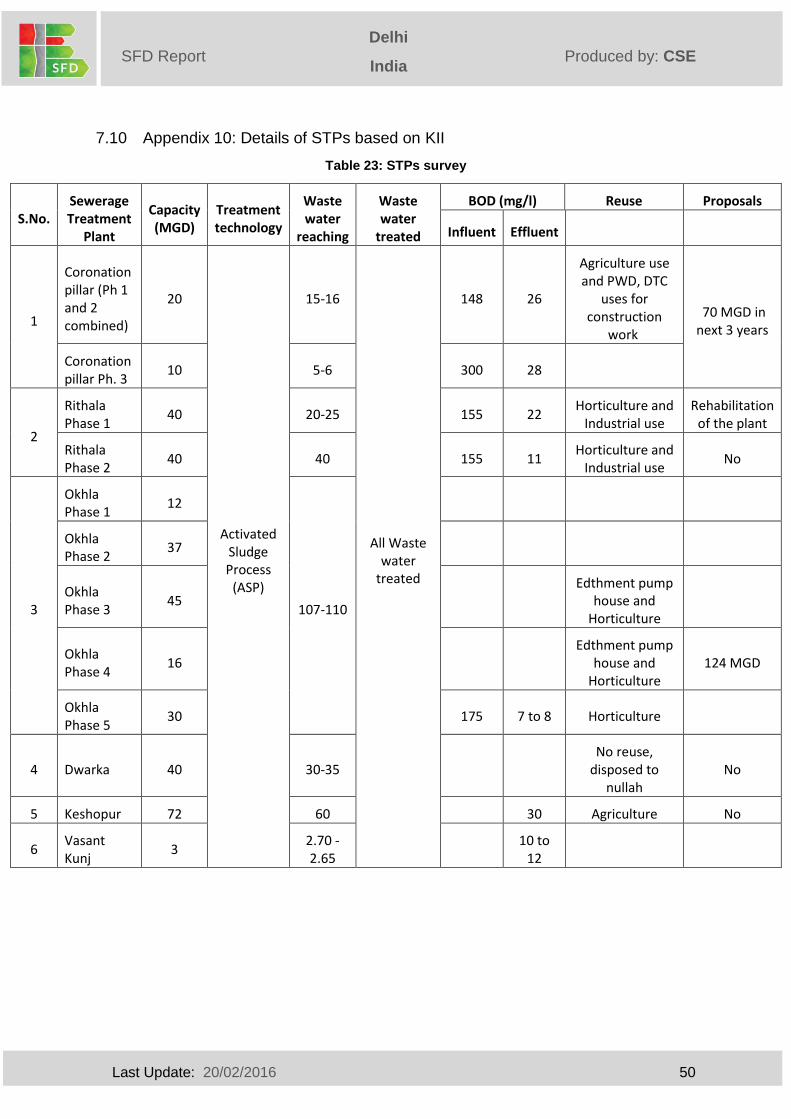
Last Update: 20/02/2016 50
Delhi
India
India
Produced by: CSE SFD Report
Solapur
7.10 Appendix 10: Details of STPs based on KII
Table 23: STPs survey
S.No. Sewerage Treatment
Plant
Capacity (MGD)
Treatment technology
Waste water
reaching
Waste water
treated
BOD (mg/l) Reuse Proposals
Influent Effluent
1
Coronation pillar (Ph 1 and 2 combined)
20
Activated Sludge Process
(ASP)
15-16
All Waste water
treated
148 26
Agriculture use and PWD, DTC
uses for construction
work
70 MGD in next 3 years
Coronation pillar Ph. 3
10 5-6 300 28
2
Rithala Phase 1
40 20-25 155 22 Horticulture and
Industrial use Rehabilitation
of the plant
Rithala Phase 2
40 40 155 11 Horticulture and
Industrial use No
3
Okhla Phase 1
12
107-110
Okhla Phase 2
37
Okhla Phase 3
45 Edthment pump
house and Horticulture
Okhla Phase 4
16 Edthment pump
house and Horticulture
124 MGD
Okhla Phase 5
30 175 7 to 8 Horticulture
4 Dwarka 40 30-35 No reuse,
disposed to nullah
No
5 Keshopur 72 60 30 Agriculture No
6 Vasant Kunj
3 2.70 - 2.65
10 to
12
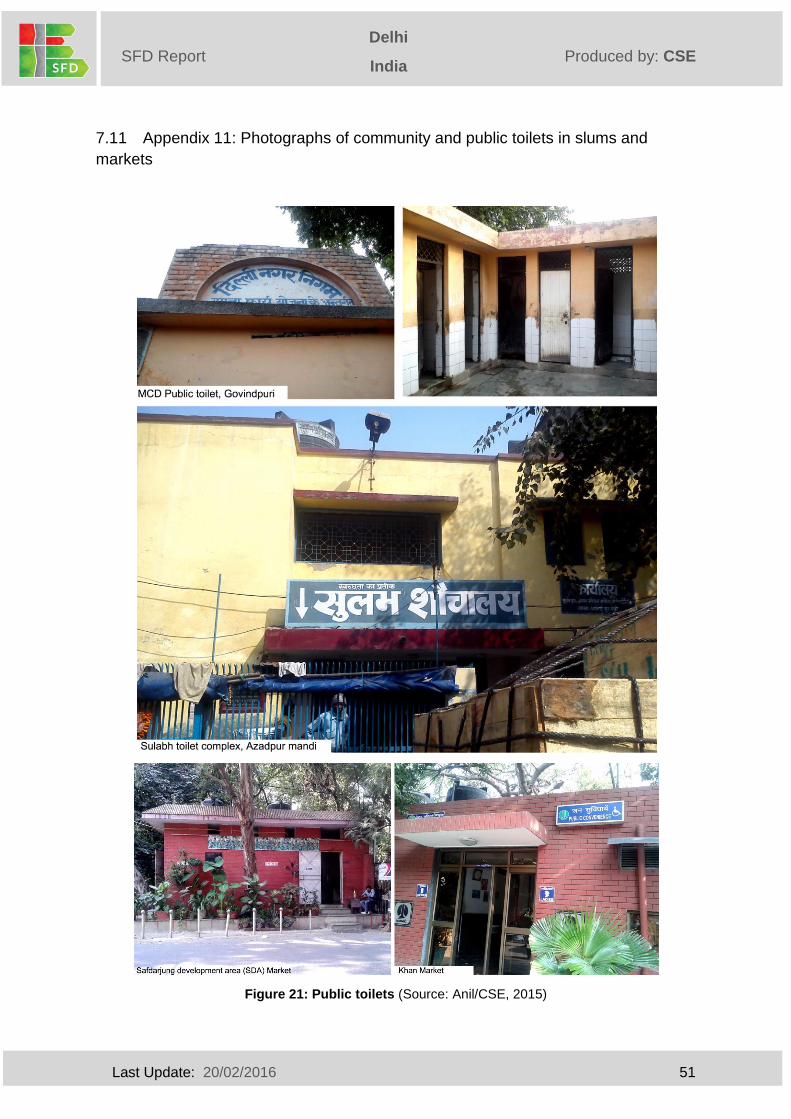
Last Update: 20/02/2016 51
Delhi
India
India
Produced by: CSE SFD Report
Solapur
7.11 Appendix 11: Photographs of community and public toilets in slums and
markets
Figure 21: Public toilets (Source: Anil/CSE, 2015)
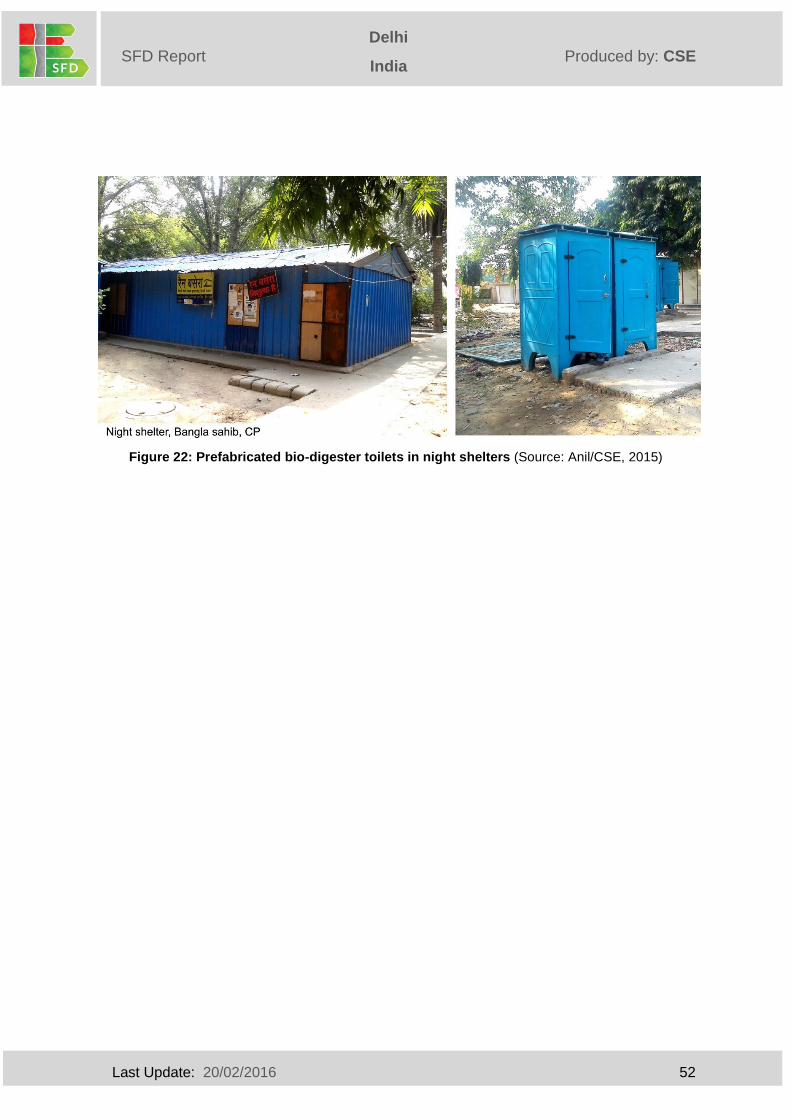
Last Update: 20/02/2016 52
Delhi
India
India
Produced by: CSE SFD Report
Solapur
Figure 22: Prefabricated bio-digester toilets in night shelters (Source: Anil/CSE, 2015)
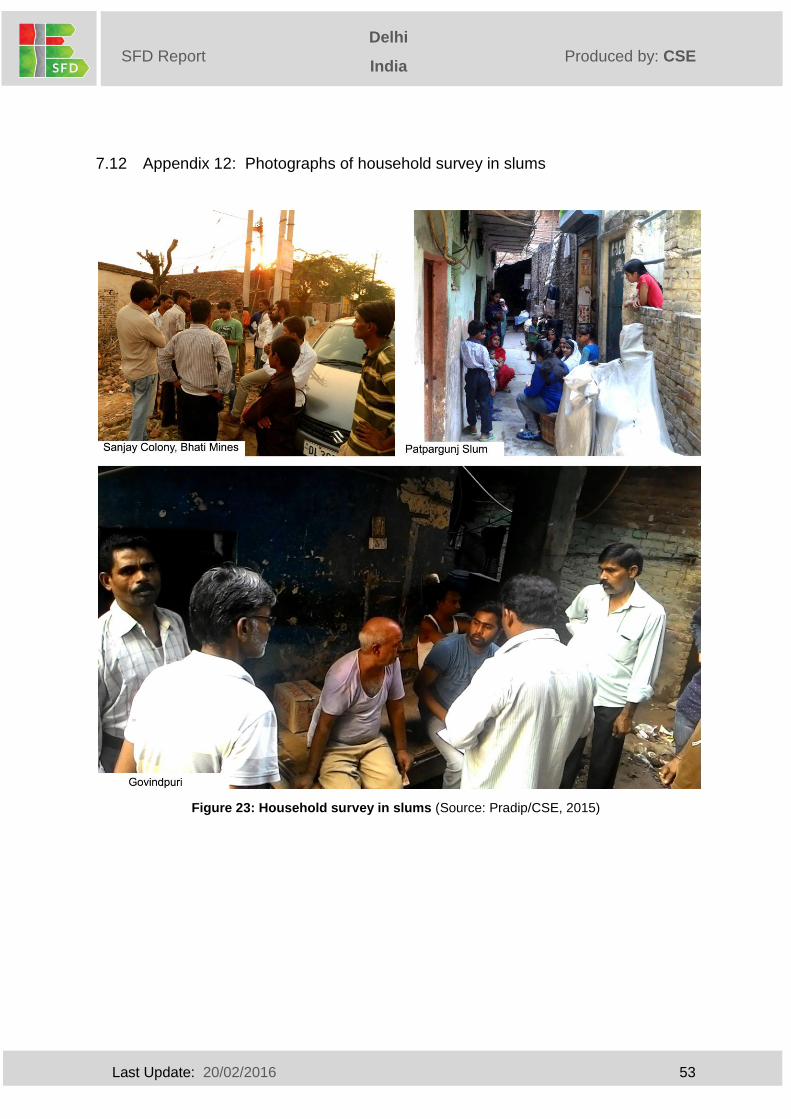
Last Update: 20/02/2016 53
Delhi
India
India
Produced by: CSE SFD Report
Solapur
7.12 Appendix 12: Photographs of household survey in slums
Figure 23: Household survey in slums (Source: Pradip/CSE, 2015)
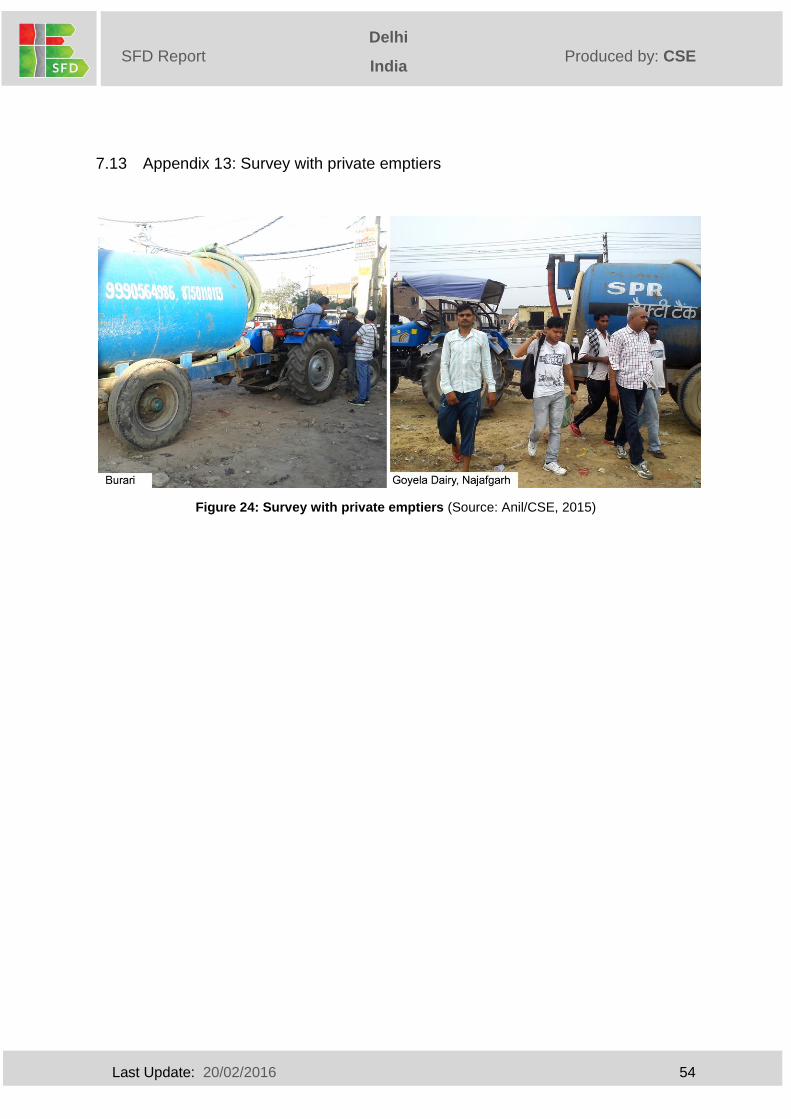
Last Update: 20/02/2016 54
Delhi
India
India
Produced by: CSE SFD Report
Solapur
7.13 Appendix 13: Survey with private emptiers
Figure 24: Survey with private emptiers (Source: Anil/CSE, 2015)
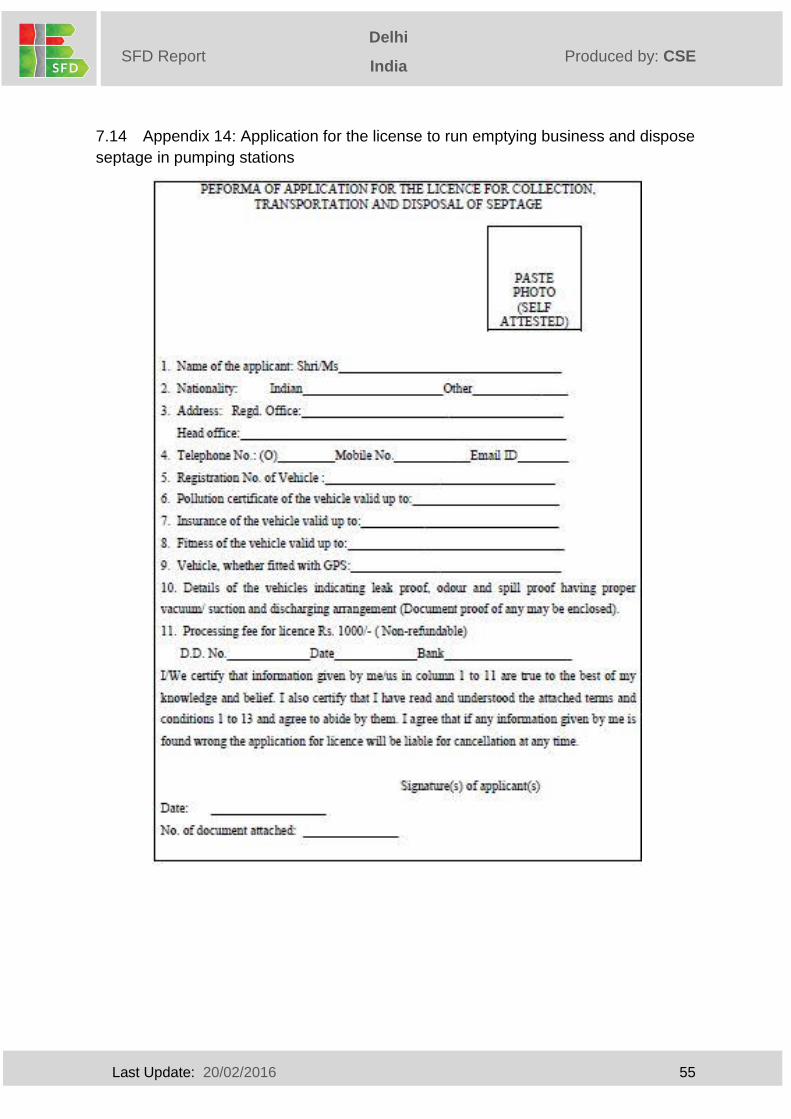
Last Update: 20/02/2016 55
Delhi
India
India
Produced by: CSE SFD Report
Solapur
7.14 Appendix 14: Application for the license to run emptying business and dispose
septage in pumping stations