Embed Size (px)
Citation preview
Future Transmission Networks
Richard Smith Future Transmission Networks Manager 4th Annual Smart Grids & Cleanpower 2012 Conference www.cir-strategy.com/events
2
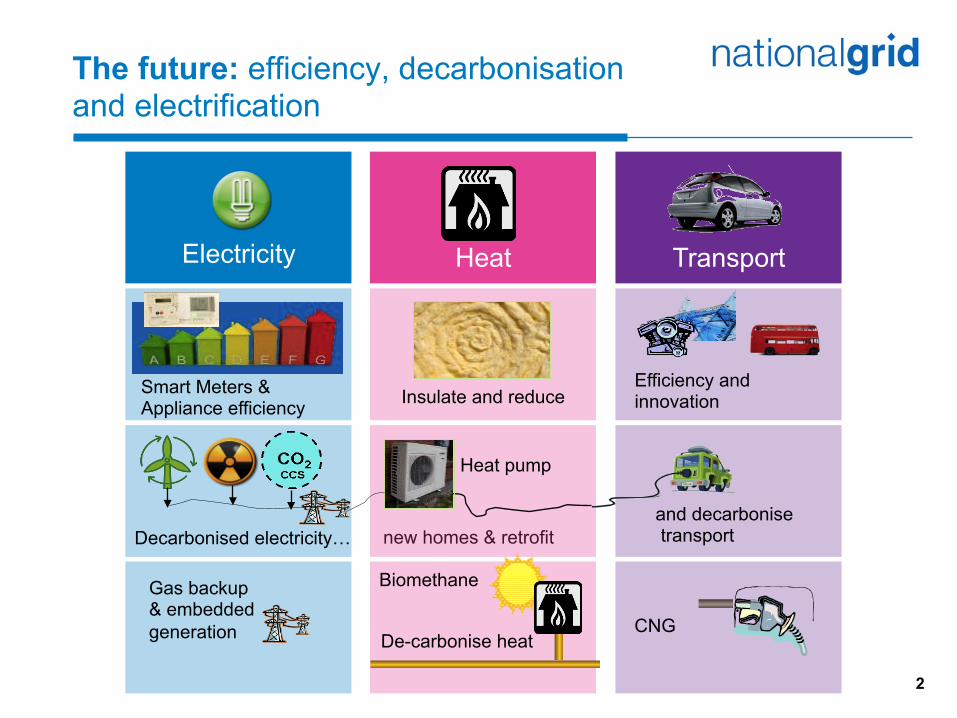
The future: efficiency, decarbonisation and electrification
new homes & retrofit
Heat pump
Decarbonised electricity… and decarbonise transport
Transport Electricity Heat
Efficiency and innovation Insulate and reduce Smart Meters &
Appliance efficiency
De-carbonise heat
Biomethane
CNG
Gas backup & embedded generation

3
Network capacity will need to increase
Distribution networks will need to more than double their capacity…
2010 2030 2050
Household demand* ~2.5kW ~4.7kW ~7kW
Number of homes 26m 31m 36m
Embedded generation ~8GW ~15GW ~20GW
Network loading (kW/km)
~75 ~170 ~300
Network scale X2.3 X4.0 Network scale vs
2010 levels * After diversity average peak demand
Distribution network operation will change in future… ¾ More distributed and micro generation (solar
PV, CHP etc.)
¾ Electric vehicle and heat pump demand increasing load dramatically in hot spot areas
¾ Grid Supply Points being permanently interconnected, opening up the possibility of loop flows through the distribution networks
¾ Possibility of local dispatch within Distribution networks to control local flows
¾ Two-way, variable power flows increase with demand side response
Smart network initiatives will see a move away from radial operation…
4
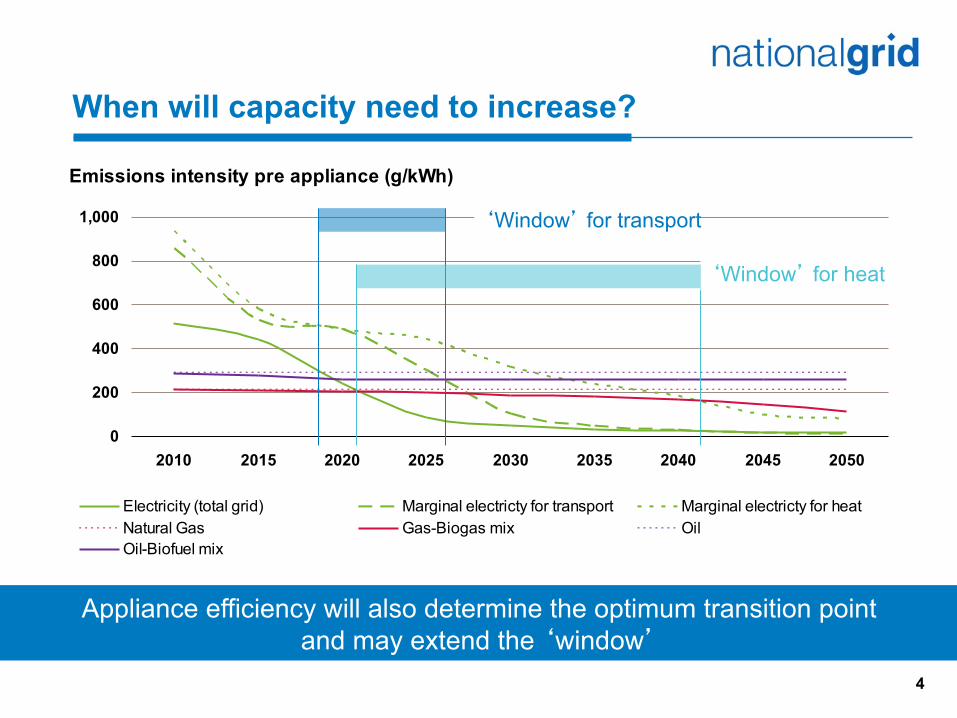
When will capacity need to increase?
Appliance efficiency will also determine the optimum transition point and may extend the ‘window’
Emissions intensity pre appliance (g/kWh)
0
200
400
600
800
1,000
2010 2015 2020 2025 2030 2035 2040 2045 2050
Electricity (total grid) Marginal electricty for transport Marginal electricty for heatNatural Gas Gas-Biogas mix OilOil-Biofuel mix
‘Window’ for transport
‘Window’ for heat
5 5
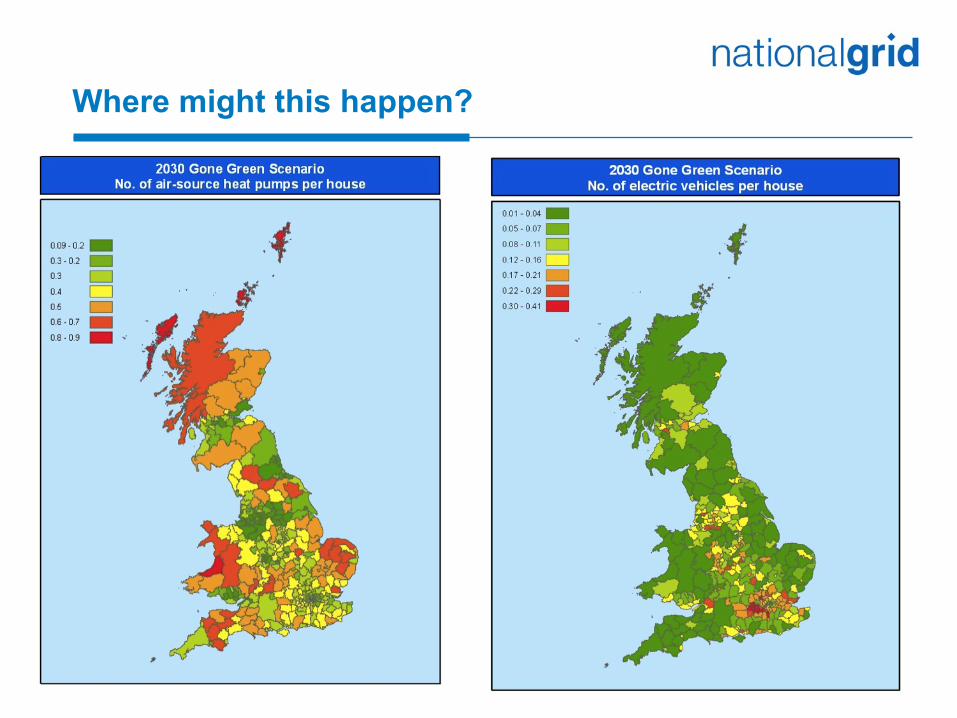
Where might this happen?
6 6
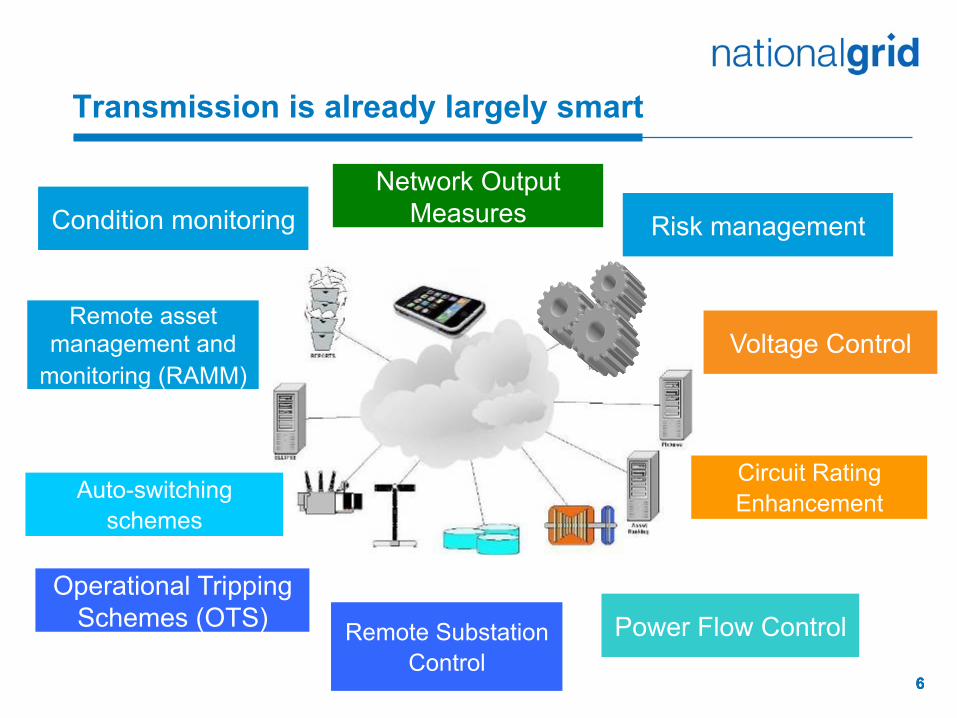
Transmission is already largely smart
Condition monitoring
Remote asset management and
monitoring (RAMM) Voltage Control
Circuit Rating Enhancement
Operational Tripping Schemes (OTS)
Auto-switching schemes
Power Flow Control Remote Substation Control
Network Output Measures Risk management
7
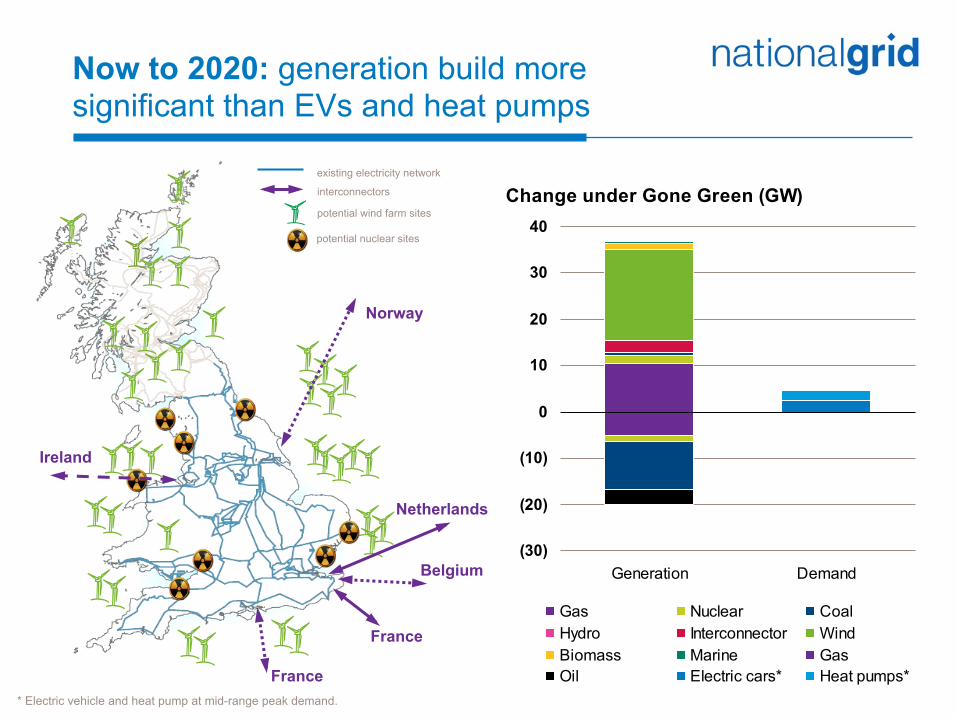
Now to 2020: generation build more significant than EVs and heat pumps
Change under Gone Green (GW)
(30)
(20)
(10)
0
10
20
30
40
Generation Demand
Gas Nuclear CoalHydro Interconnector WindBiomass Marine GasOil Electric cars* Heat pumps*
* Electric vehicle and heat pump at mid-range peak demand.
France
existing electricity network
potential wind farm sites
potential nuclear sites
interconnectors
France
Netherlands
Belgium
Norway
Ireland

8
The need for more smart actions
Scotland to England unconstrained transfers
-2000.0
0.0
2000.0
4000.0
6000.0
8000.0
10000.0
12000.0
0.0 1000.0 2000.0 3000.0 4000.0 5000.0 6000.0 7000.0 8000.0
Hours
MW 2013
2020
Gone Green Scenario simulated with ELSI
2020 proposed intact netw ork f irm N-2 capacity
2013 planned intact netw ork f irm N-2 capacity
2 x HVDC links + Series compensation
smart operation task increasingVolume of required operational management actions increasing
9 9 9
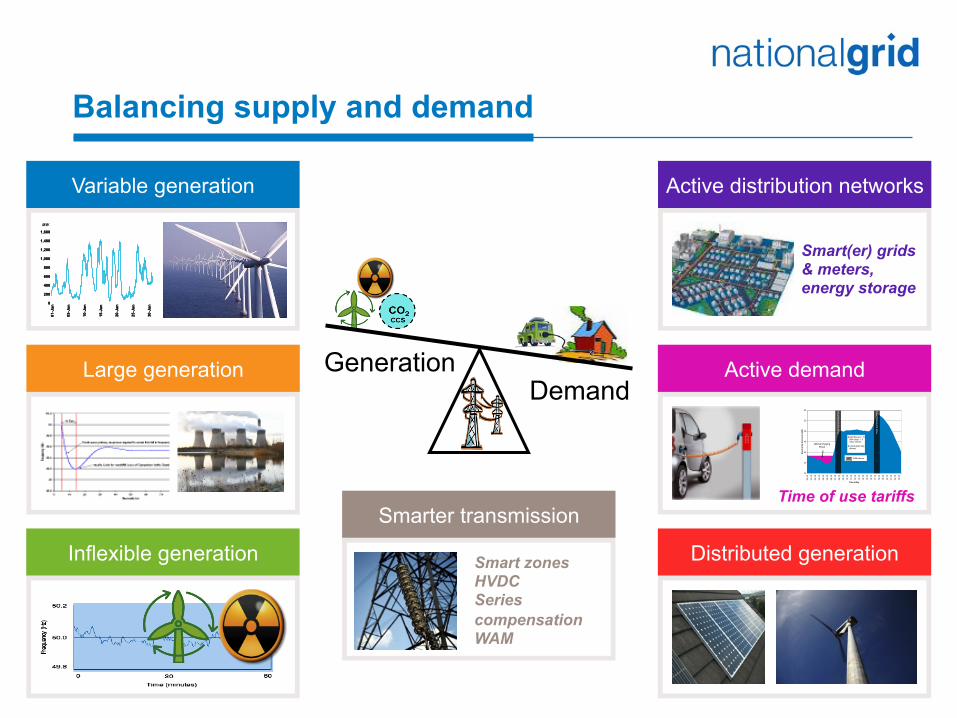
Generation Demand
Variable generation
0
200
400
600
800
1,000
1,200
1,400
1,600
0
200
400
600
800
1,000
1,200
1,400
1,600
01-Jan
05-Jan
10-Jan
15-Jan
20-Jan
25-Jan
30-Jan
01-Jan
05-Jan
10-Jan
15-Jan
20-Jan
25-Jan
30-Jan
MW
Large generation
Inflexible generation
Active distribution networks
Smart(er) grids & meters, energy storage
Active demand
Time of use tariffs
30
35
40
45
50
55
60
00:0
0
01:0
0
02:0
0
03:0
0
04:0
0
05:0
0
06:0
0
07:0
0
08:0
0
09:0
0
10:0
0
11:0
0
12:0
0
13:0
0
14:0
0
15:0
0
16:0
0
17:0
0
18:0
0
19:0
0
20:0
0
21:0
0
22:0
0
23:0
0
Time of Day
Ele
ctri
city
Dem
and
(G
W)
2020 Demand ~ 15GWh (daily) - 1.5million vehicles
Typical winter dailydemand
Pea
k C
om
mu
tin
g T
ime
12,000 miles p.a.
Pea
k C
om
mu
tin
g T
ime
Optimal Charging Period
Distributed generation
Smarter transmission
Smart zones HVDC Series compensation WAM
Balancing supply and demand

10 10 10
When the wind blows…
0
500
1000
1500
2000
2500
3000
3500
4000
00:0003
:0006
:0009
:0012
:0015
:0018
:0021
:0000
:0003
:0006
:0009
:0012
:0015
:0018
:0021
:0000
:0003
:0006
:0009
:0012
:0015
:0018
:0021
:0000
:0003
:0006
:0009
:0012
:0015
:0018
:0021
:0000
:0003
:0006
:0009
:0012
:0015
:0018
:0021
:0000
:0003
:0006
:0009
:0012
:0015
:0018
:0021
:0000
:0003
:0006
:0009
:0012
:0015
:0018
:0021
:00
02/01/2012 03/01/2012 04/01/2012 05/01/2012 06/01/2012 07/01/2012 08/01/2012
Wind Forecast Wind Actual
4m/s 15m/s 25m/s
Pow
er
Wind Speed
Wind Cut-out 3rd January 2012

11 11
Making transmission smarter
Timely provision of information to inform
decisions
‘Fit for Purpose’ Network
Develop services to deliver energy securely and
efficiently
¾ Optimising asset utilisation
¾ Improving power system access
¾ Enhancing boundary transfer capability.
¾ Better network modeling and prediction
¾ Improved planning & operational flexibility
¾ Balancing generation with demand
¾ Intelligent network automation
¾ Managing the generation mix
¾ Flexible networks
¾ Demand side management.
12 12
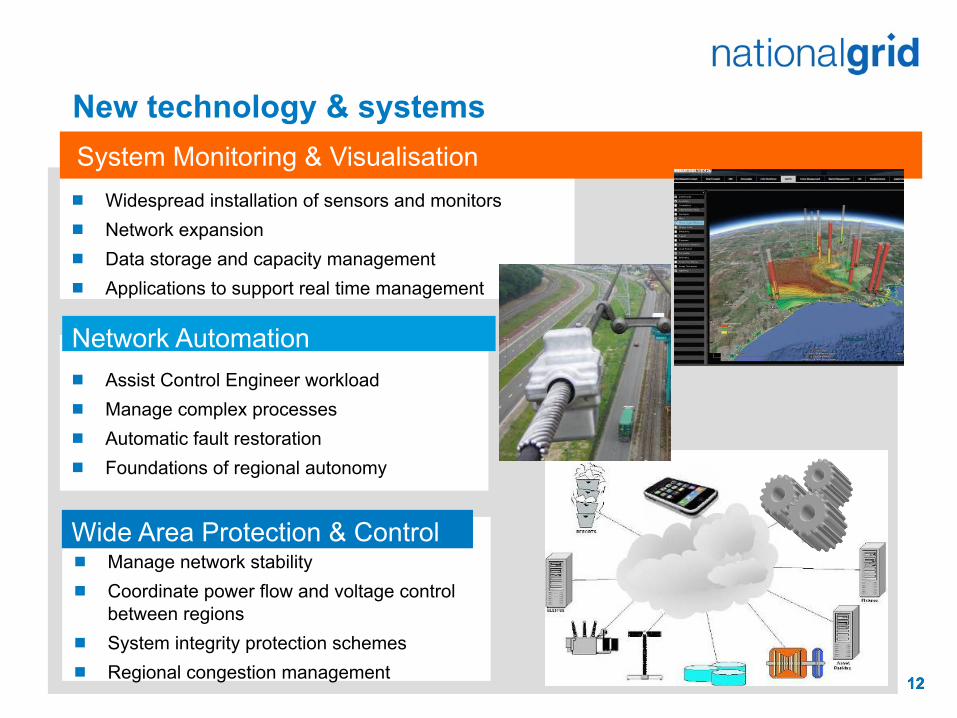
New technology & systems
¾ Manage network stability ¾ Coordinate power flow and voltage control
between regions ¾ System integrity protection schemes ¾ Regional congestion management
Wide Area Protection & Control
¾ Widespread installation of sensors and monitors ¾ Network expansion ¾ Data storage and capacity management ¾ Applications to support real time management
System Monitoring & Visualisation
¾ Assist Control Engineer workload ¾ Manage complex processes ¾ Automatic fault restoration ¾ Foundations of regional autonomy
Network Automation

13 13
Plan
ning
/Con
sent
ing
Diff
icul
ty
(lead
tim
e)
Primary asset cost for given capacity
<1 sec 0-5 mins 5-20 mins 20 mins – 6 hrs post fault continuous rating
LOW
ER
HIG
HER
CONTROL RISK
Control Philosophy Transition
Traditional approach. People centric
process. Conventional asset
N-2
ENSG approach Assets worked
dynamically into very short term ratings
Steady state flows Solving peak half hour implies operable at all points
Dynamic flows Need to solve all points and transitions
very hard
hard Operator Response Time
Control philosophy change
14
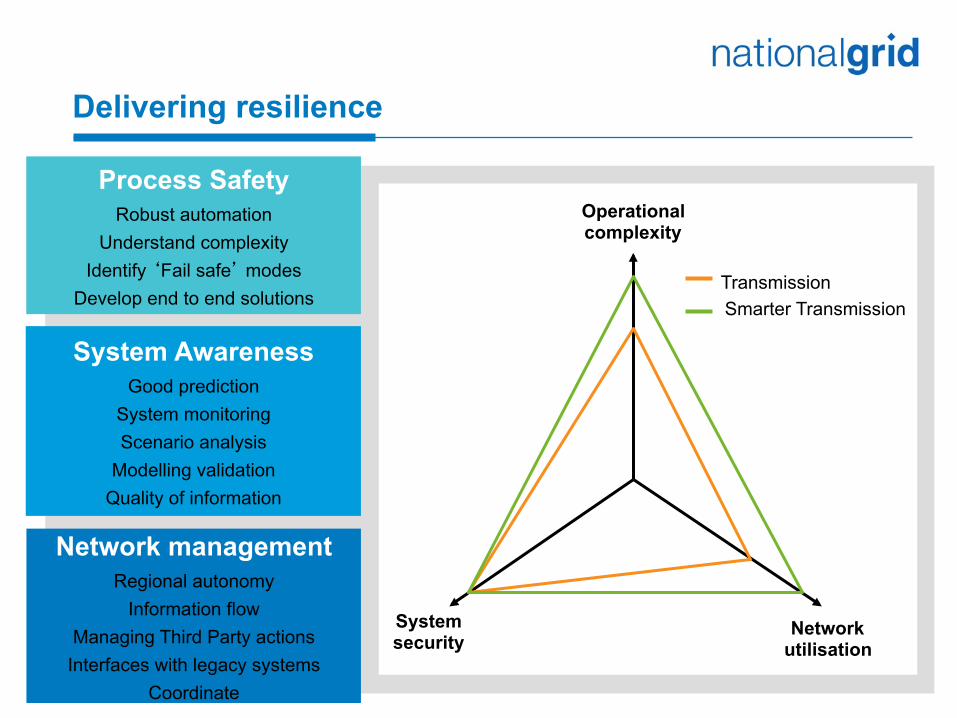
Delivering resilience
Process Safety Robust automation
Understand complexity Identify ‘Fail safe’ modes
Develop end to end solutions
Network management Regional autonomy
Information flow Managing Third Party actions
Interfaces with legacy systems Coordinate
System Awareness Good prediction
System monitoring Scenario analysis
Modelling validation Quality of information
Operational complexity
System security
Network utilisation
Transmission Smarter Transmission
15 15
At the heart of the energy transformation…