Embed Size (px)
Citation preview

Doctoral Dissertation
Enhancement of hydrogen production using the blend of two algal biomass with casamino acids as nitrogen source by Clostridium
butyricum RAK25832.
Shahira Said Ahmed Mohamed Aly
Division of Environmental Science and Engineering Graduate School of Science and Engineering
Yamaguchi University, Japan
March 2018

Doctoral Dissertation
Enhancement of hydrogen production using the blend of two algal biomass with casamino acids as nitrogen source by Clostridium
butyricum RAK25832.
2Clostridium butyricum RAK25832
Shahira Said Ahmed Mohamed Aly
A dissertation submitted to the Division of Environmental Science and Engineering of Yamaguchi University in partial fulfillment of the
requirements for the degree of Doctor Philosophy of Engineering (PhD)
Advisor: Professor Dr. Tsuyoshi IMAI Division of Construction and Environmental Engineering, Graduate School of Sciences and Technology for Innovation, Yamaguchi University
Committee Members: Prof. Dr. Tsuyoshi IMAI (Chairman of the Examining Committee) Prof. Dr. Masahiko SEKINE Prof. Rinji AKADA Prof. Masakazu NIINAE Assoc. Prof. Takaya HIGUCHI
Division of Environmental Science and Engineering Graduate School of Science and Engineering
Yamaguchi University, Japan
i
ABSTRACT
Global energy requirements are heavily depend on fossil fuels such as oil, coal and natural
gas. As the depletion of limited fossil fuels is inevitable, there is an urgency to search for
replacement source of energy. The extensive use of fossil fuel has also created an environmental
issue where emission of carbon dioxide during combustion of fossil fuels has caused a global
warming effect. For these reasons, researches are looking at alternative fuels that combat both the
mentioned problems. Hydrogen is one of the most abundant elements in the universe in its ionic
form. It is an odorless, colorless, tasteless and non-poisonous gas. When hydrogen is used as a fuel,
it generates no pollutants but produces water. In comparison with fossil fuel, hydrogen has a higher
energy yield However, due to the high renewable hydrogen production and storage costs, the
potential of hydrogen as alternative fuel of future has yet to be realized.
This research focus on biohydrogen production through dark fermentation. The
Clostridium butyricum RAK25832 was isolate from Wajiro beach at the low tide conditions in
Japan. It was used as fermentative inoculum at pH 8 and temperature 30 C. it was so important to
reach optimal condition and achieve a defined medium for this microorganism. Several carbon
sources were tested at a fixed concentration of 10 g substrate/L, with a casamino acids
concentration of 1.67 g/L under a constant temperature 30 C. It was found these bacteria could
adapt with various type of carbon source but they prefer glucose, fructose, xylose, sucrose, and
lactose sugars. Clostridium butyricum strain RAK25832 shows slight or no growth in media
containing inorganic nitrogen as the sole nitrogen source but grows well in the presence of an
organic nitrogen source such as yeast extract. However, the use of yeast extract as the nutrient
source for bacterial culture has the main disadvantage of unpredictability, as it may contain several

ii
types of nutrients, vitamins, and amino acids such as glutamic acid, making it very difficult to
define the media.
The ability of Clostridium butyricum RAK25832 to use casamino acids as a nitrogen
source was investigated. Casamino acids are mainly contain amino acids, strain RAK25832
showed he preferred final concentration of casamino acids was 26.67 g/L, with a cumulative
hydrogen production, production rate, and yield of 2505 mL H2/L, 160 mL/h, and 1.81 mol H2/mol
glucose, respectively.
Vitamins and nutrient supplementation for hydrogen production including macro and
micro nutrients are very important. As, metals and minerals are have effects on cell growth as
enzyme cofactor, transport processes and dehydrogenases. Therefore, reach to the important
elements could minimize the inputs and therefore decrease the supplement cost. Eighteen metal
elements were screened to identify the most important metals for biohydrogen production, and
four elements were optimized. The optimal medium composition was MgCl2.6H2O (0.1 g/L),
K2HPO4.3H2O (6.67 g/L), NaHCO3 (2.6 g/L), and FeCl2.4H2O (0.002 g/L). Vitamin
supplementation of the medium showed no significant effect on hydrogen production. Under the
optimized conditions, cumulative hydrogen production reached 3074 mL H2/L.
Renewable biomass is the most versatile non-petroleum based resource that is generated
from various industries as waste materials. Lignocellulosic materials such as wood and wood
products, food and starch-based materials, organic industry wastewater, household wastewater and
biodiesel industry waste could be potential resources for biohydrogen production and as a cost
effective energy production process.

iii
Producing hydrogen with high yields and production rates are very important for promoting
the commercial biohydrogen production process in a sustainable manner. Algal waste biomass
include Chlorella fusca and Ulva lactuca were used as substrates by the Clostridium butyricum
RAK25832 for biohydrogen production. Finding the blend ratio that achieve high yield was the
goal for this work. Twelve blend ratio were investigated and the ratio 4:1 were the preferred gave
a yield 86 ml H2/VS and rate 37 ml/hr. The supplementation elements with FeCl2, NaHCO3, MgCl2,
and K2HPO4 were played a vital role to improve the yield to 107 ml H2/VS. Casamino acids
supplementation were studded with every single substrate. The substrates C. fusca required a
supplementary of 13.33 g/L casamino acids and U. lactuca required 6.67 g/L. Therefore, mixing
two types of waste safe the requirement of casamino acids as it required only 3.33 g/L. Accordingly
in general, blended feedstocks from different sources will reduce additional supplements of
nutrients, resulting in cost reduction and effective energy production.

iv

v

vi
ACKNOWLEDGMENT
I would like to express my deepest and sincere gratitude to Yamaguchi University and my
advisor: Prof. Dr. Tsuyoshi Imai to support and supervision in his laboratory. I am grateful for all
his guidance, enthusiasm, advice, comments, and supports throughout study duration in Japan.
I would like to express my sincere gratitude to academic staffs in Graduate School of
Sciences and Technology for Innovation, Yamaguchi University: Prof. Dr. Masahiko Sekine,
Assoc. Prof. Dr. Takaya Higuchi, Assoc. Prof. Dr. Koichi Yamamoto, and Assist. Prof. Dr. Ariyo
Kanno for their useful comments in my research, as well as for their kindly attention throughout
monthly English seminars.
I would like to express my grateful and appreciation for Professor Dr. Rinji Akada for his
strong help in this research and comments, also I would like to thank associated Dr. Hisashi
Hoshida for help of HPLC device.
I would like to give thanks to Ms. Toshimi Yamamoto for her kindness and laboratory help
guidance. I would like to thank all my laboratory members in doctor course and master course.
Finally, I would like to thank and gratitude my family to be patient and support me during
study time and I hope my father soul now proud with his daughter.

vii
TABLE OF CONTENTS
ABSTRACT ................................................................................................................................................... i
ACKNOWLEDGMENT .............................................................................................................................. vi
TABLE OF CONTENTS ............................................................................................................................ vii
LIST OF FIGURES ..................................................................................................................................... ix
LIST OF TABLES ....................................................................................................................................... xi
LIST OF ABBREVIATION ....................................................................................................................... xii
CHAPTER I: INTRODUCTION ................................................................................................................. 1
1.1 Background ......................................................................................................................................... 1
1.2 Dissertation objectives ........................................................................................................................ 2
1.3 Structure of dissertation ...................................................................................................................... 2
References of chapter I ............................................................................................................................. 4
CHAPTER II: LITERATURE REVIEW .................................................................................................... 6
2.1 Introduction ......................................................................................................................................... 6
2. 2 Dark fermentative bacteria ................................................................................................................. 7
2. 3 Mechanism of dark fermentation hydrogen production ..................................................................... 8
2.4 Dark fermentation challenges and advantages .................................................................................. 10
2.5 Biohydrogen substrates ..................................................................................................................... 10
2.6 Algae source for hydrogen production .............................................................................................. 11
2.7 Dark fermentation process important factors .............................................................................. 12
Hydrogen production pathway is affected by various parameters in the bioreactor. The major parameters include: Inoculum, pH, Temperature, hydraulic retention time, alkalinity, H2 and CO2
partial pressure and effect of micronutrients. .......................................................................................... 12
2.8 Effect of nutrients on the hydrogen production ................................................................................ 12
2.9 Effect of carbon and nitrogen on biohydrogen ................................................................................. 14
References of chapter II .......................................................................................................................... 15
CHAPTER III: Identification of factors that accelerate hydrogen production by Clostridium butyricumRAK25832 using casamino acids as a nitrogen source .............................................................................. 21
3.1 Introduction ....................................................................................................................................... 21
3.2 Material and methods ........................................................................................................................ 25
3.2.1 Bacteria isolation and medium preparation................................................................................ 25
3.2.2 Overall experimental design for medium optimization in dark fermentation ............................ 26

viii
3.2.3 Strain identification....................................................................................................................27
3.2.4 Analytical method ...................................................................................................................... 27
3.2.5 Kinetic modeling ........................................................................................................................ 28
3.3 Results and discussion ...................................................................................................................... 29
3.3.1 Isolation, screening, and identification ...................................................................................... 29
3.3.2 Characterization of strain RAK25832 ........................................................................................ 29
3.3.3 Effect of carbon source on hydrogen production and cell growth ............................................. 30
3.3.4 Effect of casamino acids concentration on hydrogen production and SMPs ............................. 32
3.3.5. Medium composition and optimization of target elements ....................................................... 35
3.3.6 Optimizing the target metal elements ........................................................................................ 37
3.3.7 Effect vitamin supplementation ................................................................................................. 43
3.3.8 Hydrogen fermentation characteristics under the optimum conditions and growth kinetics. .... 45
3.4 Conclusions ....................................................................................................................................... 47
References of chapter III ......................................................................................................................... 48
CHAPTER IV: Enhancement of hydrogen production by combining a blend ratio for two types of algal waste biomass and reducing casamino acids supplementation by Clostridium butyricum RAK25832...... 57
4.1 Introduction ....................................................................................................................................... 57
4.2 Material and methods ........................................................................................................................ 59
4.2.1 Microorganism ........................................................................................................................... 59
4.2.2 Algal feedstock .......................................................................................................................... 59
4.2.3 Biohydrogen production ............................................................................................................ 60
4.2.4 Analysis of chemical composition ............................................................................................. 61
4.3 Results and discussion ...................................................................................................................... 63
4.3.1 Determination of C. fusca and U. lactuca ratio for optimal HY ................................................ 63
4.3.2 Yield optimization with mineral supplementation ..................................................................... 67
4.3.3 Effect of combining CAAs with algal biomass on HY ................................................................ 70
4.4 Conclusion ........................................................................................................................................ 76
References of chapter IV ........................................................................................................................ 77
CHAPTER V: Conclusions ........................................................................................................................ 83
Supplementary materials ............................................................................................................................. 85

ix
LIST OF FIGURES Fig. 2. 1 Glycolysis hydrogen production though acetate (a) and butyrate (b) pathway ............................ 10
Fig. 2. 2 Substrate sources used for biohydrogen production ..................................................................... 11
Fig 3. 1 A simplified metabolic pathway for glucose breakdown and the various metabolites produced using dark fermentation in Clostridium. Each arrow indicates one or several reactions in series along the pathways. In addition, the amount of hydrogen produced by the [Fe-Fe]-hydrogenase during the fermentation of each metabolite is also shown. Adapted from Chin et al. (Chin et al., 2003). .................. 24
Fig 3. 2 Phylogenetic tree showing the relationships between Clostridium butyricum RAK25832 and related species based on the 16S rRNA gene. The scale bar represents 0.02 substitutions per nucleotide position. Bootstrap values are indicated at the nodes. Reference sequences in the dendrogram were obtained from NCBI (accession numbers are in parentheses). ................................................................... 30
Fig 3. 3 Cumulative hydrogen production by Clostridium butyricum RAK25832 at different casamino acids concentrations with 10 g/L glucose as the carbon source. ................................................................. 34
Fig 3. 4 Effect of different concentrations of casamino acids on volatile fatty acids produced by Clostridium butyricum RAK25832 and hydrogen yield. ............................................................................ 35
Fig 3. 5 Effect of different concentrations of (A) MgCl2·6H2O, (B) K2HPO4·3H2O, (C) NaHCO3, and (D) FeCl2·4H2O on the accumulated hydrogen, hydrogen production rate, and hydrogen yield by C. butyricumRAK25832. ................................................................................................................................................. 40
Fig 3. 6 Volatile fatty acids associated with different concentrations of (A) MgCl2·6H2O, (B) K2HPO4·3H2O, (C) NaHCO2, and (D) FeCl2·4H2O compared to the final pH and cell concentration (OD620). ....................................................................................................................................................... 41
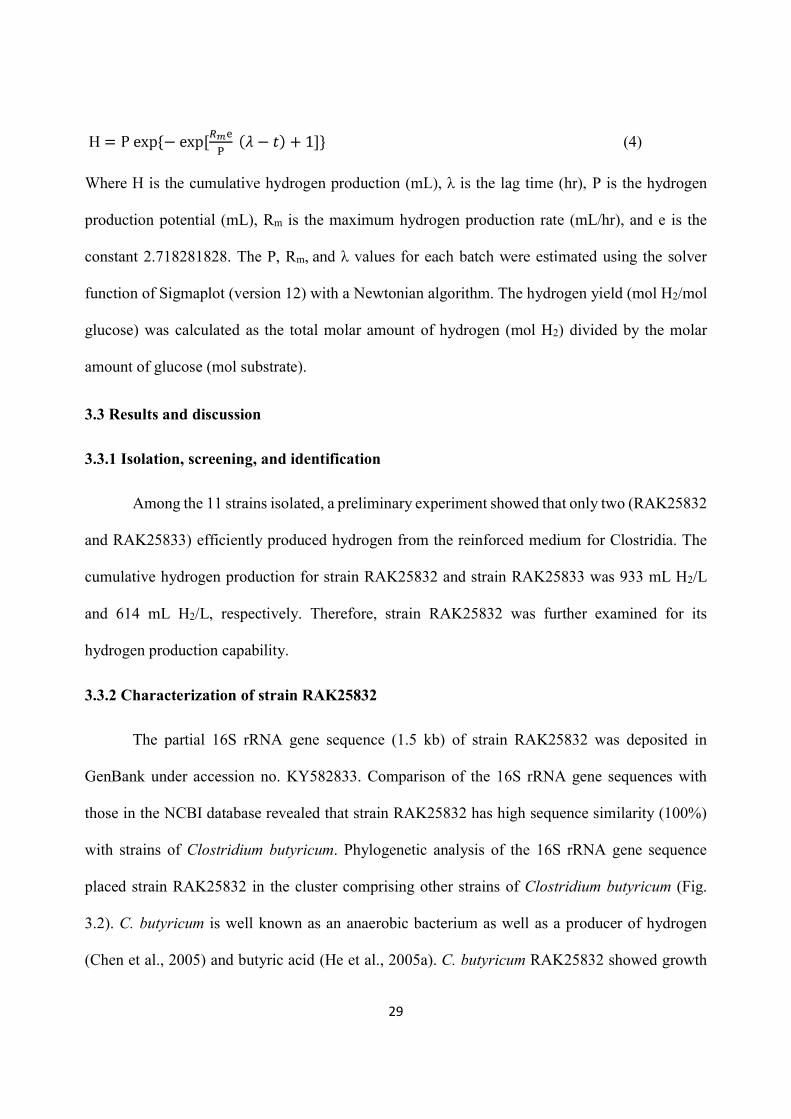
Fig 3. 7 Effect of vitamin supplementation on the cumulative hydrogen production, hydrogen production rate, and hydrogen yield by C. butyricum RAK25832................................................................................ 44
Fig 3. 8 Effect of vitamin supplementation on volatile fatty acids produced by C. butyricum RAK25832. .................................................................................................................................................................... 44
Fig 3. 9 Lineweaver-Burk plot for prediction of C. butyricum RAK25832 growth kinetic parameters at pH 8.0 and 30 C. .............................................................................................................................................. 47

x
Fig. 4. 1 Effect of different C. fusca and U. lactuca biomass blend ratios on HY by C. butyricumRAK25832 .................................................................................................................................................. 64
Fig. 4. 2 Effect of different concentrations of (A) FeCl2·4H2O, (B) NaHCO3, (C) MgCl2·6H2O, and (D) K2HPO4·3H2O with algal waste biomass ratio of C. fusca: U. lactuca (4:1) on the hydrogen yield and hydrogen production rate by C. butyricum RAK25832. ............................................................................. 69
Fig. 4. 3 Volatile fatty acids associated with different concentrations of (A) FeCl2·4H2O, (B) NaHCO3, (C) MgCl2·6H2O, and (D) K2HPO4·3H2O with algal waste biomass ratio of C. fusca: U. lactuca (4:1)compared to the final pH. ............................................................................................................................ 70
Fig. 4. 4 Effect of different concentrations of CAAs combined with C. fusca and U. lactuca biomass at a ratio of 4 : 1 on HY and hydrogen production rate by C. butyricum RAK25832 ....................................... 71
Fig. 4. 5 Volatile fatty acids associated with different casamino acids concentration combined with algal waste biomass ratio of C. fusca: U. lactuca (4:1) compared to the final pH .............................................. 72
Fig. 4. 6 Effect of different concentrations of CAAs combined with A) C. fusca and B) U. lactuca on HY and hydrogen production rate by C. butyricum RAK25832 ....................................................................... 74

xi
LIST OF TABLES Table 2. 1 Comparison of different fuel types with energy content and carbon dioxide emission ............... 7
Table 3. 1 Growth of Clostridium butyricum RAK25832 with different carbon sources. .......................... 31
Table 3. 2 Production of hydrogen by Clostridium butyricum RAK25832. ............................................... 32
Table 3. 3 Kinetics parameters of hydrogen production by Clostridium butyricum RAK25832 using casamino acids as the nitrogen source. ....................................................................................................... 33
Table 3. 4 Effects of eliminating different elements on hydrogen production by C. butyricum RAK25832. .................................................................................................................................................................... 39
Table 3. 5 Comparison for hydrogen yield of glucose fermentation by Clostridium butyricum ................ 46
Table 4. 1 Characteristics of macro -algal biomass (U. lactuca) and micro algae (C. fusca) ..................... 65
Table 4. 2 Kinetics parameters of hydrogen production by Clostridium butyricum RAK25832 using different ratio of waste biomass micro-algae (C. fusca) and macro-algal biomass (U. lactuca). ............... 66
Table 4. 3 Analysis of amino acid composition in C. fusca and U. lactuca ............................................... 75
Table S 1. Nutrient composition. ................................................................................................................ 85
Table S 2. Composition of the supplemented vitamins............................................................................... 85

xii
LIST OF ABBREVIATION
HPB Hydrogen-producing bacteria
PCR Polymerase chain reaction
SMP Soluble metabolite product
VFA Volatile fatty acids
FID Flame ionization detector
rRNA Ribosomal ribonucleic acid
NCBI National Center for Biotechnology Information
HAc Acetic acid
HPr Propionic acid
i-HBu Isobutyric acid
n-HBu N-butyric acid
EtOH Ethanol
OD620 Optical density at 620 nm
EDTA Ethylenediaminetetraacetate
VH,i Cumulative hydrogen gas volume at the current (i) time
VH,i-1 Cumulative hydrogen gas volume at the previous (i 1) time
VG,i Total biogas volume at the current time interval
VG,i-1 Total biogas volume at the previous time interval
CH,i Hydrogen gas fraction in the headspace at the current time interval
CH,i-1 Hydrogen gas fraction in the headspace at the previous time interval
H Cumulative hydrogen production (mL)
Lag time (hr)
P Hydrogen production potential (mL)

xiii
Rm Maximum hydrogen production rate (mL/hr)
e Constant, 2.718281828
Fd Ferredoxin
CAA Casamino Acids

1
CHAPTER I:
INTRODUCTION
1.1 Background
The variety consumption of fossil fuels like coal has resulted in serious environmental
pollution and energy crisis (John et al., 2011). Hydrogen is considered as a promising energy
source because of its clean combustion as the end product is water and high energy content around
122 kJ/g (Argun & Kargi, 2011). Biohydrogen production from biomass got a potential industrial
applications because of its environment-friendly, energy-saving, and carbon-neutral characteristics
which relatively lacking in many conventional hydrogen-producing processes, such as steam
reforming and water electrolysis (Cheng et al., 2012a).
Algae biomass is a potential source for biohydrogen production for its fast growth and global
distribution (Cheng et al., 2012b). Algae are primitive photosynthetic microorganisms and a
primary producers in any ecosystem. Photoautotrophic, meaning that they could utilize sunlight to
fix CO2 and convert them into organic compounds and biomass. Some are heterotrophic, requiring
organic carbon sources and can be cultivated without of light (Chen et al., 2011). Bacteria that
utilize carbon sources via an anaerobic pathway are known to produce hydrogen as a by-product
and this has been known for decades for biohydrogen production. Hydrogen bacteria utilize
protons as terminal electron acceptors releasing hydrogen, as the electrical neutrality of the cells
needs to be maintained for ATP generation (Lee et al., 2011). Biohydrogen production could be a
promising way of waste valorization and many industrial waste can be used as a substrate for dark
fermentation. Clostridium butyricum is well known as an anaerobic bacteria as well as hydrogen
producer (Zigová et al., 1999). Vitamins and metals seems to be essential factors for biohydrogen
bacteria. Although, a higher concentration of metals may inhibit the activity of hydrogen producer

2
bacteria, a trace level of metal is required for hydrogen production. As an example, Fe2+ is the
most investigated metal for biohydrogen production, which may be essential for hydrogenase
activity (Zhao et al., 2012). Thus, more investigations are needed to determine the effect of the
concentration of other metals on fermentative hydrogen production.
1.2 Dissertation objectives
The aim of this study to develop effective dark fermentation hydrogen process with low cost
by mesophilic bacteria Clostridium butyricum RAK25832, isolated from Wajiro beach Fukouka
using algal waste substrate. In order to accomplish the goal of the study, the study purpose divided
to direction:
The first is to reach a defined medium required for the microorganism Clostridium
butyricum RAK25832 as an optimal condition. Therefore, finding suitable carbon sources,
casamino acids as nitrogen source, the use of vitamins and metal important for hydrogen
production.
The second is the application by using algal substrate and fined effective production at low
cost by reach to the blend ratio to reduce the required supplementation of casamino acids
and minerals.
1.3 Structure of dissertation
The dissertation included six chapters and listed as follow:
Chapter I Introduction states the problem, aims of the research, and structure of the
dissertation.
Chapter II Literature review the chapter reviews the literature of the previous studies
and introduces the background knowledge of biohydrogen.

3
Chapter III Identification of factors that accelerate hydrogen production by Clostridium
butyricum RAK25832 using casamino acids as a nitrogen source. This chapter demonstrate
the important carbon source utilized by the microorganism, use the casamino acids as
nitrogen source, and reach to the important mineral element and vitamins for hydrogen
production.
Chapter IV Enhancement of hydrogen production by combining a blend ratio for two
types of algal waste biomass and reducing casamino acids supplementation by Clostridium
butyricum RAK25832. In this chapter according to chapter III, the importunate element of
hydrogen production optimized with algal waste substrate to reduce the use of casamino
acids as it is the most expensive elements required for hydrogen production.
Chapter V Conclusion summarize the finding and overall results of this study.

4
References of chapter I
Argun, H., Kargi, F. 2011. Bio-hydrogen production by different operational modes of dark and
photo-fermentation: an overview. International Journal of Hydrogen Energy, 36(13),
7443-7459.
Chen, C.-Y., Yeh, K.-L., Aisyah, R., Lee, D.-J., Chang, J.-S. 2011. Cultivation, photobioreactor
design and harvesting of microalgae for biodiesel production: a critical review.
Bioresource technology, 102(1), 71-81.
Cheng, J., Xia, A., Liu, Y., Lin, R., Zhou, J., Cen, K. 2012a. Combination of dark-and photo-
fermentation to improve hydrogen production from Arthrospira platensis wet biomass with
ammonium removal by zeolite. international journal of hydrogen energy, 37(18), 13330-
13337.
Cheng, J., Xia, A., Song, W., Su, H., Zhou, J., Cen, K. 2012b. Comparison between
heterofermentation and autofermentation in hydrogen production from Arthrospira
(Spirulina) platensis wet biomass. international journal of hydrogen energy, 37(8), 6536-
6544.
John, R.P., Anisha, G., Nampoothiri, K.M., Pandey, A. 2011. Micro and macroalgal biomass: a
renewable source for bioethanol. Bioresource technology, 102(1), 186-193.
Lee, D.-J., Show, K.-Y., Su, A. 2011. Dark fermentation on biohydrogen production: pure culture.
Bioresource technology, 102(18), 8393-8402.
Zhao, X., Xing, D., Liu, B., Lu, L., Zhao, J., Ren, N. 2012. The effects of metal ions and L-cysteine
on hydA gene expression and hydrogen production by Clostridium beijerinckii RZF-1108.
international journal of hydrogen energy, 37(18), 13711-13717.

5
Zigová,
butyricum with integrated extraction and pertraction. Process Biochemistry, 34(8), 835-
843.

6
CHAPTER II:
LITERATURE REVIEW
2.1 Introduction
After the disaster of Fukushima in March 2012. Around 19,000 people were killed and towns
were destroyed. This accident showed the risk of using nuclear energy. Before this disaster, 30%
of Japanese electricity produce by nuclear power. This disaster did not only left the Japanese
government thinking of renewable energy as alternatives, but it also warning to other nations to
find renewable greener alternatives and safer to replace the fossil fuels. Biohydrogen seems to be
one of the more promising alternatives to the fossil fuels. Icreasment of the human population and
climate change let the renewable energy technologies get the challenge as an alternate for fossil
fuel (Cohen, 2001). The renewable energy sources such as biomass, hydropower, wind, solar,
geothermal, marine, and hydrogen will play an important roles for the energy crisis. The
advantages of renewables are the availability, end use has no greenhouse gas emission, the cost is
economical, generate new employment opportunities.
Hydrogen energy considered as a clean and efficient renewable sources to replace fossil fuels.
Hydrogen produces only water as a by-product which is friendly to the environment and it has the
highest energy per unit mass (Table 2.2). During 2009 the annual worldwide hydrogen
consumption is about of 400 500 billion Nm3 (Demirbas, 2009). In addition for the environment
friendly advantage for the biohydrogen production processes it is inexhaustible (Benemann, 1997;
Miyake et al., 1990). Biohydrogen production has several advantages over fossil fuels as it is
produced naturally by microorganisms, no greenhouse emission, and the sustainability as it
produced from a variety of substrates include waste. Moreover, compared to other fuel,
biohydrogen conducts one of the highest energy per unit mass (Table 2.1). Biohydrogen

7
microorganisms include direct and indirect biophotolysis, photofermentative bacteria, and dark
fermentation by fermentative bacteria.
Table 2. 1 Comparison of different fuel types with energy content and carbon dioxide emission
Fuel Type Carbon (%)
Calorific value (J/kg)
Carbon Emission (kg C/kg
Fuel)Hydrogen 0 141.90 0.00
Ethanol 52 29.90 0.50
Biodiesel 77 37.00 0.50
Methanol 37.5 22.30 0.50
Natural gas 75 50.00 0.46
Gasoline 74 47.40 0.86
2. 2 Dark fermentative bacteria
Dark fermentative bacteria could use to different substrates and temperatures. These bacteria
metabolized energy by partial oxidation of organic materials using the organic intermediates as
electron donors and electron acceptors instead of oxygen using the NADH to produce metabolic
by-products, organic acids, and alcohols, including hydrogen. Family Clostridia are mesophilic
use the complex carbohydrates to produce hydrogen (Penfold et al., 2003; Hawkes et al., 2007 and;
Cheng et al., 2008).
Clostridia is Gram-positive found in sewage, soil . Species C.
butyricum and C. pasteurianum have the ability to fix the nitrogen (Chen et al., 2001). Clostridia
are used for the production of alcohols and it has high hydrogen production yield through a

8
reversible hydrogenase enzyme (Calusinska et al., 2010). Clostridia could produce hydrogen via
large number of carbohydrates, like xylose, arabinose, glucose, cellobiose, fructose, sucrose and
galactose as well as the waste (Suzuki & Karube, 1981; Taguchi et al., 1993). Clostridium sp.
produced efficiently hydrogen from xylose and arabinose than from glucose. However, other
isolate produced xylanase and converted xylan to hydrogen (Taguchi et al., 1994). The clostridia
end products sugars fermentation was butyric acid and acetic acid, carbon dioxide, and hydrogen,
along with small portion of ethanol (Ren et al., 2008).
2. 3 Mechanism of dark fermentation hydrogen production
Dark fermentation biohydrogen is produced by anaerobic bacteria under anaerobic
conditions (Nandi & Sengupta, 1998). Different organic substances could use as substrates, like
sugars, carbohydrates, lipids and proteins. The theoretical yields estimation of hydrogen
production from glucose towards acetate is used as reference. Thauer et al., 1977 mentioned that
the maximum theoretical biohydrogen yield from glucose fermentation is 4 mol H2/mol glucose
as in eq. (1):
C6H12O6 + 4H2 3COO- + 2HCO- 3+ 4H+ +4H2 Go = - 206.3 kJ mol-1 (1)
Also can be achieved through two steps by fermentation of glucose to acetate and formate as
following (Voordouw, 2002) eq. (2a and 2b)
C6H12O6 + 2H2 3COO- + 2HCOO- + 4H+ +2H2 Go = - 209.1 kJ mol-1 (2a)
2+2H2 Go = -6 kJ mol-1 (2b)
the maximum theoretical yield in the case of acetate- butyrate byproduct is 2mol H2 /mol of glucose
eq. (3) (Thauer et al., 1977):

9
C6H12O6 + 2H2 3CH2CH2COO- + 2HCO-3+ 3H+ +2H2 Go = - 254.8 kJ mol-1 (3)
Glucose metabolite to pyruvate eq. (4);
C6H12O6 + 2NAD+3COCOO- + 4H++ 2NADH Go = - 254.8 kJ mol-1 (4)
Depending on the enzymatic reactions the acetylCoA could generate either by eq. (5 or 6).
pyruvate + CoA + Fdox 2 + Fdred Go = -19.2 kJ mol-1 (5)
Go = -16.3 kJ mol-1 (6)
eq. (5) is reaction catalyzed by the pyruvate-Fdox oxidoreductase enzyme, where Fdox acts as
electron receiver (Uyeda & Rabinowitz, 1971; Buchanan, 1972).
When, acetate is the final byproduct, during glycolysis one mole of H2 will generate from
the reduction of one mole of NADH, to NAD+, leading to a yield 4 mol H2/mol glucose. When,
butyrate is the final byproduct, the total final hydrogen yield is 2 mol H2/mol glucose. Depending
on the type of microorganism produce of acetate and butyrate as byproducts a hydrogen yield of
2 and 4 could achieve like in clostridia such as C. butyricum (Daesch & Mortenson, 1968) and
Clostridium pasteurianum (Jungermann et al., 1973).

10
Fig. 2. 1 Glycolysis hydrogen production though acetate (a) and butyrate (b) pathway
2.4 Dark fermentation challenges and advantages
There are many challenges facing the dark fermentation for example the low yields and the
final product contains a mixture of CO2 and H2, which leads to additional separation cost. However,
dark fermentation have advantages by comparing to the other biological processes, it has the
highest yields. It could utilize a high variety of carbon source and can use waste as substrate and
not require light.
2.5 Biohydrogen substrates
A wide range of substrate could utilize for hydrogen production (Fig. 2.2). Dark fermentation
hydrogen production investigation was almost produced by 80% from pure sugars: mono, di, or
polysaccharides. However, for a cost effective production, renewable substrates should use (Show

11
et al., 2012). Biomass including plants, seaweed, and algae in additional to, the agricultural waste,
food waste, livestock and other industrial waste could be sources for biohydrogen substrates. In a
theoretical way, it could illustrate that any organic substrate have high concentration of fats,
carbohydrates and proteins could use as substrate for biohydrogen production (Kapdan & Kargi,
2006).
Fig. 2. 2 Substrate sources used for biohydrogen production
2.6 Algae source for hydrogen production
Algae is a primitive organisms for understanding the photosynthesis basics in higher plants.
Recently algae become a potential source of biofuels as it is rich in carbohydrates and lipids (Show
et al., 2017). Algae have very short cycles life, and compared to terrestrial plants it has high
biomass productivity (Brennan & Owende, 2010). Microalgae preferred for biofuels as they do not

12
required for pretreatments as they do not contain lignin (John et al., 2011). Microalgae contain
lipids, carbohydrates and proteins. in additional to, the residual biomass after extraction can be
used for anaerobic fermentation (Chen et al., 2015). Bio-refinery is the best choice to have cost
effective biofuels production. The cultivation conditions and nutritional stress lead to a
carbohydrate accumulation or lipid accumulation (Ho et al., 2013).
Seaweeds, are include brown, red, and green algae. macroalgae are the main resource for
agar, alginate, and carrageenan (Jensen, 1993; Tseng, 2001). The advantages of using seaweeds as
biomass source were: they not required land, and yields are higher than crop land (Klass, 1974).
Brown algae cell wall contain alginates, cellulose and protein (Kloareg et al., 1986). Hydrogen
production potential were investigated for various marine macro-algae, including Gelidium
amansii, Codium fragile, Gracilaria verrucosa, Porphyra tenera, Undaria pinnatifida,
Laminaria japonica, Ecklonia stolonifera Hizikia fusiforme results indicated that L. japonica, the
best substrate(Jung et al., 2011).
2.7 Dark fermentation process important factors
Hydrogen production pathway is affected by various parameters in the bioreactor. The
major parameters include: Inoculum, pH, Temperature, hydraulic retention time, alkalinity, H2 and
CO2 partial pressure and effect of micronutrients.
2.8 Effect of nutrients on the hydrogen production
During the biohydrogen fermentation the bacterial metabolism required essential nutrients
like zinc, magnesium, sodium and iron due to bacteria required these elements for
cofactor, dehydrogenases, and transport processes. Iron seems to be important element for
hydrogen production. As, it is catalyzed by hydrogenase enzyme, which contains either a [Fe-Fe]

13
hydrogenase or a [Ni-Fe] hydrogenase. Ferredoxin is work as a donor to let the enzyme receive
the electrons make the pyruvate oxidation. Media supplementation with iron enhances hydrogen
production.( ). Hydrogen production increased by equal molar ratio of nickel
and iron salts supplementation (Kim et al., 2010; Ferchichi et al., 2005; Wang & Wan, 2008).
Hydrogen production increased as the metabolic pathway changed from lactic acid to butyric acid
fermentation after FeSO4 supplementation (Lee et al., 2008). The strain E. cloacae IIT-BT
metabolic pathway changed to increased acetic acid (Khanna & Das, 2013). Hydrogen production
decreased by increasing Nikle concentration (Fan et al., 2008).
Magnesium is also, essential elements for microorganisms. It is required for membranes,
cell walls constituent, ribosomes, work as enzymes cofactor and work as an activator for
synthetases. Most of the glycolytic enzymes mostly, require magnesium as cofactor such as
phosphofructokinases, as hexokinase and enolases (Wang et al., 2007). The supplementation of
Mg, Fe, Na, and Zn have a significant effect for hydrogen production and magnesium was the most
significant. It produce 3.52 mol H2/mol consumed sucrose at 120 kg/m3 MgCl2 concentration (Lin
& Lay, 2005).
Industrial wastewaters may contain a significant concentrations of heavy metals and cause
difficulties for wastewater treatment process (Lester et al., 1983; Stronach et al., 1986; Fang &
Chan, 1997) . The toxicity of heavy meatless in wastewater for H2 production were carried on up
flow reactor using sucrose, it was found Cu was the most toxic and Pb was the least toxic (Li &
Fang, 2007).

14
2.9 Effect of carbon and nitrogen on biohydrogen
The C/N ratio is important to find the appropriate composition of the substrate for efficient
production. Anaerobic microorganisms need a 20 30:1 ratio of C to N. Mixing waste contain a
low carbon with high nitrogen will balance the C/N ratio required for optimal hydrogen production.
Inorganic nitrogen compounds such as nitrate, nitrite and ammonia inhibit hydrogen production
rate and activity (Lambert et al., 1979; Madamwar et al., 2000).

15
References of chapter II
Benemann, J. 1997. Feasibility analysis of photobiological hydrogen production. International
journal of hydrogen energy, 22(10), 979-987.
Brennan, L., Owende, P. 2010. Biofuels from microalgae a review of technologies for production,
processing, and extractions of biofuels and co-products. Renewable and sustainable energy
reviews, 14(2), 557-577.
Buchanan, B.B. 1972. 6 Ferredoxin-Linked Carboxylation Reactions. The enzymes, 6, 193-216.
Calusinska, M., Happe, T., Joris, B., Wilmotte, A. 2010. The surprising diversity of clostridial
hydrogenases: a comparative genomic perspective. Microbiology, 156(6), 1575-1588.
Chen, C.-Y., Liu, C.-H., Lo, Y.-C., Chang, J.-S. 2011. Perspectives on cultivation strategies and
photobioreactor designs for photo-fermentative hydrogen production. Bioresource
technology, 102(18), 8484-8492.
Chen, J., Toth, J., Kasap, M. 2001. Nitrogen-fixation genes and nitrogenase activity in Clostridium
acetobutylicum and Clostridium beijerinckii. Journal of industrial microbiology &
biotechnology, 27(5), 281-286.
Chen, W.-H., Lin, B.-J., Huang, M.-Y., Chang, J.-S. 2015. Thermochemical conversion of
microalgal biomass into biofuels: a review. Bioresource technology, 184, 314-327.
Cheng, C.-H., Hung, C.-H., Lee, K.-S., Liau, P.-Y., Liang, C.-M., Yang, L.-H., Lin, P.-J., Lin, C.-
Y. 2008. Microbial community structure of a starch-feeding fermentative hydrogen
production reactor operated under different incubation conditions. international journal of
hydrogen energy, 33(19), 5242-5249.
Cohen, J.E. 2001. World population in 2050: assessing the projections. Conference Series-Federal
Reserve Bank of Boston. Federal Reserve Bank of Boston; 1998. pp. 83-113.

16
Daesch, G., Mortenson, L.E. 1968. Sucrose catabolism in Clostridium pasteurianum and its
relation to N2 fixation. Journal of bacteriology, 96(2), 346-351.
Demirbas, A. 2009. Biohydrogen: for future engine fuel demands. Springer Science & Business
Media.
Fan, Y.-T., Xing, Y., Ma, H.-C., Pan, C.-M., Hou, H.-W. 2008. Enhanced cellulose-hydrogen
production from corn stalk by lesser panda manure. International Journal of Hydrogen
Energy, 33(21), 6058-6065.
Fang, H., Chan, O. 1997. Toxicity of electroplating metals on benzoate-degrading granules.
Environmental technology, 18(1), 93-99.
Ferchichi, M., Crabbe, E., Gil, G.-H., Hintz, W., Almadidy, A. 2005. Influence of initial pH on
hydrogen production from cheese whey. Journal of biotechnology, 120(4), 402-409.
Hawkes, F.R., Hussy, I., Kyazze, G., Dinsdale, R., Hawkes, D.L. 2007. Continuous dark
fermentative hydrogen production by mesophilic microflora: principles and progress.
International Journal of Hydrogen Energy, 32(2), 172-184.
Ho, S.-H., Huang, S.-W., Chen, C.-Y., Hasunuma, T., Kondo, A., Chang, J.-S. 2013. Bioethanol
production using carbohydrate-rich microalgae biomass as feedstock. Bioresource
technology, 135, 191-198.
Jensen, A. 1993. Present and future needs for algae and algal products. Hydrobiologia, 260(1), 15-
23.
John, R.P., Anisha, G., Nampoothiri, K.M., Pandey, A. 2011. Micro and macroalgal biomass: a
renewable source for bioethanol. Bioresource technology, 102(1), 186-193.

17
Jung, K.-W., Kim, D.-H., Shin, H.-S. 2011. Fermentative hydrogen production from Laminaria
japonica and optimization of thermal pretreatment conditions. Bioresource technology,
102(3), 2745-2750.
Jungermann, K., Thauer, R., Leimenstoll, G., Decker, K. 1973. Function of reduced pyridine
nucleotide-ferredoxin oxidoreductases in saccharolytic Clostridia. Biochimica et
Biophysica Acta (BBA)-Bioenergetics, 305(2), 268-280.
Kapdan, I.K., Kargi, F. 2006. Bio-hydrogen production from waste materials. Enzyme and
microbial technology, 38(5), 569-582.
Khanna, N., Das, D. 2013. Biohydrogen production by dark fermentation. Wiley Interdisciplinary
Reviews: Energy and Environment, 2(4), 401-421.
Kim, J.Y., Jo, B.H., Cha, H.J. 2010. Production of biohydrogen by recombinant expression of
[NiFe]-hydrogenase 1 in Escherichia coli. Microbial cell factories, 9(1), 54.
Klass, D.L. 1974. Perpetual methane economy: is it possible. CHEMTECH;(United States), 4.
Kloareg, B., Demarty, M., Mabeau, S. 1986. Polyanionic characteristics of purified sulphated
homofucans from brown algae. International Journal of Biological Macromolecules, 8(6),
380-386.
Lambert, G.R., Daday, A., Smith, G.D. 1979. Effects of ammonium ions, oxygen, carbon
monoxide, and acetylene on anaerobic and aerobic hydrogen formation by Anabaena
cylindrica B629. Applied and environmental microbiology, 38(3), 521-529.
Lee, K.-S., Hsu, Y.-F., Lo, Y.-C., Lin, P.-J., Lin, C.-Y., Chang, J.-S. 2008. Exploring optimal
environmental factors for fermentative hydrogen production from starch using mixed
anaerobic microflora. International Journal of Hydrogen Energy, 33(5), 1565-1572.

18
Lester, J., Sterritt, R., Kirk, P. 1983. Significance and behaviour of heavy metals in waste water
treatment processes II. Sludge treatment and disposal. Science of the total environment, 30,
45-83.
Li, C., Fang, H.H. 2007. Fermentative hydrogen production from wastewater and solid wastes by
mixed cultures. Critical Reviews in Environmental Science and Technology, 37(1), 1-39.
Lin, C., Lay, C. 2005. A nutrient formulation for fermentative hydrogen production using
anaerobic sewage sludge microflora. International Journal of Hydrogen Energy, 30(3),
285-292.
Madamwar, D., Garg, N., Shah, V. 2000. Cyanobacterial hydrogen production. World Journal of
Microbiology and Biotechnology, 16(8), 757-767.
Miyake, J., Veziroglu, T., Takashashi, P. 1990. Hydrogen energy progress VIII. Proceedings 8th
WHEC, Hawaii, Pergamon Press, New York, 755-764.
Nandi, R., Sengupta, S. 1998. Microbial production of hydrogen: an overview. Critical reviews in
microbiology, 24(1), 61-84.
Penfold, D., Forster, C., Macaskie, L. 2003. Increased hydrogen production by Escherichia coli
strain HD701 in comparison with the wild-type parent strain MC4100. Enzyme and
microbial technology, 33(2), 185-189.
Ren, N.-Q., Guo, W.-Q., Wang, X.-J., Xiang, W.-S., Liu, B.-F., Wang, X.-Z., Ding, J., Chen, Z.-
B. 2008. Effects of different pretreatment methods on fermentation types and dominant
bacteria for hydrogen production. International Journal of Hydrogen Energy, 33(16),
4318-4324.
Show, K., Lee, D., Tay, J., Lin, C., Chang, J. 2012. Biohydrogen production: current perspectives
and the way forward. International Journal of Hydrogen Energy, 37(20), 15616-15631.

19
Show, P.L., Tang, M.S., Nagarajan, D., Ling, T.C., Ooi, C.-W., Chang, J.-S. 2017. A Holistic
Approach to Managing Microalgae for Biofuel Applications. International journal of
molecular sciences, 18(1), 215.
Stronach, S.M., Rudd, T., Lester, J.N. 1986. The Microbiology of Anaerobic Digestion. in:
Anaerobic Digestion Processes in Industrial Wastewater Treatment, Springer, pp. 21-38.
Suzuki, S., Karube, I. 1981. Hydrogen production by immobilized whole cells of Clostridium
butyricum. Hydrogen energy progress. pp. 1463-1473.
Taguchi, F., Chang, J.D., Mizukami, N., Saito-Taki, T., Hasegawa, K., Morimoto, M. 1993.
Isolation of a hydrogen-producing bacterium, Clostridium beijerinckii strain AM21B, from
termites. Canadian journal of microbiology, 39(7), 726-730.
Taguchi, F., Mizukami, N., Hasegawa, K., Saito-Taki, T. 1994. Microbial conversion of arabinose
and xylose to hydrogen by a newly isolated Clostridium sp. No. 2. Canadian journal of
microbiology, 40(3), 228-233.
Thauer, R.K., Jungermann, K., Decker, K. 1977. Energy conservation in chemotrophic anaerobic
bacteria. Bacteriological reviews, 41(1), 100.
Tseng, C. 2001. Algal biotechnology industries and research activities in China. Journal of Applied
Phycology, 13(4), 375-380.
Uyeda, K., Rabinowitz, J.C. 1971. Pyruvate-ferredoxin oxidoreductase IV. Studies on the reaction
mechanism. Journal of Biological Chemistry, 246(10), 3120-3125.
Tachezy, J. 2001. Iron-induced changes
in pyruvate metabolism of Tritrichomonas foetus and involvement of iron in expression of
hydrogenosomal proteins. Microbiology, 147(1), 53-62.

20
Voordouw, G. 2002. Carbon monoxide cycling by Desulfovibrio vulgaris Hildenborough. Journal
of bacteriology, 184(21), 5903-5911.
Wang, J., Wan, W. 2008. Influence of Ni 2+ concentration on biohydrogen production.
Bioresource technology, 99(18), 8864-8868.
Wang, X.J., Ren, N.Q., Xiang, W.S., Guo, W.Q. 2007. Influence of gaseous end-products
inhibition and nutrient limitations on the growth and hydrogen production by hydrogen-
producing fermentative bacterial B49. International journal of hydrogen energy, 32(6),
748-754.
Yenigün, O., Kizilgün, F., Yilmazer, G. 1996. Inhibition effects of zinc and copper on volatile
fatty acid production during anaerobic digestion. Environmental Technology, 17(11),
1269-1274.

21
CHAPTER III:
Identification of factors that accelerate hydrogen production by Clostridium
butyricum RAK25832 using casamino acids as a nitrogen source
3.1 Introduction
Since fossil fuels are the main source of greenhouse gases, there is increasing global interest
for identifying feasible clean energy alternatives. One such alternative is hydrogen, as the final
combustion results in the formation of water with almost no other emissions. Hydrogen also has a
high calorific value of 242 kJ/mol. The conventional processes for hydrogen production such as
gasification, water electrolysis, water gas shift reaction, and steam methane reforming are efficient,
and contribute to most of the produced hydrogen worldwide ( ;
al., 2013). Nevertheless, these processes require a large energy input from fossil fuels. Therefore,
there has been recent attention paid to the possibility of biological hydrogen (biohydrogen)
production from renewable resources such as waste biomass, as a promising process that combines
energy recovery and waste minimization (Wang & Wan, 2009). Biohydrogen production has
already been investigated with various species of microorganisms (Benemann, 1996; Kumar &
Das, 2000) Fermentative hydrogen production has been shown to be a promising approach because
it has the advantages of independence on the availability of light, higher hydrogen production rates,
and a wide range of possible carbon sources such as low-cost wastes, organic compounds, and
cellulosic substrates (Lalaurette et al., 2009; Vardar Schara et al., 2008). The isolation and
identification of hydrogen-producing bacteria (HPB) with high yields and production rates are very
important for promoting the commercial biohydrogen production process in a sustainable manner.
Fermentative hydrogen production can be carried out through a wide range of microorganisms

22
(Wang & Wan, 2009), including species of Clostridium (Taguchi et al., 1995), Enterobacter
(Fabiano & Perego, 2002), and Bacillus (Kotay & Das, 2007).
Sewage sludge, food residue, manure, agricultural waste, and algae blooms are examples
of waste biomass substrates that can be utilized in fermentative hydrogen production (Lee et al.,
2010; Yang et al., 2011). The principal organic components used in fermentation are carbohydrates
and proteins. Carbohydrates, including starch and cellulose, are better organic substances that are
utilized for fermentative biohydrogen production than proteins (Dong et al., 2009). Carbohydrates
can be readily hydrolyzed for reducing sugars such as xylose and glucose, which are also easily
utilized by HPB for fermentative hydrogen production (Su et al., 2009).
Although several microbial strains have been shown as feasible candidates for biohydrogen
production, this always requires the use of a complex medium. Various nitrogen sources have been
investigated in biotechnological studies to optimize the growth and metabolite production rates of
microorganisms. Proteins are among the main components in waste biomass. For example, the
protein content was reported to reach up to 72% of the dry weight in Spirulina biomass (Dismukes
et al., 2008). The most widely studied organic sources for this purpose are peptone, yeast extract,
and casamino acids (Wang et al., 1971). Yeast extract was found to be the favored nitrogen source
for the growth of Clostridium butyricum W5 using glucose as the substrate (Wang et al., 2008).
The amino acids derived from proteins cannot easily be used by HPB to directly produce hydrogen
(Lay et al., 2003; Xia et al., 2013). The generally low yield of biohydrogen production has led
researchers to focus on seeking high-yielding hydrogen-producing microorganisms, target genes
for genetically modifying existing microorganisms, or fermentation process optimization (Gavala
et al., 2006; Minnan et al., 2005). Members of the class Clostridia have been confirmed as the main
HPB in many hydrogen-production processes (Chang et al., 2006; Jo et al., 2007). Urea and KNO3

23
appeared to not be favored nitrogen sources by Clostridia spp. (Wang et al., 2008). However, there
is little information available on the role of nitrogen source in the hydrogen production rate and
formation of associated by-products in hydrogen fermentation. Therefore, detailed investigations
for identifying suitable and new nitrogen sources, and to evaluate the optimal nitrogen
concentrations in the fermentation broth for hydrogen fermentation by certain bacteria are clearly
necessary.
Clostridium butyricum is well known as an anaerobic bacterium as well as hydrogen produce
(Zigová et al., 1999) and butyric acid producer (Zhang et al., 2009). Accordingly, several strains
of C. butyricum have long been used for microbial industrial applications, especially for butyric
acid production (He et al., 2005b; Wang & Jin, 2009; Zigová et al., 1999). Glucose is metabolized
to pyruvate via the Embden Meyerhof Parnas pathway and produces two moles of ATP and
NADH, respectively. The butyrate-producing Clostridia produce butyrate concomitantly with
acetate, H2, CO2, and trace lactate and other products (Zhang et al., 2009) (Fig. 3.1). A theoretical
investigation showed that the maximum yield of 4 mol H2/mol glucose can be produced when
acetic acid is the only volatile fatty acid (VFA), and a maximum yield of 2 mol H2/mol glucose
can be produced when butyric acid is the VFA product, using Eqs. (1) and (2) below (Das et al.,
2008) . However, a lower yield is usually obtained in practice as glucose is not only used for
biohydrogen production but also to support microbial growth.
C6H12O6 + 2H2 3COOH + 2CO2 + 4H2 G
C6H12O6 3CH2CH2COOH + 2CO2 + 2H2 G

24
Fig 3. 1 A simplified metabolic pathway for glucose breakdown and the various metabolites
produced using dark fermentation in Clostridium. Each arrow indicates one or several reactions in
series along the pathways. In addition, the amount of hydrogen produced by the [Fe-Fe]-
hydrogenase during the fermentation of each metabolite is also shown. Adapted from Chin et al.
(Chin et al., 2003).
Clostridium butyricum strain RAK25832 shows slight or no growth in media containing
inorganic nitrogen as the sole nitrogen source but grows well in the presence of an organic nitrogen
source such as yeast extract. However, the use of yeast extract as the nutrient source for bacterial
culture has the main disadvantage of unpredictability, as it may contain several types of nutrients,
vitamins, and amino acids such as glutamic acid, making it very difficult to define the media.
Bacteria digest and break down proteins into simple compounds, i.e., amino acids and peptides.
Casamino acids are mainly comprised of amino acids as they are derived from the acid hydrolysis
of casein. Therefore, casamino acids might be a suitable, simpler alternative source of amino acids
to yeast extract. Indeed, casamino acids are commonly used as a supplement in culture media or

25
as an enrichment broth on its own, providing a suitable source of nutrients for enhancing the
growth of certain bacteria (Lev, 1977; Lindsay & Murrell, 1983; Nolan, 1971).
In addition, vitamins and metal ions have been shown to be essential factors for
biohydrogen production. Although a higher concentration of metals ions may inhibit the activity
HPB, a trace level of metal ions is required for hydrogen production. Fe2+ is the most widely
investigated metal ion for fermentative hydrogen production, which may be related to the fact that
its presence is essential for hydrogenase activity (Dhar et al., 2012; Liu et al., 2009; Wang & Wan,
2008; Zhao et al., 2012). Thus, more investigations are needed to determine the effect of the
concentration of other metals on fermentative hydrogen production. In addition, few studies have
focused on identifying the vital ions and vitamins that play a role in increasing the cell
concentration and hydrogen production in dark fermentation using C. butyricum.
Accordingly, the aim of this chapter was to evaluate the possibility of using casamino acids
as a nitrogen source for biohydrogen production with the isolate C. butyricum RAK25832, and
determine the optimal concentration of casamino acids. In addition, we aimed to identify the main
components in the medium that would enhance hydrogen productivity in C. butyricum RAK25832
by first screening the ion medium composition and then optimizing the target components at
different concentrations. Finally, we determined the effect of vitamin supplementation in the
medium on hydrogen production and cell growth.
3.2 Material and methods
3.2.1 Bacteria isolation and medium preparation
The isolated bacteria were obtained from the Wajiro marine sediment in Fukouka, Japan,
at a low tide condition. The physical properties of the site are a temperature of 27 C and pH of 7.2.
The sediment was collected and enriched in reinforced Clostridia medium (Daigo, Nihon Seiyaku

26
391-01781) for general testing. After growth of the bacteria, the supernatants were placed in
anaerobic bottles, sealed with rubber and an aluminum cap, and flushed with nitrogen gas.
Different dilutions were prepared, streaked on petri dishes, and incubated under anaerobic
condition to obtain single colonies. Anaerobic culture was carried out in serum bottles flushed with
nitrogen. The composition of the enriched nutrient solutions used for biohydrogen production is
shown in Table S1 (Fangkum & Reungsang, 2011). Each medium with a different composition
was prepared as a separate stock solution. All chemicals were obtained from Wako Japan. The
initial inoculum was developed with a final optical density at 620 nm (OD620) of 0.1 in the final
exponential phase. The cell concentration was determined by measuring the absorbance at 620 nm
with a Hitachi U-1800 spectrophotometer (Pan et al., 2008). The volume of biogas was measured
by releasing the pressure in the serum bottle using wetted glass syringes ranging from 50 mL to
100 mL (Owen et al., 1979). The biogas volume was checked every 6 hr, and the compositions of
the liquid phase were determined at the end of the fermentation process for hydrogen production.
3.2.2 Overall experimental design for medium optimization in dark fermentation
The dark fermentation was performed in 75-mL bottles for batch tests with a working
volume of 30 mL. The initial inoculum was developed at a final OD620 of 0.1 at the late exponential
phase. For adjustment of the carbon source applied for this experiment, the effects of 10 g/L of
different sugars were examined during fermentation at a constant temperature of 30 C with an
initial pH of 8. To study the effect of the nitrogen source, the yeast extract in the medium was
replaced by casamino acids (392-00655; Wako Chemical Industries, Ltd.), which was tested at
concentrations of 3.33, 6.66, 13.33, 26.67, and 53.33 g/L. The optimal medium composition for
hydrogen production was determined by studying the effect of the elimination of single elements.

27
After setting the final element composition, the effect of vitamin supplementation (Table S2) on
hydrogen production was investigated.
3.2.3 Strain identification
Bacterial genomic DNA was extracted from the cell pellets by ISOIL Beating Kit for beads
(No. 319-06201; Nippon Gene Co., Ltd., Japan). The 16S rRNA gene was polymerase chain
reaction (PCR)-amplified using the universal consensus primers 16SF
- -ACGGGCGGTGTGTRC-
of 1.5 kb, as described by Nielsen et al. (Nielsen et al., 1999). The obtained product was subjected
to PCR using EmeraldAmp Max PCR Master Mix (2X Premix) (Takara, Japan) (Van Niel et al.,
2002). The amplification reaction consisted of an initial denaturing step at 95 C for 5 min,
followed by 30 cycles of denaturation at 95 C for 1 min, annealing at 54 C for 40 sec, extension
at 72 C for 1 min, and a final extension step at 72 C for 10 min. All PCR steps were performed in
an automatic thermal cycler (iCyclerTM, Bio-Rad, USA). The PCR products were then sequenced
and compared with sequences in the GenBank database through a BLAST similarity search.
Phylogenetic trees of C. butyricum RAK25832 as a biohydrogen-producing strain and its close
relatives were constructed based on the full 16S rRNA gene sequences. The tree was based on
Jukes-Cantor distance and constructed using a neighbor-joining method with 1000 bootstrap
resampling replicates using MEGA 6.06 to estimate the confidence of the tree topologies.
Escherichia coli was selected as an outgroup species for the tree.
3.2.4 Analytical method
Biogas volume was analyzed using gas chromatography (GC-8APT, Shimadzu, Japan)
with a thermal conductivity detector and a Porapak Q stainless-steel column packed with an

28
activated carbon 60/80 column (1.5 m × 3.0 mm internal diameter). Argon was used as the carrier
gas at a flow rate of 6.5 mL/min. The operation temperatures for the injector, column, and detector
were 50 C, 60 C, and 50 C, respectively. The concentrations of VFAs were detected using gas
chromatography with the same chromatographer as above along with a flame ionization detector
(FID) and an 8-foot glass column packed with 10% PEG-20M and 2% H3PO4 (80/100 mesh). The
temperatures of the injection port, FID detector, and oven were 250 C, 140 C, and 140 C,
respectively. Nitrogen was used as the carrier gas at a flow rate of 20 mL/min. The ethanol
concentration was determined by high-performance liquid chromatography (LC_10AD) equipped
with a Shim pack SPR-PB column (Shimadzu, Japan); the oven temperature was 80 C, and
deionized water was used as the mobile phase at a flow rate of 0.6 mL/min with a refraction index
detector.
3.2.5 Kinetic modeling
The amount of hydrogen gas produced was determined according to the measurement of vial
headspace gas composition and the total biogas volume at each time interval using the following
mass equation:
VH,i = VH,i-1+ CH,i(VG,i VG,i-1) + VH(CH,i CH,i-1) (3)
where VH,i and VH,i-1 are the cumulative hydrogen gas volumes at the current (i) and previous (i
1) time intervals, VG,i and VG,i-1 are the total biogas volumes at the current and previous time
intervals, CH,i and CH,i-1 are the hydrogen gas fractions in the headspace at the current and previous
time intervals, and VH is the total headspace volume of vials (Logan et al., 2002).
The cumulative volume of hydrogen produced in the batch experiments was determined
according to the modified Gompertz equation (Lay et al., 1997):
29
H (4)
P is the hydrogen
production potential (mL), Rm is the maximum hydrogen production rate (mL/hr), and e is the
constant 2.718281828. The P, Rm,
function of Sigmaplot (version 12) with a Newtonian algorithm. The hydrogen yield (mol H2/mol
glucose) was calculated as the total molar amount of hydrogen (mol H2) divided by the molar
amount of glucose (mol substrate).
3.3 Results and discussion
3.3.1 Isolation, screening, and identification
Among the 11 strains isolated, a preliminary experiment showed that only two (RAK25832
and RAK25833) efficiently produced hydrogen from the reinforced medium for Clostridia. The
cumulative hydrogen production for strain RAK25832 and strain RAK25833 was 933 mL H2/L
and 614 mL H2/L, respectively. Therefore, strain RAK25832 was further examined for its
hydrogen production capability.
3.3.2 Characterization of strain RAK25832
The partial 16S rRNA gene sequence (1.5 kb) of strain RAK25832 was deposited in
GenBank under accession no. KY582833. Comparison of the 16S rRNA gene sequences with
those in the NCBI database revealed that strain RAK25832 has high sequence similarity (100%)
with strains of Clostridium butyricum. Phylogenetic analysis of the 16S rRNA gene sequence
placed strain RAK25832 in the cluster comprising other strains of Clostridium butyricum (Fig.
3.2). C. butyricum is well known as an anaerobic bacterium as well as a producer of hydrogen
(Chen et al., 2005) and butyric acid (He et al., 2005a). C. butyricum RAK25832 showed growth

30
ability with various types of carbohydrates as the sole carbon and energy source under a mesophilic
condition (Table 3.1), which is a characteristic of Clostridia species (Yokoi et al., 1998).
Fig 3. 2 Phylogenetic tree showing the relationships between Clostridium butyricum RAK25832
and related species based on the 16S rRNA gene. The scale bar represents 0.02 substitutions per
nucleotide position. Bootstrap values are indicated at the nodes. Reference sequences in the
dendrogram were obtained from NCBI (accession numbers are in parentheses).
3.3.3 Effect of carbon source on hydrogen production and cell growth
Several carbon sources were tested at a fixed concentration of 10 g substrate/L, with a
casamino acids concentration of 1.67 g/L under a constant temperature 30 C. As shown in Table
3.1, C. butyricum RAK25832 could utilize various types of carbon sources, including
monosaccharides (glucose, galactose, and mannose), disaccharides (sucrose, trehalose, lactose,
and maltose), and polysaccharides (starch, inulin, and glycogen). The sugars inulin, arabinose, and

31
xylose are widely present in plants. Therefore, the present results indicate that this strain could
effectively utilize the hydrolysate of agricultural waste but not sugar alcohols such as inositol as a
carbon source. Rhamnose, maltose, xylan, cellulose, dextran, glycerol, melizitose, glycine,
mannitol, sorbitol, and xylitol could not be utilized by C. butyricum RAK25832.
Table 3. 1 Growth of Clostridium butyricum RAK25832 with different carbon sources.
Carbon source Results
Xylose + L-Arabinose + Glucose + Fructose + Galactose + Mannose + Rhamnose - Sucrose + Lactose + Maltose - Cellobiose + Trehalose + Raffinose + Xylan - Starch + Dextran (Dextrin) - Inulin + Pectin + Glycerol - Salicin + Hepatin ND Melizitose - Chitin ND Glycine - Mannitol - Sorbitol - Xylitol - Glycogen + Cellulose -
ND = not detected, +; could utilize, -; cannot utilize
The H2 yield (mol H2/mol substrate), produced hydrogen (mL/L), and concentrations of
soluble metabolite products (SMPs) as fermentation by-products during 96 hr of incubation when

32
using the carbon sources found to be most suitable for the growth of strain C. butyricum
RAK25832 (glucose, fructose, xylose, sucrose, and lactose) are shown in Table 3.2. The results
showed that the highest hydrogen yield was realized when lactose was the carbon source, followed
by xylose, glucose, fructose, and then sucrose. The main VFA identified was butyric acid, followed
by acetic acid; others were nominally present. The final pH decreased because of the SMPs. The
characteristics reported of different C. butyricum isolates vary to a certain extent, even for the same
strain, partly owing to variations among studies in culture conditions (Chong et al., 2009; Hu et
al., 2013; Yin & Wang, 2017). Based on these results, glucose was selected as the carbon source
for further analysis.
Table 3. 2 Production of hydrogen by Clostridium butyricum RAK25832.
Carbon source (g/L)
Hydrogen yield (mol H2/mol substrate)
Final pH
Cell concentration (OD620)
Kinetics parameters estimated by the modified Gompertz model
VFA (mg-COD/L) SMPs
p (mL)
Rm (mL/hr) (hr)
R2 HAc HPr i-HBu
n-HBu
EtOH
Glucose 0.91 4.77 1.60 1262 146 28 0.9899 160 11 0 451 50 Fructose 0.86 4.84 1.55 1182 149 16 0.9959 328 60 21 677 40 Xylose 1.06 4.88 1.39 1457 52 13 0.9920 168 0 0 643 10 Sucrose 0.82 4.78 2.26 1136 155 17 0.9960 166 0 0 508 15 Lactose 1.13 4.72 2.42 1559 89 28 0.9986 190 0 0 648 19
VFA, volatile fatty acids; SMPs, soluble metabolite products; HAc, acetic acid; HPr, propionic acid; i-HBu, isobutyric acid; n-HBu, N-butyric acid; EtOH, ethanol.
3.3.4 Effect of casamino acids concentration on hydrogen production and SMPs
The effect of replacing yeast extract with casamino acids was examined using 10 g/L
glucose as the carbon source. Fig. 3.3 shows the plots of cumulative hydrogen production fitted to
the modified Gompertz equation for various casamino acids concentrations ranging from 3.33 to
53.33 g/L. The results showed that the maximum hydrogen production was achieved with a

33
casamino acids concentration of 26.67 g/L. The kinetic parameters are shown in Table 3.3.
Casamino acids had a significant effect on hydrogen production, with a concentration-dependent
increase in cumulative hydrogen production until 26.7 g/L of casamino acids. Similarly, increasing
the casamino acids concentration resulted in an increase in cell density until reaching an OD620 of
9.89 (Table 3.3).
Table 3. 3 Kinetics parameters of hydrogen production by Clostridium butyricum RAK25832 using casamino acids as the nitrogen source.
Casamino acids concentration (g/L)
Final pH Cell concentration (OD620)
Kinetics parameters estimated by the modified Gompertz model
P (mL) Rm (mL/hr) (hr) R2
3.33 4.26 2.06 1311 161 28 0.9905 6.67 4.24 4.11 1576 147 23 0.9998 13.33 4.36 5.49 1473 116 16 0.9997 26.67 4.43 8.26 2505 160 4 0.9938 53.33 4.49 9.89 2233 129 5 0.9811

34
Fig 3. 3 Cumulative hydrogen production by Clostridium butyricum RAK25832 at different casamino acids concentrations with 10 g/L glucose as the carbon source.
The nitrogen source is well known to have a significant effect on hydrogen production.
Although many researchers have investigated the associations of different nitrogen sources,
including inorganic and organic sources, there is limited information on the optimal casamino
acids concentration as a nitrogen source for C. butyricum. Fig. 3.4 shows the effect of different
casamino acids concentrations on the VFAs produced by C. butyricum RAK25832 according to
fermentation time and hydrogen yield. The main VFA produced appeared to be N-butyric acid
flowed by acetic acid, confirming that C. butyricum RAK25832 is a producer of butyric acid. The
production of acetate and butyrate, as by-products of the dark fermentation process, as well as the
final pH decreased in all conditions due to the active formation of SMPs. The maximum hydrogen
yield was identified with a casamino acids concentration of 26.67 g/L at 1.81 mol H2/mol glucose.
Casamino acids have also been investigated as a potential protein substrate source.
Yokoyama et al. (Yokoyama et al., 2010) indicated that casamino acids could not be used in a cow

35
manure mixed culture as they were readily decomposed by the bacteria without production of
hydrogen. Other researchers reported that barely any hydrogen was produced from proteins and
lipids (Lay et al., 2003; Noike & Mizuno, 2000). Another study replaced yeast extract with
casamino acids plus proline and vitamins in the medium of C. saccharolyticus, resulting in similar
yields of hydrogen production with sucrose; however, the production rate was reduced by about
30% (Van Niel et al., 2002).
Fig 3. 4 Effect of different concentrations of casamino acids on volatile fatty acids produced by Clostridium butyricum RAK25832 and hydrogen yield.
3.3.5. Medium composition and optimization of target elements
Hydrogen production in dark fermentation requires essential micronutrients for bacterial
metabolism. Some trace metals such as Mg, Zn, Na, and Fe have important effects on H2
metabolism in bacterial growth since these elements are required as cofactors for the bacterial
enzymes, in transport processes, and as dehydrogenases (Wang & Wan, 2009) (Ismail et al., 2010;

36
Sinha & Pandey, 2011). In this study, all of the medium components (Table S1) were screened to
select the most important elements that could be optimized to accelerate or promote biohydrogen
production by C. butyricum RAK25832. Table 4 shows the effect of eliminating 18 metal elements,
including macro- and micro-elements, one by one with the addition of casamino acids (1.67 g/L)
and glucose (10 g/L) as the nitrogen and carbon source, respectively. The results indicated that for
all parameters, the deletions of MgCl2·6H2O, K2HPO4·3H2O, NaHCO3, and FeCl2·4H2O had
significant effects on the H2 production, hydrogen production rate, and lag time. In particular,
deletion of MgCl2·6H2O decreased the hydrogen production to 834 mL H2/L compared to the
control (1242 mL H2/L), representing a 33% decrease, although there were no effects on the
hydrogen production rate or lag time. Elimination of K2HPO4·3H2O resulted in 759 mL H2/L,
representing a 39% decrease compared to the control; the production rate decreased until 108
mL/hr and the lag time was delayed until 52 hr. Elimination of NaHCO3 resulted in a slight
decrease in hydrogen production but had an extreme effect on the lag, with the delay increasing
from 30 hr (control) to 71 hr, which was associated with a decrease in the production rate until 76
mL/hr. Elimination of FeCl2·4H2O had the most significant effect on hydrogen production at 469
mL H2/L, representing a 62% reduction, as well as a decrease in the production rate (41 mL/hr)
and an increase in the lag time (43 hr). Although other heavy metals such as Cr, Cu, and Zn have
been reported to influence different biological processes such as acidogenesis and methanogenesis
and other anaerobic processes (Hickey et al., 1989; Yenigün et al., 1996), in the present study, the
other metal elements, including macro-nutrients (NH4Cl, NaCl, and CaCl2·2H2O) and micro-
nutrients (H3Bo3, ZnCl2, CuCl2·2H2O, MnCl2·4H2O, (NH4)6Mo7O24·4H2O, AlCl3, CoCl2·6H2O,
NiCl2·6H2O, EDTA, HCl, and Na2SeO3·5H2O) did not have any effect on hydrogen production

37
in the dark fermentation process. The main VFAs were acetic acid and butyric acid in all cases,
indicating that eliminating single components did not affect the VFA composition.
3.3.6 Optimizing the target metal elements
The results described above demonstrated that MgCl2·6H2O, K2HPO4·3H2O, NaHCO3,
and FeCl2·4H2O are very important elements for hydrogen production. Therefore, further
experiments were conducted to optimize the concentrations of these four element
3.3.6.1 Optimizing the MgCl2·6H2O concentration
Seven concentrations of MgCl2·6H2O (0.1, 0.2, 0.4, 0.67, 1.33, 2.67, and 5.33 g/L) were
investigated as shown in Fig. 3.5A, along with a control experiment without MgCl2·6H2O, to
determine the optimal concentration for accelerating hydrogen production. Glucose (10 g/L) was
used as the carbon source and casamino acids (26.67 g/L) was used as the nitrogen source. There
was a slight increase in hydrogen production with increasing MgCl2·6H2O concentration. The H2
production was 2006 mL/L with 0.1 g/L and only increased to 2109 mL/L with 0.67 g/L of
MgCl2·6H2O (11 mg Mg2+); a further increase in the concentration had no effect on hydrogen
production. Therefore, it was concluded that 0.1 g/L was the optimal MgCl2·6H2O concentration
with a production rate of 223 mL/hr and a hydrogen yield of 1.45 mol H2/mol glucose. In addition,
no further concentration increase affected the lag time (16 hr). Fig. 6A shows that the final pH was
acidified because of the production of VFAs as the final fermentation products. Moreover, the cell
concentration was not increased by increasing the element concentration. It has been reported that
Mg has a significant effect on bacterial growth (Lin & Lay, 2005). The Mg2+ requirement for
microorganisms is mainly for the ribosomes, and it also plays a role as a cofactor of enzymes and
as one of the main constituents of the cell walls and membranes. Therefore, decreasing the Mg2+

38
concentration would reduce cell growth to ultimately affect hydrogen production (Wang et al.,
2007). Mg2+ was reported to enhance biogas production from organic wastes with an optimum
value of 45 mg for 300 L slurry, and pure magnesium metal is toxic for biomethanation (Mandal
& Mandal, 1998). Similarly, Sinha and Pandey (Sinha & Pandey, 2011) observed a maximum
yield (295 mL/g of glucose consumed) and maximum hydrogen productivity (65 mL/hr) at 500
mg/L MgSO4·7H2O, which then decreased with a further increase in the magnesium ion
concentration.

39
Table 3. 4 Effects of eliminating different elements on hydrogen production by C. butyricum RAK25832.
P, accumulative hydrogen (mL); R, hydrogen production rate; , lag time; VFA, volatile fatty acids; HAc, acetic acid, HPr, propionic acid, i-HBu, isobutyric acid; n-HBu, n-butyric acid; EtOH, ethanol.
Kinetic parameters estimated by the modified Gompertz model
Yield (moLH2/mol glucose)
VFA (mg·COD/L)
No.N
H4C
l
NaC
l
MgC
l 2·6H
2O
CaC
l 2·2H
2O
K2H
PO4·
3H2O
NaH
CO
3
FeC
l 2·4H
2O
H3B
o 3
ZnC
l 2
CuC
l 2·2H
2O
MnC
l 2·4H
2O
(NH
4)6M
o 7O
24·4
H2O
AlC
l 3
CoC
l 2·6H
2O
NiC
l 2·6H
2O
EDTA
HC
l Con
c.
Na 2
SeO
3·5H
2O
Con
trol
Cas
amin
o ac
ids
Glu
cose
p (mL)
Rm (mL/hr) (hr)
R2
HA
c
HPr
i-HB
u
n-H
bu
EtO
H
1 0 + + + + + + + + + + + + + + + + + + + + 1232 133 29 0.9959 0.89 470 0 0 1150 12 2 + 0 + + + + + + + + + + + + + + + + + + + 1247 118 28 0.9945 0.90 355 0 0 1200 10 3 + + 0 + + + + + + + + + + + + + + + + + + 834 108 28 0.9945 0.60 454 0 0 1100 12 4 + + + 0 + + + + + + + + + + + + + + + + 1186 136 29 0.9959 0.86 423 9 0 1113 15 5 + + + + 0 + + + + + + + + + + + + + + + + 759 110 52 0.9997 0.55 270 0 0 1120 16 6 + + + + + 0 + + + + + + + + + + + + + + + 1140 76 71 0.9827 0.83 366 0 0 980 14 7 + + + + + + 0 + + + + + + + + + + + + + + 469 41 43 0.9970 0.34 250 0 0 520 12 8 + + + + + + + 0 + + + + + + + + + + + + + 1225 179 30 0.9906 0.89 348 0 0 1202 13 9 + + + + + + + + 0 + + + + + + + + + + + + 1243 183 30 0.9929 0.90 444 0 0 1311 11 10 + + + + + + + + + 0 + + + + + + + + + + + 1228 182 30 0.9933 0.89 368 0 0 1250 15 11 + + + + + + + + + + 0 + + + + + + + + + + 1235 106 27 0.9947 0.89 394 0 0 1563 18 12 + + + + + + + + + + + 0 + + + + + + + + + 1245 142 29 0.9962 0.90 367 8 0 1114 20 13 + + + + + + + + + + + + 0 + + + + + + + + 1230 152 30 0.9895 0.89 356 0 0 1152 12 14 + + + + + + + + + + + + + 0 + + + + + + + 1265 94 26 0.9977 0.92 432 0 0 1131 13 15 + + + + + + + + + + + + + + 0 + + + + + + 1254 106 26 0.9968 0.91 458 0 0 1220 10 16 + + + + + + + + + + + + + + + 0 + + + + + 1273 136 28 0.9959 0.92 461 0 0 1168 9 17 + + + + + + + + + + + + + + + + 0 + + + + 1283 102 26 0.9968 0.93 448 0 0 1198 818 + + + + + + + + + + + + + + + + + 0 + + + 1250 110 26 0.9950 0.90 389 0 0 1106 1219 + + + + + + + + + + + + + + + + + + + + + 1242 209 30 0.9933 0.90 430 0 0 1123 1320 + + + + + + + + + + + + + + + + + + + 0 + 0 0 0 0 0 0 0 0 0 021 + + + + + + + + + + + + + + + + + + + + 0 0 0 0 0 0 0 0 0 0 0

40
Fig 3. 5 Effect of different concentrations of (A) MgCl2·6H2O, (B) K2HPO4·3H2O, (C) NaHCO3,
and (D) FeCl2·4H2O on the accumulated hydrogen, hydrogen production rate, and hydrogen
yield by C. butyricum RAK25832.

41
Fig 3. 6 Volatile fatty acids associated with different concentrations of (A) MgCl2·6H2O, (B)
K2HPO4·3H2O, (C) NaHCO2, and (D) FeCl2·4H2O compared to the final pH and cell
concentration (OD620).
3.3.6.2 Optimizing the concentration of K2HPO4·3H2O
Nine concentrations of K2HPO4·3H2O (0.2 53.33 g/L) were evaluated, along with a
control experiment without K2HPO4·3H2O. As shown in Fig. 3.5B, increasing the K2HPO4·3H2O
concentration increased hydrogen production until the concentration of 6.67 g/L, showing H2
production of 2244 mL/L, a production rate of 254 mL/hr, and a yield of 1.62 mol H2/mol glucose.
However, the K2HPO4·3H2O concentration did not have any effect on the lag time (16 hr). Further
increasing the concentration decreased the production to such an extent that it ceased completely
at 53.33 g/L K2HPO4·3H2O, indicating a toxic effect above 6.67 g/L. The K2HPO4·3H2O
concentration had a significant effect on the cell concentration with a proportional increase with

42
concentration until 6.67 g/L, and then a decrease in cell concentration at higher concentrations.
The VFAs increased along with the increase in cell concentration (Fig. 3.6B).
3.3.6.3 Optimizing the NaHCO3 concentration
The effects of NaHCO3 concentration were evaluated in the range of 0 to 20.8 g/L. The
results indicated that elimination of NaHCO3 had a significant effect on lag time, which increased
to 72 hr (Fig. 3.5C). Hydrogen production, hydrogen production rate, and hydrogen yield were all
increased until 2.6 g/L NaHCO3, at 1945 mL/L, 168 mL/hr, and 1.41 mol H2/mol glucose,
respectively. Further increase in the concentration led to a decrease in production. The NaHCO3
concentration also had a significant effect on the cell concentration (Fig. 3.6C). Previous studies
have used NaHCO3 as a buffer in the feeding medium to neutralize the acidic products (Ai et al.,
2014; Lee et al., 2004); however, NaHCO3 has also been shown to increase the cell concentration
but not hydrogen production (Chookaew et al., 2015; Xu et al., 2008). He et al., (He et al., 2004)
found that 0.124% NaHCO3 (w/v) was the optimum concentration under their experimental
conditions with C. butyricum.
3.3.6.4 Optimizing the FeCl2·4H2O concentration
The effect of the FeCl2·4H2O concentration was studied in the range of 0 to 0.267 g/L. The
results indicated that elimination of FeCl2·4H2O had a significant effect on hydrogen production.
The hydrogen production, production rate, and yield at 0.002 g/L FeCl2·4H2O was 2202 mL/L,
189 mL/hr, and 1.59 mol H2/mol glucose, respectively, with no effect at higher concentrations.
The cell concentration and VFA were not affected by an increase in the FeCl2·4H2O concentration
(Fig. 3.6D). Iron is an important nutrient for the formation of hydrogenase and other enzymes.
Iron-sulfur affects protein functions primarily as an electron carrier, and is involved in pyruvate

43
oxidation to acetyl-CoA, CO2, and H2. Iron could also induce metabolic alterations and is involved
in FeeS and non-FeeS protein functions in hydrogenase (Lee et al., 2001). A previous study
(Alshiyab et al., 2008) in Clostridium showed that the H2 yield was enhanced from 391 to 408
mL/g of glucose utilized by the addition of 25 mg/L of FeSO4·7H2O, but a further increase in the
concentration had a negative effect. In addition, the biomass increased as the iron concentration
increased, and reached the maximum at 1000 mg/L of FeSO4·7H2O. This result was substantiated
in the present study given the increased percentage of glucose consumption observed at higher
FeSO4·7H2O concentration.
3.3.7 Effect vitamin supplementation
Several vitamins (Table S2) were added to the medium as supplemental nutrients to
determine their effect on hydrogen production. As shown in Fig. 3.7, none of the vitamins utilized
by C. butyricum RAK25832 had a significant effect on hydrogen production or on the cell
concentration. In addition, there was no effect of vitamin supplementation on VFAs (Fig. 3.8).
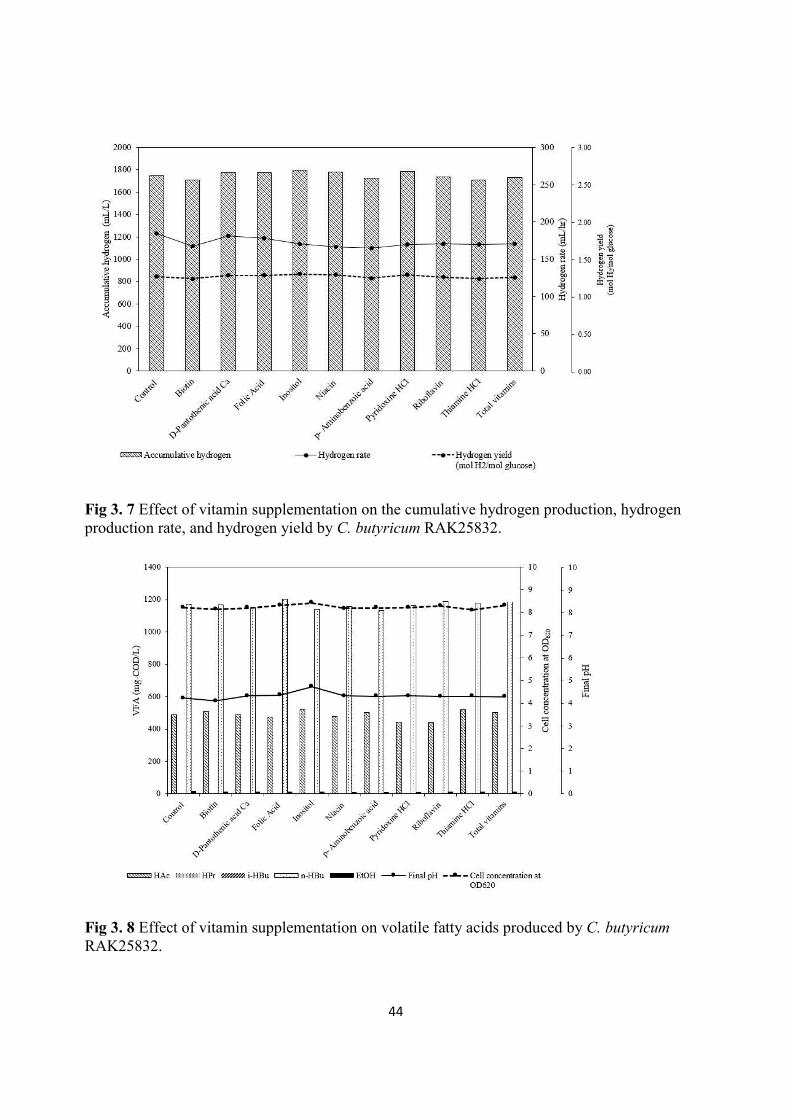
44
Fig 3. 7 Effect of vitamin supplementation on the cumulative hydrogen production, hydrogen production rate, and hydrogen yield by C. butyricum RAK25832.
Fig 3. 8 Effect of vitamin supplementation on volatile fatty acids produced by C. butyricumRAK25832.

45
3.3.8 Hydrogen fermentation characteristics under the optimum conditions and growth
kinetics.
Hydrogen production was investigated under the optimum conditions of glucose (10 g/L),
casamino acids (26.67 g/L), MgCl2·6H2O (0.1 g/L), K2HPO4·3H2O (6.67 g/L), NaHCO3 (2.6 g/L),
and FeCl2·4H2O (0.002 g/L). Maximum hydrogen production was achieved (3074 mL/L) at a cell
concentration of OD620 = 13.1 with a lag time of 4.5 hr and Rm of 183 ml/hr (R2 = 0.9955), and
the hydrogen yield reached the maximum with 2.23 mol H2/mol glucose. The decrease in pH from
8 to 4.5 was attributed to the accumulation of acetic acid (550 mg-COD/L) and butyric acid (1102
mg-COD/L), followed by trace amounts of ethanol (52 mg-COD/L). The high acetic and butyric
acid concentrations showed that the fermentation process of glucose by strain RAK25832 was of
the acetate butyrate type, which is considered to be the main fermentation type of Clostridium
species (Zhang et al., 2009).
Table 3.5 shows a comparison of the maximum hydrogen yield of strain RAK25832 to that
of other strains reported in the literature. Most previous studies carried out experiments at 37 C,
although strain RAK25832 produced a good yield at 30 C. However, the pH ranged from 5.6 to
8. Strain RAK25832 had a similar hydrogen yield to that of Clostridium butyricum EB6 (2.2 mol
H2/mol glucose) (Chong et al., 2009).

46
Table 3. 5 Comparison for hydrogen yield of glucose fermentation by Clostridium butyricum
Microorganism Substrate pH Temperature ( C)
H2 yield
mol H2/ mol glucose
Reference
Clostridium butyricum A1 Glucose (10 g/L) 6.5 37 1.9 (Jenol et al., 2013)
Clostridium butyricum TM-9A
Glucose (10 g/L) 8 37 2.67 3.1 (Junghare et al., 2012)
Clostridium butyricum EB6 Glucose (15.7 g/L)
5.6 37 2.2 (Chong et al., 2009)
Clostridium butyricum IAM 19002
Glucose (9 g/L) 7 37 1.04 (Junghare et al., 2012)
Clostridium butyricum IFO 3847
Glucose (9 g/L) 7 37 1.26 (Karube et al., 1976)
Clostridium butyricum Glucose (3 g/L) 6.5 37 2.09 (Seppälä et al., 2011)
Clostridium butyricum DSM 10702
Glucose (10 g/L) 6.8 37 2.4 3.1 (Hu et al., 2013)
Clostridium. butyricumRAK25832
Glucose (10g/L) 8 30 2.23 This study
The cell growth and substrate consumption kinetics during the growth of the strain in batch-
fermentative hydrogen production were investigated using the Monod model. Lineweaver-Burk
plots (Fig. 3.9) fitted the experimental results fairly well with an R2 value of 0.9741. The estimated
µmax and Ks values when glucose was used as the substrate were 0.35 h-1 and 9.27 g/L, respectively.
Based on the final fermentative products from glucose degradation were mainly butyric acids and
acetic acids, at the optimum conditions a mol glucose converted to acetate direction by 24% and
to butyrate direction by 76%.

47
Fig 3. 9 Lineweaver-Burk plot for prediction of C. butyricum RAK25832 growth kinetic parameters at pH 8.0 and 30 C.
3.4 Conclusions
We here provide the first demonstration of the applicability of casamino acids as a nitrogen
source for biohydrogen production using C. butyricum RAK25832. The most important elements
found to be essential for growth and hydrogen production were MgCl2, K2HPO4, NaHCO3, and
FeCl2. Under the optimum conditions, the yield increased to 2.23 mol H2/ mol glucose and the
cumulative hydrogen production was 3,073 ml H2/L. In future work, it will be important to
determine the amino acids that will best promote hydrogen production in C. butyricum. Further
optimization of these conditions could help to achieve sustainable biohydrogen production with a
good yield as an alternative to fossil fuels.

48
References of chapter III
Ai, B., Li, J., Chi, X., Meng, J., Jha, A.K., Liu, C., Shi, E. 2014. Effect of pH and buffer on butyric
acid production and microbial community characteristics in bioconversion of rice straw
with undefined mixed culture. Biotechnology and bioprocess engineering, 19(4), 676-686.
Alshiyab, H., Kalil, M.S., Hamid, A.A., Yusoff, W.M.W. 2008. Trace metal effect on hydrogen
production using C. acetobutylicum. OnLine Journal of Biological Sciences, 8(1), 1-9.
Benemann, J. 1996. Hydrogen biotechnology: progress and prospects. Nature biotechnology,
14(9), 1101-1103.
Chang, J.-J., Chen, W.-E., Shih, S.-Y., Yu, S.-J., Lay, J.-J., Wen, F.-S., Huang, C.-C. 2006.
Molecular detection of the clostridia in an anaerobic biohydrogen fermentation system by
hydrogenase mRNA-targeted reverse transcription-PCR. Applied microbiology and
biotechnology, 70(5), 598-604.
Chen, W.-M., Tseng, Z.-J., Lee, K.-S., Chang, J.-S. 2005. Fermentative hydrogen production with
Clostridium butyricum CGS5 isolated from anaerobic sewage sludge. International
Journal of Hydrogen Energy, 30(10), 1063-1070.
Chin, H.L., Chen, Z.S., Chou, C.P. 2003. Fedbatch operation using Clostridium acetobutylicum
suspension culture as biocatalyst for enhancing hydrogen production. Biotechnology
progress, 19(2), 383-388.
Chong, M.-L., Yee, P.L., Aziz, S.A., Rahim, R.A., Shirai, Y., Hassan, M.A. 2009. Effects of pH,
glucose and iron sulfate concentration on the yield of biohydrogen by Clostridium
butyricum EB6. International journal of hydrogen energy, 34(21), 8859-8865.

49
Chookaew, T., Sompong, O., Prasertsan, P. 2015. Biohydrogen production from crude glycerol by
two stage of dark and photo fermentation. International Journal of Hydrogen Energy,
40(24), 7433-7438.
production processes. Chemical Industry and Chemical Engineering Quarterly, 14(2), 57-
67.
Dhar, B.R., Elbeshbishy, E., Nakhla, G. 2012. Influence of iron on sulfide inhibition in dark
biohydrogen fermentation. Bioresource technology, 126, 123-130.
Dismukes, G.C., Carrieri, D., Bennette, N., Ananyev, G.M., Posewitz, M.C. 2008. Aquatic
phototrophs: efficient alternatives to land-based crops for biofuels. Current opinion in
biotechnology, 19(3), 235-240.
Dong, L., Zhenhong, Y., Yongming, S., Xiaoying, K., Yu, Z. 2009. Hydrogen production
characteristics of the organic fraction of municipal solid wastes by anaerobic mixed culture
fermentation. International Journal of Hydrogen Energy, 34(2), 812-820.
Fabiano, B., Perego, P. 2002. Thermodynamic study and optimization of hydrogen production by
Enterobacter aerogenes. International Journal of Hydrogen Energy, 27(2), 149-156.
Fangkum, A., Reungsang, A. 2011. Biohydrogen production from mixed xylose/arabinose at
thermophilic temperature by anaerobic mixed cultures in elephant dung. International
Journal of Hydrogen Energy, 36(21), 13928-13938.
Gavala, H.N., Skiadas, I.V., Ahring, B.K. 2006. Biological hydrogen production in suspended and
attached growth anaerobic reactor systems. International Journal of Hydrogen Energy,
31(9), 1164-1175.

50
He, G.-q., Kong, Q., Chen, Q.-h., Ruan, H. 2005a. Batch and fed-batch production of butyric acid
by Clostridium butyricum ZJUCB. Journal of Zhejiang University(Science B), 6(11),
1076-1080.
He, G.-q., Kong, Q., Chen, Q.-h., Ruan, H. 2005b. Batch and fed-batch production of butyric acid
by Clostridium butyricum ZJUCB. Journal of Zhejiang University. Science. B, 6(11), 1076.
He, G., Kong, Q., Ding, L. 2004. Response surface methodology for optimizing the fermentation
medium of Clostridium butyricum. Letters in applied microbiology, 39(4), 363-368.
Hickey, R.F., Vanderwielen, J., Switzenbaum, M.S. 1989. The effect of heavy metals on methane
production and hydrogen and carbon monoxide levels during batch anaerobic sludge
digestion. Water Research, 23(2), 207-218.
Hu, C.C., Giannis, A., Chen, C.-L., Qi, W., Wang, J.-Y. 2013. Comparative study of biohydrogen
production by four dark fermentative bacteria. international journal of hydrogen energy,
38(35), 15686-15692.
Ismail, I., Hassan, M.A., Rahman, N.A.A., Soon, C.S. 2010. Thermophilic biohydrogen
production from palm oil mill effluent (POME) using suspended mixed culture. biomass
and bioenergy, 34(1), 42-47.
Jenol, M.A., Ibrahim, M.F., Yee, P.L., Salleh, M.M., Abd-Aziz, S. 2013. Sago biomass as a
sustainable source for biohydrogen production by Clostridium butyricum A1.
BioResources, 9(1), 1007-1026.
Jo, J.H., Jeon, C.O., Lee, D.S., Park, J.M. 2007. Process stability and microbial community
structure in anaerobic hydrogen-producing microflora from food waste containing kimchi.
Journal of biotechnology, 131(3), 300-308.

51
Junghare, M., Subudhi, S., Lal, B. 2012. Improvement of hydrogen production under decreased
partial pressure by newly isolated alkaline tolerant anaerobe, Clostridium butyricum TM-
9A: Optimization of process parameters. international journal of hydrogen energy, 37(4),
3160-3168.
Karube, I., Matsunaga, T., Tsuru, S., Suzuki, S. 1976. Continous hydrogen production by
immobilized whole cells of Clostridium butyricum. Biochimica et Biophysica Acta (BBA)-
General Subjects, 444(2), 338-343.
Kotay, S.M., Das, D. 2007. Microbial hydrogen production with Bacillus coagulans IIT-BT S1
isolated from anaerobic sewage sludge. Bioresource technology, 98(6), 1183-1190.
Kumar, N., Das, D. 2000. Enhancement of hydrogen production by Enterobacter cloacae IIT-BT
08. Process Biochemistry, 35(6), 589-593.
Lalaurette, E., Thammannagowda, S., Mohagheghi, A., Maness, P.-C., Logan, B.E. 2009.
Hydrogen production from cellulose in a two-stage process combining fermentation and
electrohydrogenesis. international journal of hydrogen energy, 34(15), 6201-6210.
Lay, J.-J., Fan, K.-S., Ku, C.-H. 2003. Influence of chemical nature of organic wastes on their
conversion to hydrogen by heat-shock digested sludge. International Journal of Hydrogen
Energy, 28(12), 1361-1367.
Lay, J.-J., Li, Y.-Y., Noike, T. 1997. Influences of pH and moisture content on the methane
production in high-solids sludge digestion. Water Research, 31(6), 1518-1524.
Lee, D.-Y., Ebie, Y., Xu, K.-Q., Li, Y.-Y., Inamori, Y. 2010. Continuous H 2 and CH 4 production
from high-solid food waste in the two-stage thermophilic fermentation process with the
recirculation of digester sludge. Bioresource technology, 101(1), S42-S47.

52
Lee, K.S., Wu, J.F., Lo, Y.S., Lo, Y.C., Lin, P.J., Chang, J.S. 2004. Anaerobic hydrogen
production with an efficient carrier induced granular sludge bed bioreactor. Biotechnology
and Bioengineering, 87(5), 648-657.
Lee, Y.J., Miyahara, T., Noike, T. 2001. Effect of iron concentration on hydrogen fermentation.
Bioresource Technology, 80(3), 227-231.
Lev, M. 1977. Casamino acids enhance growth of Bacteroides melaninogenicus. Journal of
bacteriology, 129(1), 562-563.
Lin, C., Lay, C. 2005. A nutrient formulation for fermentative hydrogen production using
anaerobic sewage sludge microflora. International Journal of Hydrogen Energy, 30(3),
285-292.
Lindsay, J., Murrell, W. 1983. A comparison of UV induced DNA photoproducts from isolated
and non-isolated developing bacterial forespores. Biochemical and biophysical research
communications, 113(2), 618-625.
Liu, B.-F., Ren, N.-Q., Ding, J., Xie, G.-J., Guo, W.-Q. 2009. The effect of Ni 2+, Fe 2+ and Mg
2+ concentration on photo-hydrogen production by Rhodopseudomonas faecalis RLD-53.
international journal of hydrogen energy, 34(2), 721-726.
Logan, B.E., Oh, S.-E., Kim, I.S., Van Ginkel, S. 2002. Biological hydrogen production measured
in batch anaerobic respirometers. ENVIRONMENTAL SCIENCE AND TECHNOLOGY-
WASHINGTON DC-, 36(11), 2530-2535.
Mandal, T., Mandal, N. 1998. Biomethanation of some waste materials with pure metallic
magnesium catalyst: improved biogas yields. Energy conversion and management, 39(11),
1177-1179.

53
Minnan, L., Jinli, H., Xiaobin, W., Huijuan, X., Jinzao, C., Chuannan, L., Fengzhang, Z., Liangshu,
X. 2005. Isolation and characterization of a high H2-producing strain Klebsiella oxytoca
HP1 from a hot spring. Research in microbiology, 156(1), 76-81.
Nielsen, A.T., Liu, W.-T., Filipe, C., Grady, L., Molin, S., Stahl, D.A. 1999. Identification of a
novel group of bacteria in sludge from a deteriorated biological phosphorus removal
reactor. Applied and environmental microbiology, 65(3), 1251-1258.
Noike, T., Mizuno, O. 2000. Hydrogen fermentation of organic municipal wastes. Water Science
and Technology, 42(12), 155-162.
Nolan, R.A. 1971. Amino acids and growth factors in vitamin-free casamino acids. Mycologia,
63(6), 1231-1234.
catalyst with combined thermally annealed platinum and alumina coatings for steam
methane reforming. international journal of hydrogen energy, 38(3), 1419-1429.
-based pellet-type
and Pt/Ni/Al2O3 structured plate-type catalyst: intrinsic kinetics study. Industrial &
Engineering Chemistry Research, 52(38), 13597-13606.
Owen, W., Stuckey, D., Healy, J., Young, L., McCarty, P. 1979. Bioassay for monitoring
biochemical methane potential and anaerobic toxicity. Water research, 13(6), 485-492.
Pan, X., Wu, T., Zhang, L., Song, Z., Tang, H., Zhao, Z. 2008. In vitro evaluation on adherence
and antimicrobial properties of a candidate probiotic Clostridium butyricum CB2 for
farmed fish. Journal of applied microbiology, 105(5), 1623-1629.

54
Seppälä, J.J., Puhakka, J.A., Yli-Harja, O., Karp, M.T., Santala, V. 2011. Fermentative hydrogen
production by Clostridium butyricum and Escherichia coli in pure and cocultures.
international journal of hydrogen energy, 36(17), 10701-10708.
Sinha, P., Pandey, A. 2011. An evaluative report and challenges for fermentative biohydrogen
production. International Journal of Hydrogen Energy, 36(13), 7460-7478.
Su, H., Cheng, J., Zhou, J., Song, W., Cen, K. 2009. Combination of dark-and photo-fermentation
to enhance hydrogen production and energy conversion efficiency. International Journal
of Hydrogen Energy, 34(21), 8846-8853.
Taguchi, F., Mizukami, N., Saito-Taki, T., Hasegawa, K. 1995. Hydrogen production from
continuous fermentation of xylose during growth of Clostridium sp. strain No. 2. Canadian
journal of microbiology, 41(6), 536-540.
Van Niel, E., Budde, M., De Haas, G., Van der Wal, F., Claassen, P., Stams, A. 2002. Distinctive
properties of high hydrogen producing extreme thermophiles, Caldicellulosiruptor
saccharolyticus and Thermotoga elfii. International Journal of Hydrogen Energy, 27(11),
1391-1398.
Vardar Schara, G., Maeda, T., Wood, T.K. 2008. Metabolically engineered bacteria for producing
hydrogen via fermentation. Microbial Biotechnology, 1(2), 107-125.
Wang, J., Wan, W. 2008. Effect of Fe2+ concentration on fermentative hydrogen production by
mixed cultures. International Journal of Hydrogen Energy, 33(4), 1215-1220.
Wang, J., Wan, W. 2009. Factors influencing fermentative hydrogen production: a review.
International journal of hydrogen energy, 34(2), 799-811.

55
Wang, X., Jin, B. 2009. Process optimization of biological hydrogen production from molasses by
a newly isolated Clostridium butyricum W5. Journal of bioscience and bioengineering,
107(2), 138-144.
Wang, X., Jin, B., Mulcahy, D. 2008. Impact of carbon and nitrogen sources on hydrogen
production by a newly isolated Clostridium butyricum W5. International journal of
hydrogen energy, 33(19), 4998-5005.
Wang, X.J., Ren, N.Q., Xiang, W.S., Guo, W.Q. 2007. Influence of gaseous end-products
inhibition and nutrient limitations on the growth and hydrogen production by hydrogen-
producing fermentative bacterial B49. International journal of hydrogen energy, 32(6),
748-754.
Wang, Y., Patterson, J., Van Eys, J. 1971. The potential use of xylitol in glucose-6-phosphate
dehydrogenase deficiency anemia. Journal of Clinical Investigation, 50(7), 1421.
Xia, A., Cheng, J., Lin, R., Liu, J., Zhou, J., Cen, K. 2013. Sequential generation of hydrogen and
methane from glutamic acid through combined photo-fermentation and methanogenesis.
Bioresource technology, 131, 146-151.
Xu, L., Ren, N., Wang, X., Jia, Y. 2008. Biohydrogen production by Ethanoligenens harbinense
B49: Nutrient optimization. international journal of hydrogen energy, 33(23), 6962-6967.
Yang, Z., Guo, R., Xu, X., Fan, X., Luo, S. 2011. Hydrogen and methane production from lipid-
extracted microalgal biomass residues. international journal of hydrogen energy, 36(5),
3465-3470.
Yenigün, O., Kizilgün, F., Yilmazer, G. 1996. Inhibition effects of zinc and copper on volatile
fatty acid production during anaerobic digestion. Environmental technology, 17(11), 1269-
1274.

56
Yin, Y., Wang, J. 2017. Isolation and characterization of a novel strain Clostridium butyricum
INET1 for fermentative hydrogen production. International Journal of Hydrogen Energy,
42(17), 12173-12180.
Yokoi, H., Tokushige, T., Hirose, J., Hayashi, S., Takasaki, Y. 1998. H2 production from starch
by a mixed culture of Clostridium butyricum and Enterobacter aerogenes. Biotechnology
Letters, 20(2), 143-147.
Yokoyama, H., Yamashita, T., Ogino, A., Ishida, M., Tanaka, Y. 2010. Hydrogen fermentation of
cow manure mixed with food waste. Japan Agricultural Research Quarterly: JARQ, 44(4),
399-404.
Zhang, C., Yang, H., Yang, F., Ma, Y. 2009. Current progress on butyric acid production by
fermentation. Current microbiology, 59(6), 656-663.
Zhao, X., Xing, D., Liu, B., Lu, L., Zhao, J., Ren, N. 2012. The effects of metal ions and L-cysteine
on hydA gene expression and hydrogen production by Clostridium beijerinckii RZF-1108.
international journal of hydrogen energy, 37(18), 13711-13717.
butyricum with integrated extraction and pertraction. Process Biochemistry, 34(8), 835-
843.

57
CHAPTER IV:
Enhancement of hydrogen production by combining a blend ratio for two
types of algal waste biomass and reducing casamino acids supplementation by
Clostridium butyricum RAK25832.
4.1 Introduction
Concerns regarding fossil fuel depletion and their environmental impact from burning
particularly greenhouse gas emissions have prompted a search for alternative renewable energy
sources (Hahn-Hägerdal et al., 2006). Biofuel produced from biomass is an alternative to fossil
fuels that has many benefits, including reduced environmental impact, greater energy security, and
foreign exchange savings (Balat, 2010; Kan, 2009).
Dark fermentation has attracted increasing interest over the last decade for its potential to
-cost organic biomass (Azwar et al.,
2014); a high rate and yield are important for the sustainability of commercial biohydrogen
production. Fermentative hydrogen production by hydrogen-producing bacteria (HPB) requires
trace amounts of essential metal ions (Wang & Wan, 2009), although higher concentrations inhibit
bacterial metabolism (Liu et al., 2009). In a previous stage of this work, it was shown that hydrogen
production by Clostridium butyricum RAK25832 required four critical minerals, namely
MgCl2·6H2O, K2HPO4·3H2O, NaHCO3, and FeCl2·4H2O, and that casamino acids (CAAs) are an
important source of nitrogen for hydrogen production (Aly et al., 2017). CAAs are amino acids
derived from casein acid hydrolysis and are used as a supplement in bacterial cultures to enhance
growth. However, CAAs are expensive to scale up (Lev, 1977; Lindsay & Murrell, 1983; Nolan,
1971), which is a major impediment to large-scale biohydrogen production. There is, therefore, a
need to develop more economically feasible strategies (Cheng et al., 2011).

58
One way to lower the cost of biohydrogen production is to use low-cost and renewable
feedstock. Aquatic biomass especially macro- and micro-algae have many advantages as
biofuel substrates. Firstly, algae have higher productivity than agricultural crops and do not require
arable land, and therefore do not compete with human food production (Dismukes et al., 2008;
Fargione et al., 2008; Sialve et al., 2009). Secondly, their low lignin content facilitates the process
of energy conversion from biomass to biofuels (Jones & Mayfield, 2012; Wei et al., 2013). The
use of residual biomass after lipid extraction can maximize energy production from micro-algal
biomass (Brennan & Owende, 2010). Chlorella fusca was shown to be a good feedstock for
biodiesel production (lipid content 20.4%) (unpublished data). Biofuels may be derived from oil
(biodiesel) or sugar (e.g., biohydrogen and bioethanol) via sequential or independent processes
(biorefinery concept).
Macro-algal blooms have many detrimental effects. Seaweed wrack accumulates along
shorelines and produces foul odors (Wilce et al., 1982), while deep seaweeds physically obstruct
other coastal life (Hauxwell et al., 2001); moreover, decaying algal organic matter creates anoxic
conditions that kill fish and shellfish (Diaz, 2001). Ulva lactuca blooms are an environmental
problem in the coastal areas of Japan, especially in the summer; in the Seto Inland Sea, blooms
have replaced seagrasses (Sugimoto et al., 2007). Nonetheless, U. lactuca is a potential substrate
for hydrogen production (Park et al., 2009).
This chapter aimed to investigate whether algal waste could be used to produce hydrogen
at a low cost with high yield. Yield optimization by MgCl2·6H2O, K2HPO4·3H2O, NaHCO3, and
FeCl2·4H2O supplementation was investigated. Additionally, the applicability of biohydrogen
produced by blending C. fusca with U. lactuca waste materials at various ratios to reduce the

59
amount of CAAs required for dark fermentation by Clostridium butyricum RAK25832 was
assessed.
4.2 Material and methods
4.2.1 Microorganism
Fermentation was carried out using C. butyricum RAK25832 (Aly et al., 2017). The
inoculum was cultured under anaerobic conditions in medium composed of glucose (10 g/l), CAAs
(26.67 g/l), MgCl2·6H2O (0.1 g/l), K2HPO4·3H2O (6.67 g/l), NaHCO3 (2.6 g/l), and FeCl2·4H2O
(0.002 g/l) (pH 8) at 30 C, and was harvested at late exponential phase. The supernatant was
transferred to anaerobic bottles that were sealed with a rubber and aluminum cap and then flushed
with nitrogen gas. The initial inoculum was adjusted to a final optical density at 620 nm (OD620)
of 0.1 by measuring the absorbance with a U-1800 spectrophotometer (Hitachi, Tokyo, Japan)
(Pan et al., 2008). All chemicals were obtained from Wako Pure Chemical Industries (Osaka,
Japan).
4.2.2 Algal feedstock
The micro-algal biomass C. fusca was obtained from the river Nile in Alexandria, Egypt
and identified by Petrotech-ffn Egypt R & D Center (Mansoura, Egypt). The isolate was grown in
a 10-l Magnaferm fermentor (New Brunswick Scientific Co., New Brunswick, NJ, USA) in
commercial medium (1 g urea and 0.3 g potassium phosphate/10 l, pH 7) at 25 C and under a light
intensity of 1,200 lux (540 Meter; Testo, Sparta, NJ, USA) measured at the surface of the photo-
bioreactor, with aeration at a rate of 10 l/min. For harvesting, the biomass was allowed to settle by
gravity and then centrifuged at 4000 rpm for 10 min (Beckman Model; TJ-6, USA) after removing
most of the liquid phase. The wet biomass was oil extracted by the method of Bligh and Dyer
(Bligh & Dyer, 1959), yielding 510 mg/l dry weight biomass with a lipid content of 20.4%. The

60
algal pellet remaining after extraction was washed three times with clean water, dried overnight
(12 h) at 70 C until use as a substrate in the fermentation reaction. The macro-
alga U. lactuca was harvested during the summer (May to July) at low tide on Wajiro beach,
Fukuoka prefecture, Japan. The biomass was cleaned with tap water, dried at 70 C, passed through
a 200-µ sieve, and st C.
The chemical composition of algal biomass was determined, with measurements
performed in duplicate (Table 1). Total solid (TS) and volatile solid (VS) in each type of algal
biomass were determined according to Standard Methods 2540 G (APHA, 2005). Moisture content
was determined by drying the sample in an oven at 105 C until it reached a constant weight. Total
ash was determined by incineration at 550 C in a muffle furnace. The average moisture and ash
contents were used to calculate VS content. Protein content was estimated with the Lowry protein
assay (Berges et al., 1993), and total lipid content was determined according to Bligh and Dyer
method (Bligh & Dyer, 1959). Carbon, hydrogen, and nitrogen content was determined with a
Micro Corder JM 10 element analyzer (J-Science Lab Co., Kyoto, Japan). Amino acid content was
determined with an LC-500/V2 amino acid analyzer (Shimadzu, Kyoto, Japan) with lithium citrate
(pH 2.98) as the buffer solution.
4.2.3 Biohydrogen production
Twelve sets of experiments were carried out to establish the optimal substrate blend ratio
that would enhance hydrogen yield (HY). U. lactuca and C. fusca (6 g VS each) were mixed in a
225-ml serum bottle at various ratios. The working volume was adjusted to 100 ml after adding
MgCl2·6H2O (0.1 g/l), K2HPO4·3H2O (6.67 g/l), NaHCO3 (2.6 g/l), and FeCl2·4H2O (0.002
g/l). The 12 C. fusca: U. lactuca ratios by g VS were 6 : 0, 0 : 6, 3 : 3, 4 : 2, 4.5 : 1.5, 4 . 8: 1.2,

61
5 :1, 2 : 4, 1.5 : 4.5, 1.2 : 4.8, 1: 5, and (3 : 3) (Table 4.2). Groups 1 and 2 (6 : 0 and 0 : 6 ratios,
respectively) represented the controls for each feedstock, while group 12 (3 : 3 ratio) served as a
control without mineral supplementation. The experiment was performed in triplicate and the
results are expressed as average ± standard deviation. Cultures were placed in a 120-rpm shaking
water bath at 30 C for 48 h, with the initial pH adjusted to 8.00 with 1 M NaOH and 1 M HCl, and
were sterilized in an autoclave at 121 C for 15 min (2 atm) before starting the fermentative process.
The initial inoculum was obtained at an OD620 of 0.1 in the final exponential phase. Bottles were
sealed with rubber stoppers and purged with N2 to maintain anaerobic conditions.
Biogas volume was measured every 6 h by releasing the pressure in the bottle using wetted
glass syringes (50 100 ml) (Owen et al., 1979). The composition of the liquid phase was
determined at the end of the fermentation process. HY (ml H2/g VS alga) was calculated by
dividing the total volume of hydrogen produced by the amount of algal biomass used as
fermentation substrate in terms of its VS content.
The most favorable algal blend ratio obtained was optimized by including the following
minerals to enhance final yield: FeCl2·4H2O (0, 0.001, 0.002, and 0.004 g/l), NaHCO3 (0, 0.87,
1.73, 2.6, and 3.47 g/l), MgCl2·6H2O (0, 0.1, 0.2, and 0.4 g/l), and K2HPO4·3H2O (0, 1.6, 3.33,
and 6.67) g/l. The potential for reducing CAA supplementation (392-00655; Wako Chemical
Industries) was evaluated by mixing algal waste at specific ratios with CAA (3.33, 6.66, 13.33,
and 26.67 g/l).
4.2.4 Analysis of chemical composition
The biogas was collected directly from the headspace of the serum bottles using a gas-tight
syringe. The gaseous phase was analyzed by gas chromatography (GC-8APT; Shimadzu) with a
thermal conductivity detector and a Porapak Q stainless-steel column packed with an activated

62
carbon 60/80 column (1.5 m × 3.0 mm internal diameter). Argon was used as the carrier gas at a
flow rate of 6.5 ml/min. Operation temperatures for the injector, column, and detector were 50 C,
60 C, and 50 C, respectively. Volatile fatty acid (VFA) concentration in the liquid phase was
determined by gas chromatography with a flame ionization detector (FID) and 8-foot glass column
packed with 10% polyethylene glycol-20M and 2% H3PO4 (80/100 mesh). The temperatures of
the injection port, FID detector, and oven were 250 C, 140 C, and 140 C, respectively. Nitrogen
was used as the carrier gas at a flow rate of 20 ml/min. Ethanol concentration was determined by
high-performance liquid chromatography (LC_10AD equipped with a Shim pack SPR-PB column;
Shimadzu); the oven temperature was 80 C, and deionized water was used as the mobile phase at
a flow rate of 0.6 ml/min with a refraction index detector. Ammonia level was detected at the end
of the fermentation process according to 4500-NH3 standard methods (APHA, 2005). The
analytical methods and kinetic modeling were did as mentioned before in chapter III.

63
4.3 Results and discussion
4.3.1 Determination of C. fusca and U. lactuca ratio for optimal HY
Twelve co-fermentation groups with different blend ratios of C. fusca and U. lactuca waste
biomass were evaluated to determine the ratio for maximal HY (Fig. 4.1). The duration of the
fermentation reaction was 48 h. HY was in the range of 22 90 ml H2/g VS. The highest yields
were for groups 6 and 7; however, ammonia concentration was also higher for group 7 (Table 4.2).
The control groups had low yield: for group 1, the yield was only 53 ml H2/g VS, likely due to an
insufficient amount of free amino acids (nitrogen source) for hydrogen production by HPB. This
is supported by a previous study reporting that high C/N ratios in some algae led to VFA
accumulation and depleted the nitrogen available for fermentative bacteria (Xia et al., 2016). The
low ammonia concentration in group 1 also indicated that there was no surplus nitrogen in the
form of free amino acids. The HY for group 2 was even lower (22 ml H2/g VS), whereas ammonia
concentration was high (164 mg/l), reflecting an abundance of nitrogen in excess of bacterial needs.
Low C/N ratios in some algal species can lead to a high ammonia concentration, which inhibits
fermentation (Allen et al., 2013). Accordingly, blending the two types of waste biomass increased
HY, since nitrogen depletion by one type of waste could be compensated by the other. A
comparison of groups 3 and 12 revealed that mineral supplementation is important for hydrogen
production. Mineral depletion resulted in a delay in lag time by 50%, leading to a lag time of 20 h,
and the overall yield decreased 20% (35 ml H2/g VS). The main VFAs produced were acetic acid
and butyric acid (Table 2), as expected for C. butyricum; this resulted in acidification of the culture.
The C. fusca : U. lactuca ratio of group 6 ( 4: 1), which had an HY of 86 ml H2/g VS and lag time
of 2 h, was selected for further experiments.

64
Fig. 4. 1 Effect of different C. fusca and U. lactuca biomass blend ratios on HY by C. butyricumRAK25832

65
Table 4. 1 Characteristics of macro -algal biomass (U. lactuca) and micro algae (C. fusca)
Algal biomass
C. fusca U. lactuca
TS (wwt %) 93.34 95.44
VS (wwt %) 94.60 82.18
Moisture (wwt %) 6.66 4.56
Ash (fixed solids; % TS) 5.40 17.82
C (%T) 47.48 35.36
H (%T) 6.83 5.20
N (%T) 8.76 3.95
O (%T) 31.53 37.67
C/N ratio 5.42 8.95
Proteins (% VS) 42.52 22.58
Lipids (% VS) 20.40 1.00
TS, total solid; VS, volatile solid.

66
Table 4. 2 Kinetics parameters of hydrogen production by Clostridium butyricum RAK25832
using different ratio of waste biomass micro-algae (C. fusca) and macro-algal biomass (U. lactuca).
EtOH, ethanol; HAc, acetic acid; HPr, propionic acid; I-HBu, isobutyric acid; NH4-N,
ammonium nitrogen content; N-HBu, butyric acid; R2, Correlation coefficient; VFA, volatile
fatty acid.
Kinetics parameters estimated by the
modified Gompertz model VFA (mg-COD/L)
Gro
up Biomass
Ratio
Biomass
Ratio
(C.fusca
:U.
lactuca)
Final
pH
NH4-N
(mg/L)
P
(ml)/100ml
Hydroge
n rate
Rm
(hr) R2
HA
C
HP
R I-HBU
N-
HBU
EtO
H
1 1:0 6:0 4.51 8.00 281 16 15 0.9502 223 0 0 725 10
2 0:1 0:6 4.33 164.67 102 6 6 0.9858 122 0 0 677 6
3 1:1 3:3 4.23 134.06 222 20 10 0.9652 220 0 0 698 15
4 2:1 4:2 4.33 159.16 327 22 9 0.9826 340 0 0 822 22
5 3:1 4.5:1.5 4.33 74.07 365 20 2 0.9788 350 0 0 835 23
6 4:1 4.8:1.2 4.25 19.00 446 37 2 0.9988 450 0 0 1135 25
7 5:1 5:1 4.13 25.56 468 39 2 0.9455 460 0 0 1132 23
8 1:2 2:4 4.22 120.59 174 9 3 0.9669 166 0 0 689 10
9 1:3 1.5:4.5 4.25 132.10 169 8 3 0.9563 161 0 0 683 11
10 1:4 1.2:4.8 4.25 135.28 143 7 2 0.9345 158 0 0 679 10
11 1:5 1:5 4.32 140.80 135 7 1 0.9340 152 0 0 677 8
12 (1:1) (3:3) 4.43 78.97 174 10 20 0.9819 165 0 0 690 8

67
4.3.2 Yield optimization with mineral supplementation
As mentioned earlier, only four minerals are essential for hydrogen production by C. butyricum
RAK25832. The optimal concentrations of these minerals were determined as follows:
MgCl2·6H2O (0.1 g/l), K2HPO4·3H2O (6.67 g/l), NaHCO3 (2.6 g/l), and FeCl2·4H2O (0.002 g/l).
4.3.2.1 Optimizing FeCl2·4H2O concentration
Iron is the most important nutrient for hydrogen gas production as it is utilized for the formation
of hydrogenase and other enzymes (Lee et al., 2001; Oztekin et al., 2008). FeCl2·4H2O was tested
at concentrations of 0, 0.001, 0.002, and 0.004 g/l. Eliminating FeCl2·4H2O decreased HY by 55%.
Increasing the concentration above 0.002 g/l had no effect, whereas a concentration of 0.002 g/l
had a yield 86 ml H2/g VS and a rate 38 ml H2/h. On the other hand, lag time was not greatly
affected by FeCl2·4H2O concentration (Fig. 4.2A), while VFA was unaffected by increases in
FeCl2·4H2O concentration beyond 0.002 g/l (Fig. 4.3A).
4.3.2.2 Optimizing NaHCO3 concentration
NaHCO3 concentrations in the range of 0 3.47 g/l were tested (Fig. 4.2B). Complete elimination
increased lag time to 21 h and decreased yield to 41% (51 ml H2/g VS). The optimal concentration
was 1.73 g/l, which yielded 98 ml H2/g VS, increased the rate to 39 ml H2/h, and reduced lag time
to 2 h. Further increases in the concentration decreased hydrogen production. VFA production
increased with concentration up to 1.73 g/l, with a slight decrease observed at higher
concentrations (Fig. 4.3B). NaHCO3 is commonly used as a buffer in the culture medium to
neutralize acidic reaction by-products (Ai et al., 2014; Lee et al., 2004). A NaHCO3 concentration
of 0.124% (w/v) was previously reported as the optimal concentration for C. butyricum cultures
(He et al., 2004).

68
4.3.2.3 Optimizing MgCl2·6H2O concentration
The effect of MgCl2·6H2O was examined at concentrations of 0, 0.1, 0.2, and 0.4 g/l (Fig.
4.2C). In the absence of MgCl2·6H2O, the yield decreased by 28%, whereas concentrations above
0.1 g/l did not increase yield beyond 87 ml H2/g VS with a rate 37 ml H2/h. VFA production caused
the culture to become acidified (Fig. 4.3C). In additional, VFA was not affected by increasing
MgCl2·6H2O concentration. Microorganisms mainly require Mg2+ for ribosome activity, as a cell
membrane and cell wall constituent, and as an enzyme cofactor. Thus, a decrease in Mg2+
concentration reduced cell growth and ultimately, hydrogen production (Lin & Lay, 2005; Wang
et al., 2007).
4.3.2.4 Optimizing K2HPO4·3H2O concentration
The presence of P can improve microbial functions, including enzymatic activity and cell
growth (Jo et al., 2008; Lin & Lay, 2004). The effect of K2HPO4·3H2O was examined at
concentrations of 0, 1.6, 3.33, and 6.67 g/l (Fig. 4.2D). Eliminating K2HPO4·3H2O decreased HY
by 25%. The optimal concentration was 6.67 g/l, with a yield 87 ml H2/g VS and a rate of 39 ml
H2/h. HY and rates are reported to be low in dark fermentations due to VFA accumulation (Liu &
Shen, 2004; Yokoi et al., 2001), which was observed at the end of the fermentation (Fig. 3D). VFA
levels and lag time were unaffected by increasing concentrations of K2HPO4·3H2O.

69
Fig. 4. 2 Effect of different concentrations of (A) FeCl2·4H2O, (B) NaHCO3, (C) MgCl2·6H2O,
and (D) K2HPO4·3H2O with algal waste biomass ratio of C. fusca: U. lactuca (4:1) on the
hydrogen yield and hydrogen production rate by C. butyricum RAK25832.

70
Fig. 4. 3 Volatile fatty acids associated with different concentrations of (A) FeCl2·4H2O, (B) NaHCO3, (C) MgCl2·6H2O, and (D) K2HPO4·3H2O with algal waste biomass ratio of C. fusca: U. lactuca (4:1) compared to the final pH.
4.3.3 Effect of combining CAAs with algal biomass on HY
4.3.3.1 CAAs combined with a blend of C. fusca and U. lactuca
The effect of combining CAAs with algal biomass (group 6, C. fusca : U. lactuca ratio of
4 : 1) as a nitrogen source were examined on hydrogen production by C. butyricum RAK25832.
Cultures were also supplemented with optimal concentrations of MgCl2·6H2O (0.1 g/l),
K2HPO4·3H2O (6.67 g/l), NaHCO3 (1.73 g/l), and FeCl2·4H2O (0.002 g/l) (Fig. 4.4). CAAs
concentrations were 0, 1.67, 3.33, 6.67, 13.33, and 26.67 g/l. It was found that CAAs had a
significant effect on hydrogen production: a concentration of 3.33 g/l increased the yield from 107
to 117 ml H2/g VS, possibly by providing HPB with the remaining amino acids required for

71
fermentation. Acetic acid and butyric acid were the main VFAs produced by fermentation (Fig.
4.5), resulting in acidification of the culture.
Fig. 4. 4 Effect of different concentrations of CAAs combined with C. fusca and U. lactucabiomass at a ratio of 4 : 1 on HY and hydrogen production rate by C. butyricum RAK25832

72
Fig. 4. 5 Volatile fatty acids associated with different casamino acids concentration combined with algal waste biomass ratio of C. fusca: U. lactuca (4:1) compared to the final pH

73
4.3.3.2 CAAs combined with a single type of algal biomass
A maximum HY of 111 ml H2/g VS representing a 50% increase was achieved with a
CAAs concentration of 13.33 g/l in the presence of C. fusca (Fig. 4.6A). It was speculated that a
similarly high yield could be achieved by including waste algae biomass and thereby decreasing
the amount of CAAs required. A CAAs concentration of 6.67 g/l was required to obtain a
maximum yield of 94 ml H2/g VS in the presence of U. lactuca (Fig. 4.6B), which was higher than
the concentration required when using a mixture of the two types of algal biomass.
The fact that a lower amount of CAAs was required in the presence of U. lactuca as compared
with that in the presence of C. fusca may be related to the higher free amino acids concentration
in the former (Table 4. 3). The amino acid requirements of HPB were met by using the algal blend
biomass, although CAAs compensated for the low levels of some amino acids. Thus, blending the
two types of algal waste biomass could reduce the amount of CAAs required for fermentation and
thereby lower the cost of hydrogen production by dark fermentation.

74
Fig. 4. 6 Effect of different concentrations of CAAs combined with A) C. fusca and B) U. lactuca on HY and hydrogen production rate by C. butyricum RAK25832

75
Table 4. 3 Analysis of amino acid composition in C. fusca and U. lactuca
Amino
acid
C. fusca
(mg/g)
U. lactuca
(mg/g)
Asp 0.196 0.199
Thr 0.490 0.199
Ser 0.294 0.299
Asn 0.294 0.249
Glu 0.735 1.643
Gln 0.147 1.444
Gly 0.245 0.598
Ala 2.645 0.747
Cit 0.049 0.149
Val 0.294 0.498
Ile 0.147 0.349
Leu 0.245 0.349
Tyr 0.147 0.249
Phe 0.196 0.199
His 0.098 0.149
Lys 1.029 0.598
Arg 0.441 1.145
Pro 0.931 0.647

76
4.4 Conclusion
The present study investigated the possibility of reducing the requirement for CAAs an
effective but costly nitrogen source in biohydrogen fermentation by C. butyricum RAK25832-
mediated dark fermentation via the introduction of an algal waste biomass blend. A C. fusca: U.
lactuca ratio of 4 : 1 reduced the amount of CAAs required to 3.33 g/l. The deficiency in metal
ions in algal waste was partly mitigated by mineral supplementation. Based on these results, the
use of more than one nitrogen source to meet the nitrogen requirements of dark fermentation by C.
butyricum RAK25832 is recommended for maximal HY.

77
References of chapter IV
Ai, B., Li, J., Chi, X., Meng, J., Jha, A.K., Liu, C., Shi, E. 2014. Effect of pH and buffer on butyric
acid production and microbial community characteristics in bioconversion of rice straw
with undefined mixed culture. Biotechnol. Bioprocess Eng. 19, 676 686.
Allen, E., Browne, J., Hynes, S., Murphy, J. 2013a. The potential of algae blooms to produce
renewable gaseous fuel. Waste Manag. 33, 2425 2433.
Allen, E., Browne, J.D., Murphy, J.D. 2013b. Evaluation of the biomethane yield from anaerobic
co-digestion of nitrogenous substrates. Environ. Technol. 34, 2059 2068.
Aly, S.S., Imai, T., Hassouna, M.S., Nguyen, D.-M.K., Higuchi, T., Kanno, A., Yamamoto, K.,
Akada, R., Sekine, M. 2017. Identification of factors that accelerate hydrogen production
by Clostridium butyricum RAK25832 using casamino acids as a nitrogen source. Int. J.
Hydrog. Energy. doi: 10.1016/j.ijhydene.2017.08.171
APHA, AWWA, WEF. 2005. Standard Methods for the Examination of Water and Wastewater,
21th ed. American Public Health Association, Washington, DC.
Azwar, M., Hussain, M., Abdul-Wahab, A. 2014. Development of biohydrogen production by
photobiological, fermentation and electrochemical processes: A review. Renew. Sust.
Energy Rev. 31, 158 173.
Balat, H. 2010. Prospects of biofuels for a sustainable energy future: a critical assessment. Energy
Educ. Sci. Tech. A. 24, 85 111.
Berges, J.A., Fisher, A.E., Harrison, P.J. 1993. A comparison of Lowry, Bradford and Smith
protein assays using different protein standards and protein isolated from the marine diatom
Thalassiosira pseudonana. Mar. Biol.115, 187-193.

78
Bligh, E.G., Dyer, W.J. 1959. A rapid method of total lipid extraction and purification. Can. J.
Biochem. Physiol. 37, 911 917.
Brennan, L., Owende, P. 2010. Biofuels from microalgae a review of technologies for production,
processing, and extractions of biofuels and co-products. Renew. Sust. Energy Rev. 14,
557 577.
Cheng, C.-L., Lo, Y.-C., Lee, K.-S., Lee, D.-J., Lin, C.-Y., Chang, J.-S. 2011. Biohydrogen
production from lignocellulosic feedstock. Bioresour. Technol. 102, 8514 8523.
Diaz, R.J. 2001. Overview of hypoxia around the world. J. Environ. Qual. 30, 275 281.
Dismukes, G.C., Carrieri, D., Bennette, N., Ananyev, G.M., Posewitz, M.C. 2008. Aquatic
phototrophs: efficient alternatives to land-based crops for biofuels. Curr. Opin. Biotechnol.
19, 235 240.
Ehimen, E., Sun, Z., Carrington, C., Birch, E., Eaton-Rye, J. 2011. Anaerobic digestion of
microalgae residues resulting from the biodiesel production process. Appl. Energy. 88,
3454 3463.
Fargione, J., Hill, J., Tilman, D., Polasky, S., Hawthorne, P. 2008. Land clearing and the biofuel
carbon debt. Science. 319, 1235 1238.
Hahn-Hägerdal, B., Galbe, M., Gorwa-Grauslund, M.-F., Lidén, G., Zacchi, G. 2006. Bio-ethanol
the fuel of tomorrow from the residues of today. Trends Biotechnol. 24, 549 556.
Hauxwell, J., Cebrián, J., Furlong, C., Valiela, I. 2001. Macroalgal canopies contribute to eelgrass
(Zostera marina) decline in temperate estuarine ecosystems. Ecology. 82, 1007 1022.
He, G., Kong, Q., Ding, L. 2004. Response surface methodology for optimizing the fermentation
medium of Clostridium butyricum. Lett. Appl. Microbiol. 39, 363 368.

79
Jo, J.H., Lee, D.S., Park, D., Choe, W.-S., Park, J.M. 2008. Optimization of key process variables
for enhanced hydrogen production by Enterobacter aerogenes using statistical methods.
Bioresour. Technol. 99, 2061 2066.
Jones, C.S., Mayfield, S.P. 2012. Algae biofuels: versatility for the future of bioenergy. Curr. Opin.
Biotechnol. 23, 346 351.
Kan, A. 2009. General characteristics of waste management: A review. Energy Educ. Sci. Tech.
A. 23, 55 69.
Lay, J.-J., Li, Y.-Y., Noike, T. 1997. Influences of pH and moisture content on the methane
production in high-solids sludge digestion. Water Res. 31, 1518 1524.
Lee, K.S., Wu, J.F., Lo, Y.S., Lo, Y.C., Lin, P.J., Chang, J.S. 2004. Anaerobic hydrogen
production with an efficient carrier-induced granular sludge bed bioreactor. Biotechnol.
Bioeng. 87, 648 657.
Lee, Y.J., Miyahara, T., Noike, T. 2001. Effect of iron concentration on hydrogen fermentation.
Bioresour. Technol. 80, 227 231.
Lev, M. 1977. Casamino acids enhance growth of Bacteroides melaninogenicus. J. Bacteriol. 129,
562 563.
Lin, C., Lay, C. 2004. Carbon/nitrogen-ratio effect on fermentative hydrogen production by mixed
microflora. Int. J. Hydrog. Energy. 29, 41 45.
Lin, C., Lay, C. 2005. A nutrient formulation for fermentative hydrogen production using
anaerobic sewage sludge microflora. Int. J. Hydrog. Energy. 30, 285 292.
Lindsay, J., Murrell, W. 1983. A comparison of UV induced DNA photoproducts from isolated
and non-isolated developing bacterial forespores. Biochem. Biophys. Res. Commun. 113,
618 625.

80
Liu, B.-F., Ren, N.-Q., Ding, J., Xie, G.-J., Guo, W.-Q. 2009. The effect of Ni 2+, Fe 2+ and Mg
2+ concentration on photo-hydrogen production by Rhodopseudomonas faecalis RLD-53.
Int. J. Hydrog. Energy. 34, 721 726.
Liu, G., Shen, J. 2004. Effects of culture and medium conditions on hydrogen production from
starch using anaerobic bacteria. J. Biosci. Bioeng. 98, 251 256.
Logan, B.E., Oh, S.-E., Kim, I.S., Van Ginkel, S. 2002. Biological hydrogen production measured
in batch anaerobic respirometers. Env. Sci. Technol. 36, 2530 2535.
Murphy, J.D., Drosg, B., Allen, E., Jerney, J., Xia, A., Herrmann, C. 2015. A perspective on algal
biogas. IEA Bioenergy, 1 38.
Nolan, R.A. 1971. Amino acids and growth factors in vitamin-free casamino acids. Mycologia. 63,
1231 1234.
Owen, W., Stuckey, D., Healy, J., Young, L., McCarty, P. 1979. Bioassay for monitoring
biochemical methane potential and anaerobic toxicity. Water Res. 13, 485 492.
Oztekin, R., Kapdan, I.K., Kargi, F., Argun, H. 2008. Optimization of media composition for
hydrogen gas production from hydrolyzed wheat starch by dark fermentation. Int. J.
Hydrog. Energy. 33, 4083 4090.
Pan, X., Wu, T., Zhang, L., Song, Z., Tang, H., Zhao, Z. 2008. In vitro evaluation on adherence
and antimicrobial properties of a candidate probiotic Clostridium butyricum CB2 for
farmed fish. J. Appl. Microbiol. 105, 1623 1629.
Park, J.-I., Lee, J., Sim, S.J., Lee, J.-H. 2009. Production of hydrogen from marine macro-algae
biomass using anaerobic sewage sludge microflora. Biotechnol Bioprocess Eng. 14, 307.
Sialve, B., Bernet, N., Bernard, O. 2009. Anaerobic digestion of microalgae as a necessary step to
make microalgal biodiesel sustainable. Biotechnol. Adv. 27, 409 416.

81
Sugimoto, K., Hiraoka, K., Ohta, S., Niimura, Y., Terawaki, T., Okada, M. 2007. Effects of ulvoid
(Ulva spp.) accumulation on the structure and function of eelgrass (Zostera marina L.) bed.
Marine Poll. Bull. 54, 1582 1585.
Wang, J., Wan, W. 2009. Factors influencing fermentative hydrogen production: a review. Int. J.
Hydrog. Energy. 34, 799 811.
Wang, X.J., Ren, N.Q., Xiang, W.S., Guo, W.Q. 2007. Influence of gaseous end-products
inhibition and nutrient limitations on the growth and hydrogen production by hydrogen-
producing fermentative bacterial B49. Int. J. Hydrog. Energy. 32, 748 754.
Wei, N., Quarterman, J., Jin, Y.-S. 2013. Marine macroalgae: an untapped resource for producing
fuels and chemicals. Trends Biotechnol. 31, 70 77.
Wilce, R., Schneider, C., Quinlan, A., Bosch, K.V. 1982. The life history and morphology of free-
living Pilayella littoralis (L.) Kjellm. (Ectocarpaceae, Ectocarpales) in Nahant Bay,
Massachusetts. Phycologia. 21, 336 354.
Xia, A., Cheng, J., Song, W., Su, H., Ding, L., Lin, R., Lu, H., Liu, J., Zhou, J., Cen, K. 2015.
Fermentative hydrogen production using algal biomass as feedstock. Renew. Sust. Energy
Rev. 51, 209 230.
Xia, A., Jacob, A., Tabassum, M.R., Herrmann, C., Murphy, J.D. 2016. Production of hydrogen,
ethanol and volatile fatty acids through co-fermentation of macro-and micro-algae.
Bioresour. Technol. 205, 118 125.
Yang, Z., Guo, R., Xu, X., Fan, X., Li, X. 2010. Enhanced hydrogen production from lipid-
extracted microalgal biomass residues through pretreatment. Int. J. Hydrog. Energy. 35,
9618 9623.

82
Yokoi, H., Saitsu, A., Uchida, H., Hirose, J., Hayashi, S., Takasaki, Y. 2001. Microbial hydrogen
production from sweet potato starch residue. J. Biosci. Bioeng. 91, 58 63.

83
CHAPTER V:
Conclusions
Overall data results conclusion
In this research it conduct a basic thinking for biohydrogen future production in effective way
and low cost. Data obtained during this research showed:
C. butyricum RAK2583 showed good hydrogen production with various carbon sources.
C. butyricum RAK2583 prefer glucose, fructose, xylose, sucrose, and lactose sugars.
Casamino acids is suitable as a nitrogen source for microbial hydrogen production.
The best hydrogen production was obtained with 26.67 g/L casamino acid with a
cumulative hydrogen production, production rate, and yield of 2505 mL H2/L, 160 mL/h,
and 1.81 mol H2/mol glucose, respectively.
The fermentation medium for enhanced hydrogen production was studded and found that
optimal medium composition was MgCl2.6H2O (0.1 g/L), K2HPO4.3H2O (6.67 g/L),
NaHCO3 (2.6 g/L), and FeCl2.4H2O (0.002 g/L).
Vitamin supplementation of the medium showed no significant effect on hydrogen
production
Under the optimized conditions, cumulative hydrogen production reached 3074 mL H2/L.
This is the first study to demonstrate the use of casamino acids as a nitrogen source by C.
butyricum.
Using blended algal waste could reduce the supplement of casamino acids as they are rich
with amino acids.

84
Algal waste poor in mineral elements and they required supplementation with FeCl2,
NaHCO3, MgCl2, and K2HPO4.
Blended feedstocks from different sources will reduce additional supplements of nutrients,
resulting in cost reduction and effective energy production.

85
Supplementary materials
Table S 1. Nutrient composition.
Nutrient Final concentration (g/L) NH4Cl 1 NaCl 0.1 MgCl2·6H2O 0.1 CaCl2·2H2O 0.05 K2HPO4·3H2O 0.4 NaHCO3 2.6 FeCl2·4H2O 0.002 H3BO3 0.00005 ZnCl2 0.00005 CuCl2·2H2O 0.000038 MnCl2·4H2O 0.00005 (NH4)6Mo7O24·4H2O 0.00005 AlCl3 0.00005 CoCl2·6H2O 0.00005 NiCl2·6H2O 0.000092 Ethylenediaminetetraacetate 0.0005 Concentrated HCl 0.001 mL Na2SeO3·5H2O 0.0001 Yeast extract 0.1
Table S 2. Composition of the supplemented vitamins.
Components Provider weight/L ( g) Biotin Wako 2 d-Pantothenic acid Ca Wako 400 Folic acid Wako 2 Inositol Katayama 2000 Niacin Wako 400 p-Aminobenzoic acid Katayama 200 Pyridoxine HCl Wako 400 Riboflavin Sigma 200 Thiamine HCl Wako 400