Embed Size (px)
Citation preview
RESEARCH Revista Mexicana de Fısica61 (2015) 77–82 MARCH-APRIL 2015
Shape transformation from silver triangular nanoprisms to nanodisks:Raman characterization and sculpturing mechanism
I.A. Lopeza, M. Ceballosa, G. Hernandezb, L. Acostac, and I. GomezaaUniversidad Autonoma de Nuevo Leon, UANL, Facultad de Ciencias Quımicas, Laboratorio de Materiales I,
Av. Universidad, Cd. Universitaria 66451, San Nicolas de los Garza, Nuevo Leon, Mexico.bDeparamento de Nanotecnologıa, Centro de Fısica Aplicada y Tecnologıa Avanzada,
Universidad Nacional Autonoma de Mexico, Campus Juriquilla,Boulevard Juriquilla No. 3001, 76230, Juriquilla, Queretaro, Mexico.
e-mail: [email protected] Nacional de Estudios Superiores, Universidad Nacional Autonoma de Mexico,
Unidad Leon, Boulevard UNAM No. 2011 Predio el Saucillo y el Potrero 36969, Leon, Guanajuato, Mexico.
Received 12 September 2014; accepted 13 January 2015
The sculpturing action of chloride ions on silver nanoplates is investigated. Recent reports show that the shape transformation from silvertriangular nanoprisms to nanodisks by addition of chloride ion occurs after a threshold concentration. In this work, a chemical study ofthis threshold concentration is presented. There is theoretical and experimental evidence that the morphological change only depends onthe chloride ion concentration and not on the Cl−/Ag molar ratio. Besides, the chloride ion etching ability is attributed to the (AgCl)◦
complex, which controls the morphology change through a stepwise process where a silver atom is removed from the (110) plane, and issubsequently deposited on the (111) plane (i.e. from the nanoplate vertex to the basal plane). The threshold chloride ion concentration in theshape transformation coincides with the point where Ag+ ion and (AgCl)◦ concentrations are the same. On the other hand, the quantitativeformation of AgCl−2 avoids the stepwise process, and then the colloidal system is destabilized. Furthermore, the analysis of the Ramanspectra supports the transformation mechanisms.
Keywords: Silver triangular nanoprisms; silver nanodisks; Raman spectroscopy.
PACS: 81.07.-b
1. Introduction
Noble metal nanoparticles, as silver and gold, are of great in-terest because of their unique physical and chemical proper-ties [1-6]. The localized surface plasmon resonance (LSPR)exhibited by these particles allow their potential applica-tion as sensors [7,8], optoelectronic materials [9,10], cata-lysts [11,12] and active substrates for surface-enhanced Ra-man spectroscopy [13-16]. The LSPR highly depends on thesize, shape and surface environment of the metal nanopar-ticle. Silver and gold nanoparticles have been synthesizedwith different shapes as spheres [17], rods [18], cubes [19],stars [20], and various other geometries. However, silvernanoparticles undergo morphological changes by differentmechanisms that can be roughly divided in three: photoin-duced [21], thermal [22] and chemical mechanisms [23].Similarly, chemical mechanisms can be governed by redox[24], acid-base [25] and solubility-complex [26] equilibria.In this work we are interested in clarifying the morphologicaltransformation of silver nanoprisms into nanodisks by meansof solubility-complex equilibria with chloride ions. An et al.[27] reported for the first time the conversion of triangularsilver nanoprisms into nanodisks by adding chloride ions intothe nanoprisms dispersion. This morphological transforma-tion is attributed to the facet selective etching effect of chlo-ride ions at their vertices due their higher surface energy. Re-cently, a threshold concentration of chloride ions to initiatethe sculpting effect was found by Tanget al. [28] and Hsuet
al. [29]. Below this concentration (3 to4× 10−4 M) no mor-phological change is observed. In this work, we present theRaman characterization and chemical study of this thresholdconcentration and we explain some results of our own exper-iments as well as those of other groups.
2. Experimental Section
All chemical reagents used in this work were of analyticalgrade and were used without any further purification. APerkin-Elmer lambda 12 spectrophotometer was employedfor the UV-Vis analysis of the silver nanoparticle disper-sions. For the morphological characterization, the nanopar-ticles were deposited onto a carbon-coated copper grid andthen analyzed by transmission electron microscopy (TEM)using a JEOL JEM-1010 microscope. For the Raman dis-persive spectroscopy analysis, the silver dispersions were de-posited onto an aluminum support and mounted in the sam-pling compartment of a Senterra Bruker Raman spectrometercoupled with an Olympus microscope with a 50 X objective;all the samples were analyzed with integration time of 10 s, 6scans, and laser wavelength and power of 785 nm and 50 mW,respectively.
Silver nanospheres were synthesized by dropwise addi-tion of 1 mL of 8.0 mM NaBH4 solution to 100 mL of a0.1 mM AgNO3 and 1.5 mM trisodium citrate aqueous so-lution under vigorous stirring. Silver triangular nanoprismswere obtained via a photoinduced growth method, which was

78 I.A. LOPEZ, M. CEBALLOS, G. HERNANDEZ, L. ACOSTA, AND I. GOMEZ
reported in our previous work [30]. The silver nanospheredispersion was irradiated by a conventional sodium lamp of70 W. After 24 h, the colour of the colloid turned blue, whichis the characteristic colour of the silver triangular nanoprismdispersions. With the purpose of show the halide concentra-tion effect on the nanoparticle shape, 1 mL of 0.010, 0.10and 1.0 mM KCl solutions were added into 5 mL of trian-gular nanoprism dispersion under vigorous stirring. UV-Visabsorption spectra and TEM images of the silver nanoparti-cles were recorded.
3. Results and Discussion
UV-Vis absorption spectrum of the aqueous dispersion of sil-ver triangular nanoprisms is shown in Fig. 1. The absorp-tion spectrum shows four surface plasmon resonance bands[31], the 331 nm peak is the out-of-plane quadrupole res-onance, the 687 nm peak is the in-plane dipole resonance,and the 420-540 nm wide band is the convolution of theout-of-plane dipole and the in-plane quadrupole resonances.This is according with Mie’s theory [32], which predicts thatanisotropic particles could show two or more surface plas-mon resonance bands depending on their shape. Figure 2shows TEM image of the silver triangular nanoprisms ob-tained by the photoinduced growth method.
UV-Vis absorption spectra of the aqueous dispersions ofsilver nanoparticles, obtained by addition of chloride ion so-lutions of different concentrations, are shown in Fig. 3. Theaddition of 0.010 or 0.10 mM KCl solutions to the triangularnanoprisms colloidal dispersion causes no significant changein their absorption spectra. On the other hand, the spec-trum of the silver colloidal dispersion after the addition of1.0 mM KCl solution exhibits a large blue-shift to 462 nm ofthe in-plane dipole plasmon resonance band. Theoretical cal-culations indicate that the in-plane dipole plasmon resonance
FIGURE 1. UV-Vis absorption spectrum of the aqueous dispersionof silver triangular nanoprisms.
FIGURE 2. TEM image of the silver triangular nanoprisms.
FIGURE 3. UV-Vis absorption spectra of the aqueous dispersion ofsilver nanoparticles obtained by addition of chloride ion solutionsof different concentrations.
band is very sensitive to the sharpness of the triangle vertices[31]. Therefore, the triangular nanoprisms were transformedinto nanodisks by addition of 1.0 mM chloride ion solution;Fig. 4 shows a TEM image of these silver nanodisks.
In the last years, some studies about the chloride ioneffect on the shape transformation from silver triangularnanoprisms to nanodisks have been published [27-29,33,34].In order to better understand the chemical mechanism ofshape transformation of silver nanoplates via chloride ions,we calculated the relative distribution of silver(I) chemicalspecies in aqueous solution as a function of logarithmic con-centration of chloride ions.
Rev. Mex. Fis.61 (2015) 77–82

SHAPE TRANSFORMATION FROM SILVER TRIANGULAR NANOPRISMS TO NANODISKS: RAMAN CHARACTERIZATION. . . 79
FIGURE 4. TEM image of the silver nanodisks produced by addi-tion of 1.0 mM chloride ion solution.
During the shape transformation, the AgCl solubilityequilibrium is established. The Eq. (1) describe the pre-cipitation reaction between silver(I) and chloride ions, theirequilibrium constant is equivalent to the reciprocal of the sol-ubility product constant, Ksp.
Ag+(aq) + Cl−(aq) → AgCl(s) K−1
sp (1)
However, the chloride ions react with the silver(I) ions adgenerate soluble species. The four generated species are:(AgCl)0, AgCl−2 , AgCl2−3 and AgCl3−4 . The complex for-mation equilibria of each species are represented in the fol-lowing equations.
Ag+(aq) + Cl−(aq) → (AgCl)0(aq) K1 (2)
(AgCl)0(aq) + Cl−(aq) → AgCl−2(aq) K2 (3)
AgCl−2(aq) + Cl−(aq) → AgCl2−3(aq) K3 (4)
AgCl2−3(aq) + Cl−(aq) → AgCl3−4(aq) K4 (5)
Each equilibrium reaction has associated a stability con-stant of complex, Kn. The product of the stability constantsof complexes involved in the generation of some chemicalspecie is called cumulative constant, Kn, as is shown in theEq. (6).
βn = k1k2k3 · · · kn (6)
The cumulative constant value and expression of each sil-ver(I) chemical species are shown in Table I [35].
TABLE I. Cumulative constants of silver (I) chloro-complexes.
Chemical specieCumulative constant,βn
Expression Value
(AgCl)0 β1 = [(AgCl)0]
[Ag+][Cl−]1.7× 10³
AgCl−2 β2 =[AgCl−2 ]
[Ag+][Cl−]21.4× 10⁵
AgCl2−3 β3 =[AgCl2−3 ]
[Ag+][Cl−]31.1× 10⁵
AgCl3−4 β4 =[AgCl3−4 ]
[Ag+][Cl−]44.4× 10³
Based on the cumulative constants, we continue with thecalculation defining the following equation:
1 = [Ag+] + [(AgCl)0] + [AgCl−2 ]
+ [AgCl2−3 ] + [AgCl3−4 ] (7)
where the concentration of each species equals their molarfraction. This last equation represents the silver(I) chemicalspecies distribution.
Manipulating the cumulative constants such that the con-centration of each silver(I) chemical species is defined interms of chloride ion concentration, and substituting theseexpressions into the Eq. (7) we obtain the following equa-tion.
1 = [Ag+] + β1[Ag+][Cl−] + β2[Ag+][Cl−]2
+ β3[Ag+][Cl−]3 + β4[Ag+][Cl−]4 (8)
Solving for the silver(I) ion concentration, we arrive tothe Eq. (9). This equation represents silver(I) ion concentra-tion as a function of chloride ion concentration.
[Ag+] =
11 + β1[Cl−] + β2[Cl−]2 + β3[Cl−]3 + β4[Cl−]4
(9)
If we multiply both sides of equation (9) by the secondterm of the polynomial denominator, we obtain the follow-ing equation, which describes the (AgCl)0 concentration as afunction of chloride ion concentration.
[(AgCl)0] =
β1[Cl−]1 + β1[Cl−] + β2[Cl−]2 + β3[Cl−]3 + β4[Cl−]4
(10)
Similarly, Multiplying both sides of Eq. (9) by the third,fourth and fifth terms, we arrive to the definitions of theAgCl−2 , AgCl2−3 and AgCl3−4 concentrations, respectively.These expressions are also functions of chloride ion concen-tration as the Eq. (10).
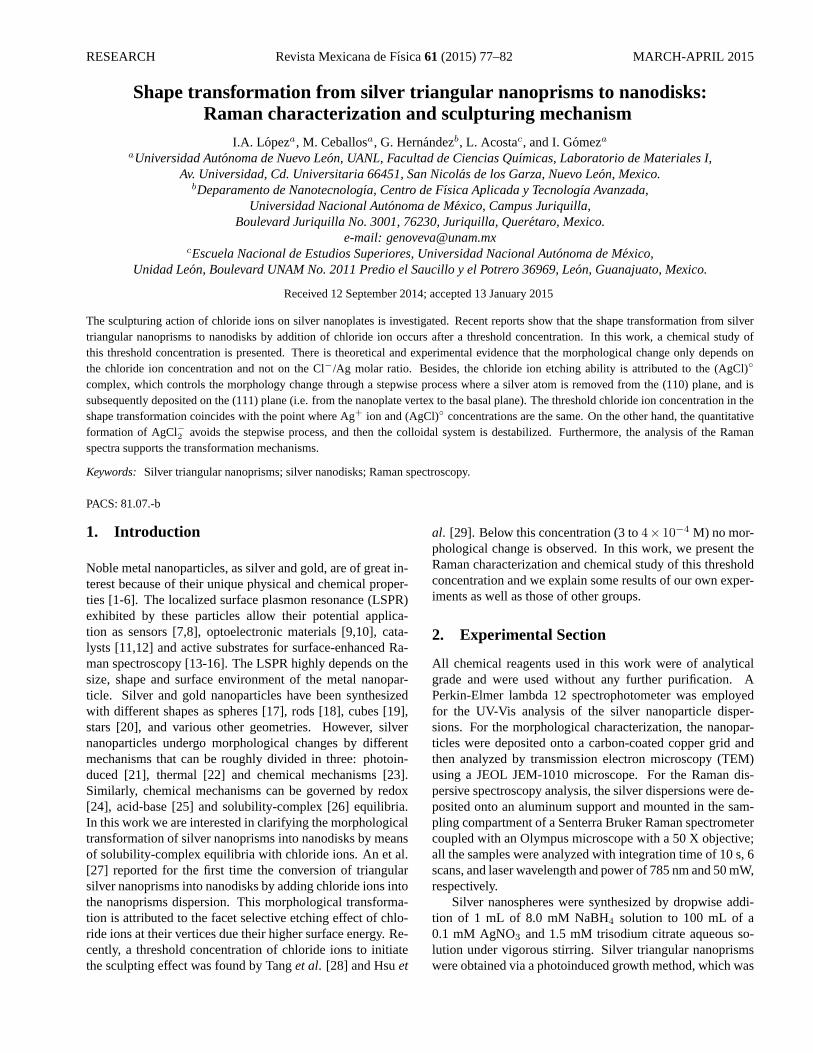
Figure 5 shows the distribution of aqueous silver(I)chloro-complexes as a function of logarithmic chloride ionconcentration. The chloride ion concentrations used inthe shape transformation, reported by the different researchgroups, are summarized in Table II.
Rev. Mex. Fis.61 (2015) 77–82
80 I.A. LOPEZ, M. CEBALLOS, G. HERNANDEZ, L. ACOSTA, AND I. GOMEZ
FIGURE 5. Distribution of aqueous silver(I) chloro-complexes as afunction of logarithmic chloride ion concentration.
TABLE II. Reports about shape transformation from silver triangu-lar nanoprisms to nanodisks by addition of chloride ion solutions.
Logarithmic chloride ion Reference
concentration,log[Cl−] < −2.40
−3.18 < log[Cl−] < −2.40 [27]
−3.41 < log[Cl−] < −2.45 [28]
log[Cl−] = −3.52 [29]
log[Cl−] = −3.18 [33]
log[Cl−] = −3.48 This work and [34]
An et al. [27] reported for the first time the shape trans-formation from triangular nanoprisms to nanodisks, they fo-cus on Cl−/Ag molar ratio influence on the morphologychange. The shape transformation can be achieved from 10to 60 Cl−/Ag molar ratios. Nevertheless, Fig. 5 denotes thatthe formation of the silver(I) chloro-complexes depends onthe chloride ion concentration and not on the Cl−/Ag molarratio. The minimum chloride ion concentration used by thisresearch group corresponds to the threshold concentration ofthis halide; however, when the chloride ion concentration isincreased to the limit of colloidal stability, aggregation oc-curs.
The limit of colloidal stability might be caused by thepresence of AgCl−2 , the maximum chloride ion concentra-tion tolerated by the nanoplates corresponds to the predomi-nance area of the reaction showed in Eq. (3). This reactionallows the formation of AgCl−2 , which is harder to reducethan (AgCl)0. The redox equilibrium is not significant at thischloride ion concentration, and therefore the etching is notcontrolled, which destabilizes the colloidal system.
Tanget al. [28] and Hsuet al. [29] found of the thresholdconcentration of the chloride ion that initiates the morphol-ogy change, the reported values of the threshold concentra-tion are4 × 10−4 and3 × 10−4 M, respectively. This con-centration is very close to the point where silver(I) ion and(AgCl)0 concentrations are the same, at this concentrationthe mean reaction is the reaction expressed in Eq. (2). Thethreshold concentration corresponds to the minimum chlo-
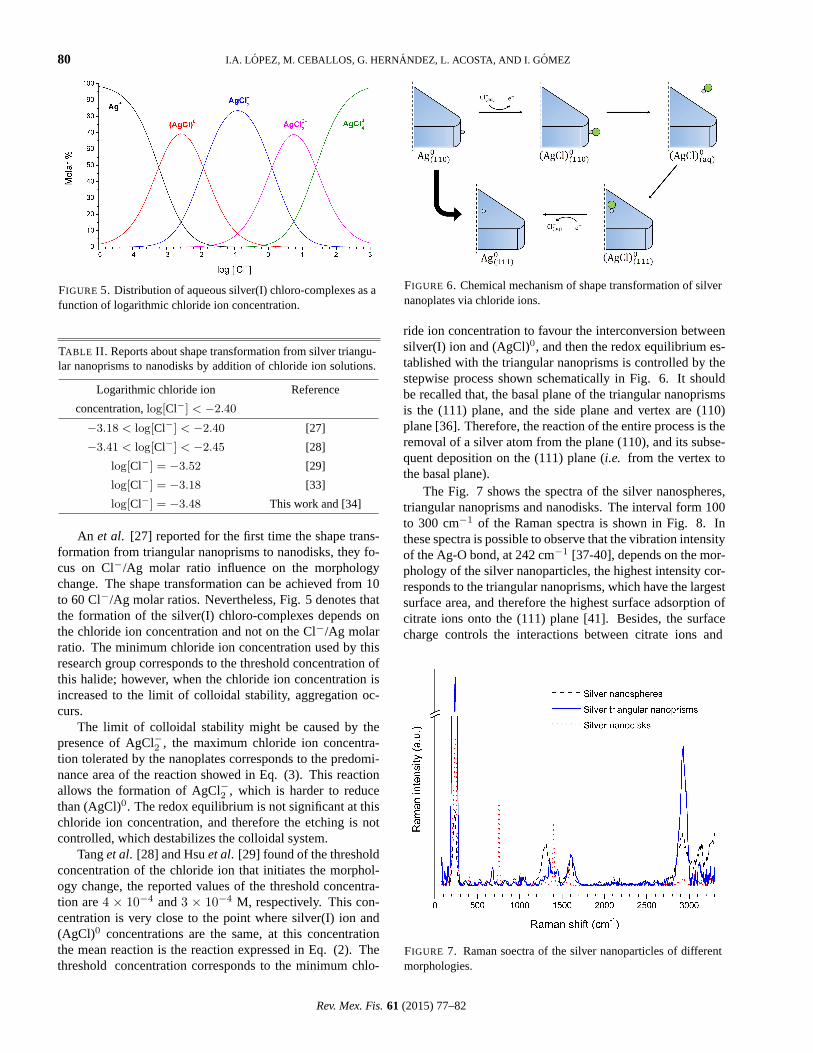
FIGURE 6. Chemical mechanism of shape transformation of silvernanoplates via chloride ions.
ride ion concentration to favour the interconversion betweensilver(I) ion and (AgCl)0, and then the redox equilibrium es-tablished with the triangular nanoprisms is controlled by thestepwise process shown schematically in Fig. 6. It shouldbe recalled that, the basal plane of the triangular nanoprismsis the (111) plane, and the side plane and vertex are (110)plane [36]. Therefore, the reaction of the entire process is theremoval of a silver atom from the plane (110), and its subse-quent deposition on the (111) plane (i.e. from the vertex tothe basal plane).
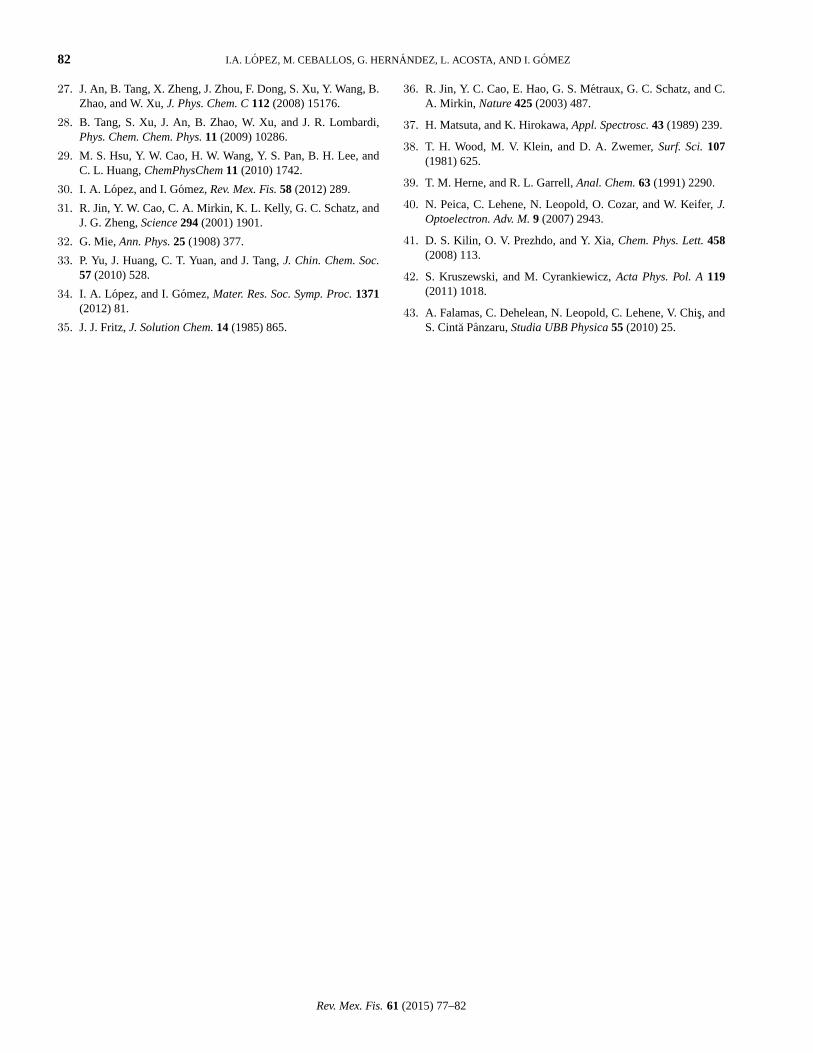
The Fig. 7 shows the spectra of the silver nanospheres,triangular nanoprisms and nanodisks. The interval form 100to 300 cm−1 of the Raman spectra is shown in Fig. 8. Inthese spectra is possible to observe that the vibration intensityof the Ag-O bond, at 242 cm−1 [37-40], depends on the mor-phology of the silver nanoparticles, the highest intensity cor-responds to the triangular nanoprisms, which have the largestsurface area, and therefore the highest surface adsorption ofcitrate ions onto the (111) plane [41]. Besides, the surfacecharge controls the interactions between citrate ions and
FIGURE 7. Raman soectra of the silver nanoparticles of differentmorphologies.
Rev. Mex. Fis.61 (2015) 77–82

SHAPE TRANSFORMATION FROM SILVER TRIANGULAR NANOPRISMS TO NANODISKS: RAMAN CHARACTERIZATION. . . 81
FIGURE 8. Raman signals of the Ag-O bond for silver nanoparti-cles of different morphologies.
silver nanoparticles [42]. In the case of the silver triangularnanoprisms, their anisotropic morphology avoids the annihi-lation of phonons due to the symmetry, which decreases theintensity of the Raman signals. Sometimes, the 242 cm−1
band is assigned to the Ag-Cl bond [43]; however, this Ra-man signal is present even in the silver nanosphere and tri-angular nanoprism spectra (i.e. in the absence of Cl-ions), asshown in Fig. 8.
4. Conclusions
The ability of the chloride ion to transform silver triangularnanoprisms into nanodisks does not depend on the Cl−/Agmolar ratio. This ability only depends on the chloride ionconcentration. The chloride ion etching ability is attributed tothe (AgCl)0 complex, which controls the morphology changethrough a stepwise process. The threshold chloride ion con-centration in the shape transformation coincides with thepoint where silver(I) ion and (AgCl)0 concentrations are thesame. The quantitative formation of AgCl−
2 avoids the step-wise process, and then the colloidal system is destabilized.Furthermore, the 242 cm−1 peak of the spectra correspond-ing to the Ag-O bond vibration is due to the adsorption ofcitrate ions onto the (111) plane. The intensity of this peakdepends on the nanoparticle morphology. The highest inten-sity corresponds to the silver triangular nanoprisms, whichcan be attributed to their anisotropic morphology and largesurface area for absorption on the (111) plane.
Acknowledgments
We would like to thank Lourdes Palma-Tirado (UNAM), formeasuring the TEM images.
1. B. J. Wiley, S. H. Im, Z. Y. Li, J. McLellan, A. Siekkinen, andY. Xia, J. Phys. Chem. B110(2006) 15666.
2. A. W. Sanders, D. A. Routenberg, B. J. Wiley, Y. Xia, E. R.Dufresne, and M. A. Reed,Nano Lett. 6 (2006) 1822.
3. L. J. Sherry, R. Jin, C. A. Mirkin, G. C. Schatz, and R. P. VanDuyne,Nano Lett.6 (2006) 2060.
4. O. L. Muskens, G. Bachelier, N. Del Fatti, F. Vallee, A.Brioude, X. Jiang, and M. P. Pileni,J. Phys. Chem. C112(2008) 8917.
5. Y. Huang, M. C. Pitter, and M. G. Somekh,Langmuir27(2011)13950.
6. P. E. Batson,Science335(2012) 47.
7. W. P. Hall, S. N. Ngatia, and R. P. Van Duyne,J. Phys. Chem.C 115(2011) 1410.
8. L. Feuz, M. P. Jonsson, and F. Hook, Nano Lett.12 (2012) 873.
9. E. Moulin, J. Sukmanowski, M. Schulte, A. Gordijn, F. X.Royer, and H. Stiebig,Thin Solid Films516(2008) 6813.
10. L. Hu, H. S. Kim, J. Y. Lee, P. Peumans, and Y. Cui,ACS Nano4 (2010) 2955.
11. K. Awazu, M. Fujimaki, C. Rockstuhl, J. Tominaga, H. Mu-rakami, Y. Ohki, N. Yoshida, and T. Watanabe,J. Am. Chem.Soc.130(2008) 1676.
12. P. Liu, and M. Zhao,Applied Surface Science255(2009) 3989.
13. Y. W. Cao, R. Jin, and C. A. Mirkin,Science297(2002) 1536.
14. W. Li, P. H. Camargo, X. Lu, and Y. Xia,Nano Lett.9 (2009)485.
15. M. Rycenga, P. H. Camargo, W. Li, C. H. Moran, and Y. Xia,J.Phys. Chem. Lett. 1 (2010) 696.
16. W. J. Cho, Y. Kim, and J. K. Kim,ACS Nano6 (2012) 249.
17. A. Tang, S. Qu, Y. Hou, F. Teng, Y. Wang, and Z. J. Wang,SolidState Chem.184(2011) 1956.
18. A. Jakab, C. Rosman, Y. Khalavka, J. Becker, A. Trugler, U.Hohenester, and C. Sonnichsen,ACS Nano5 (2011) 6880.
19. L. J. Sherry, S. H. Chang, G. C. Schatz, and R. P Van Duyne,Nano Lett.5 (2005) 2034.
20. C. L. Nehl, H. Liao, and J. H. Hafner,Nano Lett.6 (2006) 683.
21. K. G. Stamplecoskie, and J. C. Scaiano,J. Am. Chem. Soc. 132(2010) 1825.
22. B. Tang, J. An, X. Zheng, S. Xu, D. Li, J. Zhou, B. Zhao, andW. Xu, J. Phys. Chem. C112(2008) 18361.
23. S. Chen, and D. L. Carroll,Nano Lett.2 (2002) 1003.
24. J. Roh, J. Yi, and Y. Kim,Langmuir26 (2010) 11621.
25. Y. Chen, C. Wang, Z. Ma, and Z. Su,Nanotechnology18(2007)325602.
26. B. H. Lee, M. S. Hsu, Y. C. Hsu, C. W. Lo, and C. L. Huang,J.Phys. Chem. C114(2010) 6222.
Rev. Mex. Fis.61 (2015) 77–82
82 I.A. LOPEZ, M. CEBALLOS, G. HERNANDEZ, L. ACOSTA, AND I. GOMEZ
27. J. An, B. Tang, X. Zheng, J. Zhou, F. Dong, S. Xu, Y. Wang, B.Zhao, and W. Xu,J. Phys. Chem. C112(2008) 15176.
28. B. Tang, S. Xu, J. An, B. Zhao, W. Xu, and J. R. Lombardi,Phys. Chem. Chem. Phys.11 (2009) 10286.
29. M. S. Hsu, Y. W. Cao, H. W. Wang, Y. S. Pan, B. H. Lee, andC. L. Huang,ChemPhysChem11 (2010) 1742.
30. I. A. Lopez, and I. Gomez,Rev. Mex. Fis.58 (2012) 289.
31. R. Jin, Y. W. Cao, C. A. Mirkin, K. L. Kelly, G. C. Schatz, andJ. G. Zheng,Science294(2001) 1901.
32. G. Mie, Ann. Phys.25 (1908) 377.
33. P. Yu, J. Huang, C. T. Yuan, and J. Tang,J. Chin. Chem. Soc.57 (2010) 528.
34. I. A. Lopez, and I. Gomez,Mater. Res. Soc. Symp. Proc.1371(2012) 81.
35. J. J. Fritz,J. Solution Chem.14 (1985) 865.
36. R. Jin, Y. C. Cao, E. Hao, G. S. Metraux, G. C. Schatz, and C.A. Mirkin, Nature425(2003) 487.
37. H. Matsuta, and K. Hirokawa,Appl. Spectrosc.43 (1989) 239.
38. T. H. Wood, M. V. Klein, and D. A. Zwemer,Surf. Sci.107(1981) 625.
39. T. M. Herne, and R. L. Garrell,Anal. Chem.63 (1991) 2290.
40. N. Peica, C. Lehene, N. Leopold, O. Cozar, and W. Keifer,J.Optoelectron. Adv. M.9 (2007) 2943.
41. D. S. Kilin, O. V. Prezhdo, and Y. Xia,Chem. Phys. Lett.458(2008) 113.
42. S. Kruszewski, and M. Cyrankiewicz,Acta Phys. Pol. A119(2011) 1018.
43. A. Falamas, C. Dehelean, N. Leopold, C. Lehene, V. Chis, andS. Cinta Panzaru,Studia UBB Physica55 (2010) 25.
Rev. Mex. Fis.61 (2015) 77–82