Embed Size (px)
Citation preview

Shapes and Self-Movement inProtocell Systems
n 2008 Massachusetts Institute of Technology
* Contact author.** Department of General Systems Sciences, The Graduate School of Arts and Sciences,153-8902, Japan. E-mail: [email protected]
Keisuke Suzuki*,**The University of Tokyo
Takashi Ikegami**The University of Tokyo
Keywords
Autopoiesis, chemotaxis, sensory-motorcoupling, shapes, self-boundary
Abstract The effect of shapes on self-movement has been studiedwith an extended model of autopoiesis. Autopoiesis is known asa theory of self-boundary maintenance. In this study, not only theautopoietic generation of the self-boundary, but also the emergence ofself-motility, has been examined. As a result of computer simulations,it has been found that different membrane shapes cause differenttypes of self-movement. A kind of chemotaxis has been observed forsome shapes. The mechanism of chemotaxis is discussed by studyingthe internal chemical processes within the shape boundaries.
1 Introduction
Self-movement is a fundamental feature that distinguishes life from nonlife forms. It is not simply anoutcome of the internal dynamics of a cell, but is a result of recurrent couplings between an environmentand internal dynamics. These couplings can be characterized as an interface, which filters and amplifies theinward and outward flow of chemicals across the cell boundary. The interface is realized by a biologicalmembrane that must be self-generated by a cell’s chemical reaction. More importantly, the interface isn’ta plain unstructured sheet, but can be a folded geometrical object. We try to capture this geometrical na-ture of the interface and propose a protocell model, which shows self-movement driven by the membraneshapes. We then raise the following question: When does a chemical network bounded by a membranebecome a cell that has its own intention? In the other words, we try to make a consistent connectionbetween local chemical processes driven by noise and the global sensory-motor coupling of a cell. Ourconjecture is that the geometrical shape of a membrane can mediate sensor and motor activities of a cell.
Regarding real cell systems, we know that many biological cells show self-motility, for example,Amoeba proteus, one of a class of protozoa that exhibits dynamic motility patterns in response to envi-ronmental changes. They move around the environment and forage by drastically changing their shapepatterns [23]. We name those dynamic processes amoebic movement. The movement is principally generatedby chemical machinery consisting of actin and myosin proteins across the entire cell structure. Moresophisticated modern cells use a special organ called a flagellum [22, 21, 16]. The mechanism of the cellmotion is well studied by simulating the physico-chemical processes of actin dynamics [8, 2]. Such cellsself-move by responding to environmental differences, such as chemical gradients. Given attractantchemicals, cells sense the attractant and aggregate to it, a process often called chemotaxis. A cell may sensethe attractant gradient by making use of internal chemicals [13, 17]. There have been some simulationstudies that qualitatively reproduced amoebic cell motions as well as chemotaxis [1, 12].
Artificial Life 15: 59–70 (2009)
The University of Tokyo, 3-8-1 Komaba, Tokyo,
Shapes and Self-Movement in Protocell SystemsK. Suzuki and T. Ikegami
In comparison with those studies, we incorporate the membrane shape more explicitly into ourmodel, which is an extension of the simple cell model proposed by Varela et al. [19] and later byMcMullin and Varela [10]. The cell model consists of particles reproducing a membrane, which thenrestricts the region in which a chemical reaction occurs. Due to the localization of the chemicalreaction in the region, the membrane is regenerated. This cyclic structure forms an entity that we calla cell. We extend the model by introducing explicit membrane dynamics. Each membrane particlemoves randomly, but at the same time it is highly constrained by the neighboring connected particles.Now the question becomes more explicit: how such a locally fluctuating membrane configurationcan support global coherent cell motion.
It should be reminded that our purpose is not suppressing any fluctuation at the micro level to getrobust coherence at the macro level. For example, with respect to chemotaxis, we pay attention tothe associated motion fluctuation. What we call biological autonomy is the autonomous dynamics ofa living system that shows different behaviors in the same conditions, or the same behaviors indifferent conditions. In this article, we will simulate chemotaxis accompanying behavior fluctuationintroduced by the membrane shapes.
In Section 2, we describe the model. In Section 3, cell movement and chemotactic behavior incertain conditions are reported. In Section 4, we analyze the spatial fluctuation of the membraneconfiguration. In Section 5, we discuss how a certain membrane shape can substitute for sensors.
2 The Model
The notion of autopoiesis was proposed by Varela et al. as a method to find the logic of a life formas a self-maintaining entity [19, 18]. Varela clarified the concept by building an abstract chemicalsystem that has a metabolic cycle among substrates (SUBSTRATE), catalysts (CATALYST), and link(LINK) particles. The model is often called the substrate-catalyst-link (SCL) model [10]. These par-ticles move around randomly in a two-dimensional discrete space.
Surrounding a CATALYST, LINK particles form a membrane, which is maintained recurrentlyand dynamically. An autopoietic cell is characterized by this self-cyclic nature of metabolism. We havemodified this basic algorithm to include a variety of membrane shapes. Instead of having the decayprocess of the LINK particles, we have designed new rules for replacing the LINK particles withoutbreaking the membrane. This modification causes the membrane size to vary from a minimumlength of four units to infinity. The following subsections give the details of the modified SCL model.
2.1 Basic SettingsThree types of abstract particles are defined in the model. There is only one unique CATALYST (C)particle that exists in the space. The CATALYST particle cannot occupy the same site as other par-ticles. The LINK (L) particle has two different forms: free-running or chain-linked (where particlesare bonded to one another). The forms of the LINK and the SUBSTRATE (S) are not mutuallyexclusive. Each particle, except the bonded LINK particle, moves randomly with certain probabilitieswhen there is space around it.
A cell configuration is defined as a set of bonding LINK particles that enclose one CATALYST
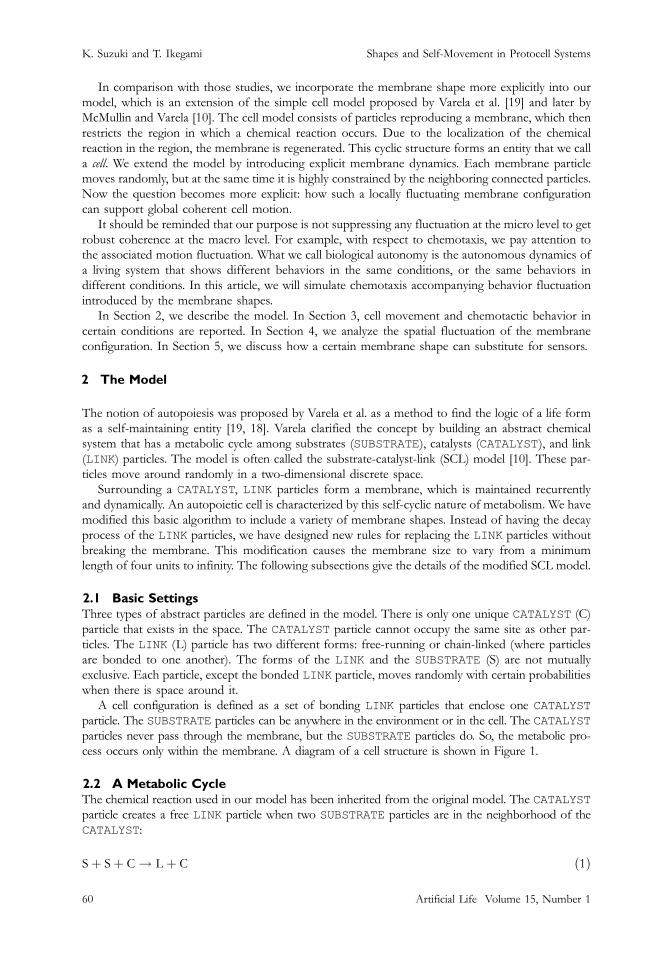
particle. The SUBSTRATE particles can be anywhere in the environment or in the cell. The CATALYSTparticles never pass through the membrane, but the SUBSTRATE particles do. So, the metabolic pro-cess occurs only within the membrane. A diagram of a cell structure is shown in Figure 1.
2.2 A Metabolic CycleThe chemical reaction used in our model has been inherited from the original model. The CATALYSTparticle creates a free LINK particle when two SUBSTRATE particles are in the neighborhood of theCATALYST:
Sþ Sþ C ! L þ C ð1Þ
Artificial Life Volume 15, Number 160
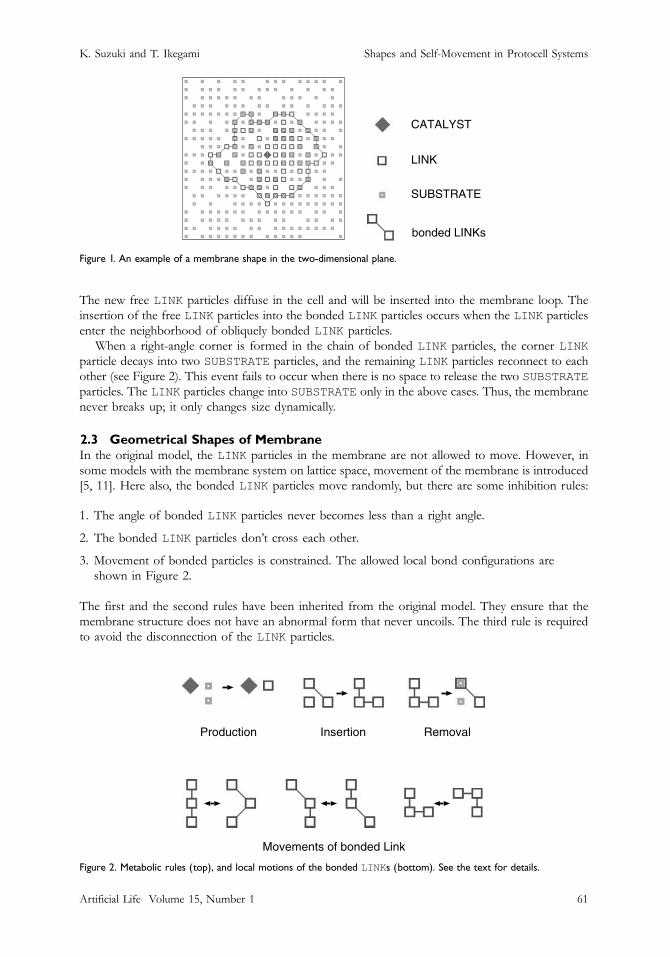
Figure 1. An example of a membrane shape in the two-dimensional plane.
Shapes and Self-Movement in Protocell SystemsK. Suzuki and T. Ikegami
The new free LINK particles diffuse in the cell and will be inserted into the membrane loop. Theinsertion of the free LINK particles into the bonded LINK particles occurs when the LINK particlesenter the neighborhood of obliquely bonded LINK particles.
When a right-angle corner is formed in the chain of bonded LINK particles, the corner LINKparticle decays into two SUBSTRATE particles, and the remaining LINK particles reconnect to eachother (see Figure 2). This event fails to occur when there is no space to release the two SUBSTRATE
particles. The LINK particles change into SUBSTRATE only in the above cases. Thus, the membranenever breaks up; it only changes size dynamically.
2.3 Geometrical Shapes of MembraneIn the original model, the LINK particles in the membrane are not allowed to move. However, insome models with the membrane system on lattice space, movement of the membrane is introduced[5, 11]. Here also, the bonded LINK particles move randomly, but there are some inhibition rules:
1. The angle of bonded LINK particles never becomes less than a right angle.
2. The bonded LINK particles don’t cross each other.
3. Movement of bonded particles is constrained. The allowed local bond configurations areshown in Figure 2.
The first and the second rules have been inherited from the original model. They ensure that themembrane structure does not have an abnormal form that never uncoils. The third rule is requiredto avoid the disconnection of the LINK particles.
Figure 2. Metabolic rules (top), and local motions of the bonded LINKs (bottom). See the text for details.
Artificial Life Volume 15, Number 1 61
Shapes and Self-Movement in Protocell SystemsK. Suzuki and T. Ikegami
3 Observations
3.1 Coherent MotionWhen the membrane is expanded in one direction and withdrawn from the opposite side, the wholecell structure shifts to the expanding side. Whether the membrane is expanded or withdrawn iscontrolled by the metabolic process of the LINK particles and the CATALYST particle that generatesthem. On the other hand, the motion of the CATALYST particle is determined randomly, but itcannot cross the membrane. A coherent cell motion is achieved by the insertion and removal of theLINK particles on the membrane and the Brownian motion of the bonded LINK particles.
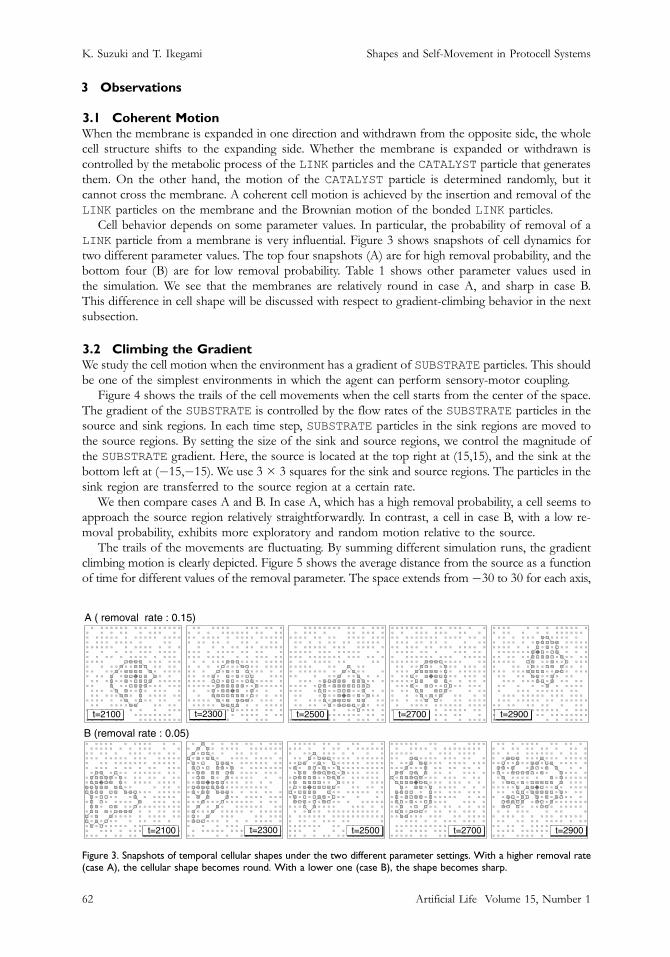
Cell behavior depends on some parameter values. In particular, the probability of removal of aLINK particle from a membrane is very influential. Figure 3 shows snapshots of cell dynamics fortwo different parameter values. The top four snapshots (A) are for high removal probability, and thebottom four (B) are for low removal probability. Table 1 shows other parameter values used inthe simulation. We see that the membranes are relatively round in case A, and sharp in case B.This difference in cell shape will be discussed with respect to gradient-climbing behavior in the nextsubsection.
3.2 Climbing the GradientWe study the cell motion when the environment has a gradient of SUBSTRATE particles. This shouldbe one of the simplest environments in which the agent can perform sensory-motor coupling.
Figure 4 shows the trails of the cell movements when the cell starts from the center of the space.The gradient of the SUBSTRATE is controlled by the flow rates of the SUBSTRATE particles in thesource and sink regions. In each time step, SUBSTRATE particles in the sink regions are moved tothe source regions. By setting the size of the sink and source regions, we control the magnitude ofthe SUBSTRATE gradient. Here, the source is located at the top right at (15,15), and the sink at thebottom left at (�15,�15). We use 3 � 3 squares for the sink and source regions. The particles in thesink region are transferred to the source region at a certain rate.
We then compare cases A and B. In case A, which has a high removal probability, a cell seems toapproach the source region relatively straightforwardly. In contrast, a cell in case B, with a low re-moval probability, exhibits more exploratory and random motion relative to the source.
The trails of the movements are fluctuating. By summing different simulation runs, the gradientclimbing motion is clearly depicted. Figure 5 shows the average distance from the source as a functionof time for different values of the removal parameter. The space extends from�30 to 30 for each axis,
Figure 3. Snapshots of temporal cellular shapes under the two different parameter settings. With a higher removal rate(case A), the cellular shape becomes round. With a lower one (case B), the shape becomes sharp.
Artificial Life Volume 15, Number 162

Table 1. The parameters used in our simulations.
Parameter Value
Space size 60�60
Initial cell size 9�9
Initial SUBSTRATE density 0.7
Diffusion rate of the CATALYST 0.1
Diffusion rate of the LINK 0.4
Diffusion rate of the SUBSTRATE 0.4
Diffusion rate of the SUBSTRATE in the neighborhood of the LINK 0.2
Diffusion rate of the LINK in the neighborhood of the SUBSTRATE 0.2
Probability of production 1.0
Probability of insertion 0.1
Probability of movement of the membrane 0.5
Shapes and Self-Movement in Protocell SystemsK. Suzuki and T. Ikegami
and a cell starts at (0,0). The center of the source is placed at (18,0), and the center of the sink is placedat (�18,0). On increasing the removal rate, we notice that the cell approaches the source more swiftly.
This picture is verified by changing the magnitude of the gradient. Figure 6 shows the sourceapproach rate of case A and case B with source and sink size changed from 0 to 7 � 7. When the sizeof the source increases, the SUBSTRATE gradient declines sharply. The approach rate is calculated byobserving the frequency with which the cell is attracted to the source within 50,000 time steps over100 simulation runs. The graph shows that the approach rates are larger in case A (large removal prob-ability) than in case B (small removal probability). This result corresponds to Figure 4. The rate in case A(the upper line) increases when the source size grows. When there are more than 25 sites in the source,the increase seems to be saturated. On the other hand, in case B (the lower line), no climbing tendency is
Figure 4. Spatial trails of cell movements with different random seeds are shown, where the SUBSTRATE particles flow fromthe top right corner (15,15) to the bottom left corner (�15,�15). The two plots correspond to cases A and B in Figure 3. Incase A, cells are attracted to the top right corner, whereas in case B cells tend to explore without approaching it.
Artificial Life Volume 15, Number 1 63

Figure 5. Average distances from the source of the SUBSTRATE are plotted for 30 different runs. They are compared forfive different removal probabilities. In the event of high probability of removal, a cell tends to approach the source. Errorbars are only shown when the removal parameters are 0.05 and 0.15, for visibility.
Shapes and Self-Movement in Protocell SystemsK. Suzuki and T. Ikegami
seen. When the source size increases, the approach rate decreases. This result indicates that the cell in thecase with the larger removal probability has a sensitivity to the substrate gradient. Why a certain cell typeshows a chemotactic tendency will become clear in the next section.
3.3 Biasing MetabolismThe modeled cells with a rounded shape exhibited gradient-climbing behavior, but those with asharp shape did not. To reveal the mechanism for this outcome, we studied different combinationsof reaction parameters and algorithms as follows:
(a) Case A (round shape) with the SUBSTRATE gradient
(b) Case A (round shape) without the SUBSTRATE gradient
(c) Case A (round shape) with the SUBSTRATE gradient, but no metabolism
(d) Case B (sharp shape) with the SUBSTRATE gradient
Figure 6. The difference between large and small removal parameters is made clearer by plotting the reaching probabilityagainst the SUBSTRATE source. Here the horizontal axis represents the size of the sink and source, which is pro-portional to the flow rate. Size 0 means there is no SUBSTRATE gradient. The vertical axis represents the probability ofreaching the source during the initial 50,000 steps.
Artificial Life Volume 15, Number 164
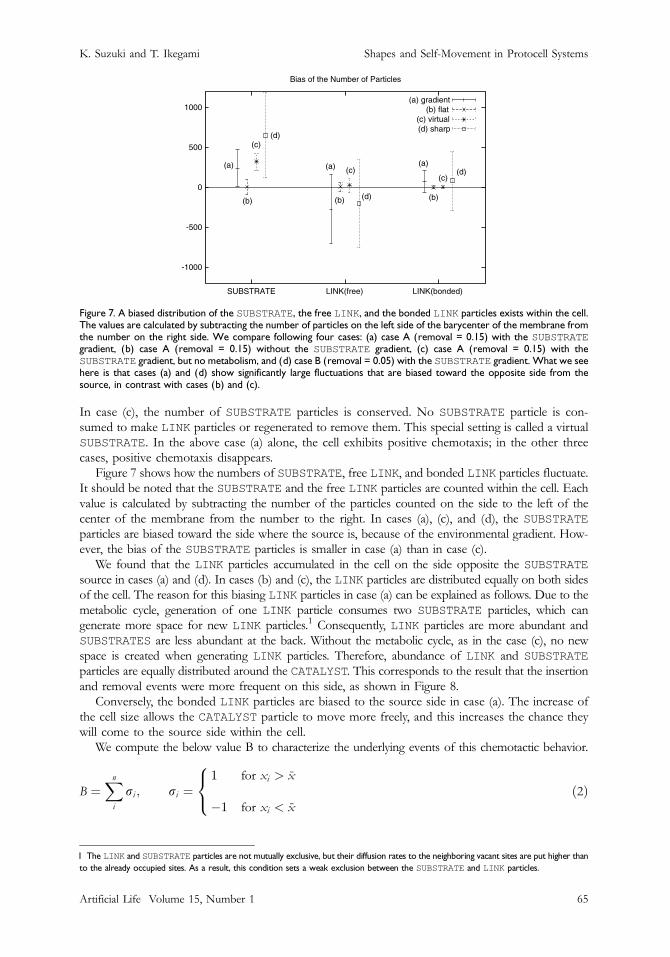
Figure 7. A biased distribution of the SUBSTRATE, the free LINK, and the bonded LINK particles exists within the cell.The values are calculated by subtracting the number of particles on the left side of the barycenter of the membrane fromthe number on the right side. We compare following four cases: (a) case A (removal = 0.15) with the SUBSTRATEgradient, (b) case A (removal = 0.15) without the SUBSTRATE gradient, (c) case A (removal = 0.15) with theSUBSTRATE gradient, but no metabolism, and (d) case B (removal = 0.05) with the SUBSTRATE gradient. What we seehere is that cases (a) and (d) show significantly large fluctuations that are biased toward the opposite side from the
Shapes and Self-Movement in Protocell SystemsK. Suzuki and T. Ikegami
In case (c), the number of SUBSTRATE particles is conserved. No SUBSTRATE particle is con-sumed to make LINK particles or regenerated to remove them. This special setting is called a virtualSUBSTRATE. In the above case (a) alone, the cell exhibits positive chemotaxis; in the other threecases, positive chemotaxis disappears.
Figure 7 shows how the numbers of SUBSTRATE, free LINK, and bonded LINK particles fluctuate.It should be noted that the SUBSTRATE and the free LINK particles are counted within the cell. Eachvalue is calculated by subtracting the number of the particles counted on the side to the left of thecenter of the membrane from the number to the right. In cases (a), (c), and (d), the SUBSTRATE
particles are biased toward the side where the source is, because of the environmental gradient. How-ever, the bias of the SUBSTRATE particles is smaller in case (a) than in case (c).
We found that the LINK particles accumulated in the cell on the side opposite the SUBSTRATE
source in cases (a) and (d). In cases (b) and (c), the LINK particles are distributed equally on both sidesof the cell. The reason for this biasing LINK particles in case (a) can be explained as follows. Due to themetabolic cycle, generation of one LINK particle consumes two SUBSTRATE particles, which cangenerate more space for new LINK particles.1 Consequently, LINK particles are more abundant andSUBSTRATES are less abundant at the back. Without the metabolic cycle, as in the case (c), no newspace is created when generating LINK particles. Therefore, abundance of LINK and SUBSTRATE
particles are equally distributed around the CATALYST. This corresponds to the result that the insertionand removal events were more frequent on this side, as shown in Figure 8.
Conversely, the bonded LINK particles are biased to the source side in case (a). The increase ofthe cell size allows the CATALYST particle to move more freely, and this increases the chance theywill come to the source side within the cell.
We compute the below value B to characterize the underlying events of this chemotactic behavior.
B ¼Xn
i
ri ; ri ¼1 for xi > x̄
�1 for xi < x̄
8<: ð2Þ
source, in contrast with cases (b) and (c).
1 The LINK and SUBSTRATE particles are not mutually exclusive, but their diffusion rates to the neighboring vacant sites are put higher thanto the already occupied sites. As a result, this condition sets a weak exclusion between the SUBSTRATE and LINK particles.
Artificial Life Volume 15, Number 1 65

Figure 8. Average frequencies of the insertion, removal, and production of the LINK particle events occurring on thesource side of the membrane with respect to the barycenter of a cell. We computed the number of events on the sourceside minus the number on the other side and plotted the difference on the vertical axis. We compare the four cases (a),(b), (c), and (d) as in Figure 7.
Shapes and Self-Movement in Protocell SystemsK. Suzuki and T. Ikegami
Here, xi represents the x coordinate where the elementary events occur, x is the barycenter of themembrane particles, and n is the total number of target events. Figure 8 depicts the value B for eachevent. In case (a), which shows chemotaxis, the insertion, removal, and movements of the membraneevents occur more frequently on the side further from the source of the SUBSTRATE particles.Different from the other three cases (b, c, d), the chemotactic behavior is caused by the bias of themetabolic processes. Case (c) (without the metabolic cycle of the SUBSTRATE to the LINK particles)does not exhibit the bias of events as in the flat condition (b). Comparing the chemotactic case (a) withthe SUBSTRATE case (c), we see that the consumption and the provision of the SUBSTRATE parti-cles may contribute to a directional bias of metabolic events caused by a biased distribution of the LINKparticles.
We explain the mechanism of the gradient-climbing behavior in terms of these events as follows:
1. Free LINK particles aggregate on the internal side opposite to the source location. We callthis the B (back) side.
2. Using the abundant LINK particles, the insertion and removal events of LINK particlesbecome much more frequent on the B side.
3. A local movement of the membrane link is suppressed on the B side and enhanced on theother side, because the membrane on the B side is frequently regenerated.
4. This bias of the local movement leaves less space on the B side and much more space onthe other side close to the source.
5. Since a CATALYST particle can move to the empty space, it stays longer on the source side.This tendency reinforces steps 1–4, and, on average, a cell shows chemotaxis.
A steeper gradient may induce this asymmetrical configuration of the membrane, so that with theincrease in the source size, the cell approaches the source site more frequently, as seen in Figure 6.
In Figure 8d, we show on which part of the membrane the motile LINK particle was detected. Inthe sharp cell, the variance of this value is much larger than in the round cell. This means that the localmovements of the bonded LINK particles fluctuate more in the sharp cell than in the round cell. Thesharp cell has more pinning sites in the membrane, so that the cell does not always undergo the biasedmembrane movement. Thus, the sharp cell as a whole can’t simply follow the outside gradient. Wehypothesize that this pinning effect suppresses the chemotaxis in the case of the sharp cell.
Artificial Life Volume 15, Number 166

Shapes and Self-Movement in Protocell SystemsK. Suzuki and T. Ikegami
4 Shape Transition Properties
We investigated the statistical properties of membrane shapes. To reveal how the shape changes, wecomputed a transition network among shapes in cases (a) [high removal probability (round shape)]and (b) [lower removal probability (sharp shape)] under the gradient of substrates. Then the networksare compared with those of case (c) [high removal probability without the gradient].
The algorithm for generating the shape transition network is the following: First we identify theshapes of the membrane with the longer life span (e.g., C or L or . . . ); then we translate the timeseries of cell dynamics into a string of those membrane shapes (e.g., LCLCCRC). Second, the simi-larities among these strings are quantified by the Levenshtein distance (by counting how many inser-tions and deletions of characters are needed to match two character strings). Finally, similar shapes areclustered into the same groups when their similarities are higher than a given threshold. Then, thetransition network of shapes in Figure 9 is obtained, where the nodes of the network are the clusteredgroups. The size of the nodes is proportional to the number of members in the group. Geometricallysimilar shapes are made to come close automatically in the network by connecting nodes with a spring
Figure 9. Examples of the shape transition networks in two different cases with gradient environments: (a) round shapesand (b) sharp shapes. The width of the lines reflects the number of connections. The nodes are roughly arranged accordingto the distances among them. These data are gathered during the 2,000 time steps with different random seeds.
Artificial Life Volume 15, Number 1 67

Shapes and Self-Movement in Protocell SystemsK. Suzuki and T. Ikegami
whose coefficient is proportional to shape similarity. A node is connected to another node if the latter isthe successor of the former in the simulation.
We see that the transition arms are localized among similar shapes in case (a), but in case (b), moredifferent nodes appear than in case (a). The network topology is more linearly arranged and localized incase (a), but more uniformly distributed in case (b), except that we see some important nodes havingmany connections with other nodes. From this analysis, we see that case (b) allows many differentmembrane shapes but becomes less sensitive to the environmental gradient. On the other hand, case (a)has lower variety (or each shape has only a short life span), but shows chemotaxis. These observationsimply that in real ameba-like cells, explorative and chemotactic phases can be objectively detected by themembrane shapes.
5 Discussion
In this article, we have demonstrated two things: First, membrane shape difference controls sensory-motor coupling, and in particular, chemotaxis. Second, self-movement emerges from a simple meta-bolic system with a self-generated boundary.
Regarding the first point, we demonstrated that a round cell climbed the gradient of the SUBSTRATE,but a sharp cell could not. But we also noticed that a round cell showed a large fluctuation of motionand chemotaxis appeared as a disposition of the cell. This is because a cell has no sensory organs onthe membrane, but by creating an asymmetrical internal fluctuation of particles, it behaves as if itcould perceive the environment. In this sense, the geometry of a membrane shape controls sensitivityto the environment. This geometry-induced fluctuation is the source of fluctuation of motion, whichwe think is tightly linked with the idea of biological autonomy.
There is empirical evidence to support the above conclusions. It has been found that by pushing thecytoplasm of a cell, one can elicit directional locomotion [20]. The asymmetrical change of a boundaryshape causes polarization of actin and myosin fragments, and their interaction causes a straightforwardmotion. This internal polarization of chemicals is similar to our observation. In both their case and ourmodeling, a kind of internal bias is necessary for breaking symmetry to cause self-movement.
We have put forward a novel view of chemotaxis. If we take chemotaxis as an automatic entrain-ment between the internal state of a cell and the external chemical gradient, we can’t claim it is basedon biological autonomy. That is, if a cell always climbs up the gradient, the cell’s behavior is uniquelydetermined by the environmental condition, and we see no autonomy here. In order to ground theself-movement as a property of a life system, we should consider variations and fluctuations of thebehavioral pattern associated with the self-movement. By identifying different behaviors in the sameconditions, or the same behaviors in different conditions, we can distinguish self-movement from ex-ternally driven (i.e., passive) motion. Therefore, we expect a valid simulation of autonomous chemo-taxis to show how a pattern of chemotaxis fluctuates and how a rigid sensory-motor coupling relaxes.We thus study the nature of chemotaxis by controlling the balance between the internal dynamics andthe membrane shape.
As for the second point, we demonstrated an abstract cell system that is both self-maintained andcapable of self-movement. In previous work [14], we demonstrated that an autopoietic cell could moveby continuously self-repairing the membrane, but failed to show any gradient-climbing behavior. Thismay be due to the fact that the autopoietic cell can only survive in a narrow range of the environmentalSUBSTRATE density. Compared with that autopoietic cell model, in this study we used a more stablecell that never loses its membrane. Thus, the new cell can survive in a wider range of SUBSTRATEdensities, but not in all environments. A cell membrane shrinks into the minimal loop and stack.
In view of the importance of a stable membrane, we contend that a kind of homeostasis is a basisfor self-movement. Homeostasis is due to a self-regulating system that sustains a membrane byinternal chemical processes. Homeostasis isn’t simply preserving cell identity; it also promotes self-movement with minimal cognitive behaviors. We argued in [6] that the transition from homeostaticself (self maintained statically) to homeodynamic self (self dynamically sustained) emphasizes the po-tentiality of homeostasis.
Artificial Life Volume 15, Number 168

Shapes and Self-Movement in Protocell SystemsK. Suzuki and T. Ikegami
A self-moving oil droplet is an empirical example of a homeodynamic system [15, 3]. An oil dropletmainly made of an acid precursor shows autonomous, sustained movement through the aqueousmedium. Movement is induced through symmetry breaking and is sustained by a self-generated pHgradient inside the droplet that triggers a Marangoni instability and convection in the oil phase. As theresult, the oil droplet shows a directional movement and appears to sense the pH gradient.
There have been studies using chemical systems to manipulate a robot or agent, instead of usingneural networks [4, 9]. Diffusion-based couplings mediating sensor and motor devices are evolved inthese works. The ability to study the sensor and motor devices with a simple chemical system is a bigadvantage of this model. We do not need special devices for sensor and motor functions. Instead,the dynamics of the membrane work as the sensor and motor. In addition, because our model usessimple components and rules, our model can be implemented by simple homogeneous modulerobots, moving and connecting with each other. This will be a promising application of the SCLmodel in the field of distributed robotics (e.g. module robots displaying amoebic locomotion [7]).
To conclude, we have demonstrated at least a possible link between internal chemistry and mem-brane shape that sustains an adequate cell boundary, causing a whole cell to move randomly but alsopurposefully (chemotaxis). Our next challenge is to study the necessary condition for bootstrappingcomplex sensory-motor coupling from a simple homeodynamic system.
AcknowledgmentsThis work is partially supported by the 21st Century COE (Center of Excellence) program (ResearchCenter for Integrated Science) of the Ministry of Education, Culture, Sports, Science, and Technology,Japan, and the ECAgent project, sponsored by the Future and Emerging Technologies program of theEuropean Community (IST-1940).
References
1. Bentley, K., & Clack, C. (2004). The artificial cytoskeleton for lifetime adaptation of morphology.In J. Pollack, M. Bedau, P. Husbands, T. Ikegami, & R. A. Watson (Eds.), Workshop proceedings of the9th International Conference on the Simulation and Synthesis of Living Systems (pp. 13–16).
2. Bottino, D., Mogilner, A., Roberts, T., Stewart, M., & Oster, G. (2002). How nematode sperm crawl.Journal of Cell Science, 115(2), 367–384.
3. Hanczyc, M. M., Toyota, T., Ikegami, T., Packard, N., & Sugawara, T. (2006). Chemistry at the oil-waterinterface: Self-propelled oil droplets. Journal of the American Chemical Society, 129(30), 9386–9391.
4. Husbands, P., Smith, T., Jakobi, N., & O’Shea, M. (1998). Better living through chemistry: Evolvinggasnets for robot control. Connection Science, 10(3–4), 185–210.
5. Hutton, T. J. (2004). A functional self-reproducing cell in a two-dimensional artificial chemistry.In J. Pollack, M. Bedau, P. Husbands, T. Ikegami, & R. A. Watson (Eds.), Artificial life IX: Proceedingsof the 9th International Conference on the Simulation and Synthesis of Living Systems (pp. 444–449). Cambridge,MA: MIT Press.
6. Ikegami, T., & Suzuki, K. (2007). From homeostatic to homeodynamic self. BioSystems, 91(2), 388–400.
7. Ishiguro, A., Shimizu, M., & Kawakatsu, T. (2006). A modular robot that exhibits amoebic locomotion.Robotics and Autonomous Systems, 54(8), 641–650.
8. Karakozova, M., Kozak, M., Wong, C. C., Bailey, A. O., Yates, J. R., Mogilner, A., Zebroski, H., &Kashina, A. (2006). Arginylation of beta-actin regulates actin cytoskeleton and cell motility. Science,313(5784), 192–196.
9. McHale, G., & Husbands, P. (2004). Quadrupedal locomotion: Gasnets, ctrnns and hybrid ctrnn/pnnscompared. In J. Pollack, M. Bedau, P. Husbands, T. Ikegami, & R. A. Watson (Eds.), Artificial life IX:Proceedings of the 9th International Conference on the Simulation and Synthesis of Living Systems (pp. 106–113).Cambridge, MA: MIT Press.
10. McMullin, B., & Varela, F. R. (1997). Rediscovering computational autopoieses. In P. Husband &I. Harvey (Eds.), Proceedings of the 4th European Conference on Artificial Life (pp. 38–47). Cambridge,MA: MIT Press.
11. McMullin, B., & Groß, D. (2001). Towards the implementation of evolving autopoietic artificial agents.In J. Kelemen & P. Sosik (Eds.), 6th European Conference on Artificial Life (pp. 440–443).
Artificial Life Volume 15, Number 1 69

Shapes and Self-Movement in Protocell SystemsK. Suzuki and T. Ikegami
12. Nishimura, S. I., & Sasai, M. (2004). Inertia of chemotactic motion as an emergent property in amodel of an eukaryotic cell. In J. Pollack, M. Bedau, P. Husbands, T. Ikegami, & R. A. Watson (Eds.),Artificial life IX: Proceedings of the 9th International Conference on the Simulation and Synthesis of Living Systems(pp. 410–414). Cambridge, MA: MIT Press.
13. Parent, C. A., & Devreotes, P. N. (1999). A cell’s sense of direction. Science, 284(5415), 765–770.
14. Suzuki, K., & Ikegami, T. (2004). Self-repairing and mobility of simple cell model. In J. Pollack,M. Bedau, P. Husbands, T. Ikegami, & R. A. Watson (Eds.), Artificial life IX: Proceedings of the 9th InternationalConference on the Simulation and Synthesis of Living Systems (pp. 421–426). Cambridge, MA: MIT Press.
15. Toyota, T., Tsuha, H., Yamada, K., Takakura, K., Ikegami, T., & Sugawara, T. (2006). Listeria-like motionof oil droplets. Chemistry Letters, 35, 708–709.
16. Uchida, K. S., Kitanishi-Yumura, T., & Yumura, S. (2003). Myosin ii contributes to the posteriorcontraction and the anterior extension during the retraction phase in migrating dictyostelium cells.Journal of Cell Science, 116(Pt. 1), 51–60.
17. Van Haastert, P. J., & Devreotes, P. N. (2004). Chemotaxis: Signalling the way forward. National Reviewof Molecular and Cell Biology, 5(8), 626–634.
18. Varela, F. R. (1979). Principles of biological autonomy. New York: North Holland.
19. Varela, F. R., Maturana, H. R., & Uribe, R. (1974). Autopoiesis: The organization of living systems,its characterization and a model. BioSystems, 5, 187.
20. Verkhovsky, A. B., Svitkina, T. M., & Borisky, G. G. (1999). Self-polarization and directional motilityof cytoplasm. Currrent Biology, 9, 11–20.
21. Yumura, S., & Fukui, Y. (1998). Spatiotemporal dynamics of actin concentration during cytokinesisand locomotion in dictyostelium. Journal of Cell Science, 111(15), 2097–2108.
22. Yumura, S., Mori, H., & Fukui, Y. (1984). Localization of actin and myosin for the study ofameboid movement in dictyostelium using improved immunofluorescence. Journal of Cell Biology,99(3), 894–899.
23. Iijima, M., & Devreotes, P. (2007). Temporal and spatial regulation of chemotaxis. Developmental Cell,3(4), 469–478.
Artificial Life Volume 15, Number 170