Embed Size (px)
Citation preview

Share of Children in the Assam Budget: An Analysis of the
Allocations 2004-05 to 2007-08
Pranami Garg
Madhumita Purkayastha
North Eastern Social Research Centre, Guwahati
And
HAQ: Centre for Child Rights, New Delhi
2008

© 2008, North Eastern Social Research Centre, Guwahati and HAQ Centre for Child Rights, New Delhi
Permission to produce any part of the project is required from:
North Eastern Social Research Centre
110, Kharghuli Road (1st floor)
Guwahati-781004, Assam, India
Telephone: 91-361-2602819
Telefax: 91-361-2732629 (Attn NESRC)
Email: [email protected]
www.creighton.edu/CollaborativeMinistry/NESRC
and
HAQ: Centre for Child Rights
208 Shahpur Jat
New Delhi 110049, India
Telephone: 91-11-26490136
Telefax: 91-11-26492551
www.haqcrc.org
Research Team
NESRC
Pranami Garg
Walter Fernandes
HAQ: Centre for Child Rights
Madhumita Purkayastha
Enakshi Ganguly Thukral
Supported by: Sir Dorabjee Tata Trust

Chapter 1: Introduction
Children are the present as well as the future assets of the nation. They comprise 42 per cent of
India’s population. They are the citizens of the country and are the adults of tomorrow but they continue to be
undervalued entities. They are often regarded as ‘not yet person’, ‘not yet knowing’ and ‘not yet responsible’.
The mandate of the Constitution of India and of the UN Convention on children is that every child should
have the right to life and well being, health care, nutritious food, clean water and shelter, protection from
conflict, neglect and injustice, education to acquire knowledge, develop confidence and enjoy opportunities.
Other rights included are free access to information and freedom of thought, expression, conscience, religion
and cultural identity.
India has reaffirmed these commitments by ratifying the UN Convention on the Rights of the Child in
1992 but these rights continue to be dreams to be realised in the future. It is largely because children are still
not a complete political entity in the true sense of the term. They are physically, mentally and economically
defenceless. Besides, the present era of globalisation where life is judged almost exclusively from a
commodity perspective, taking care of child rights at every stage has taken a back seat. Their marginalisation
takes a turn for the worse if a child is an orphan, destitute, homeless, child or bonded labourers, domestic
help, street child, or physically or mentally challenged. It is worse when such a child lives in a developing
country.
In 1992, the Government of India affirmed its commitment to the children through the ‘National Plan
of Action: A commitment to the Child’. Consequent upon it in 1999 the Government of Assam prepared a
State Plan of Action, setting out the specific goals for the survival, protection and development of Children.
Thus, it reaffirms the commitment of the State towards the cause of children. The plan also spells out the
strategies and details relating to the various activities for the implementation and achievement of the goals
endorsed by the state.
All commitments made in law and policy must be backed by implementation through programmes
and schemes that are further resourced through financial allocations. Regular analysis and monitoring of the
State Budget in so far as it makes specific and special allocations for the benefit of children, enables us, first
of all, to observe the match and mismatch between rhetoric and reality.
At the beginning of each (financial) year, (the) budget is the most important document, as resources
have to be raised to the extent indicated therein and these are to be applied for the desired purposes
indicated in the budget. When, however, the financial year is over, the accounts reflect the actual
implementation of the financial planning…the figures speak for themselves, much more than verbose
explanations…. (Ganguly 2000: 5).
Commitment to any section of the population in a country such as India is realised through budget
allocations made at the Union as well as State levels. It is, therefore, important to undertake an analysis of
both. Besides, in its objectives, the State Plan of Action 1999 has included a clause incorporating Child Rights
into the state laws, policies, plans and budgets. That makes the study of budgets more significant.
The present book is an attempt to examine the State’s concern for realising the rights of all children.

METHODOLOGY
Defining A Child
In consonance with the UN Convention on Child Rights (CRC) and The Juvenile Justice (Care and
Protection) Act, 2000, child in this study includes all persons in the 0-18 age group.
Study Period
The present analysis is for the Assam Budget 2004-05 to 2007-08 though its focus is on 2007-08.
Sources of Data
a) Detailed Demands for Grants: The estimates for expenditure are presented to the Assembly as Demands
for Grants. Generally one demand for Grants is presented for each Department. However, in case of large
Departments more than one demand is presented. The Demands for Grants are submitted to the Assembly
along with the Annual Financial Statement. The Detailed Demands for Grants follow these sometime after
the presentation of the Budget to the Assembly but before the discussion on Demands for Grants commences.
The Detailed Demands for Grants show further details of the provisions included in the Demands for Grants
and the actual expenditure during the previous year. Each Demand normally includes the total provisions
required for a service, that is, provisions on account of revenue expenditure, capital expenditure, grants to
autonomous councils and also loans and advances relating to the service.
b) Budget Estimates, Revised Estimates and Actual Expenditure: To understand budgets in India, one
must look at three levels in the budget-making process: Budget Estimates (BE), Revised Estimates (RE) and
Actual Expenditure (AE).
The Budget Estimates (BE) are prepared by the estimating authorities according to their assessment of
requirements for the ensuing year, keeping in view the actual expenditure of the past years, trend of
expenditure in the current year and the arrears of previous years.
The Revised Estimates (RE) of the current year are prepared before the Budget Estimates of the forthcoming
year. In other words, in a given financial year, both Revised Estimates for that year and Budget Estimates for
the next year are finalised. The former precedes the latter. The Revised Estimates are based on the latest
actuals during the current year, actuals for the same period in the preceding year, actuals during the past year
and also previous years, appropriations or re-appropriations already ordered or which are contemplated during
the remaining part of the year or, any sanction to expenditure already issued or proposed to be issued during
the remaining part of the year.
The Actual Expenditure (AE) figures are got only after the final accounts are submitted. The final accounts
of any given year are available to the public only two years after the given financial year.
The same pattern is followed in Assam. The estimates reflect the government’s intended and the actual
expenditure. An analysis of the changes that take place form one level to the other is quite revealing and
therefore necessary to understand any budget. The difference between the Estimates and the Actual
Expenditure shows how much of the budget has been spent in a given financial year. This study does not go
into the reasons for under-utilisation/non-spending of the budgets. It concentrates only on the budget as a
commitment to children and the trends arising thereof.
c) Plan and Non-Plan: The analysis has covered both the plan and non-plan allocation and expenditure of the
Government on various programmes. Plan allocation and expenditure are those, which are planned for in the
Five-Year Plans. These are subsequently divided into yearly plans. The plan component of allocation is to be
utilised within the time period set by the plan. If, however, the schemes or programmes extend beyond the
time provided for in the Plan, then the further expenditure to be incurred on the project is categorised as non-
plan expenditure.
d) General and Sixth Schedule: Assam is unique in having North Cachar Hills and Karbi Anglong districts
as its Sixth Scheduled areas. In addition, the six districts under the Bodo Territorial Council come under a

modified form of the Sixth Schedule. The rest of Assam is considered general area. The State Budget reflects
special allocations for the Sixth Schedule areas. Along with the General areas the State government presents a
separate statement of receipt and expenditure for these areas. Therefore, allocations for both the areas have
been taken into consideration.
Sectors
The four basic rights of children according to CRC include the right to survival, development,
protection and participation. While schemes or programmes addressing the right to participation are yet to
find a place in the Government of India’s mandate, several schemes in the social sector fall within the ambit
of the other three rights. The State Budget of Assam also follows a similar trend. For purposes of the present
analysis, all the existing programmes and schemes of the Government of Assam involving children have been
clubbed under four heads:
Development: Includes programmes and schemes for early childhood care and education; and other general
schemes and programmes that do not fit into any particular sector, but are aimed at the overall development of
children.
Health: Includes programmes and schemes related to the health care needs of children. Given that a number
of health services for children are part of the larger health programmes, it is really difficult to identify those
that are specifically for children. Programmes like reproductive child health (RCH) and child and maternal
care (MCH) are both for the mother and the child. In such cases we take the total allocation for the
programmes, as it is difficult to disaggregate the allocations only for children, thereby erring on the side of
excess.
Education: Includes elementary and secondary education. Also allocations for schemes like technical, non-
formal and special education for handicapped children are included in these two broad categories.
Protection: Includes interventions aimed at disadvantaged children i.e. child labourers, children in need of
adoption, child sex-workers, physically or mentally challenged children, homeless or street children,
neglected children or those who are treated as juvenile delinquents.
Challenges:
The study also poses certain challenges and complications. An effort was made to resolve them,
particularly the following:
• The very first challenge came in the form of the budget documents of the state. The documents
presented by the Finance Minister (at present this portfolio is held by the Chief Minister himself) are
very confusing. The Budget document of Assam generally contains two separate sections on
allotment for the General and for the Sixth Schedule areas. Though the allocations for the Sixth
Schedule did exist in the preceding few years’ they are absent in the budget for 2007-08. Since the
reasons for it were not clear to us, after discussion with officials and economists, we resorted to the
budget documents of the autonomous councils for the allocation made for the Sixth Scheduled areas.
This sudden failure to show the allocations to the Sixth Scheduled areas remained unclear to us.
• The second obstacle is that the figures given by different documents accompanying demands for
grants do not tally at times. For example, the figures given by ‘Summary of Financial Position’ and
‘Annual Statement of Accounts’ for 2006-07 are different.
• The third obstacle came with the absence of Annual Reports and Programme documents in most
departments though they are essential for the selection of programmes for analysis.
• Non-availability of accounts of certain schemes was another constraint. Lack of proper maintenance
of documents and lack of transparency were also observed during the study.
• For getting the information required we had to file applications under the Right to Information (RTI).
But the departments concerned took the longest possible time to reply and their replies were not
always convincing. So we had to file two or three applications under RTI with the same department.
• Because of it we also had to depend on personal meetings with officials. That delayed the process
further since the official concerned was not always available. Some of those who were available were
not willing to part with the information required.

• The Assam State Budget allocation for the Social Sector is not very clear. The Economic Survey of
the state gives some data under the head called Social and Community Services. It also deals with the
Social Sector separately, which includes an additional programme called the Char Areas
Development Programme. It is, therefore, not quite clear which can be considered the exact allocation
for the social sector. Since the Government has included the Social and Community Services in its
main chapter on the distribution of resources, the study too has taken this figure.
Chapter 2: Budget for Children in the Assam Budget: An Overview
The Status of Children in Assam
• There are 1,25,81,135 children in Assam (0-19 yrs) according to Census 2001. They are 47.2 percent
of the State population (Calculated from Director of Economics and Statistics 2006: 35). The number
of children in the age group of 0-14 years is 99,70,342 or 37.4 per cent of the State’s population
(Director of Economics and Statistics, 2006: 35). Based on it one can put the number of children in
the 0-18 age group which is the subject of the present study, at 43.3 per cent i.e. 1,20,58,976 or whom
69,36,344 would be in the 6-14 age group.
• The 0-14 age group has more male (50,95,495) than female children (48,74,847). So the sex ratio in
this age group is 957. It was 967 in the 0-6 age group in 2001 against 975 in 1991 (Director of
Economics and Statistics 2006: 7). Thus, there is a slight decline in the sex ratio. The reasons for it
are not very clear. The decline is not as sharp as in the prosperous states of Punjab, Haryana and some
districts of Gujarat, Maharashtra and Tamil Nadu where it is dowry-related (Bose 2001: 46). One
does not know whether it is because dowry has entered Assam in a stronger form or because of other
reasons such as poor health status. In case of the former, there may even be female foeticide.
• Both the birth rate and the infant mortality rate (IMR) of Assam are higher than those of India as a
whole. The birth rate was 27 in 2001 against 25.4 in India as a whole. It declined to 25 in Assam in
2005 but it has come down to 23.8 in India as a whole (Director of Economics and Statistics 2006: 9).
• IMR in the state was 74 per 1,000 in 2001 against the All India rate of 67. It declined to 68 in 2005
against 58 in the country (Director of Economics and Statistics 2006: 9). Thus the Assam IMR was 10
percent higher than the All India average in 2001 and 17 percent in 2005.
• According to Sarba Shikshya Abhijan (ASSAM 2002) 13.4 lakhs or 24.39 percent of the children in
the 6-14 age group were out of school in 2001. A separate study shows 43 per cent of the present and
past tea garden labourers are out of school (Fernandes, Barbora and Bharali 2003).
• Assam has the highest incidence of child abuse in India (Ministry of Women and Child Development
2007: 78).
The State Budget for Children
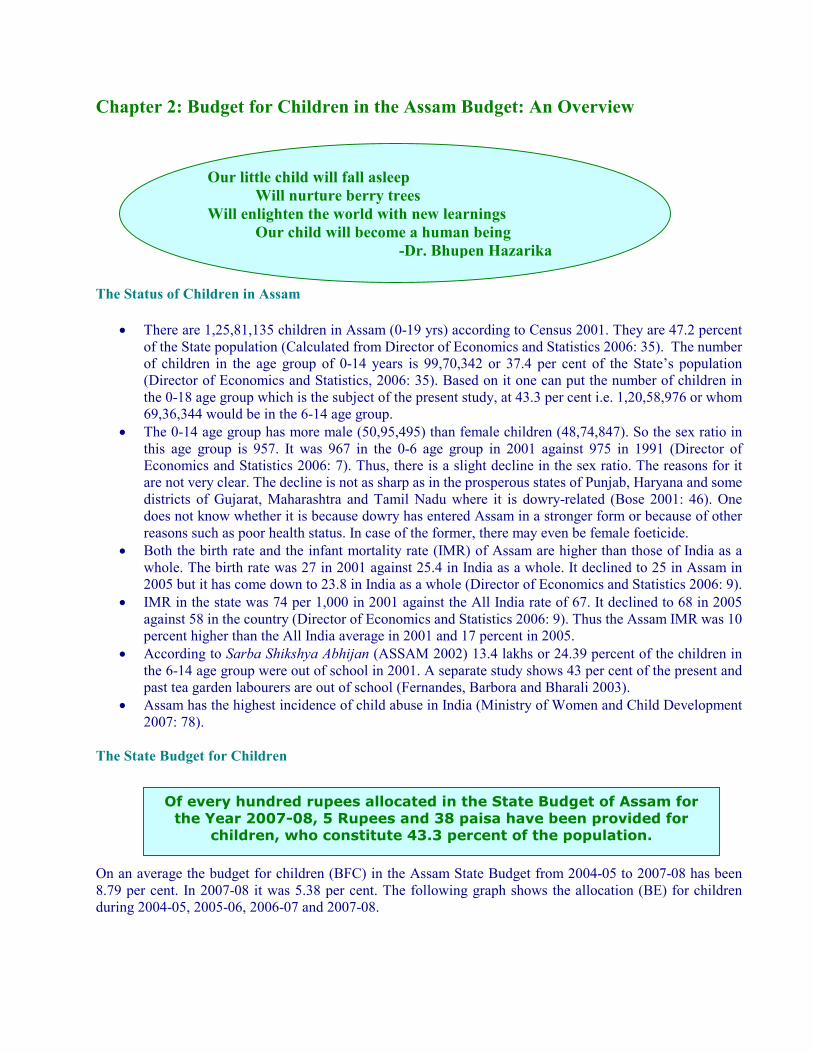
On an average the budget for children (BFC) in the Assam State Budget from 2004-05 to 2007-08 has been
8.79 per cent. In 2007-08 it was 5.38 per cent. The following graph shows the allocation (BE) for children
during 2004-05, 2005-06, 2006-07 and 2007-08.
Our little child will fall asleep
Will nurture berry trees
Will enlighten the world with new learnings
Our child will become a human being
-Dr. Bhupen Hazarika
Of every hundred rupees allocated in the State Budget of Assam for the Year 2007-08, 5 Rupees and 38 paisa have been provided for
children, who constitute 43.3 percent of the population.
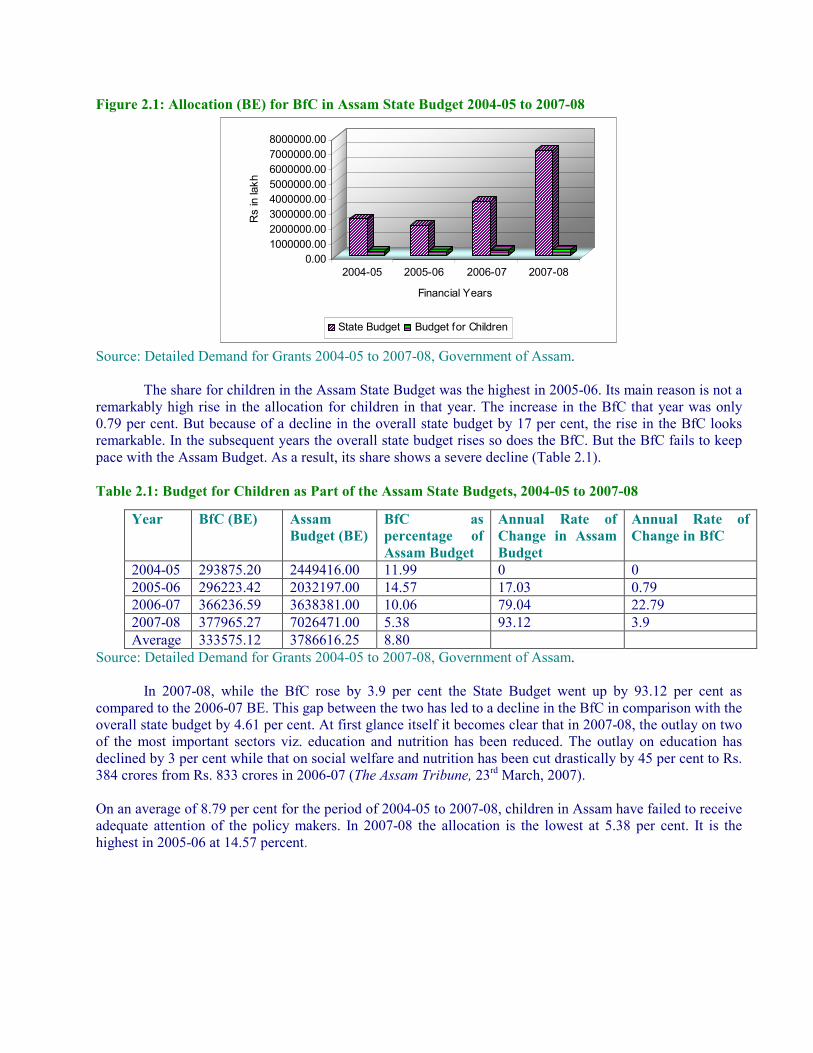
Figure 2.1: Allocation (BE) for BfC in Assam State Budget 2004-05 to 2007-08
0.00
1000000.00
2000000.00
3000000.00
4000000.00
5000000.00
6000000.00
7000000.00
8000000.00
Rs in
lakh
2004-05 2005-06 2006-07 2007-08
Financial Years
State Budget Budget for Children
Source: Detailed Demand for Grants 2004-05 to 2007-08, Government of Assam.
The share for children in the Assam State Budget was the highest in 2005-06. Its main reason is not a
remarkably high rise in the allocation for children in that year. The increase in the BfC that year was only
0.79 per cent. But because of a decline in the overall state budget by 17 per cent, the rise in the BfC looks
remarkable. In the subsequent years the overall state budget rises so does the BfC. But the BfC fails to keep
pace with the Assam Budget. As a result, its share shows a severe decline (Table 2.1).
Table 2.1: Budget for Children as Part of the Assam State Budgets, 2004-05 to 2007-08
Source: Detailed Demand for Grants 2004-05 to 2007-08, Government of Assam.
In 2007-08, while the BfC rose by 3.9 per cent the State Budget went up by 93.12 per cent as
compared to the 2006-07 BE. This gap between the two has led to a decline in the BfC in comparison with the
overall state budget by 4.61 per cent. At first glance itself it becomes clear that in 2007-08, the outlay on two
of the most important sectors viz. education and nutrition has been reduced. The outlay on education has
declined by 3 per cent while that on social welfare and nutrition has been cut drastically by 45 per cent to Rs.
384 crores from Rs. 833 crores in 2006-07 (The Assam Tribune, 23rd March, 2007).
On an average of 8.79 per cent for the period of 2004-05 to 2007-08, children in Assam have failed to receive
adequate attention of the policy makers. In 2007-08 the allocation is the lowest at 5.38 per cent. It is the
highest in 2005-06 at 14.57 percent.
Year BfC (BE) Assam
Budget (BE)
BfC as
percentage of
Assam Budget
Annual Rate of
Change in Assam
Budget
Annual Rate of
Change in BfC
2004-05 293875.20 2449416.00 11.99 0 0
2005-06 296223.42 2032197.00 14.57 17.03 0.79
2006-07 366236.59 3638381.00 10.06 79.04 22.79
2007-08 377965.27 7026471.00 5.38 93.12 3.9
Average 333575.12 3786616.25 8.80

Fig 2.2: BfC as percentage of Assam Budget average allocation 2004-05 to 2007-08
8.79
91.21
BfC Other sectors
Source: Detailed Demand for Grants 2004-05 to 2007-08, Government of Assam.
Table 2.2: BE, RE and AE in BfC, Assam Budgets 2004-05 to 2007-08
Source: Detailed Demand for Grants 2004-05 to 2007-08, Government of Assam.
Note: Figures for AE of 2006-07 and RE and AE of 2007-08 will come only with the budget of 2008-09.
Hence could not be calculated
Table 2.3: Difference between BE, RE and AE in BfC, Assam Budget, 2004-05 to 2007-08
Years RE-BE
(in lakh)
RE-BE (per
cent)
AE-RE
(in lakh)
AE-RE
(per cent)
AE-BE
(in lakh)
AE-BE
(per cent)
2004-05 -78207.67 -26.61 19662.16 9.11 -58545.51 -19.92
2005-06 23384.87 7.89 -85131 -26.63 -61746.36 -20.84
2006-07 8166.62 2.24
Source: Detailed Demand for Grants 2004-05 to 2007-08, Government of Assam.
Note: Figures for AE of 2006-07 and RE and AE of 2007-08 will come only with the budget of 2008-09.
Hence could not be calculated.
Figure 2.3 shows that within BFC, the Revised Estimate was less than the Budget Estimate in 2004-05 but
was more in the subsequent years till 2006-07. However, in 2006-07 the rise of RE over BE (2.24%) was less
than that of 2005-06 (7.89%).Thus, the trend of rise in the RE over BE is showing a decline. At the same time
the Actual Expenditure (AE) is 19.92 per cent less than the BE but 9.11 per cent more than the RE in 2004-05
as there was a downward revision. In 2005-06 the AE was 20.83 per cent less than the BE. Despite the
upward revision it was 26.63 per cent less than the RE. Thus the spending on children in Assam in 2004-05
and 2005-06 on an average was 20.38 per cent lower than what was budgeted for. Despite the need the State
felt to raise the allocation during the year, the spending has been lower than the BE. The BE of 2005-06 was
more than the BE and RE of 2004-05 by 0.79 per cent and 37.35 per cent while the BE of 2006-07 was 22.79
per cent and 13.81 per cent respectively more than the BE and RE of 2005-06. This trend continues in 2007-
08 too as the BE in 2007-08 is more than the BE and RE of 2006-07 by 3.91 per cent and 1.63 per cent
respectively.
Year BE RE AE
2004-05 293875.20 215667.53 235158.80
2005-06 296223.42 319592.33 234438.18
2006-07 366236.59 371803.21
2007-08 377965.27

Fig. 2.3: Year wise spending pattern of BfC in the Assam Budget 2004-05 to 2007-08
-26.61
9.11
-19.92
7.89
-26.63
-20.84
2.24
-30
-25
-20
-15
-10
-5
0
5
10
Diff
ere
nce in
Per
centa
ge
2004-05 2005-06 2006-07
Financial Years
RE-BE (per cent) AE-RE(per cent) AE-BE(per cent
Source: Detailed Demand for Grants 2004-05 to 2007-08, Government of Assam.
Note: Figures for AE of 2006-07 and RE and AE of 2007-08 will come only with the budget of 2008-09.
Hence it could not be calculated
Table 2.4: Sectoral Allocation (BE) in BfC as Percentage of the State Budget
Fig 2.4 shows the allocations
for children under the four
sectors as percentage of the
Assam State Budget 2007-
08.Fig 2.5 represents the
allocation by sector on children
in the Budget for Children in
Assam. There is a fluctuating
trend in the allocation for
different sectors within the BfC. The allocation for development in 2007-08 shows a sharp decline of 75.4 per
cent compared to 2006-07. However, the trend in education, health and protection is positive.
Fig 2.4: Sectoral Allocation (BE) in percentage of BfC of within Assam Budget 2007-08
5.1
94.62
0.16
0.110.01
Education Health Development Protection Other Sectors
Source: Detailed Demand for Grants 2004-05 to 2007-08, Government of Assam.
Year Education Health Development Protection
2004-05 11.12 0.07 0.79 0.01
2005-06 13.14 0.08 1.31 0.04
2006-07 8.61 0.21 1.22 0.01
2007-08 5.10 0.11 0.16 0.01
Source: Detailed Demand for Grants 2004-05 to 2007-08, Government
of Assam.

Fig.2.5: Sectoral Allocation in BfC in Assam State Budget 2007-08
94.9
2.12.9
0.1
Education Health Development Protection
Source: Detailed Demand for Grants 2004-05 to 2007-08, Government of Assam.
Table 2.5: Sectoral Allocation (BE) as percentage of BfC Assam State Budget It is clear from the figures that of all
the sectors of BfC, only education has
been given some importance by the
Government of Assam. The other
sectors combined do not cover even
0.5 per cent of the Assam Budget but
education has taken 5.1 per cent of
the share. Also the analysis within the
BfC proves the same. It is clear that
the educational sector has occupied
94.9 per cent of the BfC in the Assam
Budget of 2007-08 followed by
development and health. Protection shows the lowest allocation with just 0.1 per cent.
Year
BfC
Sectoral Allocation (BE) in Percentage of BfC
of the Budget
(BE)
(in Lakh) Education Health Development Protection
2004-05 293875.20 92.71 0.56 6.63 0.09
2005-06 296223.42 90.18 0.53 8.98 0.30
2006-07 366236.59 86.18 2.14 12.18 0.09
2007-08 377965.27 94.86 2.12 2.90 0.11
Source: Detailed Demand for Grants 2004-05 to 2007-08, Government of
Assam

Chapter 3: Development
In the Development sector, allocations for the schemes meant for early childhood care and development and
some other schemes for children’s all round development have been studied. Programmes like Nutrition,
ICDS etc have been included in this sector. In this section, the scene of child development in the state has
been discussed in the light of existing programmes and allocation made for them.
The share of Development in the Assam Budget 2007-08 is only 0.16 per cent while it is 2.9 per cent of the
BfC. In this sector, it was perceived that there was a continuous rise in allocation since 2004-05 to 2006-07
both at the BE and the RE stages. The BE in 2005-06 was higher than the BE and RE of 2004-05 by 36.42
and 6.09 per cent. The same trend was also followed in 2006-07 as the BE this year was higher than the BE
and RE of 2005-06 by 67.86 and 0.72 per cent. However, this trend did not continue in 2007-08. In 2007-08,
allocation for development shows a sharp decline of 75.4 per cent compared to the previous year. The actual
expenditure has, however, been lower in both 2004-05 and 2005-06.
Fig 3.1: Share of Development Sector of BFC in Assam State Budget during 2007-08
99.84
0.16
State Budget Development
Source: Detailed Demand for Grants 2004-05 to 2007-08, Government of Assam.
A decline of 81.39 per cent has been observed in the allocation made towards the Integrated Child
Development Scheme (ICDS) in 2007-08. From 2004-05 to 2006-07 ICDS constitutes on an average 86.78
per cent of the allocation for development. The decline in 2007-08 has been in administrative expenses like
salaries and others, construction of anganwadi centres (AWC), materials, supplies and other charges,
supplementary nutrition programme, grant in aid etc. It appears from the detailed Demand for Grants that
there is no allocation for the administrative expenses of ICDS in 2007-08. In 2006-07 there were 196 ICDS
projects functioning and 23 more were being set up (Director of Economics and Statistics 2006:193). Here
arises the question of how these centres will be financed.
To keep aggregate expenditure down to a manageable level in the face of huge budgetary gap, the
Chief Minister has taken to an expenditure cut amounting to Rs 1128 crore in his Budget plan. The axe
has naturally fallen mostly on the softer option, the social sector development, where we find the
Budget allocation declining by as much as 45 per cent to social welfare and nutrition from Rs 833 crore
in the current year to Rs 384 crore in 2007-08.
-Dr. Rabindra Kr Choudhury, former Head Of Department, Department of Economics,
Gauhati University commenting on the Assam State Budget 2007-08
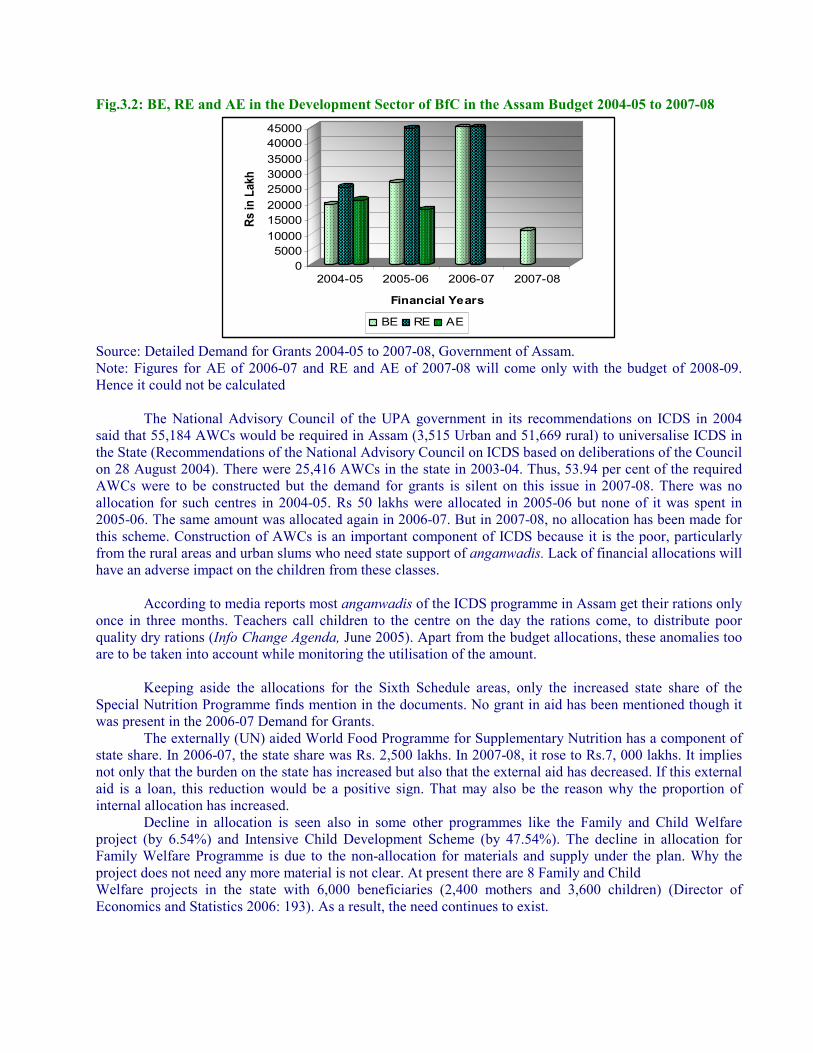
Fig.3.2: BE, RE and AE in the Development Sector of BfC in the Assam Budget 2004-05 to 2007-08
0
5000
10000
15000
20000
25000
30000
35000
40000
45000
Rs in Lakh
2004-05 2005-06 2006-07 2007-08
Financial Years
BE RE AE
Source: Detailed Demand for Grants 2004-05 to 2007-08, Government of Assam.
Note: Figures for AE of 2006-07 and RE and AE of 2007-08 will come only with the budget of 2008-09.
Hence it could not be calculated
The National Advisory Council of the UPA government in its recommendations on ICDS in 2004
said that 55,184 AWCs would be required in Assam (3,515 Urban and 51,669 rural) to universalise ICDS in
the State (Recommendations of the National Advisory Council on ICDS based on deliberations of the Council
on 28 August 2004). There were 25,416 AWCs in the state in 2003-04. Thus, 53.94 per cent of the required
AWCs were to be constructed but the demand for grants is silent on this issue in 2007-08. There was no
allocation for such centres in 2004-05. Rs 50 lakhs were allocated in 2005-06 but none of it was spent in
2005-06. The same amount was allocated again in 2006-07. But in 2007-08, no allocation has been made for
this scheme. Construction of AWCs is an important component of ICDS because it is the poor, particularly
from the rural areas and urban slums who need state support of anganwadis. Lack of financial allocations will
have an adverse impact on the children from these classes.
According to media reports most anganwadis of the ICDS programme in Assam get their rations only
once in three months. Teachers call children to the centre on the day the rations come, to distribute poor
quality dry rations (Info Change Agenda, June 2005). Apart from the budget allocations, these anomalies too
are to be taken into account while monitoring the utilisation of the amount.
Keeping aside the allocations for the Sixth Schedule areas, only the increased state share of the
Special Nutrition Programme finds mention in the documents. No grant in aid has been mentioned though it
was present in the 2006-07 Demand for Grants.
The externally (UN) aided World Food Programme for Supplementary Nutrition has a component of
state share. In 2006-07, the state share was Rs. 2,500 lakhs. In 2007-08, it rose to Rs.7, 000 lakhs. It implies
not only that the burden on the state has increased but also that the external aid has decreased. If this external
aid is a loan, this reduction would be a positive sign. That may also be the reason why the proportion of
internal allocation has increased.
Decline in allocation is seen also in some other programmes like the Family and Child Welfare
project (by 6.54%) and Intensive Child Development Scheme (by 47.54%). The decline in allocation for
Family Welfare Programme is due to the non-allocation for materials and supply under the plan. Why the
project does not need any more material is not clear. At present there are 8 Family and Child
Welfare projects in the state with 6,000 beneficiaries (2,400 mothers and 3,600 children) (Director of
Economics and Statistics 2006: 193). As a result, the need continues to exist.

Fig.3.3: Share of Development Sector in BfC of Assam Budget, 2007-08
Development Other sectors of BfC
Source: Detailed Demand for Grants 2004-05 to 2007-08, Government of Assam.
There is a 7.19 per cent rise in the allocation for Balwadi programmes. The allocation for the general
areas has increased by 18.72 per cent and it is under the non-plan category while a 24 per cent decline has
been observed in the allocation for the Sixth Schedule areas. Transfer of planned expenditures to the non-plan
category is the reason for it. On one hand it implies a higher state burden. On the other it reflects sustenance
of the programme without Central Government support. The State at present has 60 Balwadis with 2,400
children (Director of Economics and Statistics 2006: 193). It is obvious then that the State needs more of
them.
In the budget documents of all four years, a programme called Applied Nutrition was found but with
no allocation. The reason for mentioning a programme without any allocation is not clear
Summary:
The share of development in the Assam budget, 2007-08 is very small i.e. only 0.16 per cent. It is 2.9 per cent
of the BfC. The trend of higher BE and RE for child development over that of previous years has not been
followed in 2007-08. It has sharply declined by 75.4 per cent. This decline is attributed to a decline in major
schemes like ICDS, Family and Child Welfare and Intensive Development Scheme. ICDS which comprises
86.78 per cent of the allocation for development has shown the severest decline (81.39 per cent) while the
Family Welfare Project and Intensive Child Development Scheme have followed with 6.54 and 47.54 per
cent. In view of the observation that only 46.06 per cent of the required Anganwadi centres have been set up
in the state, the reduced allocation for the same has become a subject of concern. However, there is also
change on the positive side. Allocation has increased in 2007-08 to schemes like Food Programme for
Supplementary Nutrition and Balwadi programmes. In addition, a scheme called Applied Nutrition has been
mentioned in the budget but it has remained without any allocation.

Chapter 4: Health
This sector includes programmes and schemes related to the health care needs of children. In this
sector all those schemes have been included which are directly or indirectly related to children’s health in the
state. Also programmes like Reproductive Child Health (RCH) and Child and Maternal Care (MCH), which
are both for the mother and the child are included in the study
The allocation for children in the health sector in 2007-08 (BE) has increased by 3.06 per cent over
2006-07. But the share of the budget for child health remained at a poor 0.11 per cent of the overall state
budget. Even within the BfC, its share is a small 2.12 per cent.
Fig.4.1: Allocation for Health Sector in BfC as percentage of Assam State Budget, 2007-08
99.89
0.11
State Budget Health Sector
Source: Detailed Demand for Grants 2004-05 to 2007-08, Government of Assam.
Fig.4.2: Share of the Health Sector in BfC of Assam Budget, 2007-08
97.88
2.12
Health Other Sectors of BfC
Source: Detailed Demand for Grants 2004-05 to 2007-08, Government of Assam.
Reiterating the Government’s “commitment” towards ushering in drastic changes in the
healthcare sector, Chief Minister Tarun Gogoi said that definite steps had been taken to
implement the the health care related schemes under the National Rural Health Care Mission
on a wide scale in the sState. (The Assam Tribune 19th March,2007)

Between 2004-05 and 2007-08, the heath sector of BfC has seen a 79.59 per cent rise in allocation
which is a positive sign. In 2004-05, the actual expenditure has increased over the BE by 43.73 per cent.
Whereas in 2005-06 the actual expenditure was less than the BE by 16.91 per cent. However the RE in all the
three years was higher than the BE.
Fig.4.3 BE, RE and AE in Health sector of BfC in Assam (2004-05 to 2007-08)
0
1000
2000
3000
4000
5000
6000
7000
8000
9000
2004-05 2005-06 2006-07 2007-08
BE RE AE
Source: Detailed Demand for Grants 2004-05 to 2007-08, Government of Assam.
Note: Figures for AE of 2006-07 and RE and AE of 2007-08 will come only with the budget of 2008-09.
Hence it could not be calculated
The state as a whole has very few schemes for child health. The major schemes are centrally
sponsored. In fact, the National Rural Health Mission (NRHM) has taken all major schemes into its fold.
Table 4.2 gives details of schemes in the health sector of BFC in the Assam Budget.
In the School Health Scheme, the allocation has increased by 3.5 per cent over the previous year. All the
salary, which used to be divided between the plan and non-plan sectors has been included in the non-plan
sector during 2007-08. This transfer from the plan to non-plan sector seems to be one of the reasons for the
rise.
A 17.68 per cent rise is also seen in the scheme of Immunisation of Infants and Children against
diphtheria, polio, typhoid etc. This increase is due to a rise in salaries and other administrative expenses. No
rise is noticed in materials and supplies.
Increase in the allocation for centrally sponsored schemes like postpartum centres and training of auxiliary
nurse midwives (ANM) is a positive sign. However, there is doubt about their continuity since no non-plan
expenditure has been mentioned for these programmes. Besides, though the total budget for training ANMs
and Trained Birth Attendants (TBA) has increased, that for the Sixth Schedule areas has decreased by 34.81
per cent.
Only four state schemes even with a rise in allocations are not enough in a state where IMR and birth
rates are higher than the national average. In the Child Health sector, too much dependence is visible on
centrally sponsored schemes. That can pose a threat to the sustenance of the scheme. If the Centre changes its
policy or fails to allocate funds for it, overall child health in the state will suffer.
Summary:
Though the allocation for children in the health sector in 2007-08 (BE) has increased by 3.06 per cent
over that of 2006-07, the share of the budget for child health remains at a poor 0.11 per cent of the overall

state budget. Within the BFC, its share is a small 2.12 per cent. However, the allocation for child health has
been following a rising trend. Between 2004-05 and 2007-08 it has increased by 79.59 per cent. But the health
sector of the children in the state has been looked after by the major Central Sector Scheme of NRHM.
Among the schemes mentioned in the Assam budget 2007-08, rise has been observed in the School Health
Scheme, Immunisation of Infants & Children against diphtheria, polio, typhoid etc and training of ANMs and
TBAs. In the two years for which figures of actual expenditure are available, it was higher in 2004-05 but
lower in the following year. The revised allocation was higher than the BE in all the past four years.

Chapter 5: Education
The Education sector encompasses within its ambit elementary and secondary education involving the
children of 6-18 years. The allocations for schemes like technical, non-formal and special education for
handicapped, SC, ST and OBC children too are included in these two broad categories.
Education receives the largest share of the allocations both within the total state budget (5.1%) and in the BfC
in Assam (94.86%). While this shows the priority that the state government accords to education, this must be
set against the 30 lakhs children (0-18 years) who continue to be out of school.
Fig. 5.1: Allocation for the Education Sector of BfC as percentage of Assam State Budget, 2007-08
5.1
94.9
Education State Budget
Source: Detailed Demand for Grants 2004-05 to 2007-08, Government of Assam.
There is a marginal increase of 0.02 per cent in 2007-08 over the previous year. This increase is due
to nominal increase in the allocation for all the schemes. Of the allocation for education, 83 per cent goes to
salaries and other administrative expenses. Scholarships account for only 0.1 per cent of the budget while
textbooks have a 0.001 per cent share in the allocations for the education of children.
In the major scheme of Sarba Shikhya Abhijan (SSA) huge allocations were made in 2004-05 and 2005-06.
But suddenly in 2006-07, allocations declined by 98.3 per cent and no allocation has been made in the 2007-
08 BE. Besides, the actual expenditure in both the years for which information is available, is lower than the
allocations (BE). There has been no expenditure under SSA for the years 2004-05 and 2005-06. However, as
per the Annual reports of SSA, Rs.24,965.4 lakh and Rs. 22,714.55 lakhs have been spent during 2004-05 and
2005-06 respectively. So there is a possibility of lack of documentation.
“The announcement of two new scholarships for poor and physically challenged students, …….special
library grants to colleges and government aided schools are remarkable features of the budget.
Distribution of computers to students getting first division in High School Leaving Certificate
Examination has become a regular feature of the present government.”
-Dr. Subhrangshu Sekhar Sarkar, Faculty Member, Department of Management, Tezpur University,
Assam commenting on the Assam State Budget 2007-08

Fig. 5.2: BE, RE and AE in Education sector of BfC in Assam 2004-05 to 2007-08
0
50000
100000
150000
200000
250000
300000
350000
400000
2004-05 2005-06 2006-07 2007-08
BE RE AE
Source: Detailed Demand for Grants 2004-05 to 2007-08, Government of Assam.
Note: Figures for AE of 2006-07 and RE and AE of 2007-08 will come only with the budget of 2008-09.
Hence it could not be calculated
Fig 5.3: Share of Education Sector in BfC of Assam Budget, 2007-08
94.9
5.1
Education Other Sectors of BfC
Source: Detailed Demand for Grants 2004-05 to 2007-08, Government of Assam.
There is no allocation in 2007-08 for non-government schools and for the government teachers
serving in non-government schools. The reason for this sudden non-allocation is not clear. Another trend is
increasing allocation for salaries in the non-plan sector for the administration of elementary education. This is
largely due to transfer of teachers’ salaries and emoluments from the plan to the non-plan sector.
In his Budget Speech, Chief Minister, Tarun Gogoi mentioned that at present the Government of
Assam is running four schemes as Chief Minister’s Innovative schemes. These schemes will continue even
during 2007-08 though no specific mention has been made in the budget documents. They are:
1. Rajiv Gandhi Computer Literacy Programme
2. Ananda Ram Baruah Memorial Award for the first division holders in the High School Leaving Certificate Examination.
3. Gyanjyoti Scheme and
4. Buniyad Scheme for infrastructure development of Schools.

As per the NCERT All India School Education Survey, the State has 30,045 primary schools. 5,413
of them are single teacher schools and 313 are without a teacher (www.ncert.org). 4,838 schools are run in
katcha buildings and 514 are without a building. Amid these findings, the Buniyad scheme for infrastructure
development has brought some hope of reducing the drop out rate and making education accessible to more
children. The Government of Assam has been implementing centrally sponsored schemes like Sarba Shikhya
Abhijan and the Mid-Day Meal scheme. The State government has neither started such schemes of its own to
supplement the Central efforts nor has it allocated funds for SSA in 2007-08. Besides, in the process of
implementing these schemes anomalies have come to light and the media have highlighted some of them.
Even the CAG report (Report 15 of 2006) mentions huge amounts of money spent on items not permitted in
the SSA budget. That may make the attainment of the objectives of the scheme difficult.
Last but not the least; the 2007-08 budget has made specific allocations for handicapped and for SC,
ST and OBC children. But all of them taken together account for only 1.59 per cent of the total allocations
made for child education.
Summary:
The chapter reveals that the largest share of the BFC goes to the sector of education. It attributes 5.1
per cent to the State budget as a whole. This implies higher priority accorded to child education. The rise in
2007-08 as compared to 2006-07 is a marginal 0.02 per cent. The major scheme in this sector is the centrally
sponsored Sarba Shikhya Abhijan. In this scheme, huge allocations were made in 2004-05 and 2005-06. They
declined suddenly by 98.3 per cent in 2006-07 and nothing is allocated in the 2007-08 BE. Lack of Proper
documentation and non-allocation are visible in 2007-08 for schemes like non-government schools and for the
government teachers serving in non-government schools. Some other anomalies like expenditure outside the
budget, non-utilisation of funds etc are also clear from sources. A relatively small amount is allocated for
handicapped, SC, ST and OBC children of the State.

Chapter 6: Protection
In this sector, the interventions aimed at the disadvantaged groups of children i.e. child labourers;
children in need of adoption; child sex-workers; physically or mentally challenged children; homeless or
street children; neglected children or those who are treated as juvenile delinquents are taken care of.
As in the national budget so also in the State budget the share of the allocation for the protection
sector within BfC receives the lowest priority. Despite a rise of 15.84 per cent in the BE of 2007-08 over that
of 2006-07, its share continues to be 0.01 of the total state budget and 0.11 per cent of the BFC.
Fig.6.1: Allocation to the Protection sector of BfC, as percentage of the Assam budget 2007-08
0.01
99.99
Protection State Budget
Source: Detailed Demand for Grants 2004-05 to 2007-08, Government of Assam.
Figure 6.2 shows an erratic trend in the allocation and expenditure for the protection sector of BfC in
the Assam Budget. The higher actual expenditure (AE) in 2004-05 is not followed by a higher allocation in
BE of the succeeding years. Instead, one sees the same trend of higher AE and lower BE even in 2006-07.
Actual Expenditure was 180.26 per cent higher than the BE and RE in 2004-05 while it was 297.91 per cent
higher than the BE and 274.29 per cent than the RE of 2005-06.
The 15.84 per cent increase in 2007-08, over the previous year’s allocation is due to enhanced
allocation in the Implementation of the Juvenile Justice Act 1986 (JJ) by 42.18 per cent, followed by a 10.47
percent rise for Homes for Orphan and Destitute Children and a 13.85 percent rise for the Beggar Home under
Correctional Services.
Our government is determined to help the physically challenged children grow as healthy citizens.
And for this matter, it is considering special schemes of providing qualitative education, employment
along with care and protection-Chie Minister Mr. Tarun Gogoi addressing a public meeting
organised as part of the inauguration of a Juvenile Justice Home at Boko. (Dainik Janambhumi, 23rd
November, 2007)
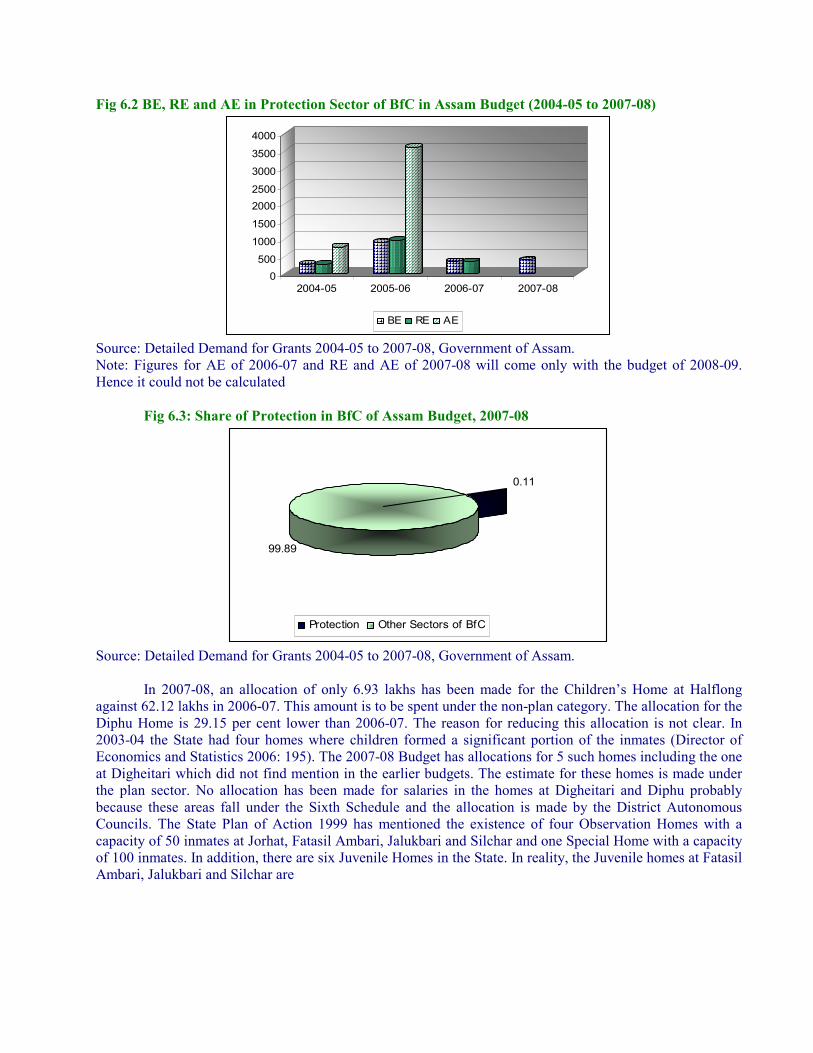
Fig 6.2 BE, RE and AE in Protection Sector of BfC in Assam Budget (2004-05 to 2007-08)
0
500
1000
1500
2000
2500
3000
3500
4000
2004-05 2005-06 2006-07 2007-08
BE RE AE
Source: Detailed Demand for Grants 2004-05 to 2007-08, Government of Assam.
Note: Figures for AE of 2006-07 and RE and AE of 2007-08 will come only with the budget of 2008-09.
Hence it could not be calculated
Fig 6.3: Share of Protection in BfC of Assam Budget, 2007-08
0.11
99.89
Protection Other Sectors of BfC
Source: Detailed Demand for Grants 2004-05 to 2007-08, Government of Assam.
In 2007-08, an allocation of only 6.93 lakhs has been made for the Children’s Home at Halflong
against 62.12 lakhs in 2006-07. This amount is to be spent under the non-plan category. The allocation for the
Diphu Home is 29.15 per cent lower than 2006-07. The reason for reducing this allocation is not clear. In
2003-04 the State had four homes where children formed a significant portion of the inmates (Director of
Economics and Statistics 2006: 195). The 2007-08 Budget has allocations for 5 such homes including the one
at Digheitari which did not find mention in the earlier budgets. The estimate for these homes is made under
the plan sector. No allocation has been made for salaries in the homes at Digheitari and Diphu probably
because these areas fall under the Sixth Schedule and the allocation is made by the District Autonomous
Councils. The State Plan of Action 1999 has mentioned the existence of four Observation Homes with a
capacity of 50 inmates at Jorhat, Fatasil Ambari, Jalukbari and Silchar and one Special Home with a capacity
of 100 inmates. In addition, there are six Juvenile Homes in the State. In reality, the Juvenile homes at Fatasil
Ambari, Jalukbari and Silchar are

the same as the Observation Homes mentioned above. So the number of Homes is only 7. However, the
Assam Budget 2007-08 has shown allocations for only five of them. Prayas and Snehalaya are some of the
non government organisation who are helping the Homes at Jorhat, Nagaon and Silchar. However, as per the
State Plan of Action, 1999 no NGO is involved in running homes for children in conflict with the law (The
State Plan of Action1999: 84). If it is true that NGOs are running some homes on behalf of the State, it would
mean that the policy has changed since then.
Surprisingly, the budget for Women’s Welfare and Child Condition Programme under the
Department of Labour which is meant for combating child labour does not have any allocation in the 2007-08
Budget. In 2004-05, the actual expenditure on this programme was 75.51 per cent more than the allocations in
the BE and RE. In 2005-06, the BE was raised by 38.8 per cent but there was no actual expenditure. In 2006-
07 the BE was reduced by 50 per cent and finally in 2007-08, it ended up without any allocation. Though the
State has of 3,51,416 child labourers according to official sources (The Sentinel, 1st May 2007) and there is a
ban on child labour as per the Child Labour (Prohibition and Regulation) Act 1986, the non-allocation or
lower allocation for this scheme shows that adequate attention is not being paid to this serious problem.
The problem of out of school children and child Labour is more visible in the tea garden and Char
areas. According to a study conducted by Sarba Shiksha Abhijan in 2002, 43 percent of the children of
present and past tea garden workers are out of school (Fernandes, Barbora and Bharali 2003). A separate
study on the Child Labourers in Tea Estates of North Eastern India by UNICEF in 1988 had already
confirmed that 96,535 children (14.4 per cent of the total workers) were employed in the tea industry of
Assam (State Plan of Action 1999).
The State has the machinery required for the implementation of the JJ Act. There are three Juvenile
Courts i.e. one each at Guwahati covering 9 districts, Jorhat covering 8 districts and Silchar covering 4
districts. In addition, there is a Juvenile Welfare Board in each district (State Plan of Action, 1999: 84). It
should have had allocations both from the central and state sectors. But the 2007-08 budget shows no Central
assistance. It may imply withdrawal of central assistance or its inclusion in the Revised Estimate. If it is the
first, it would mean a higher liability for the State or collapse of the programme if the State does not allocate
adequate funds for it. According to official figures the State had 48 prisoners below the age of 16 and 1,055
more inmates between 16 and 21 years. The exact number of children below 18 years in the 16-21 age group
is not known though they should be included among children. It is a clear violation of the Juvenile Justice Act
according to which all offenders of 18 should be kept in the juvenile homes. Thus the state needs to
emphasise more on its implementation and cannot afford to stop the programme but that is what it seems to be
doing as the limited allocations in the BFC show.
On 22nd November, 2007 the Chief Minister inaugurated a newly constructed Observation and
Children’s Home under the Juvenile Justice Act, 1986 at Bamunigaon near Boko (Dainik Janambhumi, 23rd
November, 2007). But the State budget is silent on the expenses relating to it. As per the speech delivered by
Social Welfare Minister Ms Ajanta Neog, there are 40 children in this home as of now who have been shifted
from the Home at Fatasil Ambari. In addition, there are Child Welfare Committees for 13 districts to advice
the Social Welfare Department for the rehabilitation of neglected children (The Sentinel, October 2, 2004).
For the implementation of the Disabilities Act, allocations and actual expenditure have shown a
fluctuating trend. In 2004-05, the actual expenditure was 64.78 per cent less than the BE and RE. But it was
92.40 per cent more in 2005-06 during which even the BE and RE were 15.78 per cent more than the BE and
RE of 2004-05. However, the BE in 2006-07 was reduced by 95.45 per cent over that of 2005-06. In 2007-08,
the BE has been raised by 90 per cent and that brings some relief. However, its minute analysis shows that the
allocations in 2007-08 have been made for wages, travel expenses, materials etc and not for salaries.

Summary:
Child Protection is the least prioritised part in the Budget for Children in Assam. The allocation (BE)
for this sector in 2007-08 has increased over that of 2006-07. But still it is very low in both the BFC and the
State Budget. Though a number of Acts have been passed to prove the nation’s commitment towards the
protection of children these commitment have not found expression in the State Budget of Assam. The
expenditure is higher in both the years for which data is available but the corresponding budget and revised
estimate is not so high. Some existing interventions like Children’s Homes have not found place in the budget
while some others like the one for eradication of child labour are without any allocation. Hence the need for
proper monitoring of the implementation and fund flow of the programmes seems to be an urgent necessity.

Chapter 7: Conclusion
The State Plan of Action 1999, in its goals and objectives has mentioned the need to build up public
and official awareness on child rights in order to increase social and political commitment to the cause of
children. It also set the objective of incorporating Child Rights goals into state laws, policies, plans and
budgets. A loss at the budget for the children in Assam shows that this objective is still far from being
realised. Many of the proposed interventions which set 2002 as the deadline have not been implemented till
today.
The Assam Budget has on an average allocated 8.79 per cent of the total to children during 2004-05
to 2007-08. Out of this a major share goes to child education followed by development and health. Protection
receives the lowest share among the four sectors. Four major all encompassing flagship programmes
sponsored by the central government are being run in the state. The schemes are Sarba Shikhya Abhijan and
Mid-Day Meal Scheme in education, NRHM in health and ICDS in development. Both SSA and ICDS show
a huge decline in allocation. Some other major schemes showing a decline in allocation are the Family
Welfare Project, the Intensive Child Development Scheme, non-government schools and the government
teachers’ serving in non-government schools. Alongside, there are also certain schemes like the health related
state funding schemes, Balwadi Programme, World Food Programme for Supplementary Nutrition etc having
higher allocation. The major lacunae observed in the Budget For Children of Assam during 2004-05 to 2007-
08 can be summarised as follows:
• Non allocation or decreased allocation for certain schemes which may pose threat to the child survival
and development in the state.
• Over expenditure not kept in mind during the preparation of next years’ budget.
• Expenditure incurred outside the budget estimate.
• Non utilisation of funds.
• Proper documentation of the existing interventions in all the four sectors.
• Relatively lower allocation for handicapped, SC, ST and OBC children of the State.
• Fewer schemes and lower allocation for schemes meant for girl children of the state.
• Implementation of the Legislations enacted in favour of children and mention thereof in the state
budget.
• Maintenance of existing programmes and monitoring thereof.
The Government of Assam has expressed its commitment towards children’s welfare through the
State Plan of Action and interventions like observation homes, Intensive Child Development scheme etc. A
number of acts have been passed to safeguard the cause of children. Also the implementation machinery has
been set up. Some of these commitments are being realised but much more has to be done and that has to be
accorded adequate space in the State Budget. Non-allocation or lower allocation than required for schemes of
child welfare compromise the state’s efforts and commitment for the cause. Lower allocation for specific
groups of children like the disabled, Dalit, tribal and girls will result in further deterioration. At the same time
in the absence of strong monitoring and vigilance systems, doubts are being expressed about the
implementation of the programmes. Higher or lower actual expenditure against the estimated and revised
estimates needs to be kept in mind while preparing a scheme or allocating funds for it. Besides, depending on
the situation state specific measures need to be adopted for child victims of militancy and counter-militancy
operations. In these circumstances, the government needs to be more focused and objective while preparing
the financial statement and implementing them.

References:
Bose, Ashish.2001”Black Holes in India’s Demographic Transition: Collapse of a Civilisation” Health for the
Millions 27 (n.3 May-June),pp.45-48.
Comptroller and Auditor General of India. 2006. CAG Report 15 of 2006. New Delhi: Government of India
Director of Economics and Statistics. 2005,2006 and 2007, Economic Survey 2004-05, 2005-06 and 2007-08.
Guwahati: Government of Assam.
Director of Economics and Statistics 2006, Statistical Handbook of Assam 2006, Guwahati: Government of
Assam.
Fernandes, Walter, Sanjay Barbora and Gita Bharali. 2003. Children of the Plantation Labourers… And Their
Right to Education…, Guwahati: North Eastern Social Research Centre.
Ganguly, S.P, 2000. Central Government Budgets in India, An Analysis. New Delhi: Concept Publishing
House.
Government of Assam, 1999: The State Plan of Action 1999. Guwahati: Government of Assam.
Kacker, Loveleen, Srinivas Varadan and Pravesh Kumar. 2007. Study on Child Abuse: India 2007. New
Delhi: Union Ministry of Women and Child Development.
Ministry of Finance. Assam. 2004 to 2007. Detailed Demand for Grants for the Departments of Social
Welfare, Elementary Education, Secondary Education, Technical Education, Labour, Health and
Family Welfare, Panchayat and Rural Development, Urban Development. Guwahati: Government of
Assam.
UNESCO. 2007. EFA Global Monitoring Report 2008. Paris: Oxford University Press.
www.ncert.org