Embed Size (px)
Citation preview
SHAWNEE MISSION PARKWAY CORRIDOR PLANMERRIAM, KANSAS | 12.20.2013

ACKNOWLEDGMENTS
ADVISORY BOARD MEMBERS:
Bill Carter
Linn Field
Kevin Garrett
Katie Kelsey
Stoney Bogan
Tom Heffron
Gayle Stephens
Bob Johnson
John Helling
Dave Milliken
Todd Boyer
Ken Werne
Beth Dawson
Shawn Strate
Planning Commission/Vernon Place Homes Association
Vernon Place Homes Association
IHOP
Pinegate Apartments
Downtown Merriam Partnership & Merriam Chamber of Commerce
Park Board President
Former Council Member W4
R.H. Johnson Company
Johnson County Library
Sherwood Forest
Council Member
Johnson County Library - Antioch
Mid-America Regional Council
Johnson County Transit
TECHNICAL COMMITTEE MEMBERS:
Tim Burnett
Cindy Ehart
Randy Carroll
Hye Jin Lee
Bob Pape
Chris Engel
Phil Lammers
Anna Slocum
Police Chief
Finance
Public Works Director
City Engineer
Fire Chief
Assistant City Administrator
City Administrator
Parks Director
CITY OFFICIALS:
Ken Sissom
Christine Evans Hands
Pam Bertoncin
Nancy Hupp
Todd Boyer
Chad Rowe
John Canterbury
Jim Wymer
Al Frisby
Mayor
Ward 3
Ward 4
Ward 3
Ward 4
Ward 1
Ward 1
Ward 2
Ward 2
PLANNING TEAM:
Chris Cline
Terry Berkbuegler
Caitlin Henricksen
Bruce Kimmel
Mark Swope
Tom Fulton
Erin Ollig
Shelby Ferguson
This report was funded by a grant from the Mid-America Regional Council’s (MARC) Creating Sustainable Places initiative. Creating Sustainable Places is a regional initiative funded by a
Sustainable Communities Grant from the U.S. Department of Housing and Urban Development, Office of Sustainable Housing and Communities.
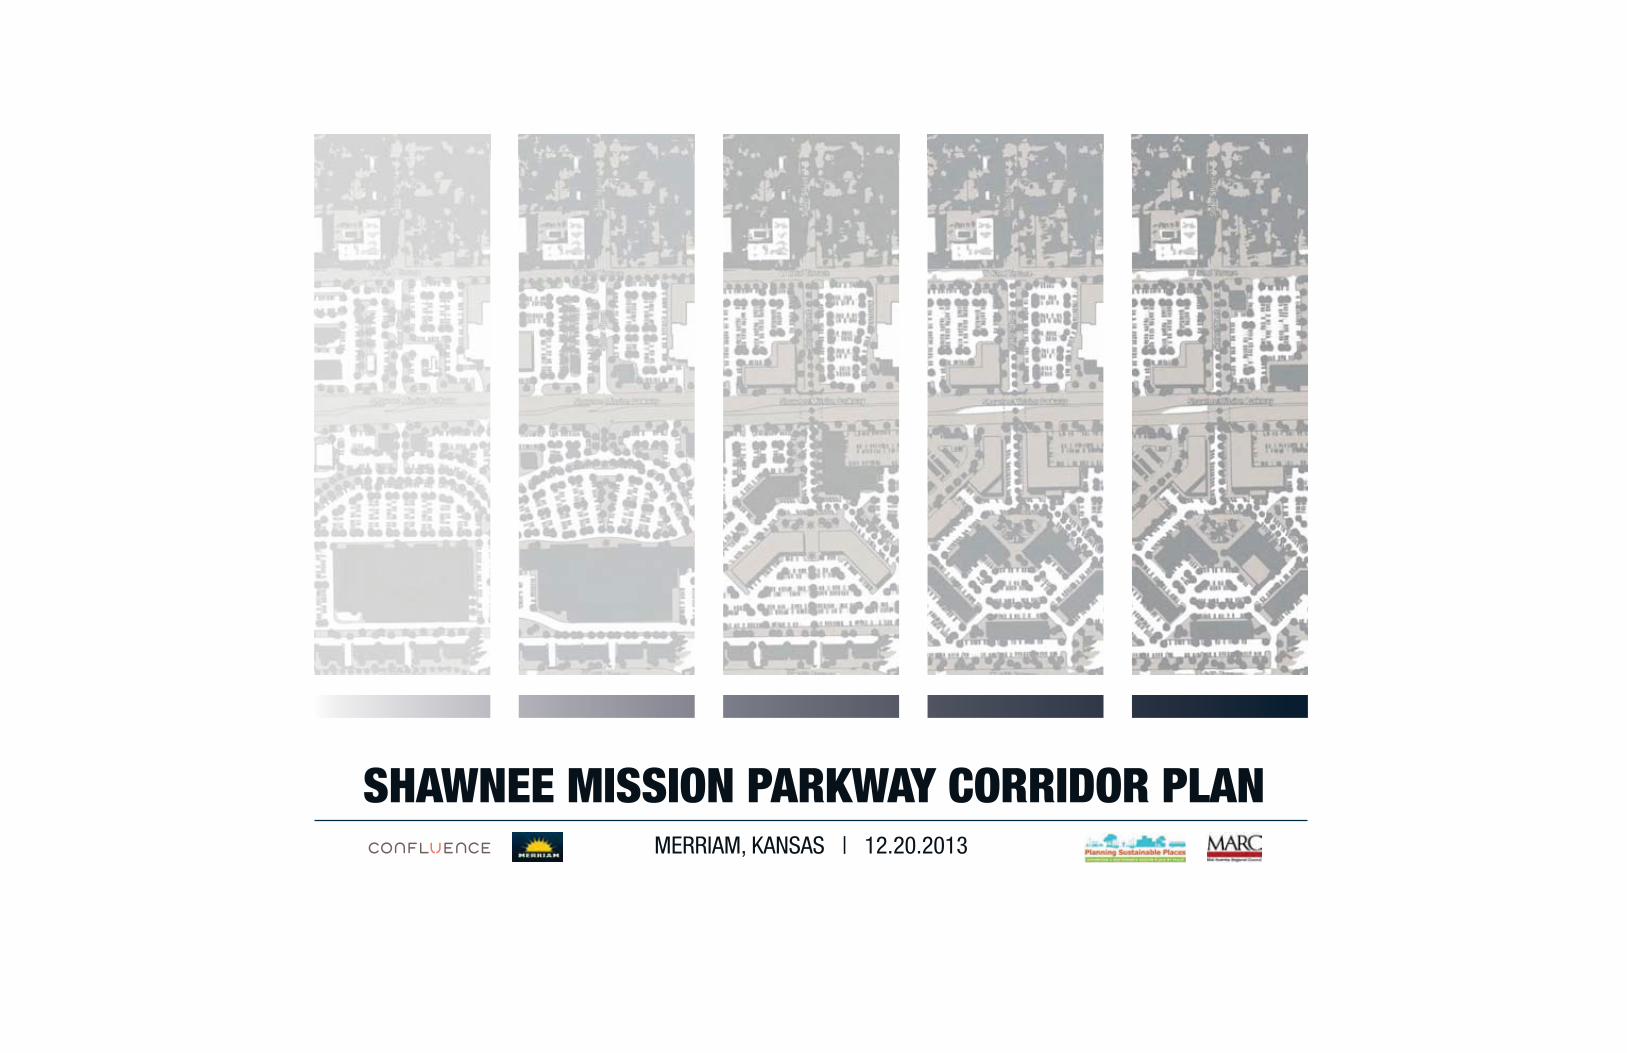
TABLE OF CONTENTS
INTRODUCTION.....................................................1
EXISTING CONDITIONS.........................................3
PLANNING PROCESS............................................5
REDEVELOPMENT RECOMMENDATIONS..............12
INFRASTRUCTURE ANALYSIS..............................22
TRANSIT INTEGRATION.......................................25
FINANCIAL ANALYSIS.........................................28
URBAN DESIGN GUIDELINES..............................34
APPENDIX..........................................................50
SECTION 1
SECTION 2
SECTION 3
SECTION 4
SECTION 5
SECTION 6
SECTION 7
SECTION 8
SECTION 9


SHAWNEE MISSION PARKWAY CORRIDOR PLAN
INTRODUCTION SECTION 1
1 | PAGE CONFLUENCE | CITY OF MERRIAM
INTRODUCTION SHAWNEE MISSION PARKWAY CORRIDOR PLAN
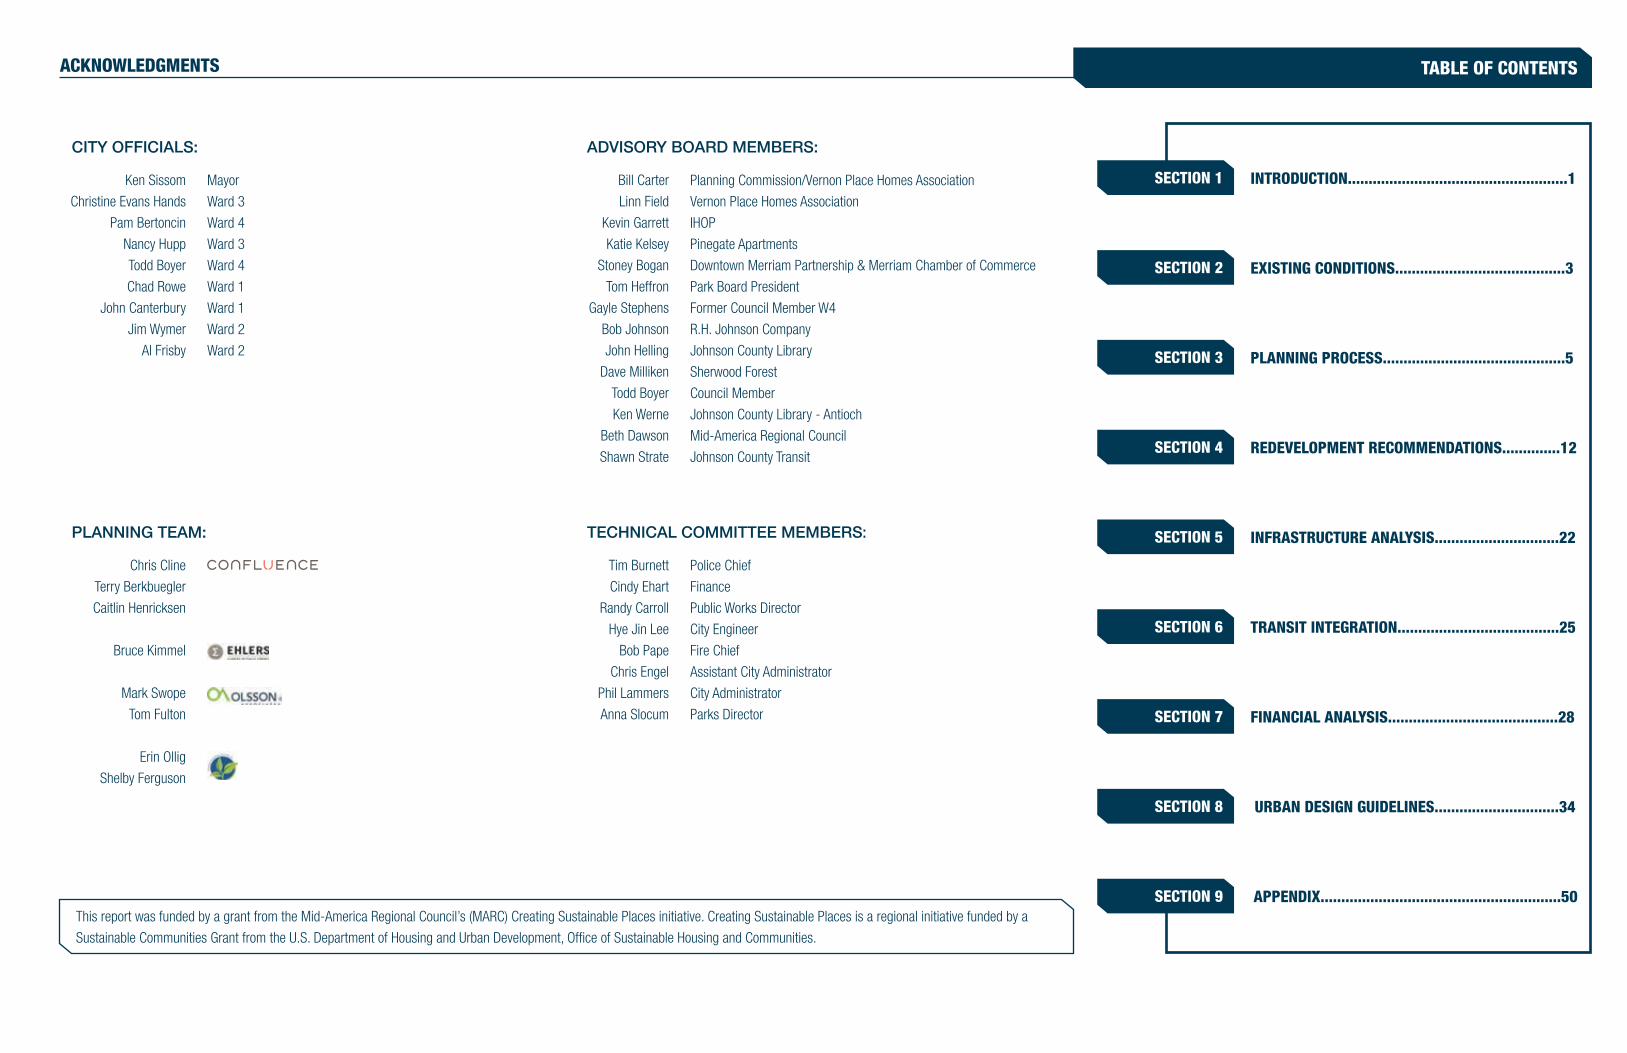
BACKGROUND
Developed as one of the first suburbs of Kansas City, Merriam initially served as a nice place to escape
the busy city during the late 1900s. People could ride the train approximately 10 miles southwest to
Merriam Park, a 40-acre amusement park designed by George Kessler located near what is now the
interchange of Interstate 35 and Shawnee Mission Parkway. The continued growth of the Kansas City
metropolitan area, the popularity of this park, and increased rail ridership fueled a surge in Merriam’s
residential development between the 1930s through the 1970s.
The library in Merriam was one of the first to be established in Johnson County, circa 1953. In 1956,
the library was moved to where it’s now located at the northwest corner of Antioch and Shawnee
Mission Parkway and renamed to Antioch Library. The library served as the Johnson County library
system headquarters (or Central Resource Library) through the mid-1990s. In 1996, it began serving
Merriam and surrounding communities as a branch library, and continues to be a beloved community
anchor to this day.
Commercial development kept pace with the growth of the community, serving residents and motorists
traveling along the I-35 and Shawnee Mission Parkway corridors, and included the now vacant
K-Mart Building (1967), a few full-service restaurants and office buildings (1970s), several fast food
restaurants (1990s), and the Shell Gas Station (1995). The redevelopment of the northeast corner
of I-35 and Johnson Drive resulted in the Merriam Town Center retail center (built in 1996). To the
north of this development, Merriam Village was created. At the center of this development is the IKEA
Merriam 359,000 square foot store that opens in Fall 2014. This new development is anticipated to
further bolster demand for new commercial development in the area. It also provides an opportunity
for aging and underutilized commercial properties along the Shawnee Mission Parkway Corridor to be
revitalized and/or redeveloped to better serve the changing needs of the area.
STUDY AREA
The approximately 25-acre study area generally consists of the area one (1) block north to one (1)
block south of Shawnee Mission Parkway between Antioch Drive and Eby Street/IKEA Way. Local
businesses within the study area include a vacant big box store, formerly a K-Mart/Sears; three fast
food restaurants (Krispy Kreme Donuts, Taco Bell, and Caribou Coffee); two full-service restaurants
(Winstead’s and IHOP); two public service buildings (library and its support facility); two office buildings
(US Bank and Poss-Abilities); a gas station (Shell); a childcare and educational facility (La Petite); and a
small warehouse building.
The study area is primarily surrounded by single family neighborhoods to the north and west, an
apartment complex on the south, a mixture of hotels, restaurants, and auto dealerships on the west,
and residential uses to the north. Other civic uses surrounding the study area include the Merriam
Visitor Center on the west, Merriam City Hall, Police, and Fire Station facilities to the northwest, Vavra
Park to the north (home to Merriam’s Municipal Pool Complex), and one of Johnson County’s oldest
and most popular community parks, Antioch Park, to the southeast.
CREATING SUSTAINABLE PLACES: INITIAL VISIONING
In October 2010, a consortium of more than 60 regional partners, led by the Mid-America Regional
Council (MARC), received a $4.25 million planning grant from the U.S. Department of Housing and
Urban Development (HUD) to advance the implementation of the Regional Plan for Sustainable
Development. This initiative is called Creating Sustainable Places (CSP).
Creating Sustainable Places is not only a regional vision and plan to guide how we grow and develop,
but a strategy for moving our communities from planning to action. This strategy includes the following
steps:
• Organizing for Success − Building on the region’s strong track record of collaboration
to provide leadership, coordinate outreach and education activities, broaden public
understanding of and involvement in sustainability issues, and strengthen stakeholder
capacity to address them.
• Enhancing Decision Making − Developing new tools, policies and practices necessary to
make sound investments and accelerate sustainable development.
• Demonstrating New Models − Applying these new tools to key corridors and activity
centers through demonstration projects that can help transform the ways neighborhoods and
communities grow and develop.
PAGE | 2CITY OF MERRIAM | CONFLUENCE
INTRODUCTIONSHAWNEE MISSION PARKWAY CORRIDOR PLAN
Shawnee Mission Parkway Visioning Study FOCUS AREA PLANS
Shawnee and Merriam, Kansas
MAY 2013
PLANNING SUSTAINABLE PLACES
Building on the results of the previous Focus Area Plans, the City of Merriam partnered with Johnson
County Transit to successfully pursue further planning of the study area through MARC’s regional
Planning Sustainable Places (PSP) program. This program provided local governments with financial
support to advance detailed local planning and project development activities in support of the CSP
initiative, Transportation Outlook 2040 Activity Centers and Corridors framework, and MARC’s adopted
policy statement on regional land use direction.
The CSP initiative and Transportation Outlook 2040 outlined a need to focus efforts on promoting
concepts consistent with sustainable communities and place a focus on advancing site specific and
project specific activities in support of these objectives. The PSP program serves as a single local
government assistance program intended to specifically respond to these goals and facilitate the
following objectives:
Program Objectives:
• Support the development and implementation of local activity center plans consistent with
CSP principles, identified regional activity centers, and the land use policy direction outlined
in Transportation Outlook 2040.
• Support localized public engagement and community consensus building.
• Support the identification and conceptualization of land use strategies, transportation
projects, and related sustainable development initiatives that help to realize and advance the
objectives identified in the CSP initiative and Transportation Outlook 2040.
• Support the conceptualization, development, and implementation of CSP projects.
This project was one of 18 planning studies across the Kansas City metropolitan region chosen for
funding through the PSP program.
STUDY PURPOSE + ANTICIPATED OUTCOMES
This project represents a unique opportunity for Merriam to proactively position this area for
successful revitalization and redevelopment. With IKEA’s planned arrival and the recent closure
of K-Mart, this area is anticipated to generate increased attention from development interests.
Likewise, the surrounding community is concerned about changes in the area and how those
changes will affect their quality of life today and in the future.
It is important for the City to remain ahead of the curve - anticipating what form this new
development could or should take, how it is integrated with and connected to the surrounding
community, and how it is anticipated to perform from an economic development perspective.
This planning effort requires a balanced and pragmatic approach to guiding future redevelopment
activities, one that is inspired by emerging trends in planning and real estate development – yet
provides some degree of flexibility to consider unique future community revitalization opportunities.
Due to the nature and complexity of redevelopment, these efforts will undoubtedly involve the
need for investment and improvements to public infrastructure serving the project area. Several
recent redevelopment proposals in the Kansas City metropolitan area involve a request for public/
private partnership in one form or another, such as Tax Increment Financing (TIF), Transportation
Development Districts (TDDs), and Community Improvement Districts (CIDs) among others.
The study team’s approach includes developing and analyzing a broad range of redevelopment
scenarios to serve as a “litmus test”, with the intent of integrating a guide for appropriate
redevelopment types/thresholds and their corresponding economic development tools and
incentives. The idea is to integrate this type of thought process into the planning effort, such that
it informs not only the range of appropriate redevelopment scenarios for the study area – but
also assists in establishing a sliding scale of public investment recommendations that directly
relates to the scale, type, intensity, and anticipated economic development performance of various
development proposals.
In addition to these alternative redevelopment scenarios, concept-level infrastructure and financial
analysis information has been included for each scenario – including a broad overview of the
important role transit can play in future growth along the Shawnee Mission Parkway Corridor.
A series of recommendations for public street improvements and design guidelines for future
development are also incorporated. This study is anticipated to be adopted by the City of Merriam
as an amendment to the Comprehensive Plan in order to guide redevelopment of the study area in
a manner consistent with the surrounding community’s input, direction, and support.
A project such as this will likely take many years of careful planning, coordination, communication,
and commitment to ultimately be a success. This plan is intended to assist the City of Merriam in
eventually realizing a new vision for redevelopment of this area, and to effectively take the next step
in establishing and achieving the area’s potential.
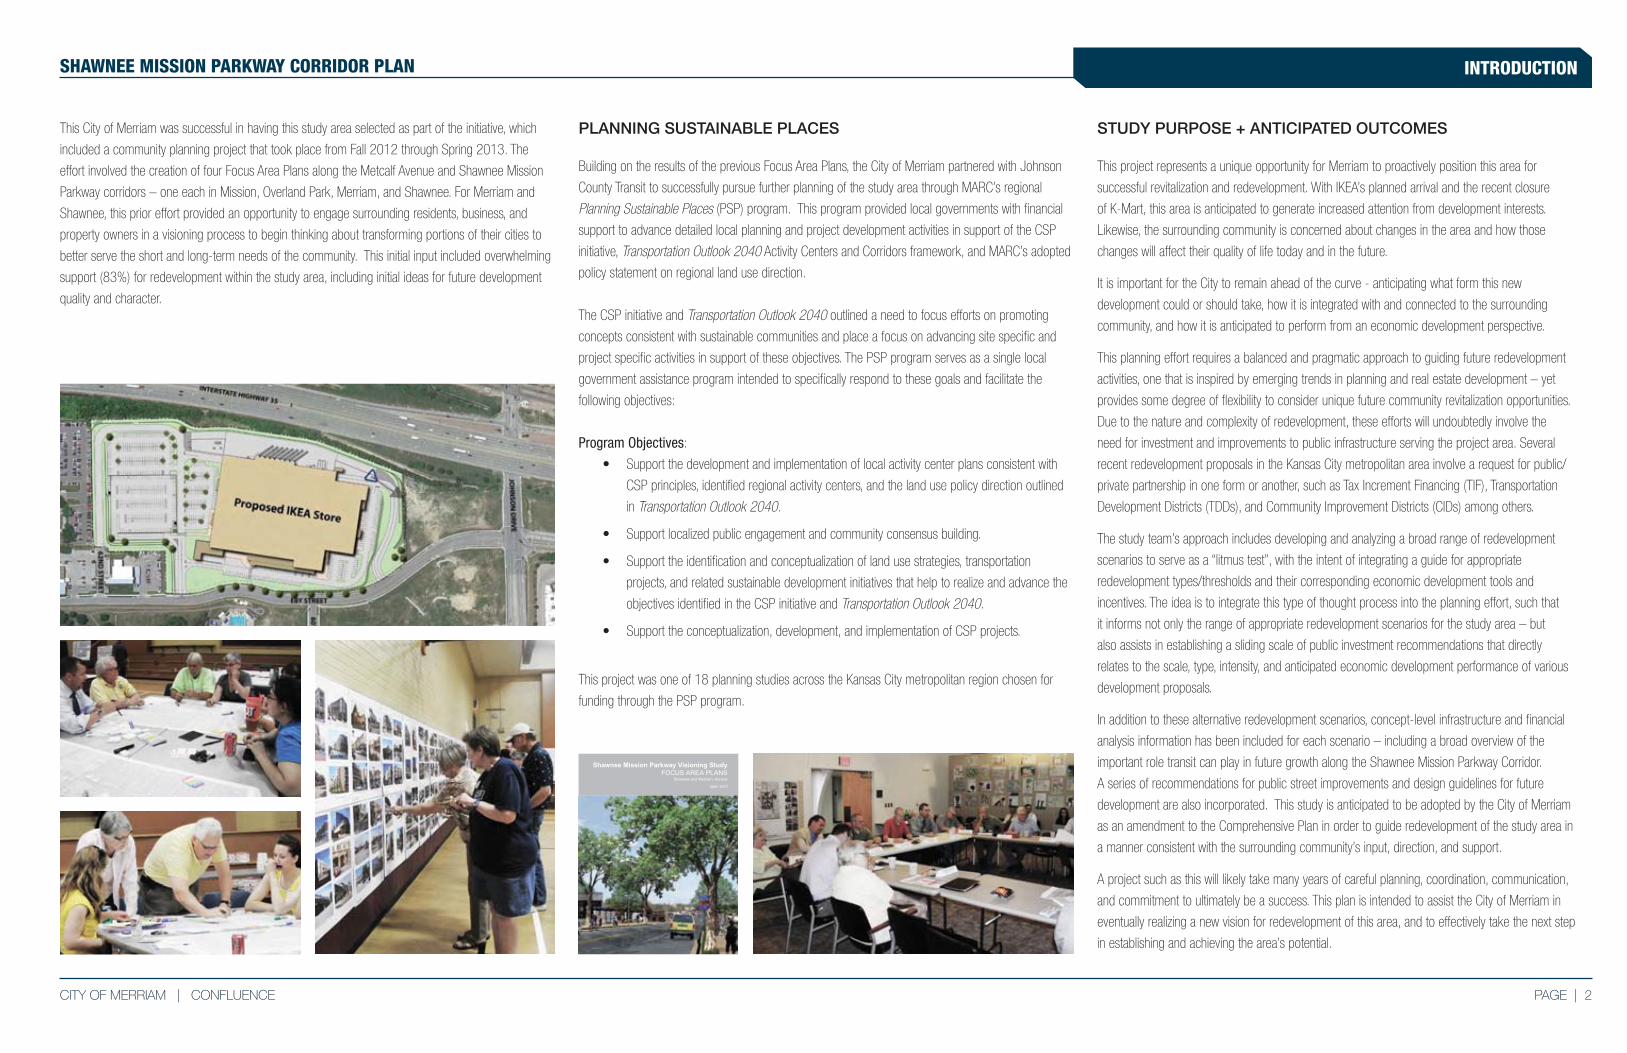
This City of Merriam was successful in having this study area selected as part of the initiative, which
included a community planning project that took place from Fall 2012 through Spring 2013. The
effort involved the creation of four Focus Area Plans along the Metcalf Avenue and Shawnee Mission
Parkway corridors – one each in Mission, Overland Park, Merriam, and Shawnee. For Merriam and
Shawnee, this prior effort provided an opportunity to engage surrounding residents, business, and
property owners in a visioning process to begin thinking about transforming portions of their cities to
better serve the short and long-term needs of the community. This initial input included overwhelming
support (83%) for redevelopment within the study area, including initial ideas for future development
quality and character.


SHAWNEE MISSION PARKWAY CORRIDOR PLAN
EXISTING CONDITIONS SECTION 2
3 | PAGE CONFLUENCE | CITY OF MERRIAM
EXISTING CONDITIONS SHAWNEE MISSION PARKWAY CORRIDOR PLAN
STUDY AREA REVIEW
Existing Utility Infrastructure Conditions
For the purposes of understanding the potential for the existing utility infrastructure systems to serve
the anticipated redevelopment within the study area, the planning team performed a concept-level
review and analysis of these existing systems. The utility systems analyzed included sanitary sewer,
water, electrical power, storm sewers, and natural gas.
This analysis utilized available planimetric mapping information provided by the City of Merriam and
included a cursory review of existing site utility conditions observed by driving and walking the study
area. The scope of this work did not include any subsurface exploration or specific condition or
functional analysis of these systems.
Based on the review and analysis performed as part of this study, it appears the existing utilities within
the study area are generally of sufficient size and capacity to adequately serve the redevelopment
scenarios being proposed. More detailed utility design, engineering, and analysis of future
redevelopment proposals will be necessary to ensure all new and/or replaced portions of these
systems are designed to appropriately connect into the existing network of utilities serving the area.
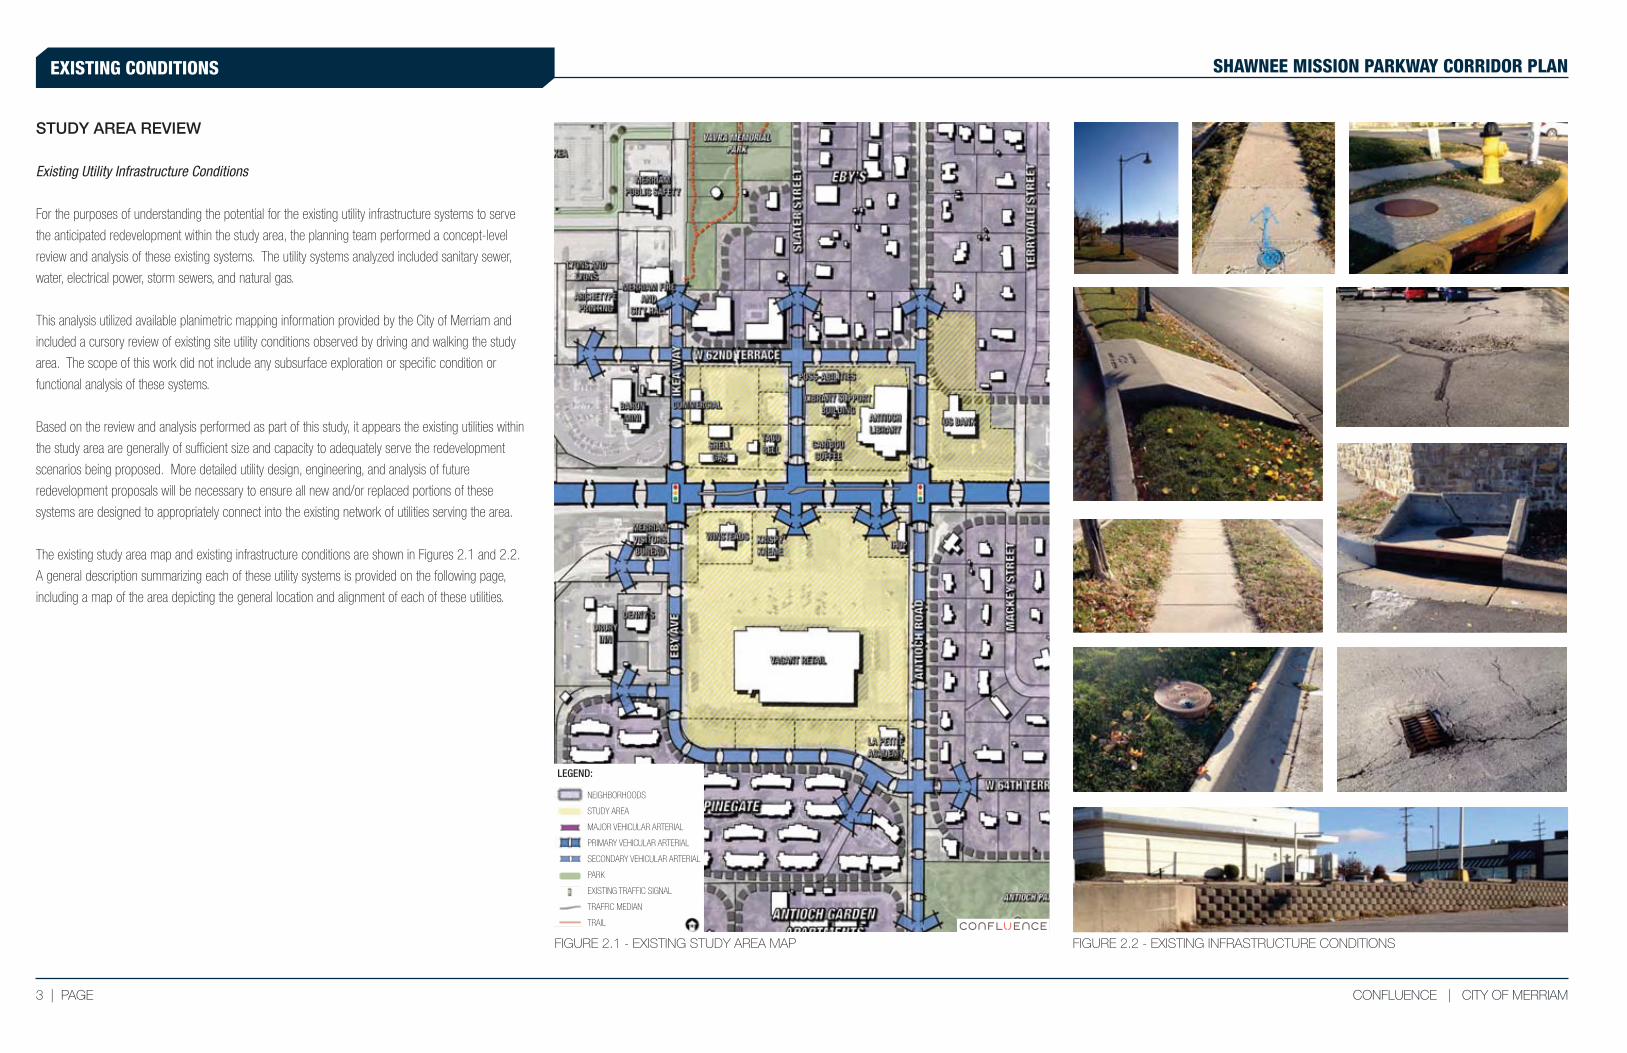
The existing study area map and existing infrastructure conditions are shown in Figures 2.1 and 2.2.
A general description summarizing each of these utility systems is provided on the following page,
including a map of the area depicting the general location and alignment of each of these utilities.
FIGURE 2.1 - EXISTING STUDY AREA MAP
LEGEND:
NEIGHBORHOODS
STUDY AREA
MAJOR VEHICULAR ARTERIAL
PRIMARY VEHICULAR ARTERIAL
SECONDARY VEHICULAR ARTERIAL
PARK
EXISTING TRAFFIC SIGNAL
TRAFFIC MEDIAN
TRAIL
FIGURE 2.2 - EXISTING INFRASTRUCTURE CONDITIONS
PAGE | 4CITY OF MERRIAM | CONFLUENCE
EXISTING CONDITIONSSHAWNEE MISSION PARKWAY CORRIDOR PLAN
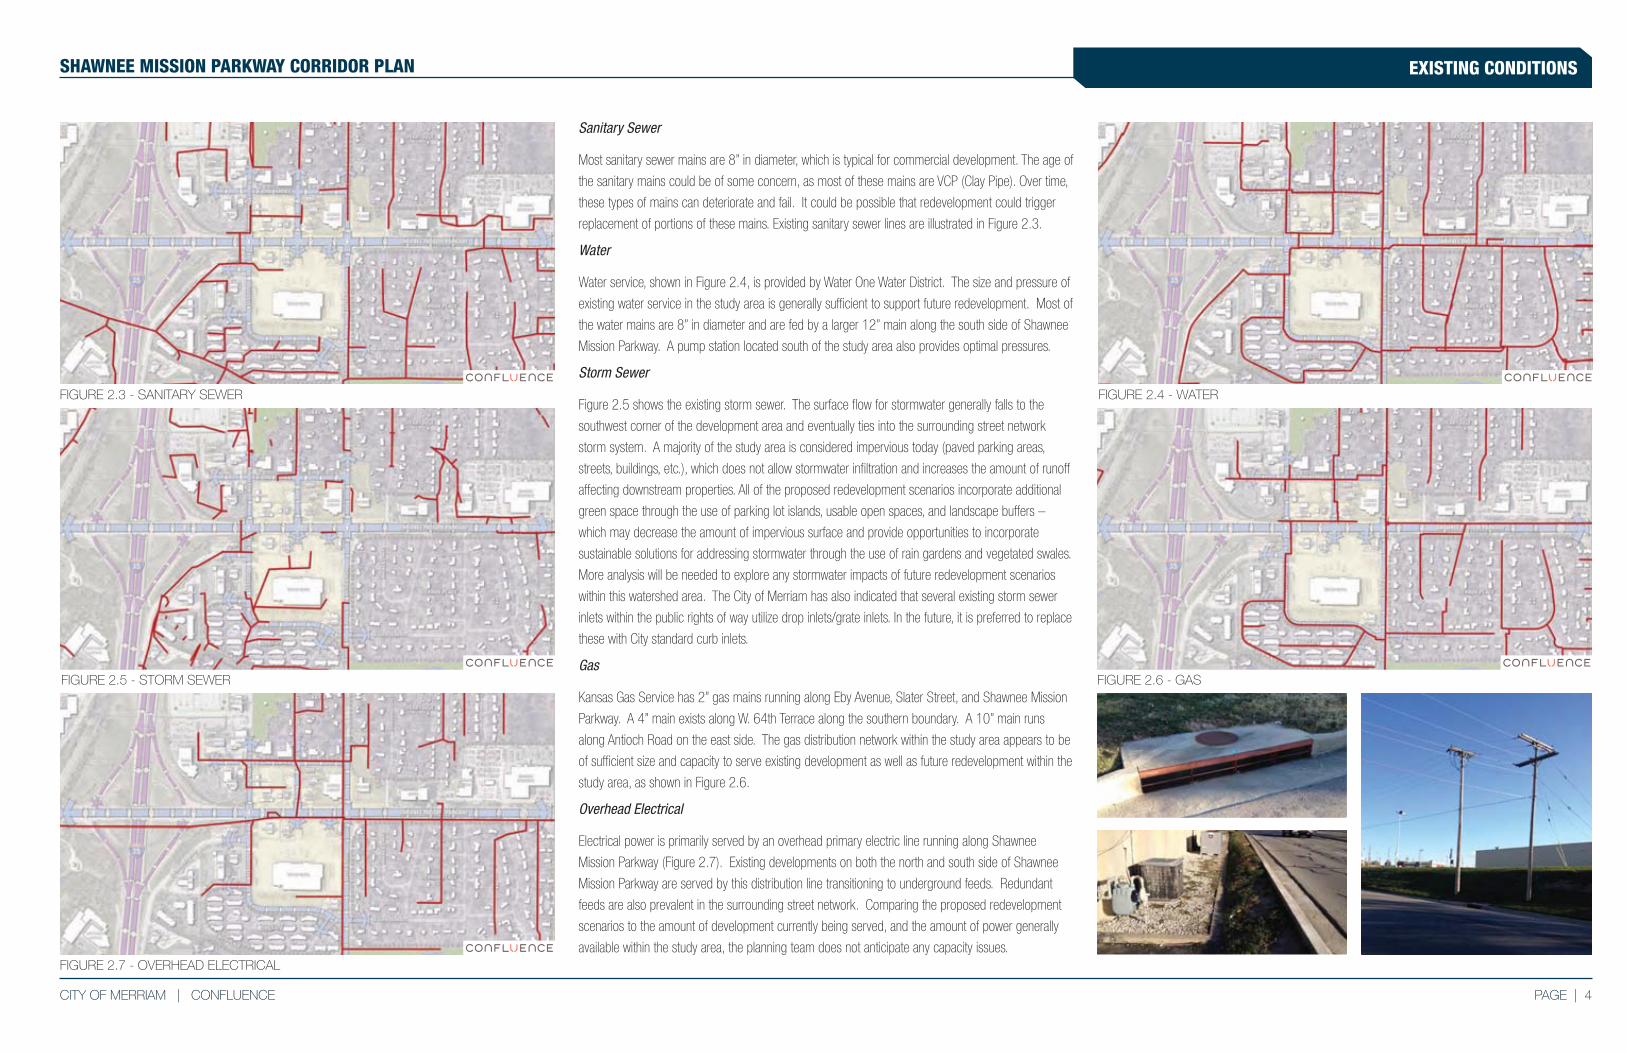
FIGURE 2.3 - SANITARY SEWER FIGURE 2.4 - WATER
FIGURE 2.7 - OVERHEAD ELECTRICAL
FIGURE 2.6 - GASFIGURE 2.5 - STORM SEWER
Sanitary Sewer
Most sanitary sewer mains are 8” in diameter, which is typical for commercial development. The age of
the sanitary mains could be of some concern, as most of these mains are VCP (Clay Pipe). Over time,
these types of mains can deteriorate and fail. It could be possible that redevelopment could trigger
replacement of portions of these mains. Existing sanitary sewer lines are illustrated in Figure 2.3.
Water
Water service, shown in Figure 2.4, is provided by Water One Water District. The size and pressure of
existing water service in the study area is generally sufficient to support future redevelopment. Most of
the water mains are 8” in diameter and are fed by a larger 12” main along the south side of Shawnee
Mission Parkway. A pump station located south of the study area also provides optimal pressures.
Storm Sewer
Figure 2.5 shows the existing storm sewer. The surface flow for stormwater generally falls to the
southwest corner of the development area and eventually ties into the surrounding street network
storm system. A majority of the study area is considered impervious today (paved parking areas,
streets, buildings, etc.), which does not allow stormwater infiltration and increases the amount of runoff
affecting downstream properties. All of the proposed redevelopment scenarios incorporate additional
green space through the use of parking lot islands, usable open spaces, and landscape buffers –
which may decrease the amount of impervious surface and provide opportunities to incorporate
sustainable solutions for addressing stormwater through the use of rain gardens and vegetated swales.
More analysis will be needed to explore any stormwater impacts of future redevelopment scenarios
within this watershed area. The City of Merriam has also indicated that several existing storm sewer
inlets within the public rights of way utilize drop inlets/grate inlets. In the future, it is preferred to replace
these with City standard curb inlets.
Gas
Kansas Gas Service has 2” gas mains running along Eby Avenue, Slater Street, and Shawnee Mission
Parkway. A 4” main exists along W. 64th Terrace along the southern boundary. A 10” main runs
along Antioch Road on the east side. The gas distribution network within the study area appears to be
of sufficient size and capacity to serve existing development as well as future redevelopment within the
study area, as shown in Figure 2.6.
Overhead Electrical
Electrical power is primarily served by an overhead primary electric line running along Shawnee
Mission Parkway (Figure 2.7). Existing developments on both the north and south side of Shawnee
Mission Parkway are served by this distribution line transitioning to underground feeds. Redundant
feeds are also prevalent in the surrounding street network. Comparing the proposed redevelopment
scenarios to the amount of development currently being served, and the amount of power generally
available within the study area, the planning team does not anticipate any capacity issues.


SHAWNEE MISSION PARKWAY CORRIDOR PLAN
PLANNING PROCESS SECTION 3
5 | PAGE CONFLUENCE | CITY OF MERRIAM
PLANNING PROCESS SHAWNEE MISSION PARKWAY CORRIDOR PLAN
COMMUNITY AND ADVISORY BOARD INVOLVEMENT
The ideas and recommendations in the Shawnee Mission Parkway Corridor Plan are a culmination
of a community-driven planning process. Involving the public and key stakeholders in this planning
process was a deliberate and critical element of the plan’s development. City Council members
helped to provide input into which groups should be involved and targeted, including appointments
to the Advisory Board. The Advisory Board was comprised of local business owners, planning
commissioners, neighborhood association leaders, local experts and community leaders.
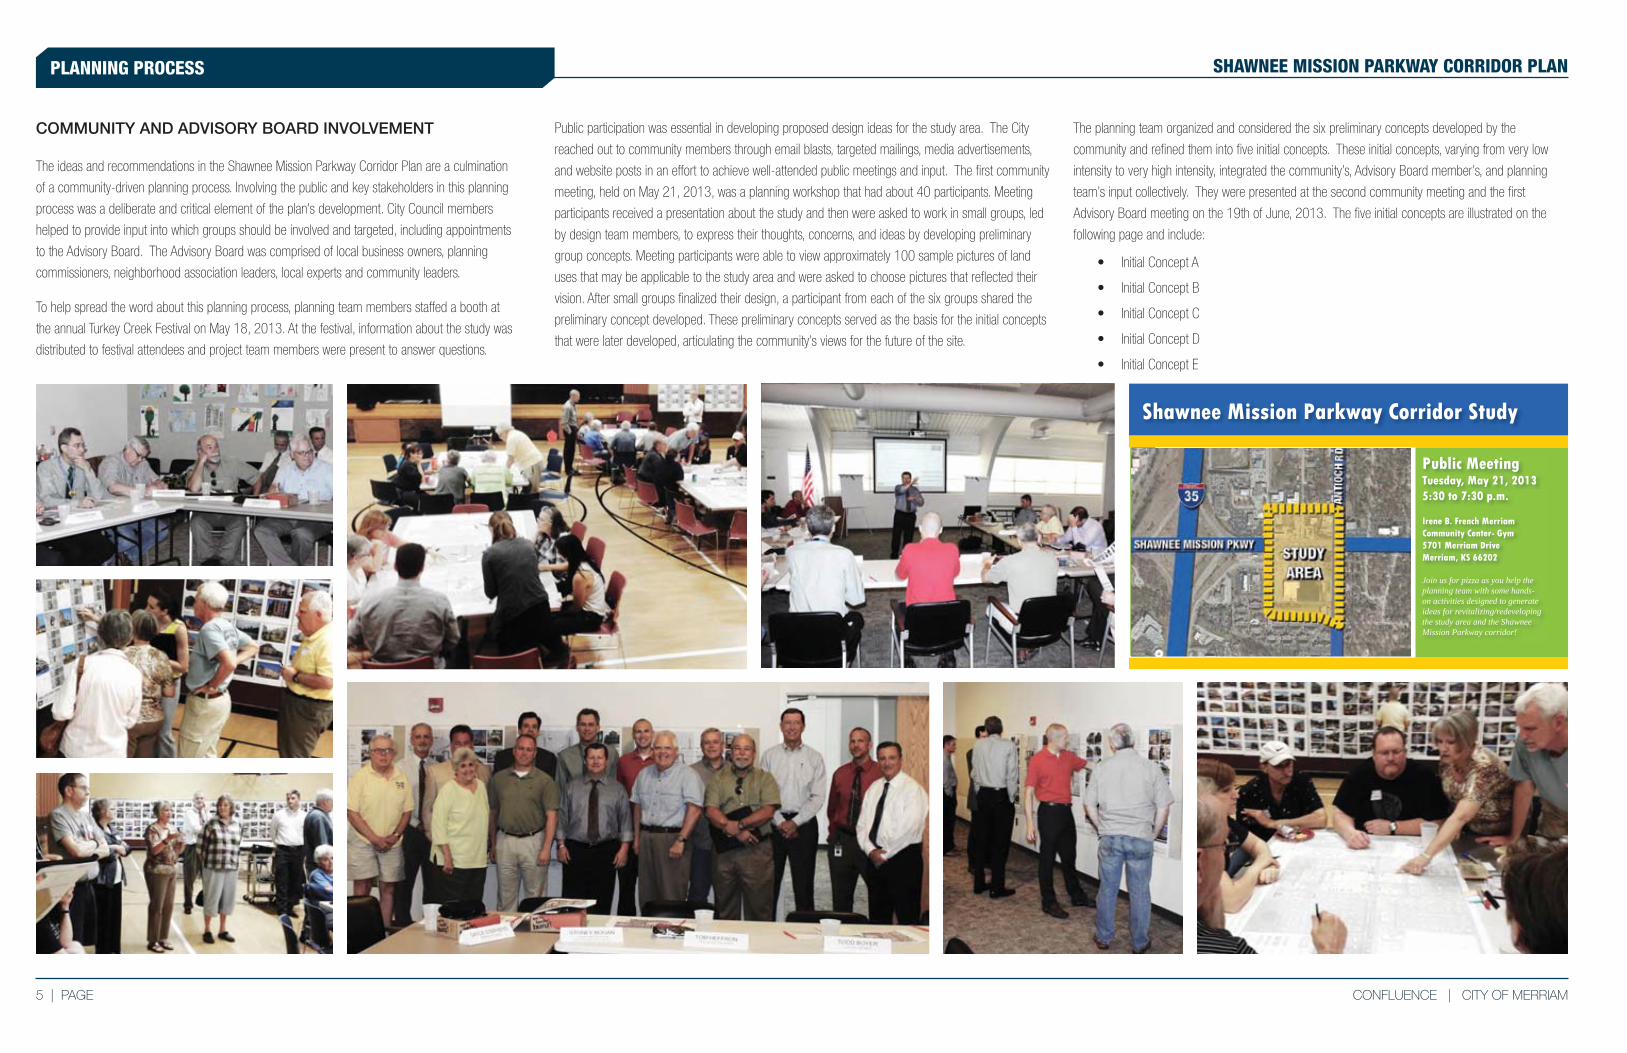
To help spread the word about this planning process, planning team members staffed a booth at
the annual Turkey Creek Festival on May 18, 2013. At the festival, information about the study was
distributed to festival attendees and project team members were present to answer questions.
Public participation was essential in developing proposed design ideas for the study area. The City
reached out to community members through email blasts, targeted mailings, media advertisements,
and website posts in an effort to achieve well-attended public meetings and input. The first community
meeting, held on May 21, 2013, was a planning workshop that had about 40 participants. Meeting
participants received a presentation about the study and then were asked to work in small groups, led
by design team members, to express their thoughts, concerns, and ideas by developing preliminary
group concepts. Meeting participants were able to view approximately 100 sample pictures of land
uses that may be applicable to the study area and were asked to choose pictures that reflected their
vision. After small groups finalized their design, a participant from each of the six groups shared the
preliminary concept developed. These preliminary concepts served as the basis for the initial concepts
that were later developed, articulating the community’s views for the future of the site.
The planning team organized and considered the six preliminary concepts developed by the
community and refined them into five initial concepts. These initial concepts, varying from very low
intensity to very high intensity, integrated the community’s, Advisory Board member’s, and planning
team’s input collectively. They were presented at the second community meeting and the first
Advisory Board meeting on the 19th of June, 2013. The five initial concepts are illustrated on the
following page and include:
• Initial Concept A
• Initial Concept B
• Initial Concept C
• Initial Concept D
• Initial Concept E
The City of Merriam is excited to continue working with the community to create a plan for a portion of the Shawnee Mission Parkway corridor! The purpose of the study is to create a plan that successfully guides revitalization and/or redevelopment of this area while addressing future land use, environmental, and transportation/infrastructure needs.
This meeting will include a brief project presentation and an interactive planning workshop – so please bring your thoughts and ideas for enhancing this important area of Merriam. The planning team will be working with the surrounding community and key stakeholders, such as developers, local businesses and Johnson County Transit, to
This meeting will be a key milestone in the planning process. The ideas generated
alternative concepts are anticipated to be shared in mid-June 2013 at a second public meeting. A third public meeting is anticipated in October 2013 to share the planning
Join us for pizza as you help the planning team with some hands-on activities designed to generate ideas for revitalizing/redeveloping the study area and the Shawnee Mission Parkway corridor!
PAGE | 6CITY OF MERRIAM | CONFLUENCE
PLANNING PROCESSSHAWNEE MISSION PARKWAY CORRIDOR PLAN
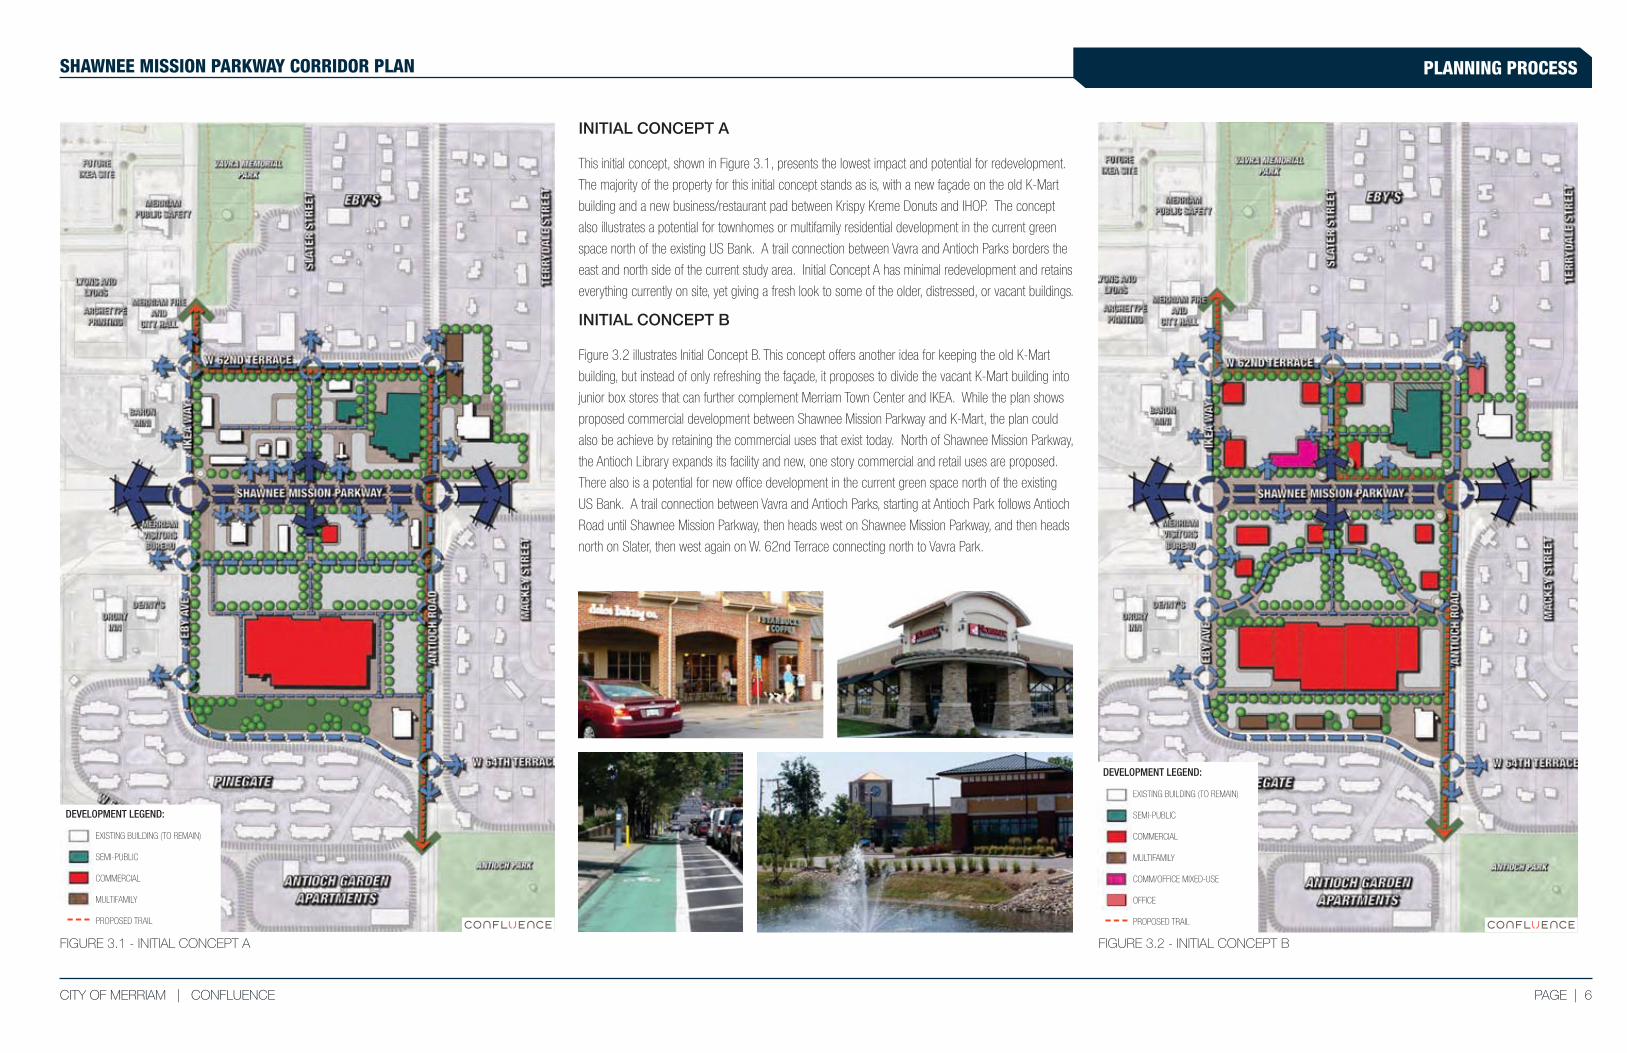
INITIAL CONCEPT A
This initial concept, shown in Figure 3.1, presents the lowest impact and potential for redevelopment.
The majority of the property for this initial concept stands as is, with a new façade on the old K-Mart
building and a new business/restaurant pad between Krispy Kreme Donuts and IHOP. The concept
also illustrates a potential for townhomes or multifamily residential development in the current green
space north of the existing US Bank. A trail connection between Vavra and Antioch Parks borders the
east and north side of the current study area. Initial Concept A has minimal redevelopment and retains
everything currently on site, yet giving a fresh look to some of the older, distressed, or vacant buildings.
INITIAL CONCEPT B
Figure 3.2 illustrates Initial Concept B. This concept offers another idea for keeping the old K-Mart
building, but instead of only refreshing the façade, it proposes to divide the vacant K-Mart building into
junior box stores that can further complement Merriam Town Center and IKEA. While the plan shows
proposed commercial development between Shawnee Mission Parkway and K-Mart, the plan could
also be achieve by retaining the commercial uses that exist today. North of Shawnee Mission Parkway,
the Antioch Library expands its facility and new, one story commercial and retail uses are proposed.
There also is a potential for new office development in the current green space north of the existing
US Bank. A trail connection between Vavra and Antioch Parks, starting at Antioch Park follows Antioch
Road until Shawnee Mission Parkway, then heads west on Shawnee Mission Parkway, and then heads
north on Slater, then west again on W. 62nd Terrace connecting north to Vavra Park.
FIGURE 3.1 - INITIAL CONCEPT A FIGURE 3.2 - INITIAL CONCEPT B
DEVELOPMENT LEGEND:
EXISTING BUILDING (TO REMAIN)
SEMI-PUBLIC
COMMERCIAL
MULTIFAMILY
PROPOSED TRAIL
DEVELOPMENT LEGEND:
EXISTING BUILDING (TO REMAIN)
SEMI-PUBLIC
COMMERCIAL
MULTIFAMILY
COMM/OFFICE MIXED-USE
OFFICE
PROPOSED TRAIL
7 | PAGE CONFLUENCE | CITY OF MERRIAM
PLANNING PROCESS SHAWNEE MISSION PARKWAY CORRIDOR PLAN
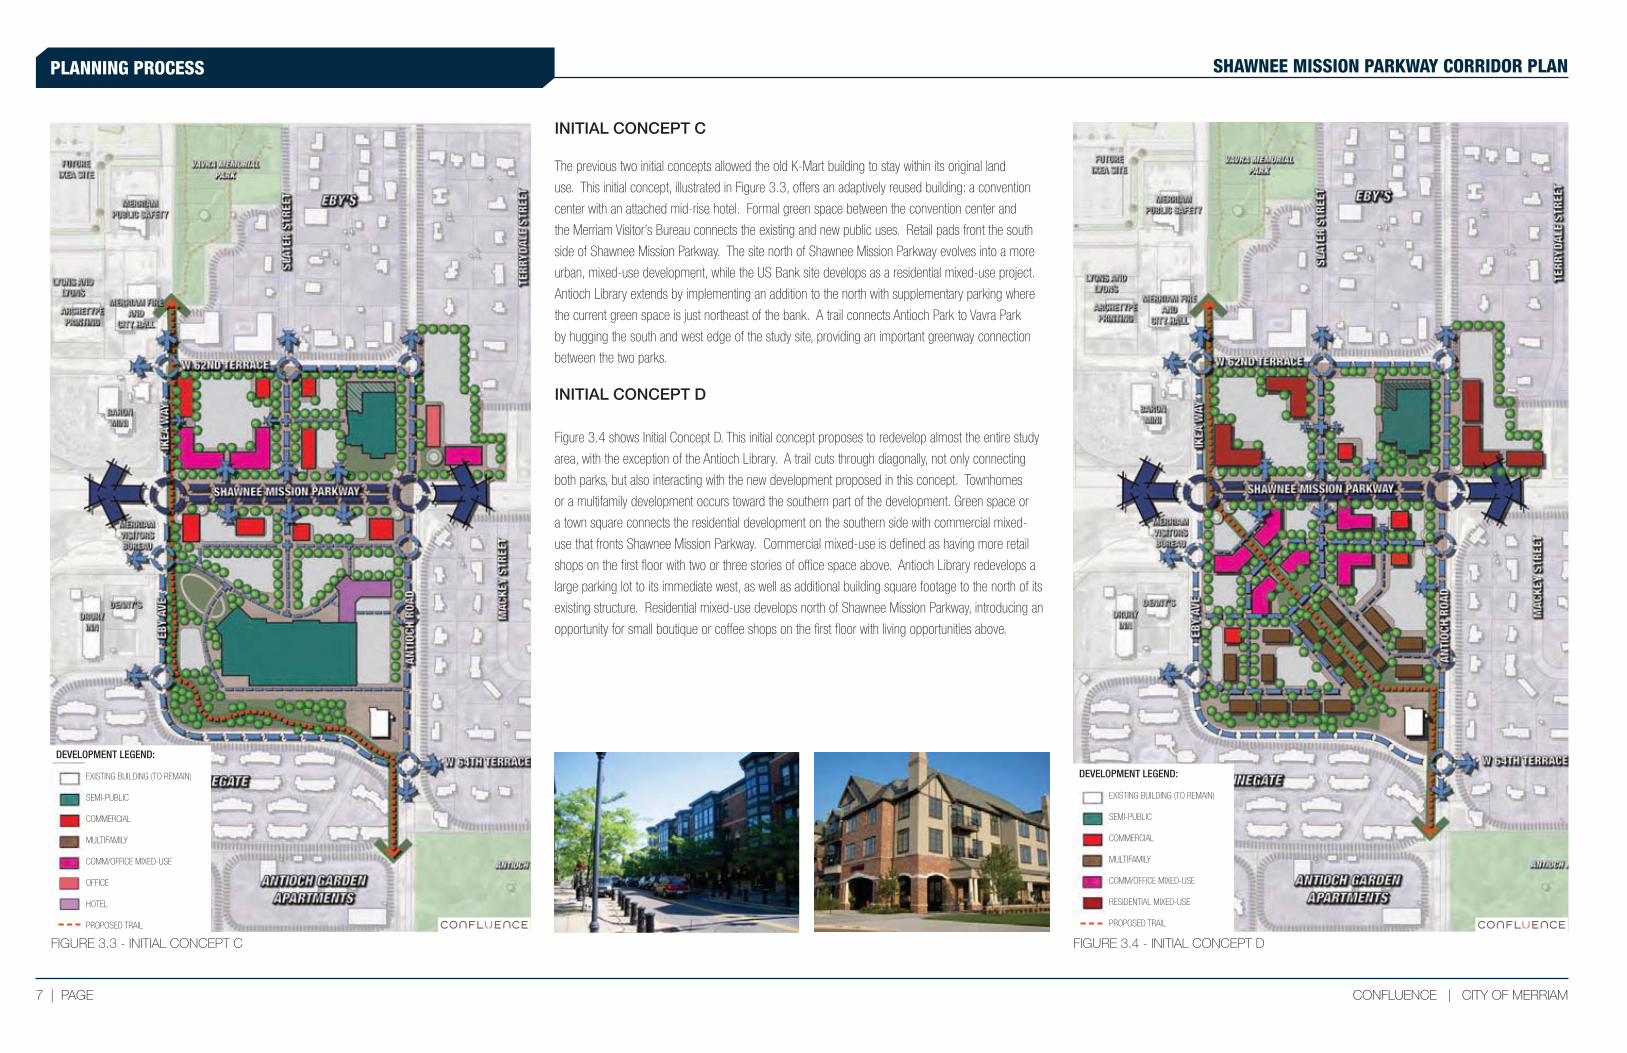
INITIAL CONCEPT C
The previous two initial concepts allowed the old K-Mart building to stay within its original land
use. This initial concept, illustrated in Figure 3.3, offers an adaptively reused building: a convention
center with an attached mid-rise hotel. Formal green space between the convention center and
the Merriam Visitor’s Bureau connects the existing and new public uses. Retail pads front the south
side of Shawnee Mission Parkway. The site north of Shawnee Mission Parkway evolves into a more
urban, mixed-use development, while the US Bank site develops as a residential mixed-use project.
Antioch Library extends by implementing an addition to the north with supplementary parking where
the current green space is just northeast of the bank. A trail connects Antioch Park to Vavra Park
by hugging the south and west edge of the study site, providing an important greenway connection
between the two parks.
INITIAL CONCEPT D
Figure 3.4 shows Initial Concept D. This initial concept proposes to redevelop almost the entire study
area, with the exception of the Antioch Library. A trail cuts through diagonally, not only connecting
both parks, but also interacting with the new development proposed in this concept. Townhomes
or a multifamily development occurs toward the southern part of the development. Green space or
a town square connects the residential development on the southern side with commercial mixed-
use that fronts Shawnee Mission Parkway. Commercial mixed-use is defined as having more retail
shops on the first floor with two or three stories of office space above. Antioch Library redevelops a
large parking lot to its immediate west, as well as additional building square footage to the north of its
existing structure. Residential mixed-use develops north of Shawnee Mission Parkway, introducing an
opportunity for small boutique or coffee shops on the first floor with living opportunities above.
FIGURE 3.3 - INITIAL CONCEPT C FIGURE 3.4 - INITIAL CONCEPT D
DEVELOPMENT LEGEND:
EXISTING BUILDING (TO REMAIN)
SEMI-PUBLIC
COMMERCIAL
MULTIFAMILY
COMM/OFFICE MIXED-USE
RESIDENTIAL MIXED-USE
PROPOSED TRAIL
DEVELOPMENT LEGEND:
EXISTING BUILDING (TO REMAIN)
SEMI-PUBLIC
COMMERCIAL
MULTIFAMILY
COMM/OFFICE MIXED-USE
OFFICE
HOTEL
PROPOSED TRAIL
PAGE | 8CITY OF MERRIAM | CONFLUENCE
PLANNING PROCESSSHAWNEE MISSION PARKWAY CORRIDOR PLAN
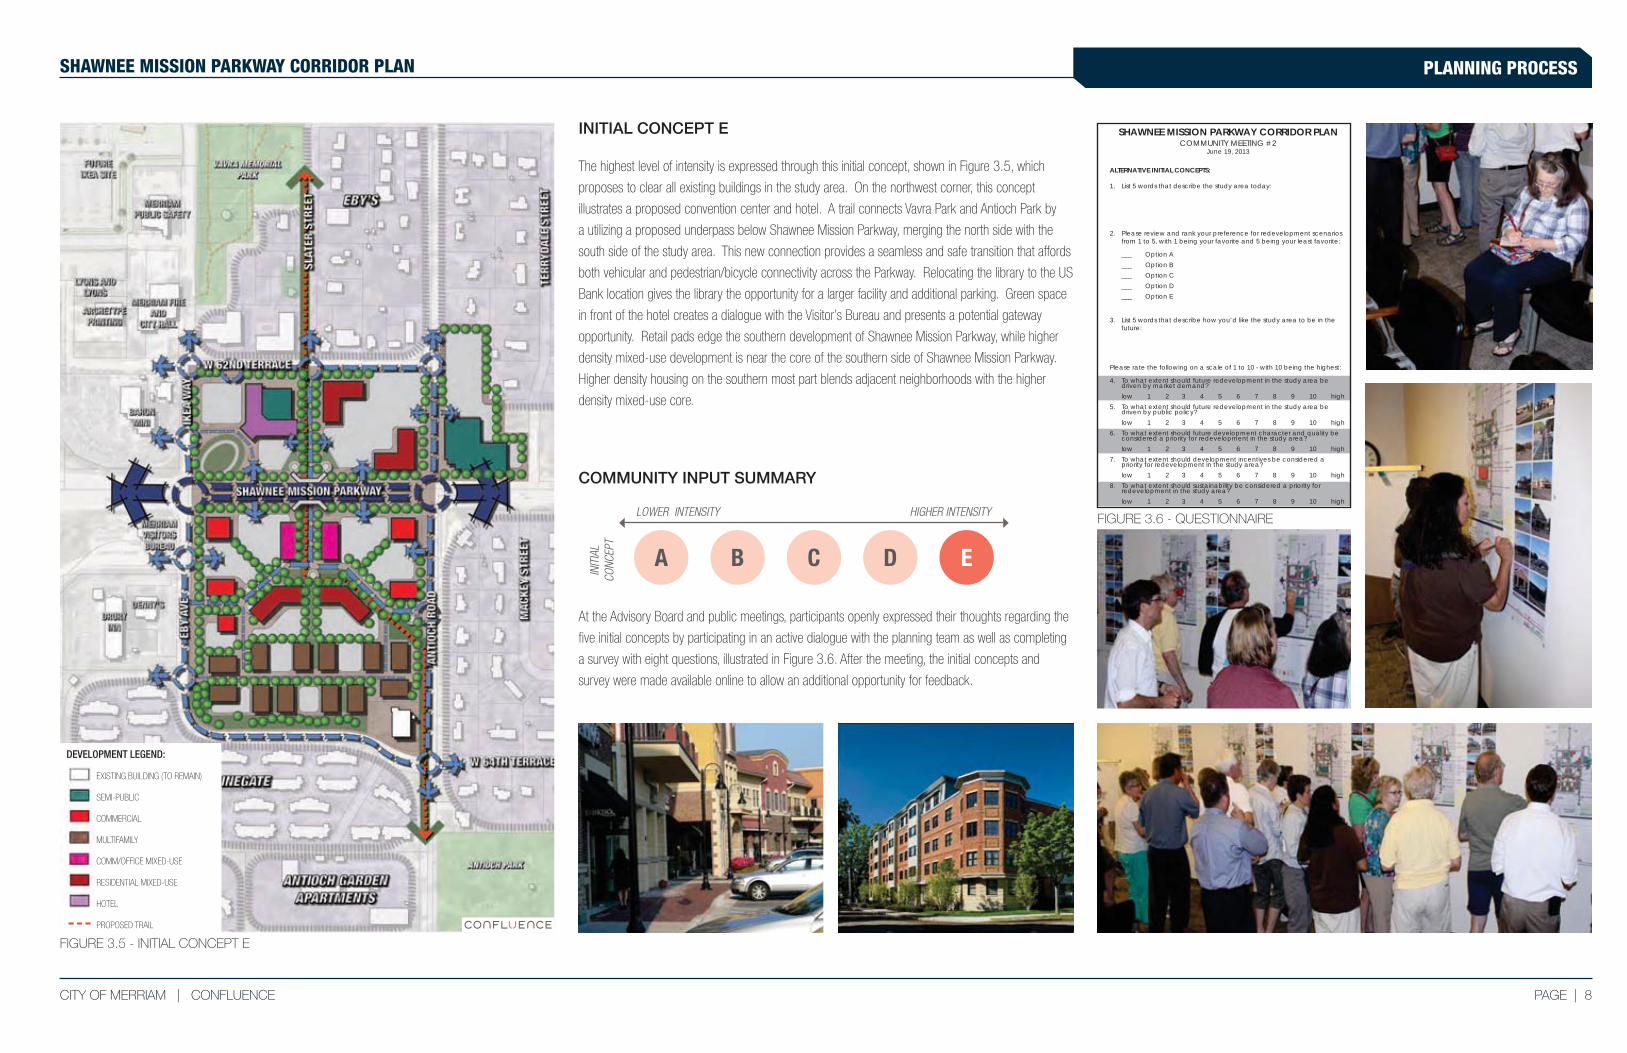
INITIAL CONCEPT E
The highest level of intensity is expressed through this initial concept, shown in Figure 3.5, which
proposes to clear all existing buildings in the study area. On the northwest corner, this concept
illustrates a proposed convention center and hotel. A trail connects Vavra Park and Antioch Park by
a utilizing a proposed underpass below Shawnee Mission Parkway, merging the north side with the
south side of the study area. This new connection provides a seamless and safe transition that affords
both vehicular and pedestrian/bicycle connectivity across the Parkway. Relocating the library to the US
Bank location gives the library the opportunity for a larger facility and additional parking. Green space
in front of the hotel creates a dialogue with the Visitor’s Bureau and presents a potential gateway
opportunity. Retail pads edge the southern development of Shawnee Mission Parkway, while higher
density mixed-use development is near the core of the southern side of Shawnee Mission Parkway.
Higher density housing on the southern most part blends adjacent neighborhoods with the higher
density mixed-use core.
At the Advisory Board and public meetings, participants openly expressed their thoughts regarding the
five initial concepts by participating in an active dialogue with the planning team as well as completing
a survey with eight questions, illustrated in Figure 3.6. After the meeting, the initial concepts and
survey were made available online to allow an additional opportunity for feedback.
LOWER INTENSITY HIGHER INTENSITY
A B C D EIN
ITIA
LCO
NCEP
T
COMMUNITY INPUT SUMMARY
FIGURE 3.5 - INITIAL CONCEPT E
ALTERNATIVE INITIAL CONCEPTS:
1. List 5 words that describe the study area today:
2. Please review and rank your preference for redevelopment scenarios from 1 to 5, with 1 being your favorite and 5 being your least favorite:
___ Option A ___ Option B ___ Option C ___ Option D ___ Option E
3. List 5 words that describe how you’d like the study area to be in the future:
Please rate the following on a scale of 1 to 10 - with 10 being the highest:
4. To what extent should future redevelopment in the study area be driven by market demand? low 1 2 3 4 5 6 7 8 9 10 high5. To what extent should future redevelopment in the study area be driven by public policy? low 1 2 3 4 5 6 7 8 9 10 high6. To what extent should future development character and quality be considered a priority for redevelopment in the study area? low 1 2 3 4 5 6 7 8 9 10 high7. To what extent should development incentives be considered a priority for redevelopment in the study area? low 1 2 3 4 5 6 7 8 9 10 high8. To what extent should sustainability be considered a priority for redevelopment in the study area? low 1 2 3 4 5 6 7 8 9 10 high
SHAWNEE MISSION PARKWAY CORRIDOR PLAN COMMUNITY MEETING #2
June 19, 2013
FIGURE 3.6 - QUESTIONNAIRE
DEVELOPMENT LEGEND:
EXISTING BUILDING (TO REMAIN)
SEMI-PUBLIC
COMMERCIAL
MULTIFAMILY
COMM/OFFICE MIXED-USE
RESIDENTIAL MIXED-USE
HOTEL
PROPOSED TRAIL
9 | PAGE CONFLUENCE | CITY OF MERRIAM
PLANNING PROCESS SHAWNEE MISSION PARKWAY CORRIDOR PLAN
A third question asked survey participants to rank the initial concepts by order of preference from most
preferred (1) to least preferred (5). Out of all of the responses from the survey participants, the overall
preferred concept was Initial Concept D, a higher density, mixed-use design concept that proposed
nearly the whole site to be redeveloped. In addition, more than 76 percent of respondents stated they
preferred Initial Concept A the least.
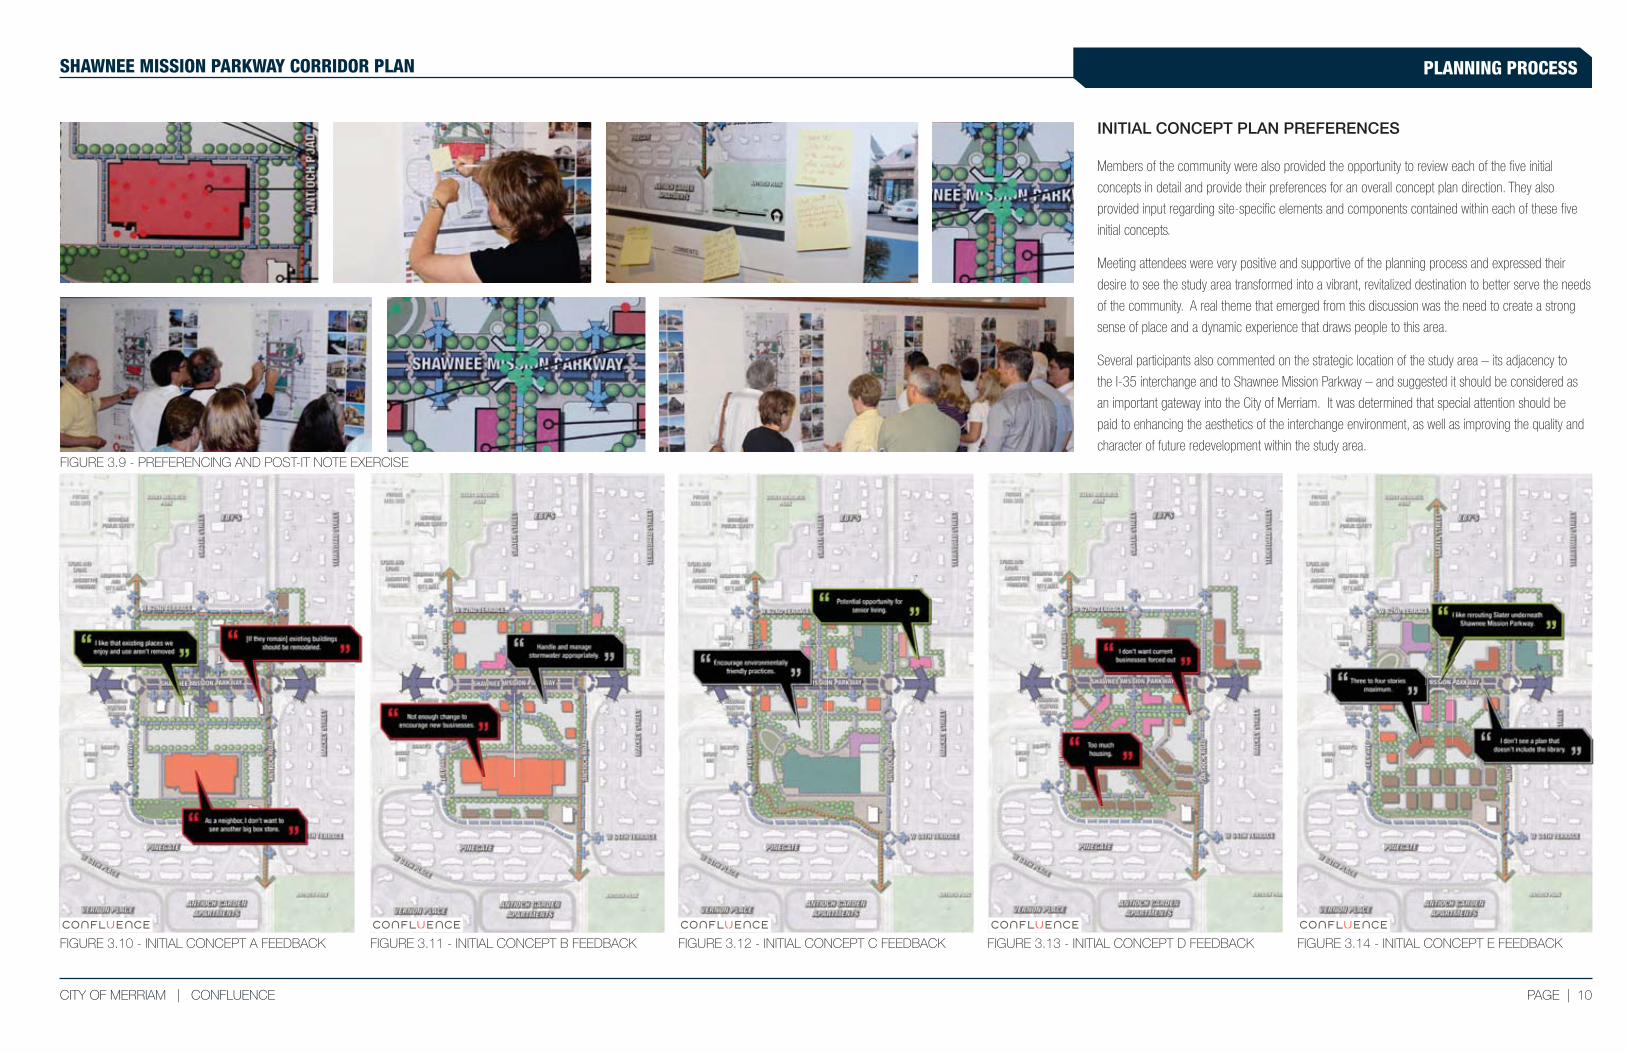
During the public meeting, participants were also asked to partake in a preferencing and post-
it note exercise. Participants placed dots on certain elements that they liked and disliked about
the initial concepts at the meeting. The idea of retaining the existing K-Mart site, even with minor
enhancements, generally was not supported. Participants wanted to see change, yielding great
support towards higher intensity initial concepts and ideas such as the proposed Slater underpass,
which received very positive responses. Figures 3.9-3.14 further illustrate this process, including
important feedback particular to each initial concept.
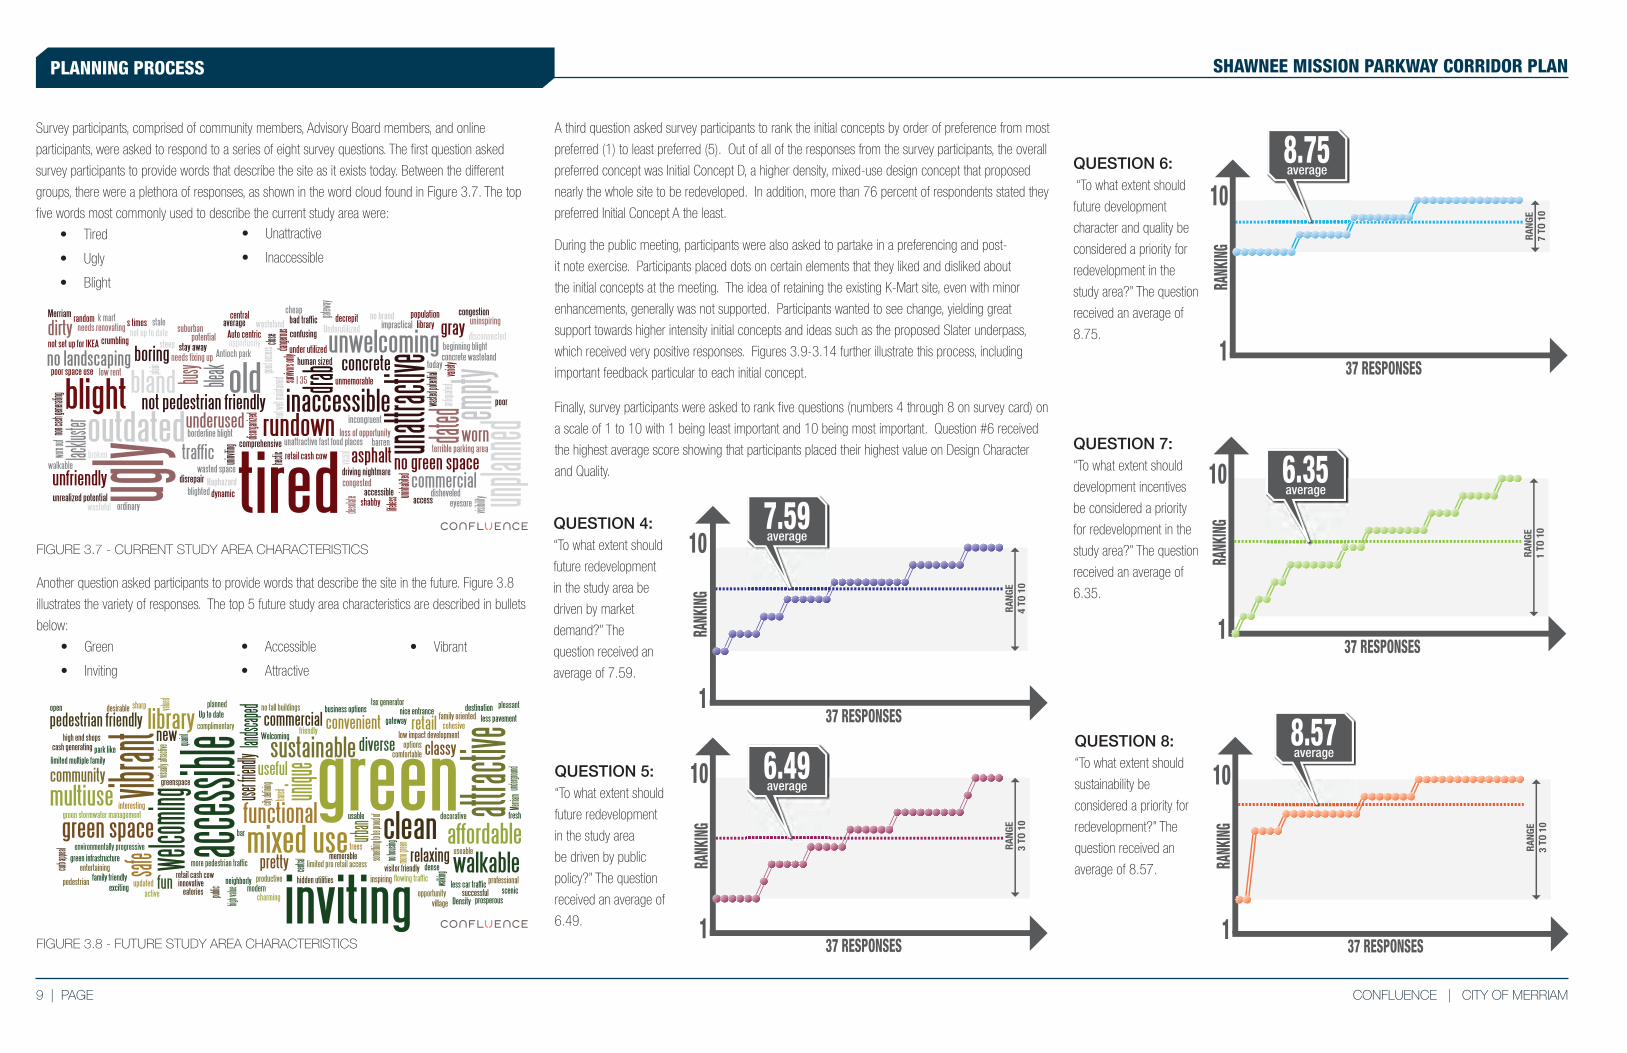
Finally, survey participants were asked to rank five questions (numbers 4 through 8 on survey card) on
a scale of 1 to 10 with 1 being least important and 10 being most important. Question #6 received
the highest average score showing that participants placed their highest value on Design Character
and Quality.
Survey participants, comprised of community members, Advisory Board members, and online
participants, were asked to respond to a series of eight survey questions. The first question asked
survey participants to provide words that describe the site as it exists today. Between the different
groups, there were a plethora of responses, as shown in the word cloud found in Figure 3.7. The top
five words most commonly used to describe the current study area were:
• Tired
• Ugly
• Blight
1
10
RANK
ING RANG
E4
TO 1
0
37 RESPONSES
7.59average
1
10
37 RESPONSES
RANG
E3
TO 1
0
RANK
ING
6.49average
RANK
ING
1
10
RANG
E7
TO 1
0
37 RESPONSES
8.75average
1
10
RANK
ING
RANG
E1
TO 1
0
37 RESPONSES
6.35average
1
10
RANK
ING
8.57average
RANG
E3
TO 1
0
37 RESPONSES
QUESTION 4:“To what extent should
future redevelopment
in the study area be
driven by market
demand?” The
question received an
average of 7.59.
QUESTION 5: “To what extent should
future redevelopment
in the study area
be driven by public
policy?” The question
received an average of
6.49.
QUESTION 6: “To what extent should
future development
character and quality be
considered a priority for
redevelopment in the
study area?” The question
received an average of
8.75.
QUESTION 7:“To what extent should
development incentives
be considered a priority
for redevelopment in the
study area?” The question
received an average of
6.35.
QUESTION 8:“To what extent should
sustainability be
considered a priority for
redevelopment?” The
question received an
average of 8.57.
Another question asked participants to provide words that describe the site in the future. Figure 3.8
illustrates the variety of responses. The top 5 future study area characteristics are described in bullets
below:
• Green
• Inviting
• Accessible
• Attractive
• Vibrant
• Unattractive
• Inaccessible
FIGURE 3.8 - FUTURE STUDY AREA CHARACTERISTICS
FIGURE 3.7 - CURRENT STUDY AREA CHARACTERISTICS
PAGE | 10CITY OF MERRIAM | CONFLUENCE
PLANNING PROCESSSHAWNEE MISSION PARKWAY CORRIDOR PLAN
FIGURE 3.10 - INITIAL CONCEPT A FEEDBACK FIGURE 3.11 - INITIAL CONCEPT B FEEDBACK FIGURE 3.12 - INITIAL CONCEPT C FEEDBACK FIGURE 3.13 - INITIAL CONCEPT D FEEDBACK FIGURE 3.14 - INITIAL CONCEPT E FEEDBACK
FIGURE 3.9 - PREFERENCING AND POST-IT NOTE EXERCISE
INITIAL CONCEPT PLAN PREFERENCES
Members of the community were also provided the opportunity to review each of the five initial
concepts in detail and provide their preferences for an overall concept plan direction. They also
provided input regarding site-specific elements and components contained within each of these five
initial concepts.
Meeting attendees were very positive and supportive of the planning process and expressed their
desire to see the study area transformed into a vibrant, revitalized destination to better serve the needs
of the community. A real theme that emerged from this discussion was the need to create a strong
sense of place and a dynamic experience that draws people to this area.
Several participants also commented on the strategic location of the study area – its adjacency to
the I-35 interchange and to Shawnee Mission Parkway – and suggested it should be considered as
an important gateway into the City of Merriam. It was determined that special attention should be
paid to enhancing the aesthetics of the interchange environment, as well as improving the quality and
character of future redevelopment within the study area.
11 | PAGE CONFLUENCE | CITY OF MERRIAM
PLANNING PROCESS SHAWNEE MISSION PARKWAY CORRIDOR PLAN
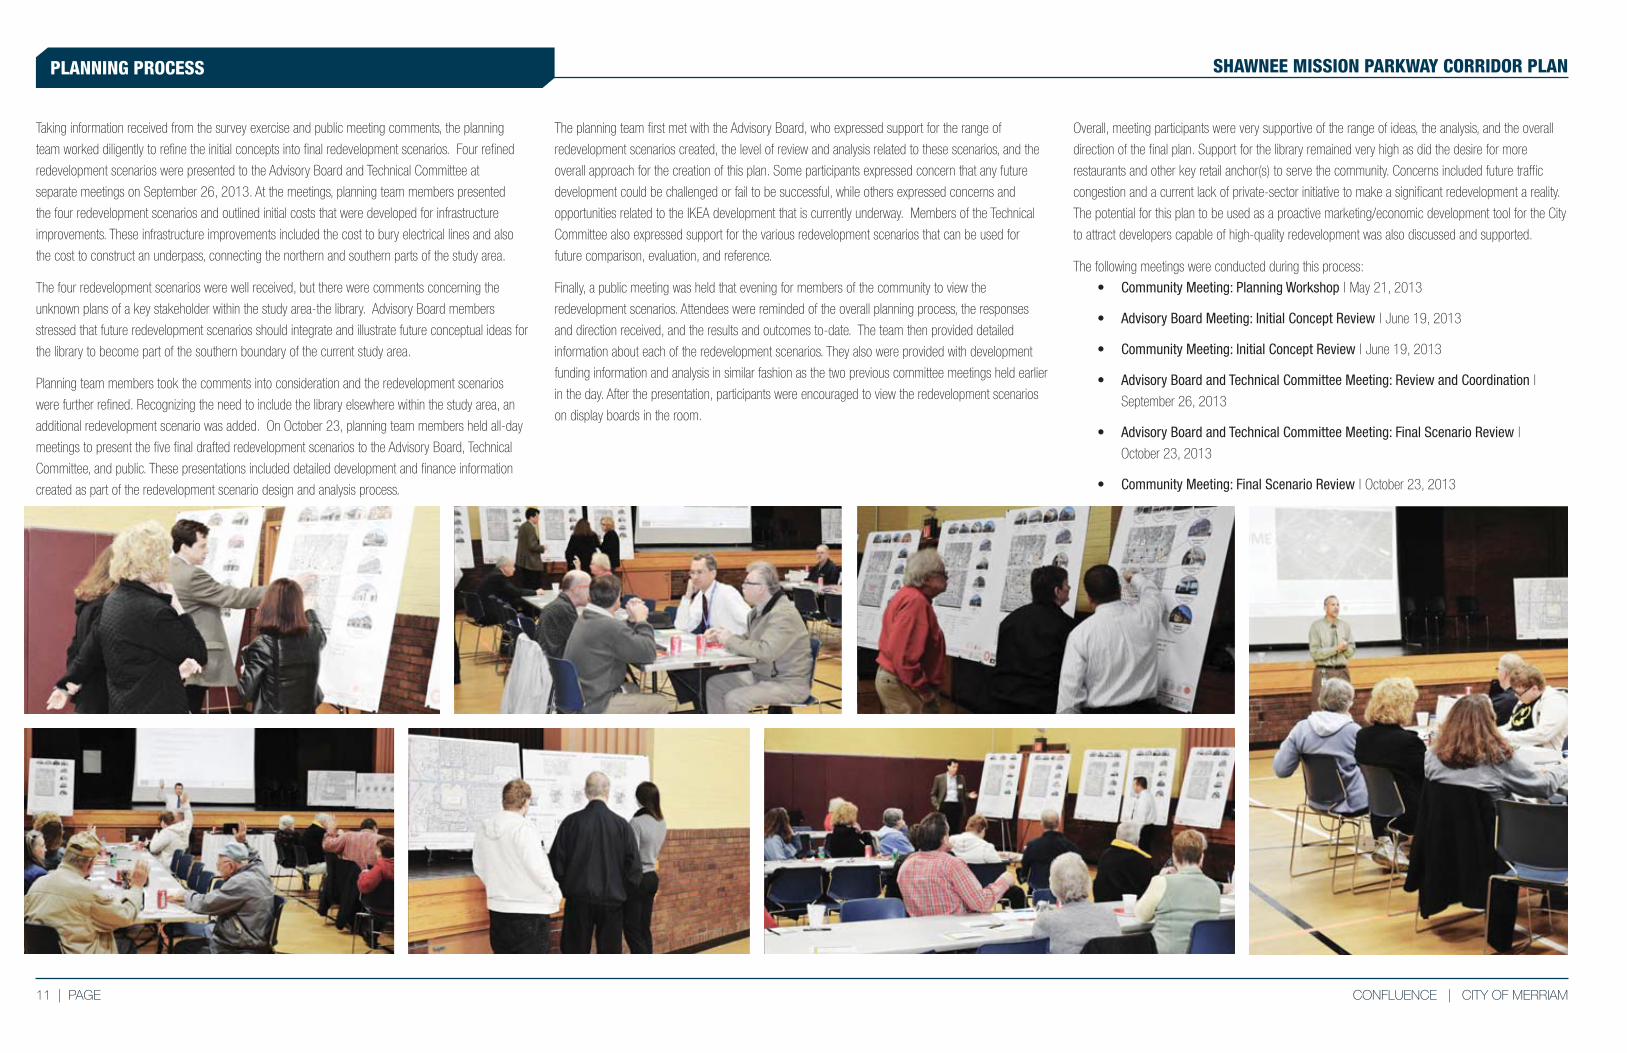
Taking information received from the survey exercise and public meeting comments, the planning
team worked diligently to refine the initial concepts into final redevelopment scenarios. Four refined
redevelopment scenarios were presented to the Advisory Board and Technical Committee at
separate meetings on September 26, 2013. At the meetings, planning team members presented
the four redevelopment scenarios and outlined initial costs that were developed for infrastructure
improvements. These infrastructure improvements included the cost to bury electrical lines and also
the cost to construct an underpass, connecting the northern and southern parts of the study area.
The four redevelopment scenarios were well received, but there were comments concerning the
unknown plans of a key stakeholder within the study area-the library. Advisory Board members
stressed that future redevelopment scenarios should integrate and illustrate future conceptual ideas for
the library to become part of the southern boundary of the current study area.
Planning team members took the comments into consideration and the redevelopment scenarios
were further refined. Recognizing the need to include the library elsewhere within the study area, an
additional redevelopment scenario was added. On October 23, planning team members held all-day
meetings to present the five final drafted redevelopment scenarios to the Advisory Board, Technical
Committee, and public. These presentations included detailed development and finance information
created as part of the redevelopment scenario design and analysis process.
The planning team first met with the Advisory Board, who expressed support for the range of
redevelopment scenarios created, the level of review and analysis related to these scenarios, and the
overall approach for the creation of this plan. Some participants expressed concern that any future
development could be challenged or fail to be successful, while others expressed concerns and
opportunities related to the IKEA development that is currently underway. Members of the Technical
Committee also expressed support for the various redevelopment scenarios that can be used for
future comparison, evaluation, and reference.
Finally, a public meeting was held that evening for members of the community to view the
redevelopment scenarios. Attendees were reminded of the overall planning process, the responses
and direction received, and the results and outcomes to-date. The team then provided detailed
information about each of the redevelopment scenarios. They also were provided with development
funding information and analysis in similar fashion as the two previous committee meetings held earlier
in the day. After the presentation, participants were encouraged to view the redevelopment scenarios
on display boards in the room.
Overall, meeting participants were very supportive of the range of ideas, the analysis, and the overall
direction of the final plan. Support for the library remained very high as did the desire for more
restaurants and other key retail anchor(s) to serve the community. Concerns included future traffic
congestion and a current lack of private-sector initiative to make a significant redevelopment a reality.
The potential for this plan to be used as a proactive marketing/economic development tool for the City
to attract developers capable of high-quality redevelopment was also discussed and supported.
The following meetings were conducted during this process:
• Community Meeting: Planning Workshop | May 21, 2013
• Advisory Board Meeting: Initial Concept Review | June 19, 2013
• Community Meeting: Initial Concept Review | June 19, 2013
• Advisory Board and Technical Committee Meeting: Review and Coordination |
September 26, 2013
• Advisory Board and Technical Committee Meeting: Final Scenario Review |
October 23, 2013
• Community Meeting: Final Scenario Review | October 23, 2013

SHAWNEE MISSION PARKWAY CORRIDOR PLAN
REDEVELOPMENT RECOMMENDATIONS SECTION 4
12 | PAGE CONFLUENCE | CITY OF MERRIAM
REDEVELOPMENT RECOMMENDATIONS SHAWNEE MISSION PARKWAY CORRIDOR PLAN
FINAL PLAN RECOMMENDATIONS
This design direction and intended use of the Shawnee Mission Parkway Corridor Plan is fairly
unique in that the results of the planning and review process do not create a preferred or required
development plan within the study area. Based on the input from the community, it is understood
that future redevelopment or revitalization within this study area should be market-driven by private
development interests.
The idea behind developing a range of redevelopment scenarios was to test and analyze the relative
differences in the type and density of development, including their anticipated financial performance.
It is not anticipated that a future development application will be exactly like any of these scenarios.
Through a process of creating and evaluating concepts ranging from very little change in the existing
condition to concepts with substantial changes in development type and density, the plan provides
an array of redevelopment scenarios and related financial performance information upon which to
compare future development applications that may be submitted.
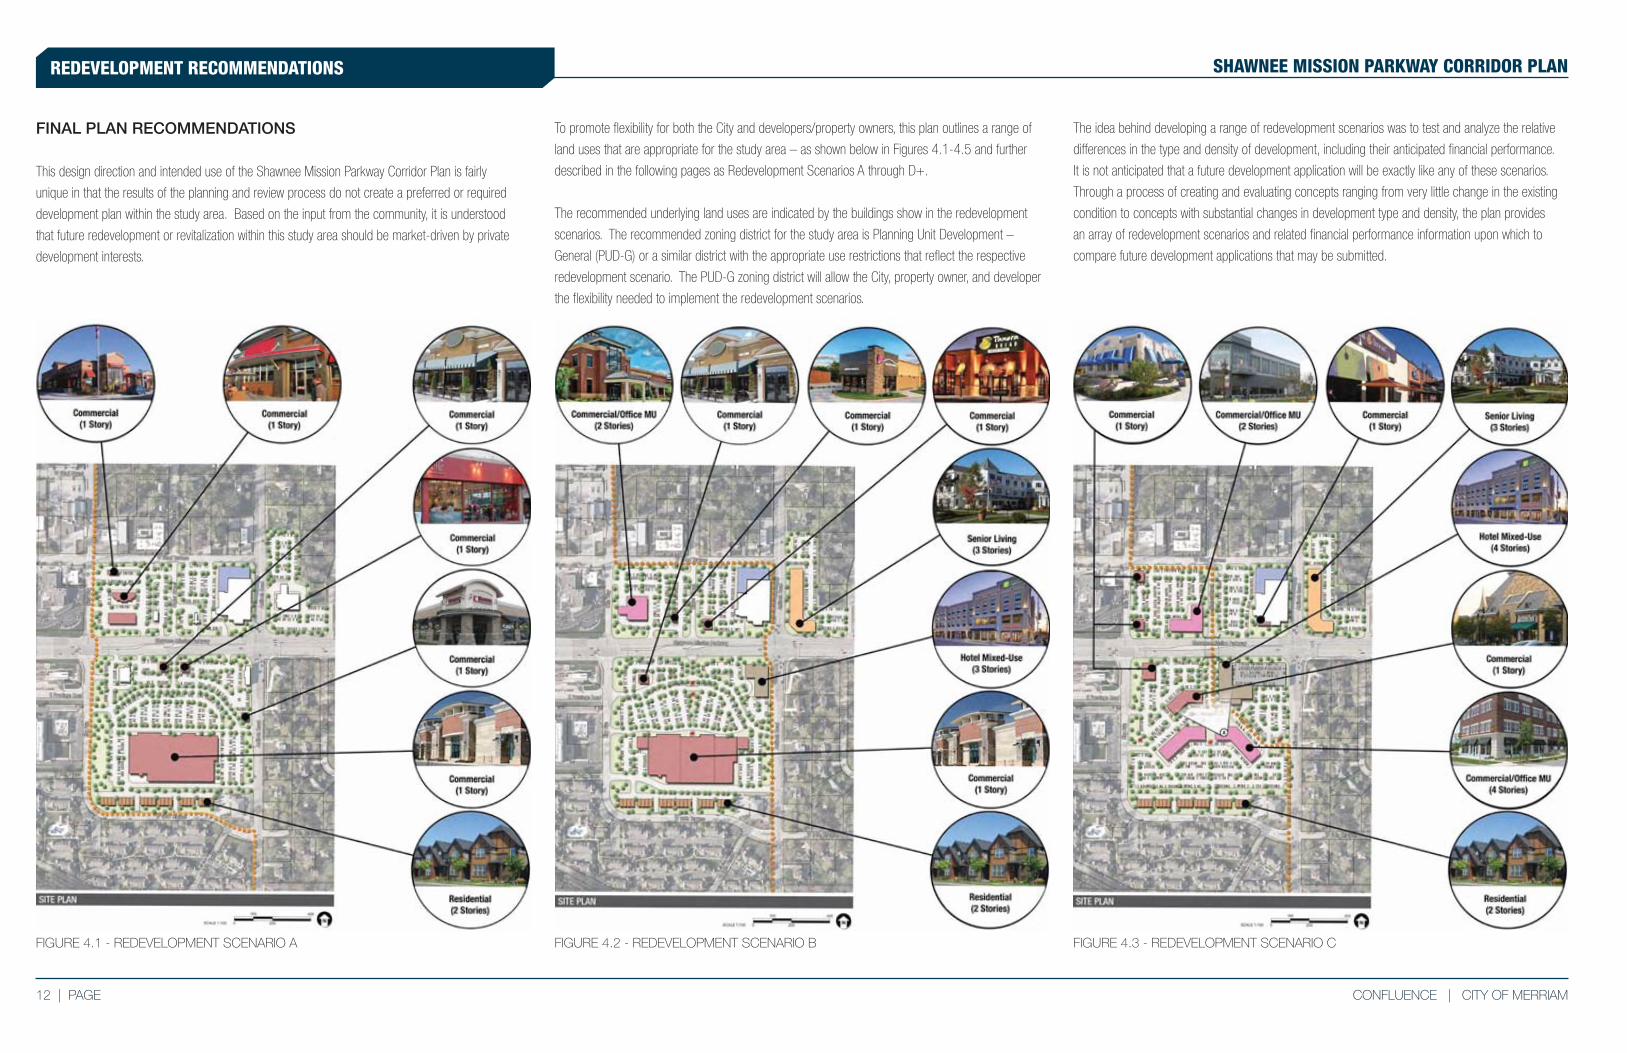
To promote flexibility for both the City and developers/property owners, this plan outlines a range of
land uses that are appropriate for the study area – as shown below in Figures 4.1-4.5 and further
described in the following pages as Redevelopment Scenarios A through D+.
The recommended underlying land uses are indicated by the buildings show in the redevelopment
scenarios. The recommended zoning district for the study area is Planning Unit Development –
General (PUD-G) or a similar district with the appropriate use restrictions that reflect the respective
redevelopment scenario. The PUD-G zoning district will allow the City, property owner, and developer
the flexibility needed to implement the redevelopment scenarios.
FIGURE 4.1 - REDEVELOPMENT SCENARIO A FIGURE 4.2 - REDEVELOPMENT SCENARIO B FIGURE 4.3 - REDEVELOPMENT SCENARIO C
PAGE | 13CITY OF MERRIAM | CONFLUENCE
REDEVELOPMENT RECOMMENDATIONSSHAWNEE MISSION PARKWAY CORRIDOR PLAN
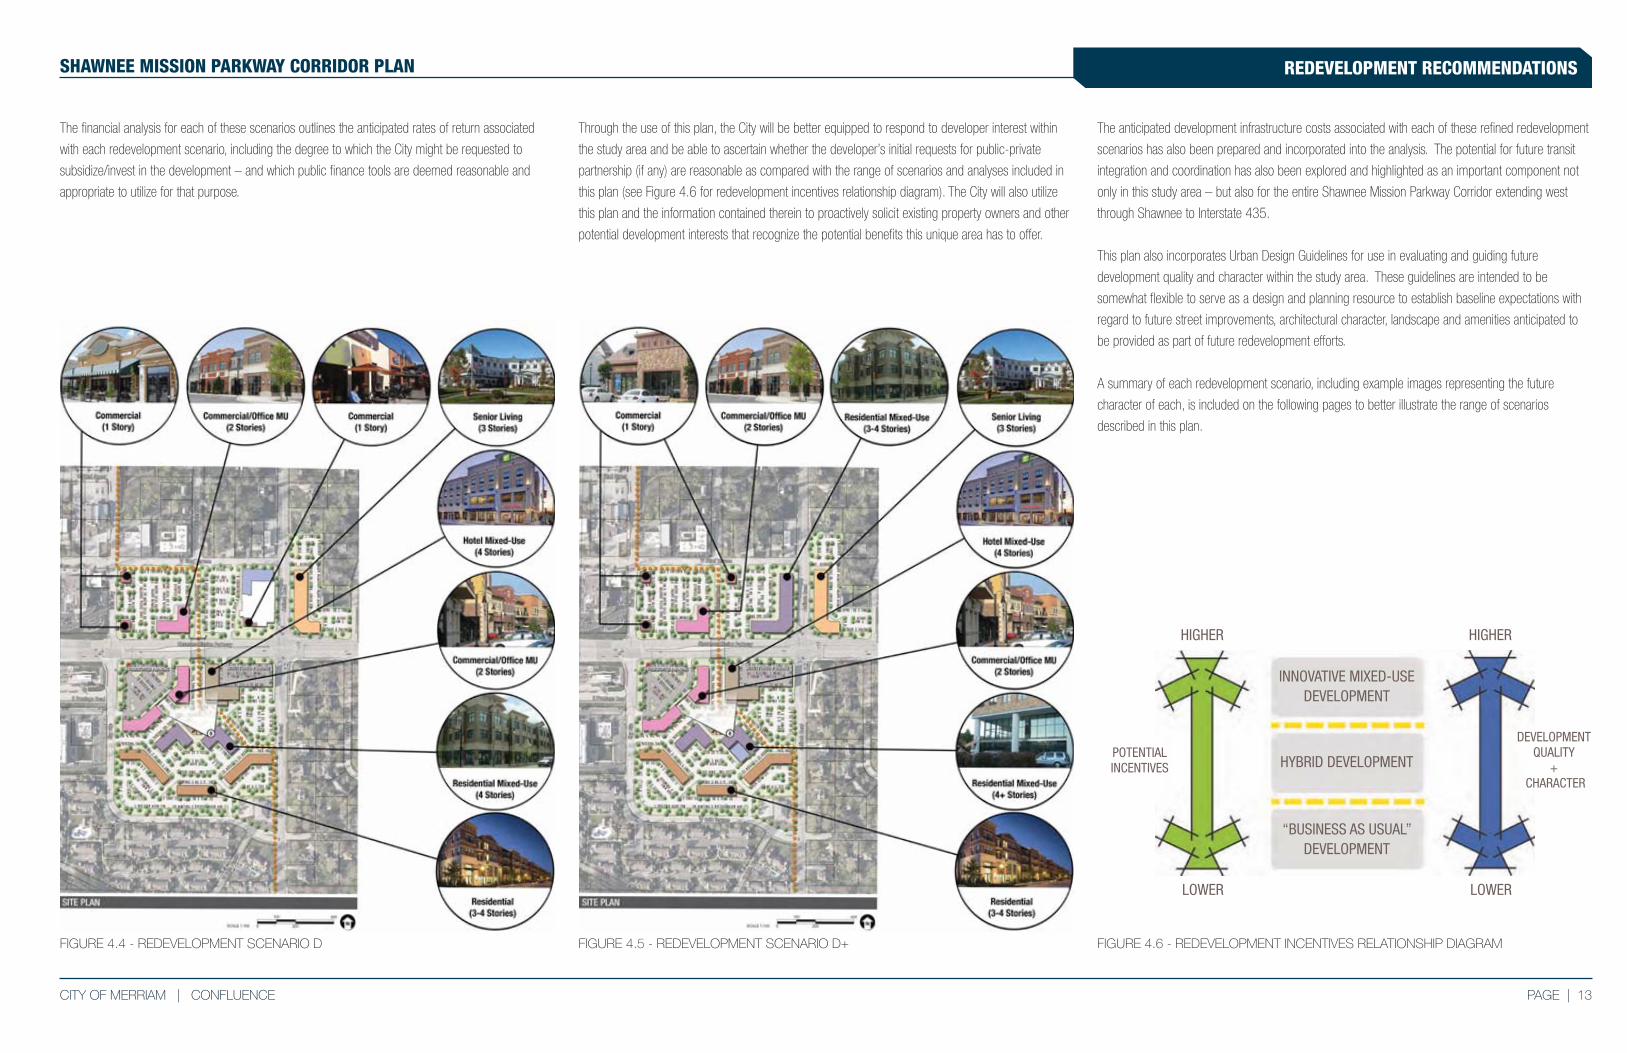
FIGURE 4.4 - REDEVELOPMENT SCENARIO D FIGURE 4.5 - REDEVELOPMENT SCENARIO D+
The financial analysis for each of these scenarios outlines the anticipated rates of return associated
with each redevelopment scenario, including the degree to which the City might be requested to
subsidize/invest in the development – and which public finance tools are deemed reasonable and
appropriate to utilize for that purpose.
Through the use of this plan, the City will be better equipped to respond to developer interest within
the study area and be able to ascertain whether the developer’s initial requests for public-private
partnership (if any) are reasonable as compared with the range of scenarios and analyses included in
this plan (see Figure 4.6 for redevelopment incentives relationship diagram). The City will also utilize
this plan and the information contained therein to proactively solicit existing property owners and other
potential development interests that recognize the potential benefits this unique area has to offer.
The anticipated development infrastructure costs associated with each of these refined redevelopment
scenarios has also been prepared and incorporated into the analysis. The potential for future transit
integration and coordination has also been explored and highlighted as an important component not
only in this study area – but also for the entire Shawnee Mission Parkway Corridor extending west
through Shawnee to Interstate 435.
This plan also incorporates Urban Design Guidelines for use in evaluating and guiding future
development quality and character within the study area. These guidelines are intended to be
somewhat flexible to serve as a design and planning resource to establish baseline expectations with
regard to future street improvements, architectural character, landscape and amenities anticipated to
be provided as part of future redevelopment efforts.
A summary of each redevelopment scenario, including example images representing the future
character of each, is included on the following pages to better illustrate the range of scenarios
described in this plan.
INNOVATIVE MIXED-USE
DEVELOPMENT
HYBRID DEVELOPMENT
“BUSINESS AS USUAL”
DEVELOPMENT
HIGHER
LOWER
DEVELOPMENT QUALITY
+ CHARACTER
POTENTIAL INCENTIVES
HIGHER
LOWER
FIGURE 4.6 - REDEVELOPMENT INCENTIVES RELATIONSHIP DIAGRAM
14 | PAGE CONFLUENCE | CITY OF MERRIAM
REDEVELOPMENT RECOMMENDATIONS SHAWNEE MISSION PARKWAY CORRIDOR PLAN
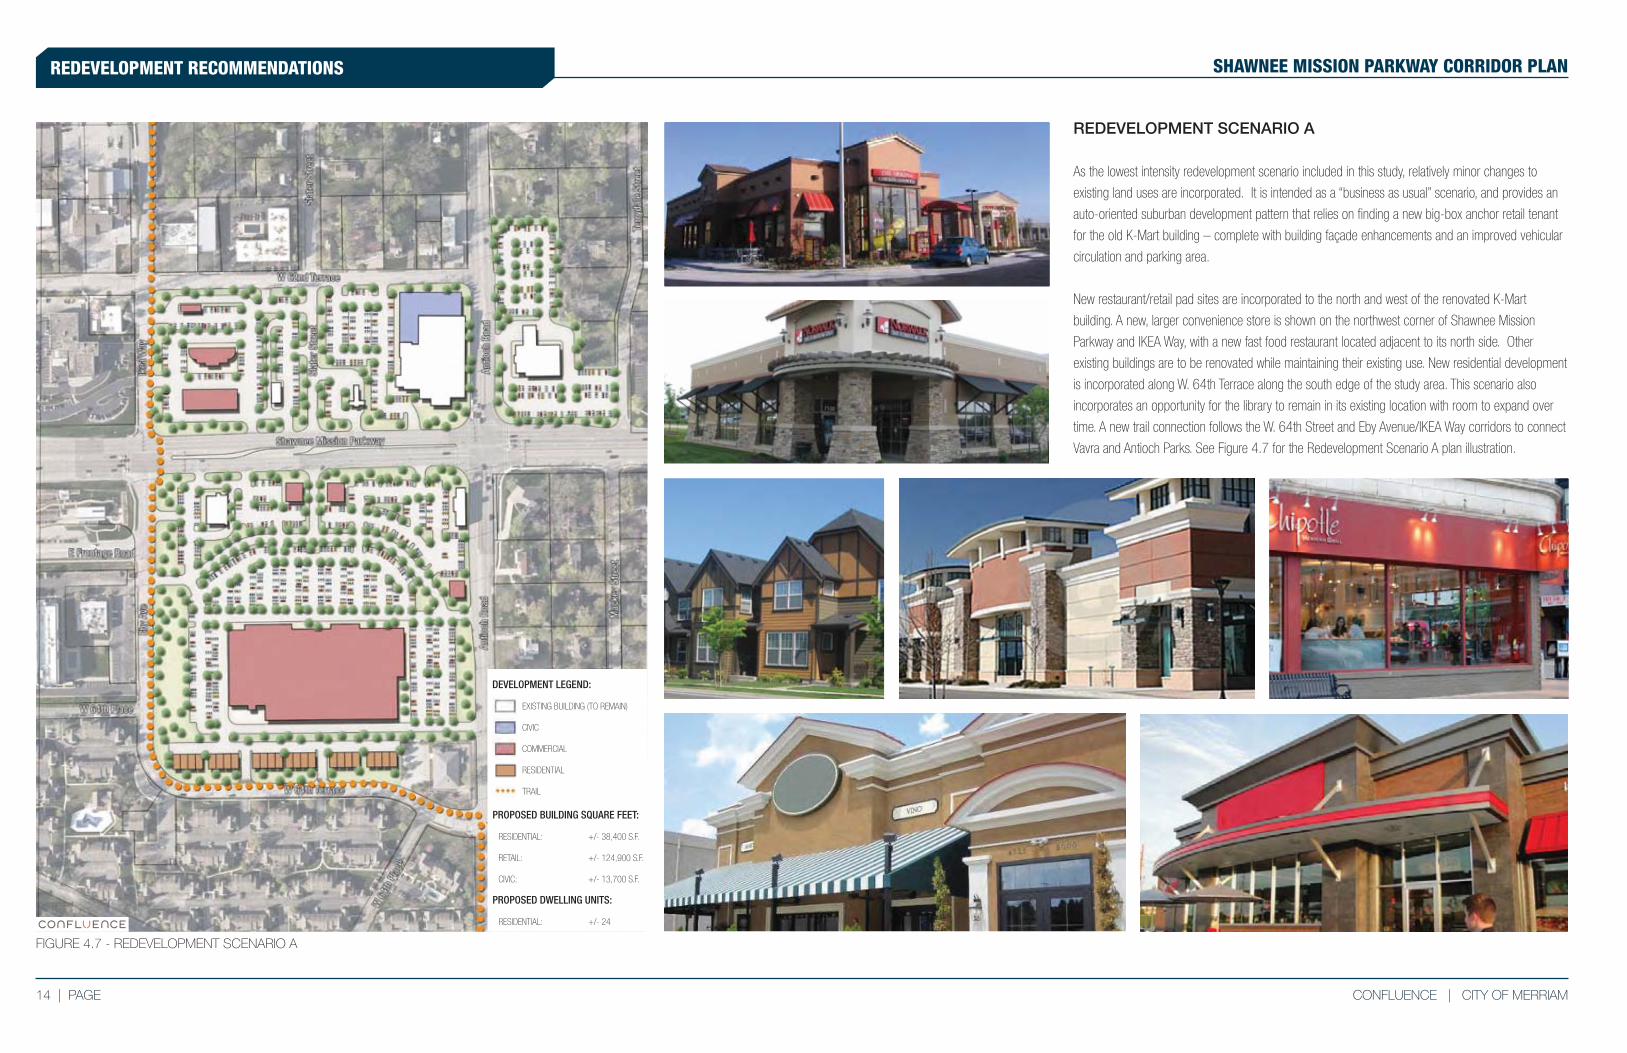
FIGURE 4.7 - REDEVELOPMENT SCENARIO A
PROPOSED BUILDING SQUARE FEET:
RESIDENTIAL: +/- 38,400 S.F.
RETAIL: +/- 124,900 S.F.
CIVIC: +/- 13,700 S.F.
PROPOSED DWELLING UNITS:
RESIDENTIAL: +/- 24
DEVELOPMENT LEGEND:
EXISTING BUILDING (TO REMAIN)
CIVIC
COMMERCIAL
RESIDENTIAL
TRAIL
REDEVELOPMENT SCENARIO A
As the lowest intensity redevelopment scenario included in this study, relatively minor changes to
existing land uses are incorporated. It is intended as a “business as usual” scenario, and provides an
auto-oriented suburban development pattern that relies on finding a new big-box anchor retail tenant
for the old K-Mart building – complete with building façade enhancements and an improved vehicular
circulation and parking area.
New restaurant/retail pad sites are incorporated to the north and west of the renovated K-Mart
building. A new, larger convenience store is shown on the northwest corner of Shawnee Mission
Parkway and IKEA Way, with a new fast food restaurant located adjacent to its north side. Other
existing buildings are to be renovated while maintaining their existing use. New residential development
is incorporated along W. 64th Terrace along the south edge of the study area. This scenario also
incorporates an opportunity for the library to remain in its existing location with room to expand over
time. A new trail connection follows the W. 64th Street and Eby Avenue/IKEA Way corridors to connect
Vavra and Antioch Parks. See Figure 4.7 for the Redevelopment Scenario A plan illustration.
PAGE | 15CITY OF MERRIAM | CONFLUENCE
REDEVELOPMENT RECOMMENDATIONSSHAWNEE MISSION PARKWAY CORRIDOR PLAN
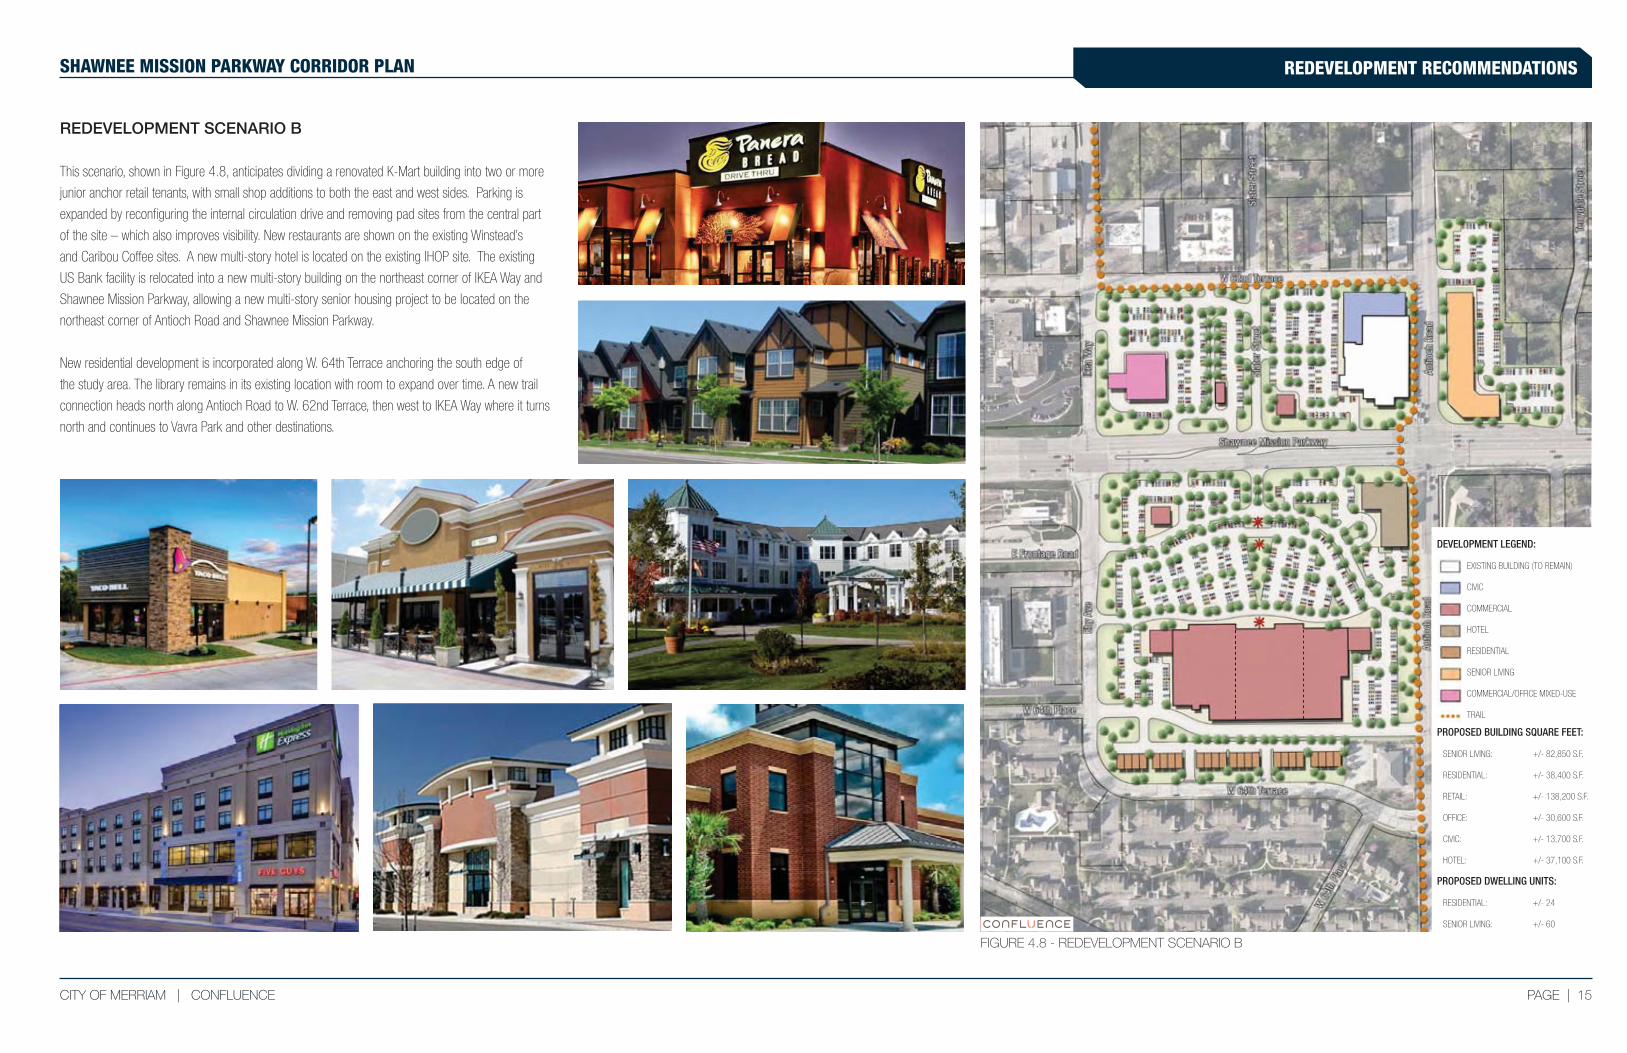
FIGURE 4.8 - REDEVELOPMENT SCENARIO B
DEVELOPMENT LEGEND:
EXISTING BUILDING (TO REMAIN)
CIVIC
COMMERCIAL
HOTEL
RESIDENTIAL
SENIOR LIVING
COMMERCIAL/OFFICE MIXED-USE
TRAIL
PROPOSED BUILDING SQUARE FEET:
SENIOR LIVING: +/- 82,850 S.F.
RESIDENTIAL: +/- 38,400 S.F.
RETAIL: +/- 138,200 S.F.
OFFICE: +/- 30,600 S.F.
CIVIC: +/- 13,700 S.F.
HOTEL: +/- 37,100 S.F.
PROPOSED DWELLING UNITS:
RESIDENTIAL: +/- 24
SENIOR LIVING: +/- 60
REDEVELOPMENT SCENARIO B
This scenario, shown in Figure 4.8, anticipates dividing a renovated K-Mart building into two or more
junior anchor retail tenants, with small shop additions to both the east and west sides. Parking is
expanded by reconfiguring the internal circulation drive and removing pad sites from the central part
of the site – which also improves visibility. New restaurants are shown on the existing Winstead’s
and Caribou Coffee sites. A new multi-story hotel is located on the existing IHOP site. The existing
US Bank facility is relocated into a new multi-story building on the northeast corner of IKEA Way and
Shawnee Mission Parkway, allowing a new multi-story senior housing project to be located on the
northeast corner of Antioch Road and Shawnee Mission Parkway.
New residential development is incorporated along W. 64th Terrace anchoring the south edge of
the study area. The library remains in its existing location with room to expand over time. A new trail
connection heads north along Antioch Road to W. 62nd Terrace, then west to IKEA Way where it turns
north and continues to Vavra Park and other destinations.
16 | PAGE CONFLUENCE | CITY OF MERRIAM
REDEVELOPMENT RECOMMENDATIONS SHAWNEE MISSION PARKWAY CORRIDOR PLAN
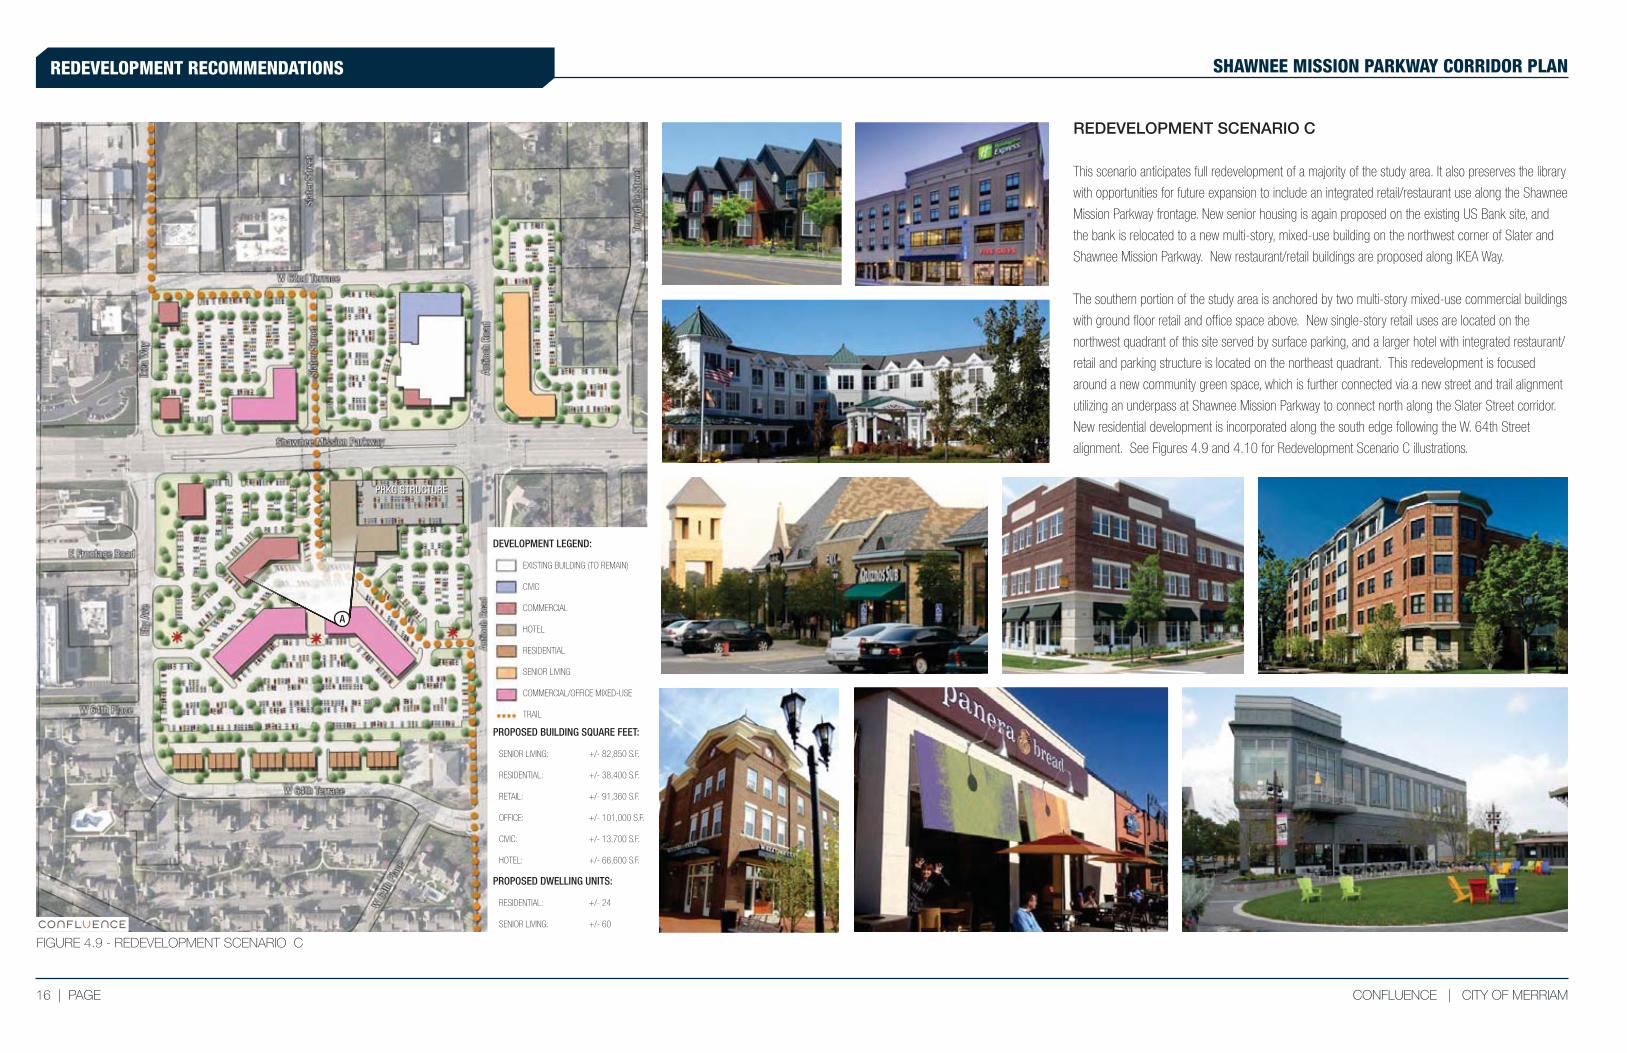
FIGURE 4.9 - REDEVELOPMENT SCENARIO C
DEVELOPMENT LEGEND:
EXISTING BUILDING (TO REMAIN)
CIVIC
COMMERCIAL
HOTEL
RESIDENTIAL
SENIOR LIVING
COMMERCIAL/OFFICE MIXED-USE
TRAIL
PROPOSED BUILDING SQUARE FEET:
SENIOR LIVING: +/- 82,850 S.F.
RESIDENTIAL: +/- 38,400 S.F.
RETAIL: +/- 91,360 S.F.
OFFICE: +/- 101,000 S.F.
CIVIC: +/- 13,700 S.F.
HOTEL: +/- 66,600 S.F.
PROPOSED DWELLING UNITS:
RESIDENTIAL: +/- 24
SENIOR LIVING: +/- 60
REDEVELOPMENT SCENARIO C
This scenario anticipates full redevelopment of a majority of the study area. It also preserves the library
with opportunities for future expansion to include an integrated retail/restaurant use along the Shawnee
Mission Parkway frontage. New senior housing is again proposed on the existing US Bank site, and
the bank is relocated to a new multi-story, mixed-use building on the northwest corner of Slater and
Shawnee Mission Parkway. New restaurant/retail buildings are proposed along IKEA Way.
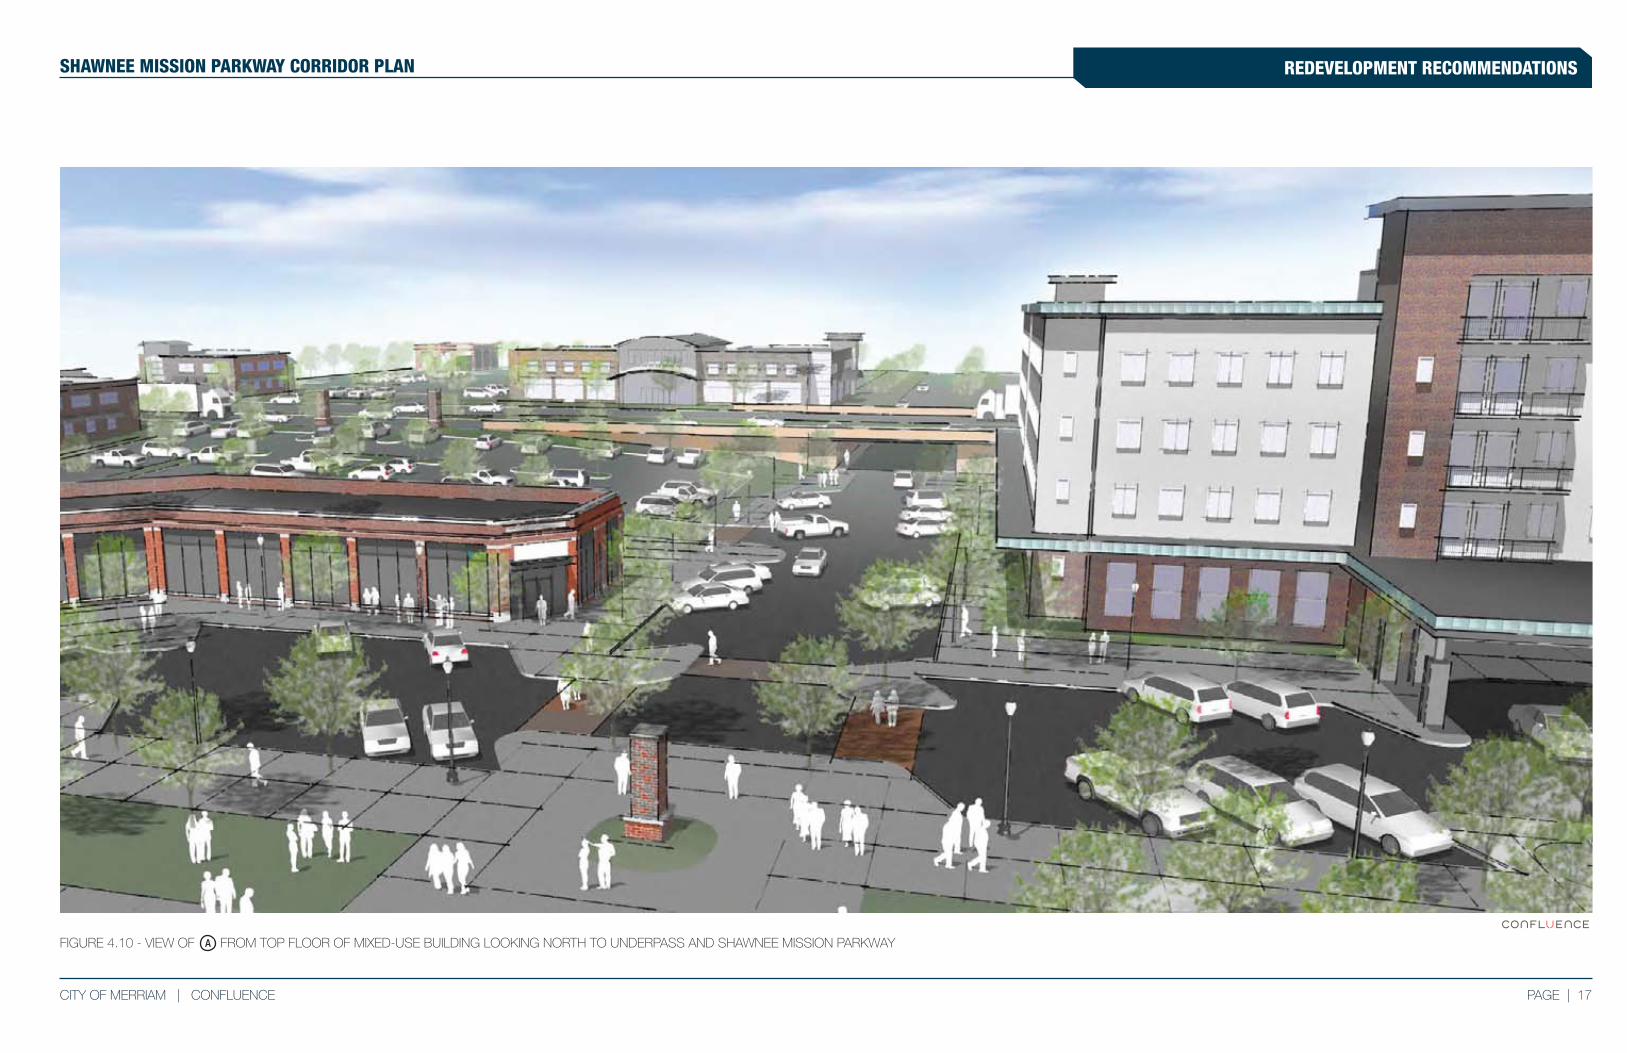
The southern portion of the study area is anchored by two multi-story mixed-use commercial buildings
with ground floor retail and office space above. New single-story retail uses are located on the
northwest quadrant of this site served by surface parking, and a larger hotel with integrated restaurant/
retail and parking structure is located on the northeast quadrant. This redevelopment is focused
around a new community green space, which is further connected via a new street and trail alignment
utilizing an underpass at Shawnee Mission Parkway to connect north along the Slater Street corridor.
New residential development is incorporated along the south edge following the W. 64th Street
alignment. See Figures 4.9 and 4.10 for Redevelopment Scenario C illustrations.
PRKG STRUCTURE
A
PAGE | 17CITY OF MERRIAM | CONFLUENCE
REDEVELOPMENT RECOMMENDATIONSSHAWNEE MISSION PARKWAY CORRIDOR PLAN
FIGURE 4.10 - VIEW OF FROM TOP FLOOR OF MIXED-USE BUILDING LOOKING NORTH TO UNDERPASS AND SHAWNEE MISSION PARKWAYA
18 | PAGE CONFLUENCE | CITY OF MERRIAM
REDEVELOPMENT RECOMMENDATIONS SHAWNEE MISSION PARKWAY CORRIDOR PLAN
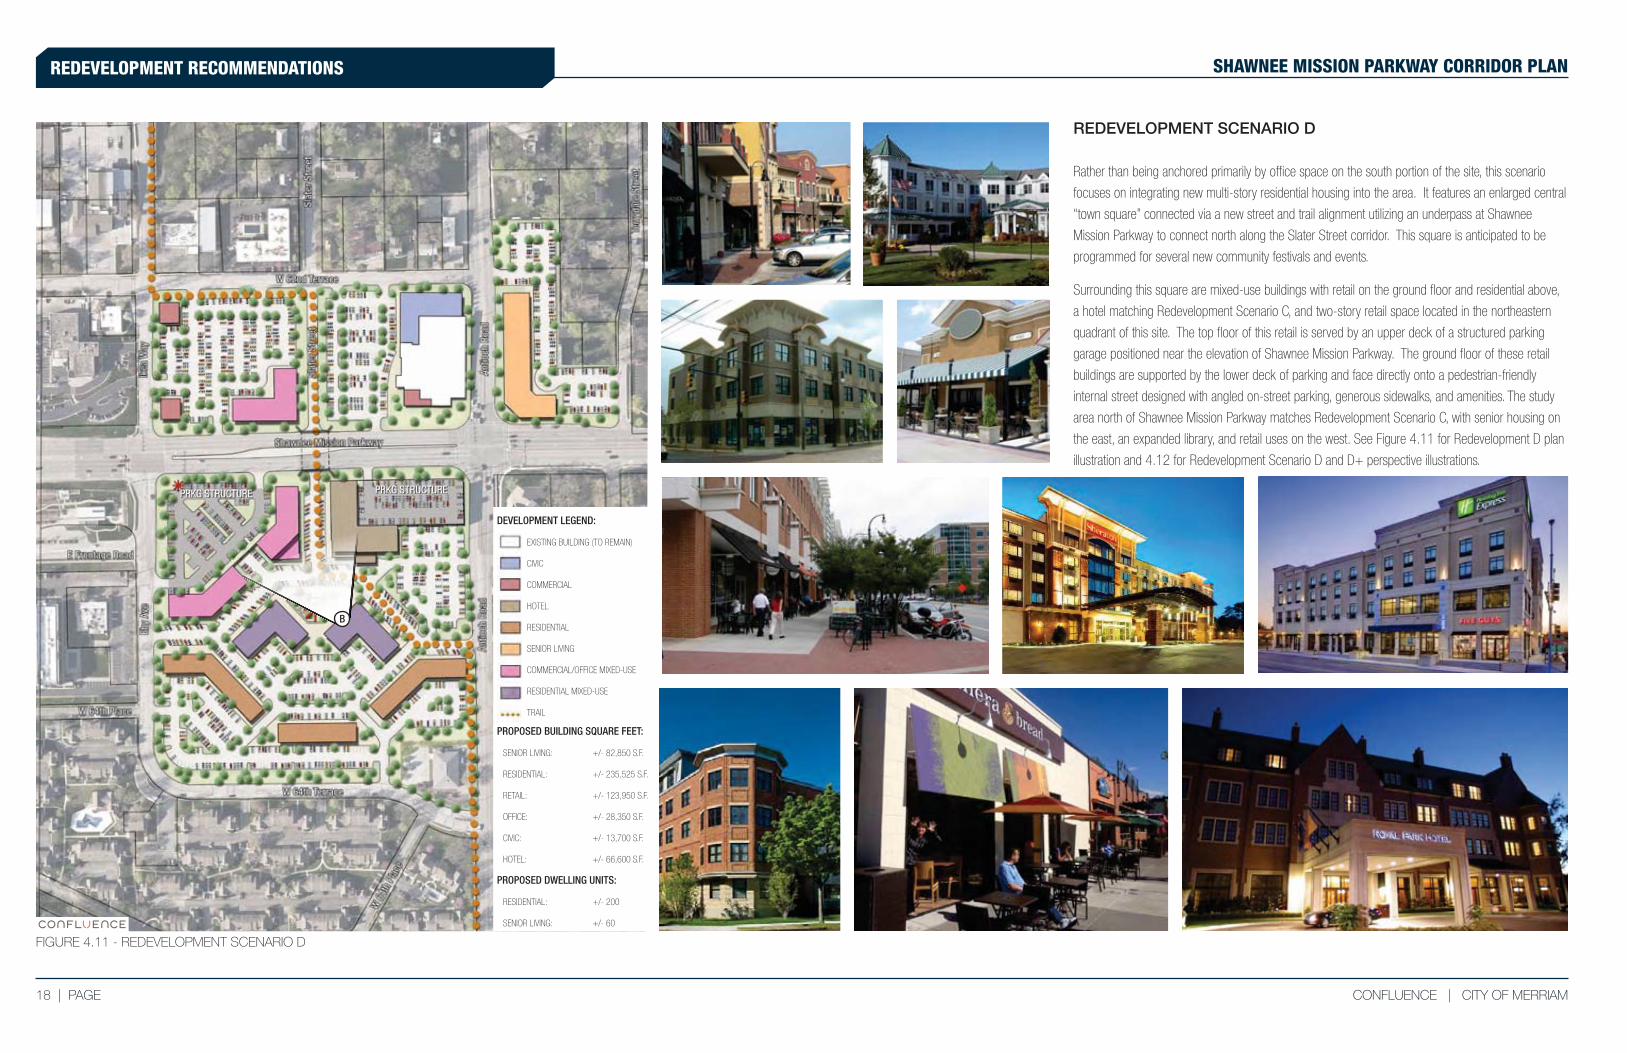
FIGURE 4.11 - REDEVELOPMENT SCENARIO D
DEVELOPMENT LEGEND:
EXISTING BUILDING (TO REMAIN)
CIVIC
COMMERCIAL
HOTEL
RESIDENTIAL
SENIOR LIVING
COMMERCIAL/OFFICE MIXED-USE
RESIDENTIAL MIXED-USE
TRAIL
PROPOSED BUILDING SQUARE FEET:
SENIOR LIVING: +/- 82,850 S.F.
RESIDENTIAL: +/- 235,525 S.F.
RETAIL: +/- 123,950 S.F.
OFFICE: +/- 28,350 S.F.
CIVIC: +/- 13,700 S.F.
HOTEL: +/- 66,600 S.F.
PROPOSED DWELLING UNITS:
RESIDENTIAL: +/- 200
SENIOR LIVING: +/- 60
REDEVELOPMENT SCENARIO D
Rather than being anchored primarily by office space on the south portion of the site, this scenario
focuses on integrating new multi-story residential housing into the area. It features an enlarged central
“town square” connected via a new street and trail alignment utilizing an underpass at Shawnee
Mission Parkway to connect north along the Slater Street corridor. This square is anticipated to be
programmed for several new community festivals and events.
Surrounding this square are mixed-use buildings with retail on the ground floor and residential above,
a hotel matching Redevelopment Scenario C, and two-story retail space located in the northeastern
quadrant of this site. The top floor of this retail is served by an upper deck of a structured parking
garage positioned near the elevation of Shawnee Mission Parkway. The ground floor of these retail
buildings are supported by the lower deck of parking and face directly onto a pedestrian-friendly
internal street designed with angled on-street parking, generous sidewalks, and amenities. The study
area north of Shawnee Mission Parkway matches Redevelopment Scenario C, with senior housing on
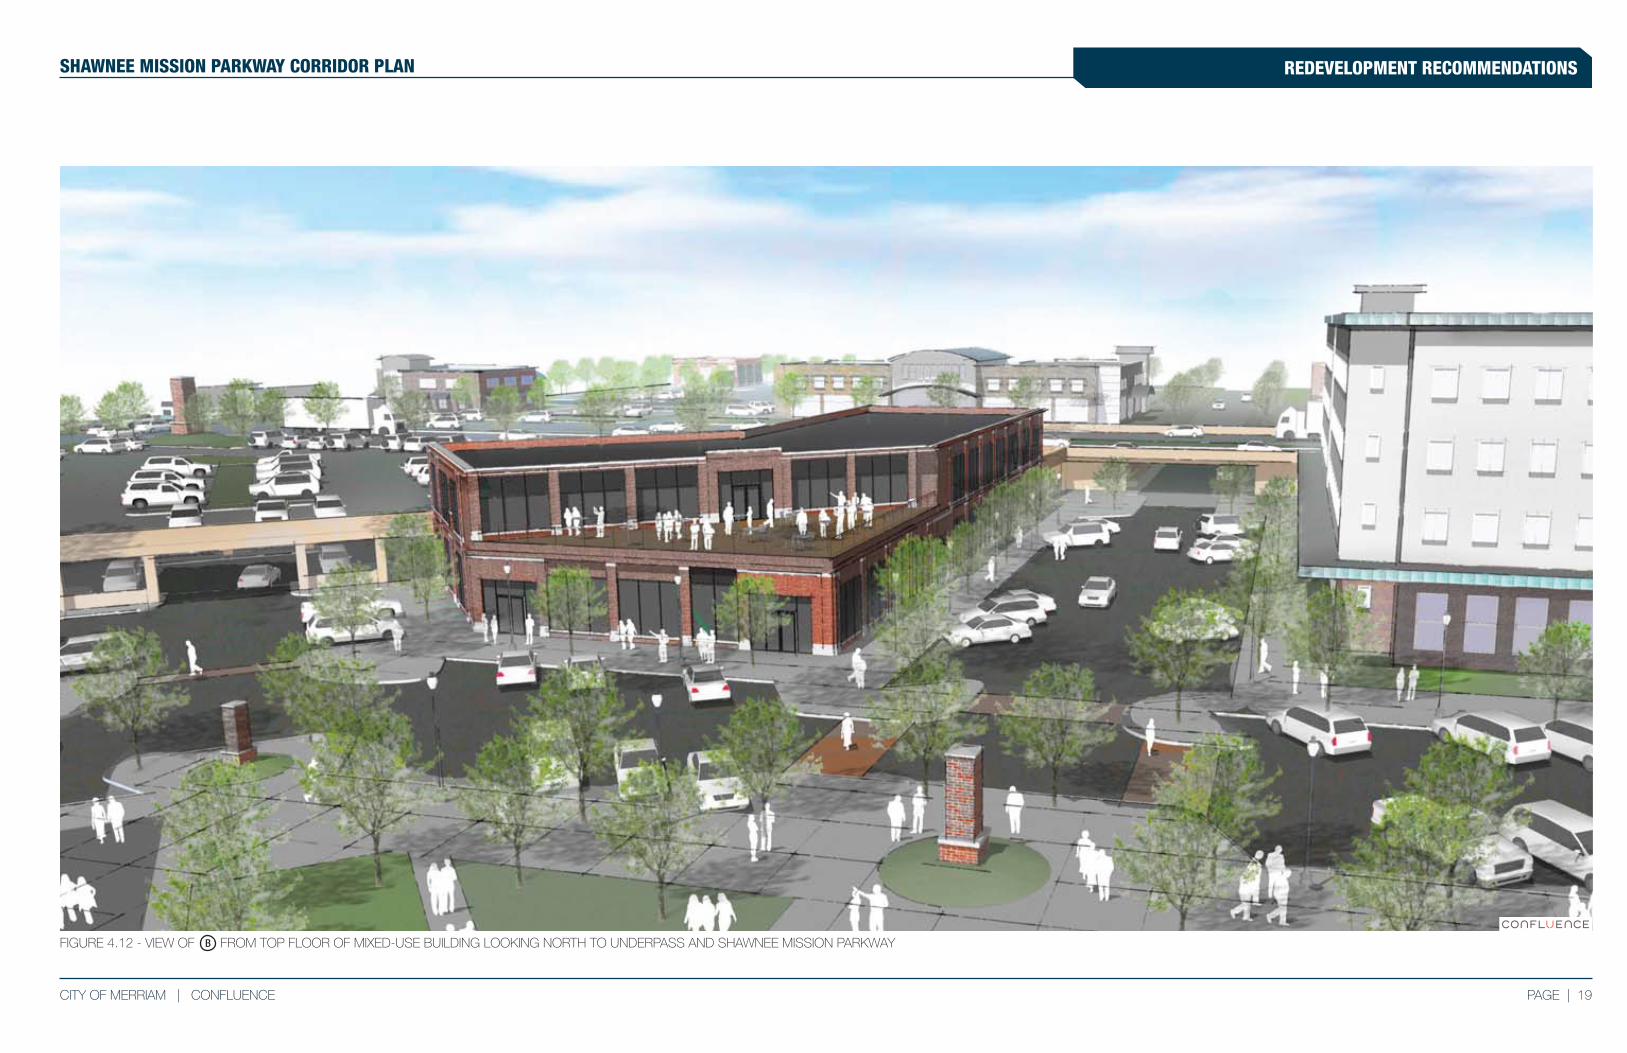
the east, an expanded library, and retail uses on the west. See Figure 4.11 for Redevelopment D plan
illustration and 4.12 for Redevelopment Scenario D and D+ perspective illustrations.
PRKG STRUCTURE PRKG STRUCTURE
B
PAGE | 19CITY OF MERRIAM | CONFLUENCE
REDEVELOPMENT RECOMMENDATIONSSHAWNEE MISSION PARKWAY CORRIDOR PLAN
FIGURE 4.12 - VIEW OF FROM TOP FLOOR OF MIXED-USE BUILDING LOOKING NORTH TO UNDERPASS AND SHAWNEE MISSION PARKWAYB
20 | PAGE CONFLUENCE | CITY OF MERRIAM
REDEVELOPMENT RECOMMENDATIONS SHAWNEE MISSION PARKWAY CORRIDOR PLAN
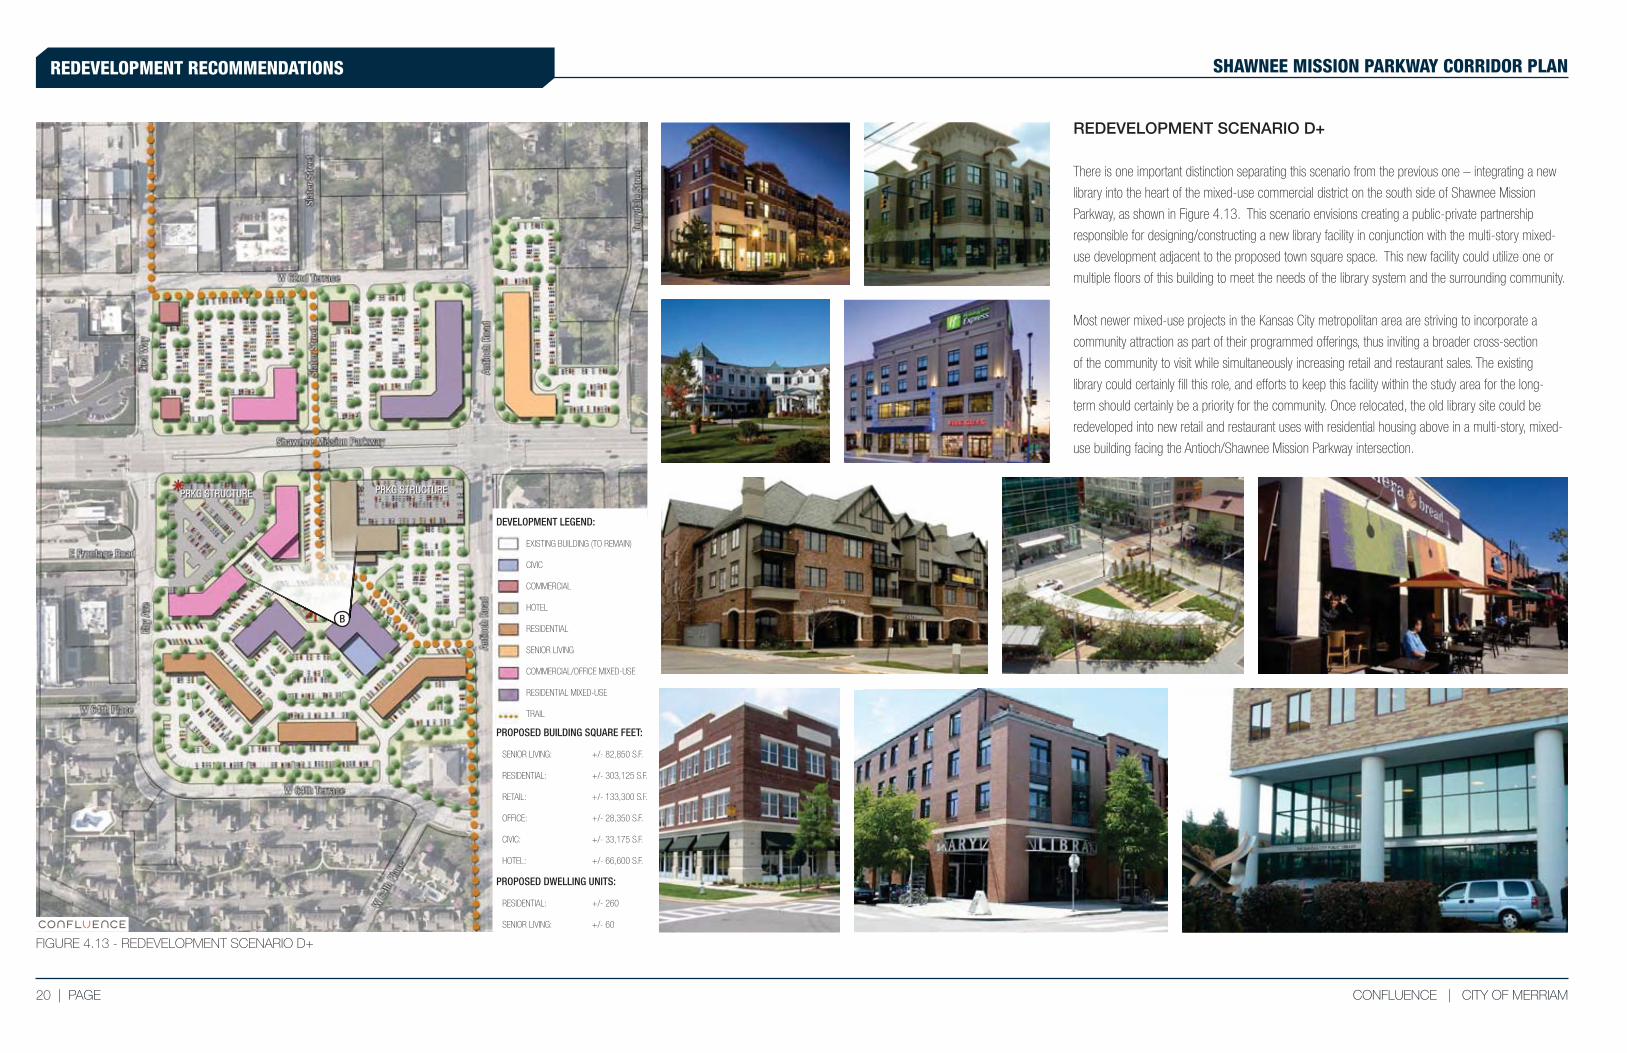
FIGURE 4.13 - REDEVELOPMENT SCENARIO D+
DEVELOPMENT LEGEND:
EXISTING BUILDING (TO REMAIN)
CIVIC
COMMERCIAL
HOTEL
RESIDENTIAL
SENIOR LIVING
COMMERCIAL/OFFICE MIXED-USE
RESIDENTIAL MIXED-USE
TRAIL
PROPOSED BUILDING SQUARE FEET:
SENIOR LIVING: +/- 82,850 S.F.
RESIDENTIAL: +/- 303,125 S.F.
RETAIL: +/- 133,300 S.F.
OFFICE: +/- 28,350 S.F.
CIVIC: +/- 33,175 S.F.
HOTEL: +/- 66,600 S.F.
PROPOSED DWELLING UNITS:
RESIDENTIAL: +/- 260
SENIOR LIVING: +/- 60
REDEVELOPMENT SCENARIO D+
There is one important distinction separating this scenario from the previous one – integrating a new
library into the heart of the mixed-use commercial district on the south side of Shawnee Mission
Parkway, as shown in Figure 4.13. This scenario envisions creating a public-private partnership
responsible for designing/constructing a new library facility in conjunction with the multi-story mixed-
use development adjacent to the proposed town square space. This new facility could utilize one or
multiple floors of this building to meet the needs of the library system and the surrounding community.
Most newer mixed-use projects in the Kansas City metropolitan area are striving to incorporate a
community attraction as part of their programmed offerings, thus inviting a broader cross-section
of the community to visit while simultaneously increasing retail and restaurant sales. The existing
library could certainly fill this role, and efforts to keep this facility within the study area for the long-
term should certainly be a priority for the community. Once relocated, the old library site could be
redeveloped into new retail and restaurant uses with residential housing above in a multi-story, mixed-
use building facing the Antioch/Shawnee Mission Parkway intersection.
PRKG STRUCTURE PRKG STRUCTURE
B
PAGE | 21CITY OF MERRIAM | CONFLUENCE
REDEVELOPMENT RECOMMENDATIONSSHAWNEE MISSION PARKWAY CORRIDOR PLAN
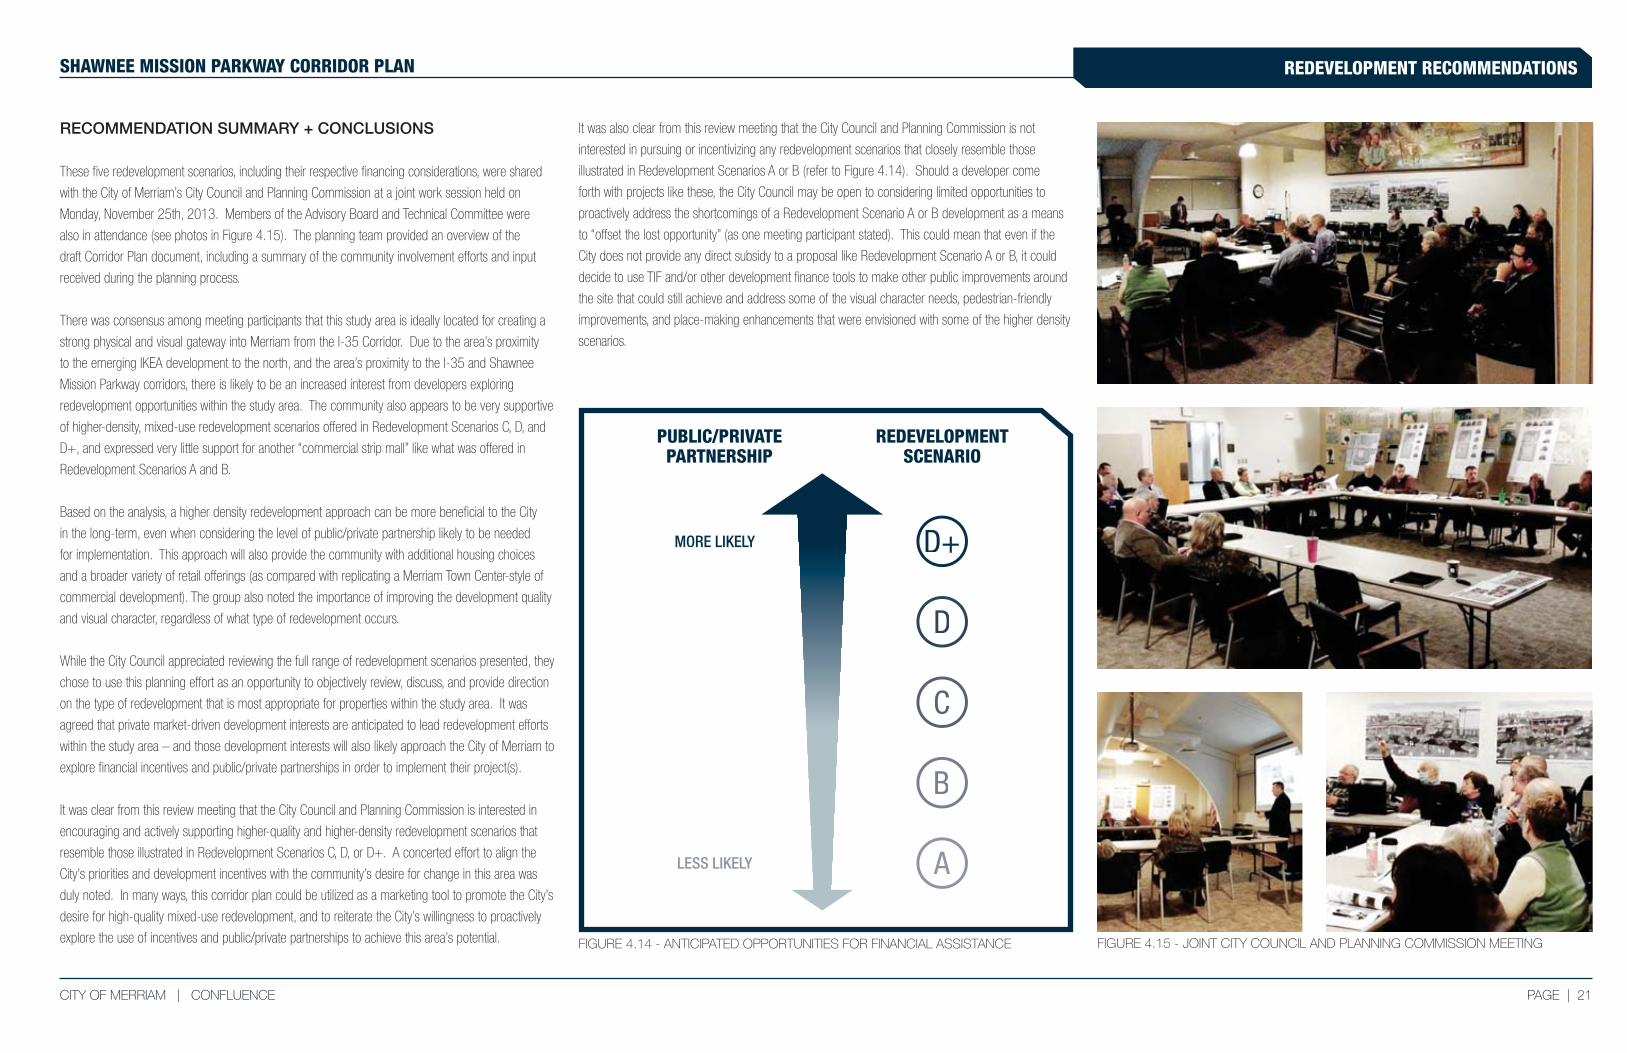
FIGURE 4.15 - JOINT CITY COUNCIL AND PLANNING COMMISSION MEETINGFIGURE 4.14 - ANTICIPATED OPPORTUNITIES FOR FINANCIAL ASSISTANCE
A
B
C
D
D+
LESS LIKELY
MORE LIKELY
PUBLIC/PRIVATE PARTNERSHIP
REDEVELOPMENT SCENARIO
RECOMMENDATION SUMMARY + CONCLUSIONS
These five redevelopment scenarios, including their respective financing considerations, were shared
with the City of Merriam’s City Council and Planning Commission at a joint work session held on
Monday, November 25th, 2013. Members of the Advisory Board and Technical Committee were
also in attendance (see photos in Figure 4.15). The planning team provided an overview of the
draft Corridor Plan document, including a summary of the community involvement efforts and input
received during the planning process.
There was consensus among meeting participants that this study area is ideally located for creating a
strong physical and visual gateway into Merriam from the I-35 Corridor. Due to the area’s proximity
to the emerging IKEA development to the north, and the area’s proximity to the I-35 and Shawnee
Mission Parkway corridors, there is likely to be an increased interest from developers exploring
redevelopment opportunities within the study area. The community also appears to be very supportive
of higher-density, mixed-use redevelopment scenarios offered in Redevelopment Scenarios C, D, and
D+, and expressed very little support for another “commercial strip mall” like what was offered in
Redevelopment Scenarios A and B.
Based on the analysis, a higher density redevelopment approach can be more beneficial to the City
in the long-term, even when considering the level of public/private partnership likely to be needed
for implementation. This approach will also provide the community with additional housing choices
and a broader variety of retail offerings (as compared with replicating a Merriam Town Center-style of
commercial development). The group also noted the importance of improving the development quality
and visual character, regardless of what type of redevelopment occurs.
While the City Council appreciated reviewing the full range of redevelopment scenarios presented, they
chose to use this planning effort as an opportunity to objectively review, discuss, and provide direction
on the type of redevelopment that is most appropriate for properties within the study area. It was
agreed that private market-driven development interests are anticipated to lead redevelopment efforts
within the study area – and those development interests will also likely approach the City of Merriam to
explore financial incentives and public/private partnerships in order to implement their project(s).
It was clear from this review meeting that the City Council and Planning Commission is interested in
encouraging and actively supporting higher-quality and higher-density redevelopment scenarios that
resemble those illustrated in Redevelopment Scenarios C, D, or D+. A concerted effort to align the
City’s priorities and development incentives with the community’s desire for change in this area was
duly noted. In many ways, this corridor plan could be utilized as a marketing tool to promote the City’s
desire for high-quality mixed-use redevelopment, and to reiterate the City’s willingness to proactively
explore the use of incentives and public/private partnerships to achieve this area’s potential.
It was also clear from this review meeting that the City Council and Planning Commission is not
interested in pursuing or incentivizing any redevelopment scenarios that closely resemble those
illustrated in Redevelopment Scenarios A or B (refer to Figure 4.14). Should a developer come
forth with projects like these, the City Council may be open to considering limited opportunities to
proactively address the shortcomings of a Redevelopment Scenario A or B development as a means
to “offset the lost opportunity” (as one meeting participant stated). This could mean that even if the
City does not provide any direct subsidy to a proposal like Redevelopment Scenario A or B, it could
decide to use TIF and/or other development finance tools to make other public improvements around
the site that could still achieve and address some of the visual character needs, pedestrian-friendly
improvements, and place-making enhancements that were envisioned with some of the higher density
scenarios.

DESIGN GUIDELINES

SHAWNEE MISSION PARKWAY CORRIDOR PLAN
INFRASTRUCTURE ANALYSIS SECTION 5
22 | PAGE CONFLUENCE | CITY OF MERRIAM
INFRASTRUCTURE ANALYSIS SHAWNEE MISSION PARKWAY CORRIDOR PLAN
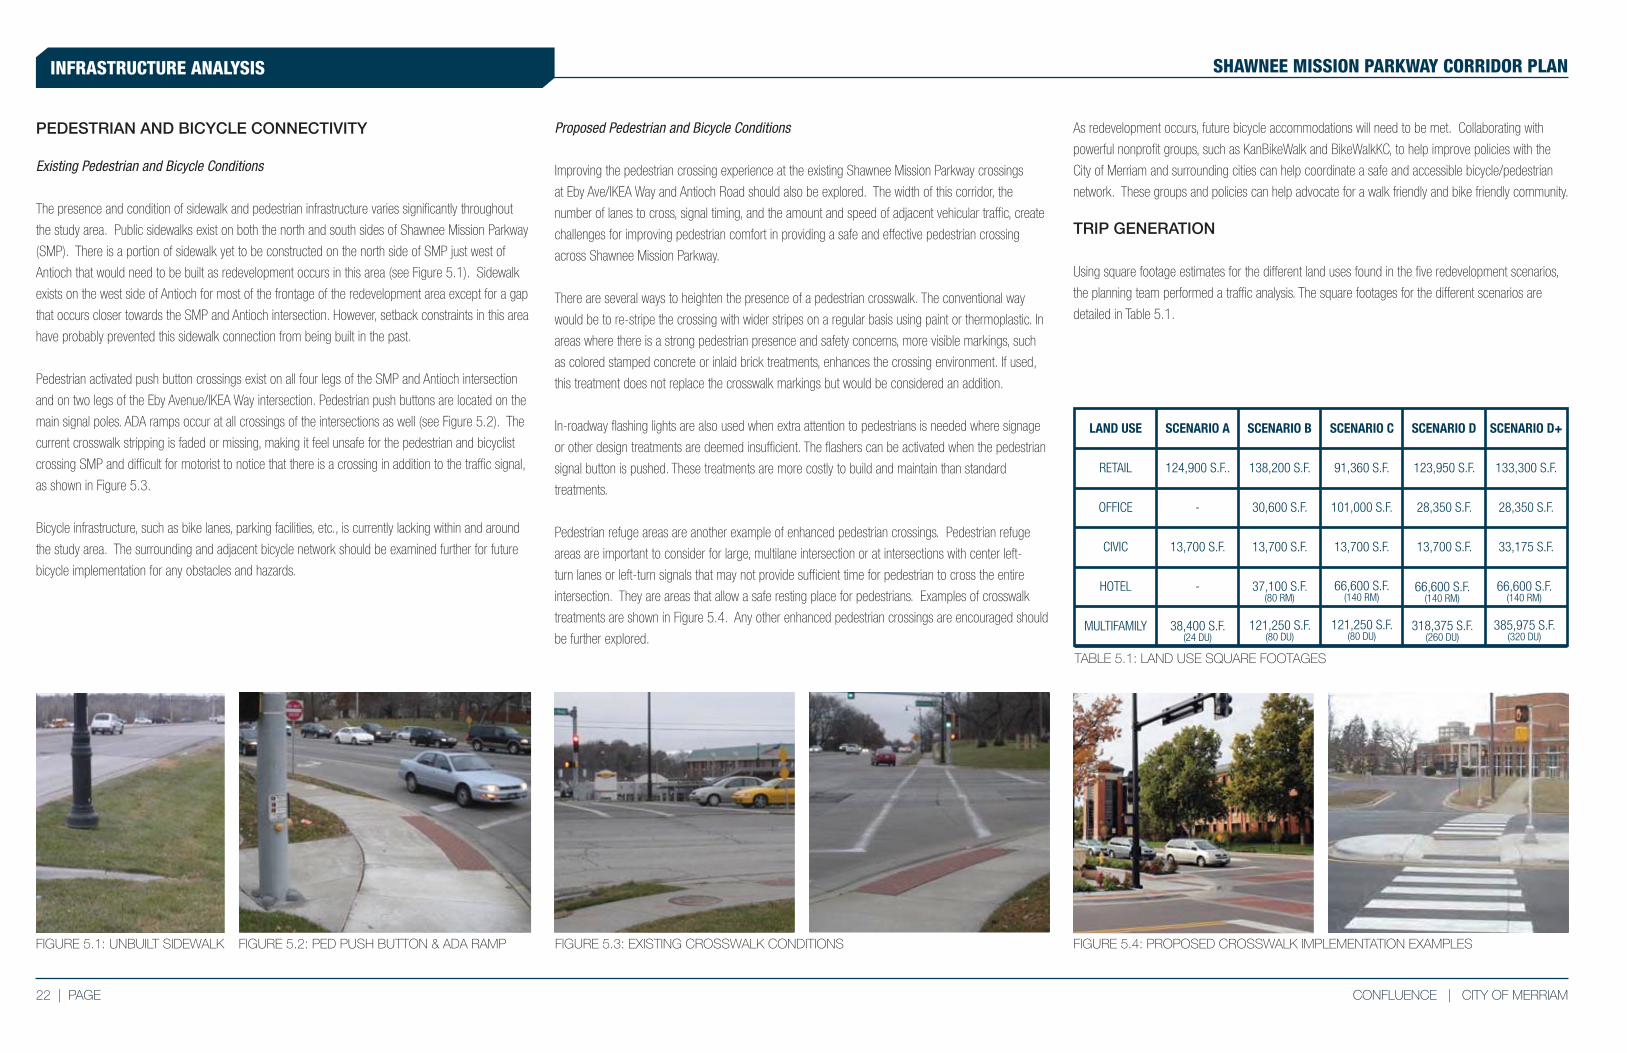
PEDESTRIAN AND BICYCLE CONNECTIVITY
Existing Pedestrian and Bicycle Conditions
The presence and condition of sidewalk and pedestrian infrastructure varies significantly throughout
the study area. Public sidewalks exist on both the north and south sides of Shawnee Mission Parkway
(SMP). There is a portion of sidewalk yet to be constructed on the north side of SMP just west of
Antioch that would need to be built as redevelopment occurs in this area (see Figure 5.1). Sidewalk
exists on the west side of Antioch for most of the frontage of the redevelopment area except for a gap
that occurs closer towards the SMP and Antioch intersection. However, setback constraints in this area
have probably prevented this sidewalk connection from being built in the past.
Pedestrian activated push button crossings exist on all four legs of the SMP and Antioch intersection
and on two legs of the Eby Avenue/IKEA Way intersection. Pedestrian push buttons are located on the
main signal poles. ADA ramps occur at all crossings of the intersections as well (see Figure 5.2). The
current crosswalk stripping is faded or missing, making it feel unsafe for the pedestrian and bicyclist
crossing SMP and difficult for motorist to notice that there is a crossing in addition to the traffic signal,
as shown in Figure 5.3.
Bicycle infrastructure, such as bike lanes, parking facilities, etc., is currently lacking within and around
the study area. The surrounding and adjacent bicycle network should be examined further for future
bicycle implementation for any obstacles and hazards.
TABLE 5.1: LAND USE SQUARE FOOTAGES
Proposed Pedestrian and Bicycle Conditions
Improving the pedestrian crossing experience at the existing Shawnee Mission Parkway crossings
at Eby Ave/IKEA Way and Antioch Road should also be explored. The width of this corridor, the
number of lanes to cross, signal timing, and the amount and speed of adjacent vehicular traffic, create
challenges for improving pedestrian comfort in providing a safe and effective pedestrian crossing
across Shawnee Mission Parkway.
There are several ways to heighten the presence of a pedestrian crosswalk. The conventional way
would be to re-stripe the crossing with wider stripes on a regular basis using paint or thermoplastic. In
areas where there is a strong pedestrian presence and safety concerns, more visible markings, such
as colored stamped concrete or inlaid brick treatments, enhances the crossing environment. If used,
this treatment does not replace the crosswalk markings but would be considered an addition.
In-roadway flashing lights are also used when extra attention to pedestrians is needed where signage
or other design treatments are deemed insufficient. The flashers can be activated when the pedestrian
signal button is pushed. These treatments are more costly to build and maintain than standard
treatments.
Pedestrian refuge areas are another example of enhanced pedestrian crossings. Pedestrian refuge
areas are important to consider for large, multilane intersection or at intersections with center left-
turn lanes or left-turn signals that may not provide sufficient time for pedestrian to cross the entire
intersection. They are areas that allow a safe resting place for pedestrians. Examples of crosswalk
treatments are shown in Figure 5.4. Any other enhanced pedestrian crossings are encouraged should
be further explored.
FIGURE 5.1: UNBUILT SIDEWALK FIGURE 5.2: PED PUSH BUTTON & ADA RAMP FIGURE 5.3: EXISTING CROSSWALK CONDITIONS
As redevelopment occurs, future bicycle accommodations will need to be met. Collaborating with
powerful nonprofit groups, such as KanBikeWalk and BikeWalkKC, to help improve policies with the
City of Merriam and surrounding cities can help coordinate a safe and accessible bicycle/pedestrian
network. These groups and policies can help advocate for a walk friendly and bike friendly community.
TRIP GENERATION
Using square footage estimates for the different land uses found in the five redevelopment scenarios,
the planning team performed a traffic analysis. The square footages for the different scenarios are
detailed in Table 5.1.
FIGURE 5.4: PROPOSED CROSSWALK IMPLEMENTATION EXAMPLES
LAND USE
RETAIL
SCENARIO A SCENARIO B SCENARIO C SCENARIO D SCENARIO D+
OFFICE
CIVIC
HOTEL
MULTIFAMILY
124,900 S.F..
-
13,700 S.F.
-
38,400 S.F.(24 DU)
138,200 S.F.
30,600 S.F.
13,700 S.F.
37,100 S.F.(80 RM)
91,360 S.F.
101,000 S.F.
13,700 S.F.
123,950 S.F.
28,350 S.F.
13,700 S.F.
133,300 S.F.
28,350 S.F.
33,175 S.F.
121,250 S.F.(80 DU)
66,600 S.F.(140 RM)
121,250 S.F.(80 DU)
66,600 S.F.(140 RM)
318,375 S.F.(260 DU)
66,600 S.F.(140 RM)
385,975 S.F.(320 DU)
PAGE | 23CITY OF MERRIAM | CONFLUENCE
INFRASTRUCTURE ANALYSISSHAWNEE MISSION PARKWAY CORRIDOR PLAN
SCENARIOENTER EXIT TOTAL
A 4,687
B
C
5,406
5,107
D 5,874
D+ 6,609
DAILY TRIPS
4,685
5,404
5,106
5,873
6,607
9,372
10,810
10,213
11,747
13,216
ENTER EXIT TOTAL
87
191
286
209
234
AM PEAK HOUR TRIPS
63
117
127
180
208
150
308
413
388
442
ENTER EXIT TOTAL
395
486
430
532
633
PM PEAK HOUR TRIPS
421
572
562
588
689
816
1,058
992
1,120
1,322
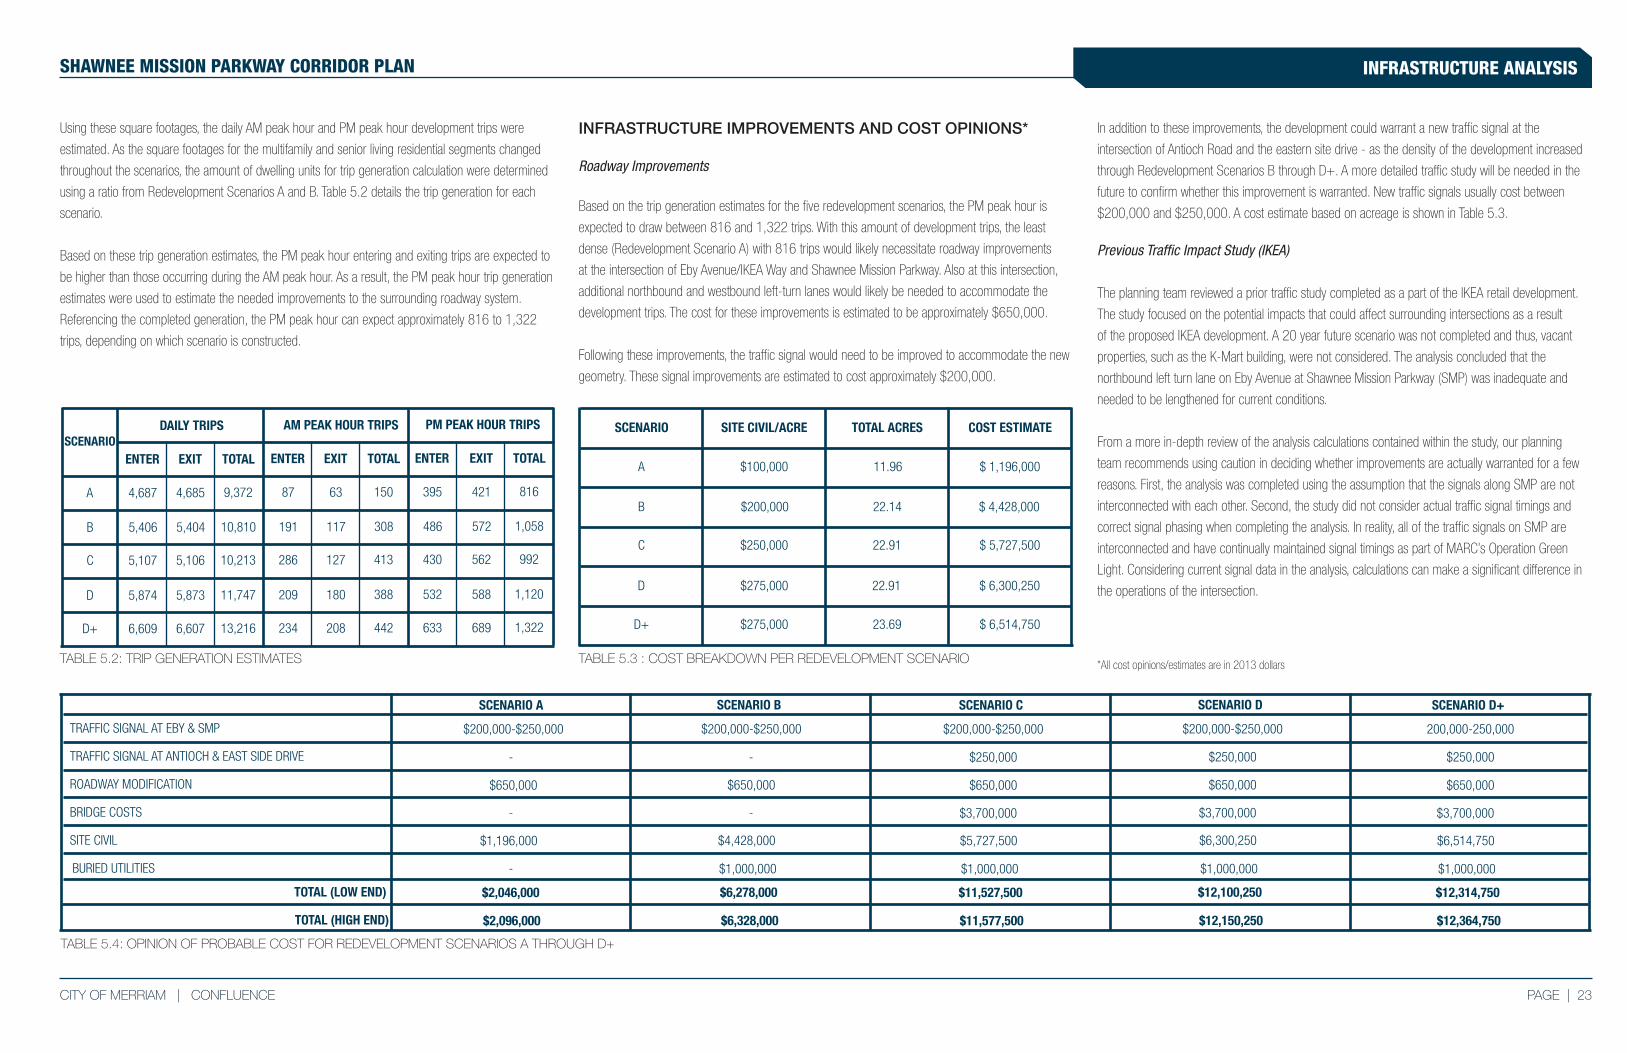
TABLE 5.2: TRIP GENERATION ESTIMATES
Using these square footages, the daily AM peak hour and PM peak hour development trips were
estimated. As the square footages for the multifamily and senior living residential segments changed
throughout the scenarios, the amount of dwelling units for trip generation calculation were determined
using a ratio from Redevelopment Scenarios A and B. Table 5.2 details the trip generation for each
scenario.
Based on these trip generation estimates, the PM peak hour entering and exiting trips are expected to
be higher than those occurring during the AM peak hour. As a result, the PM peak hour trip generation
estimates were used to estimate the needed improvements to the surrounding roadway system.
Referencing the completed generation, the PM peak hour can expect approximately 816 to 1,322
trips, depending on which scenario is constructed.
TABLE 5.3 : COST BREAKDOWN PER REDEVELOPMENT SCENARIO
SCENARIO SITE CIVIL/ACRE TOTAL ACRES COST ESTIMATE
A $100,000 11.96 $ 1,196,000
B
C
$200,000 22.14 $ 4,428,000
$ 5,727,500$250,000 22.91
D $275,000 22.91 $ 6,300,250
D+ $275,000 23.69 $ 6,514,750
TABLE 5.4: OPINION OF PROBABLE COST FOR REDEVELOPMENT SCENARIOS A THROUGH D+
INFRASTRUCTURE IMPROVEMENTS AND COST OPINIONS*
Roadway Improvements
Based on the trip generation estimates for the five redevelopment scenarios, the PM peak hour is
expected to draw between 816 and 1,322 trips. With this amount of development trips, the least
dense (Redevelopment Scenario A) with 816 trips would likely necessitate roadway improvements
at the intersection of Eby Avenue/IKEA Way and Shawnee Mission Parkway. Also at this intersection,
additional northbound and westbound left-turn lanes would likely be needed to accommodate the
development trips. The cost for these improvements is estimated to be approximately $650,000.
Following these improvements, the traffic signal would need to be improved to accommodate the new
geometry. These signal improvements are estimated to cost approximately $200,000.
In addition to these improvements, the development could warrant a new traffic signal at the
intersection of Antioch Road and the eastern site drive - as the density of the development increased
through Redevelopment Scenarios B through D+. A more detailed traffic study will be needed in the
future to confirm whether this improvement is warranted. New traffic signals usually cost between
$200,000 and $250,000. A cost estimate based on acreage is shown in Table 5.3.
Previous Traffic Impact Study (IKEA)
The planning team reviewed a prior traffic study completed as a part of the IKEA retail development.
The study focused on the potential impacts that could affect surrounding intersections as a result
of the proposed IKEA development. A 20 year future scenario was not completed and thus, vacant
properties, such as the K-Mart building, were not considered. The analysis concluded that the
northbound left turn lane on Eby Avenue at Shawnee Mission Parkway (SMP) was inadequate and
needed to be lengthened for current conditions.
From a more in-depth review of the analysis calculations contained within the study, our planning
team recommends using caution in deciding whether improvements are actually warranted for a few
reasons. First, the analysis was completed using the assumption that the signals along SMP are not
interconnected with each other. Second, the study did not consider actual traffic signal timings and
correct signal phasing when completing the analysis. In reality, all of the traffic signals on SMP are
interconnected and have continually maintained signal timings as part of MARC’s Operation Green
Light. Considering current signal data in the analysis, calculations can make a significant difference in
the operations of the intersection.
*All cost opinions/estimates are in 2013 dollars
SCENARIO D+
TRAFFIC SIGNAL AT ANTIOCH & EAST SIDE DRIVE
200,000-250,000
$250,000
$650,000
$3,700,000
$1,000,000
$6,514,750
SCENARIO D
$200,000-$250,000
$250,000
$650,000
$3,700,000
$1,000,000
$6,300,250
SCENARIO C
$200,000-$250,000
$250,000
$650,000
$3,700,000
$1,000,000
$5,727,500
SCENARIO B
$200,000-$250,000
$650,000
$1,000,000
$4,428,000
SCENARIO A
$200,000-$250,000
$650,000
$1,196,000
TRAFFIC SIGNAL AT EBY & SMP
ROADWAY MODIFICATION
BRIDGE COSTS
SITE CIVIL
BURIED UTILITIES
$12,364,750
$12,314,750
$12,150,250
$12,100,250
$11,577,500
$11,527,500
$6,328,000
$6,278,000
$2,096,000
$2,046,000TOTAL (LOW END)
TOTAL (HIGH END)
--
--
-
24 | PAGE CONFLUENCE | CITY OF MERRIAM
INFRASTRUCTURE ANALYSIS SHAWNEE MISSION PARKWAY CORRIDOR PLAN
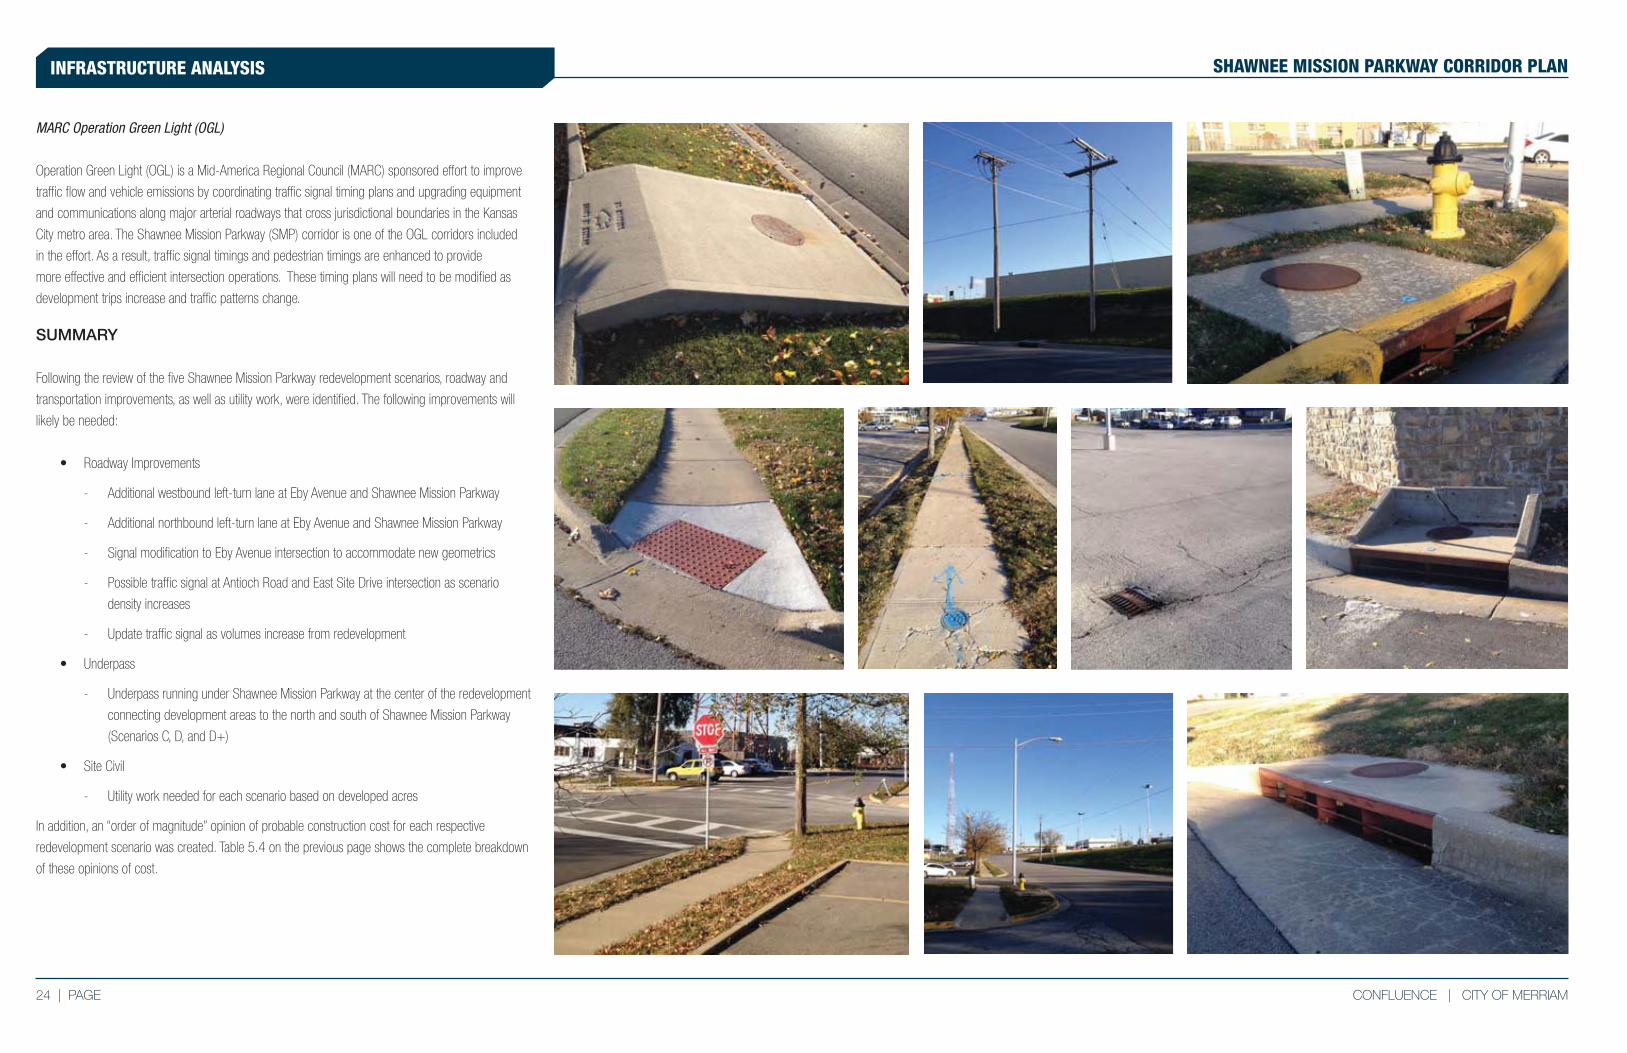
MARC Operation Green Light (OGL)
Operation Green Light (OGL) is a Mid-America Regional Council (MARC) sponsored effort to improve
traffic flow and vehicle emissions by coordinating traffic signal timing plans and upgrading equipment
and communications along major arterial roadways that cross jurisdictional boundaries in the Kansas
City metro area. The Shawnee Mission Parkway (SMP) corridor is one of the OGL corridors included
in the effort. As a result, traffic signal timings and pedestrian timings are enhanced to provide
more effective and efficient intersection operations. These timing plans will need to be modified as
development trips increase and traffic patterns change.
SUMMARY
Following the review of the five Shawnee Mission Parkway redevelopment scenarios, roadway and
transportation improvements, as well as utility work, were identified. The following improvements will
likely be needed:
• Roadway Improvements
- Additional westbound left-turn lane at Eby Avenue and Shawnee Mission Parkway
- Additional northbound left-turn lane at Eby Avenue and Shawnee Mission Parkway
- Signal modification to Eby Avenue intersection to accommodate new geometrics
- Possible traffic signal at Antioch Road and East Site Drive intersection as scenario
density increases
- Update traffic signal as volumes increase from redevelopment
• Underpass
- Underpass running under Shawnee Mission Parkway at the center of the redevelopment
connecting development areas to the north and south of Shawnee Mission Parkway
(Scenarios C, D, and D+)
• Site Civil
- Utility work needed for each scenario based on developed acres
In addition, an “order of magnitude” opinion of probable construction cost for each respective
redevelopment scenario was created. Table 5.4 on the previous page shows the complete breakdown
of these opinions of cost.

SHAWNEE MISSION PARKWAY CORRIDOR PLAN
TRANSIT INTEGRATION SECTION 6
25 | PAGE CONFLUENCE | CITY OF MERRIAM
TRANSIT INTEGRATION SHAWNEE MISSION PARKWAY CORRIDOR PLAN
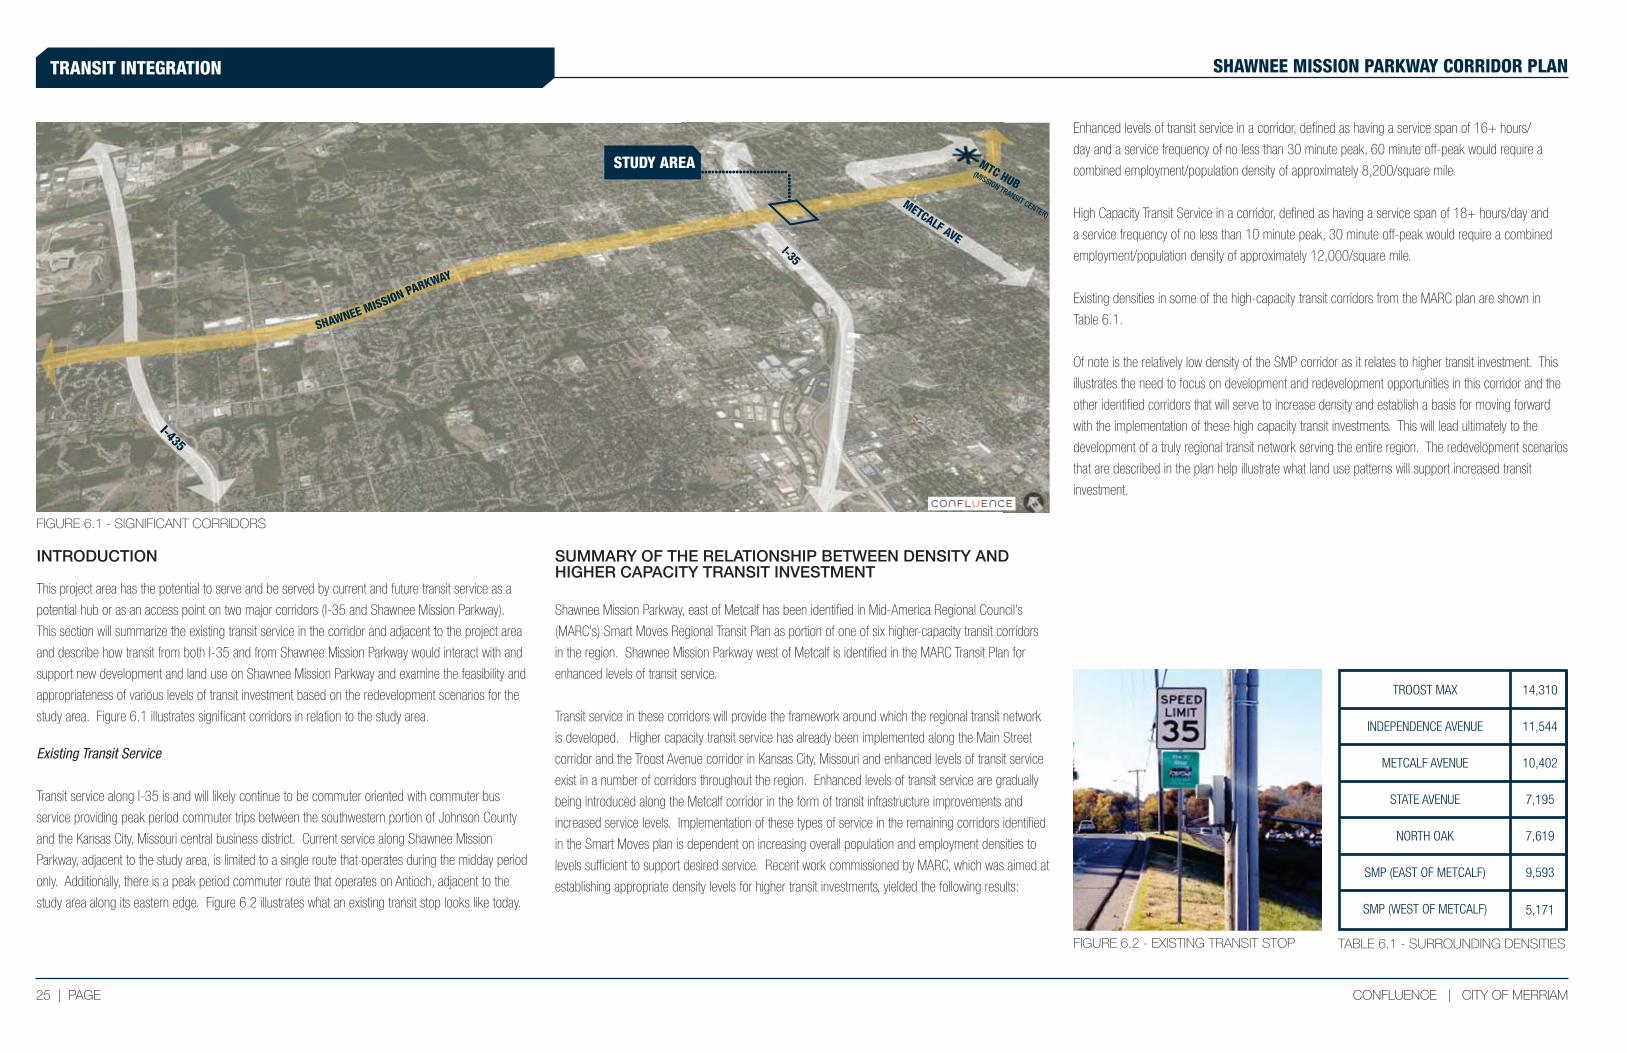
INTRODUCTION
This project area has the potential to serve and be served by current and future transit service as a
potential hub or as an access point on two major corridors (I-35 and Shawnee Mission Parkway).
This section will summarize the existing transit service in the corridor and adjacent to the project area
and describe how transit from both I-35 and from Shawnee Mission Parkway would interact with and
support new development and land use on Shawnee Mission Parkway and examine the feasibility and
appropriateness of various levels of transit investment based on the redevelopment scenarios for the
study area. Figure 6.1 illustrates significant corridors in relation to the study area.
Existing Transit Service
Transit service along I-35 is and will likely continue to be commuter oriented with commuter bus
service providing peak period commuter trips between the southwestern portion of Johnson County
and the Kansas City, Missouri central business district. Current service along Shawnee Mission
Parkway, adjacent to the study area, is limited to a single route that operates during the midday period
only. Additionally, there is a peak period commuter route that operates on Antioch, adjacent to the
study area along its eastern edge. Figure 6.2 illustrates what an existing transit stop looks like today.
SUMMARY OF THE RELATIONSHIP BETWEEN DENSITY AND HIGHER CAPACITY TRANSIT INVESTMENT
Shawnee Mission Parkway, east of Metcalf has been identified in Mid-America Regional Council’s
(MARC’s) Smart Moves Regional Transit Plan as portion of one of six higher-capacity transit corridors
in the region. Shawnee Mission Parkway west of Metcalf is identified in the MARC Transit Plan for
enhanced levels of transit service.
Transit service in these corridors will provide the framework around which the regional transit network
is developed. Higher capacity transit service has already been implemented along the Main Street
corridor and the Troost Avenue corridor in Kansas City, Missouri and enhanced levels of transit service
exist in a number of corridors throughout the region. Enhanced levels of transit service are gradually
being introduced along the Metcalf corridor in the form of transit infrastructure improvements and
increased service levels. Implementation of these types of service in the remaining corridors identified
in the Smart Moves plan is dependent on increasing overall population and employment densities to
levels sufficient to support desired service. Recent work commissioned by MARC, which was aimed at
establishing appropriate density levels for higher transit investments, yielded the following results:
Enhanced levels of transit service in a corridor, defined as having a service span of 16+ hours/
day and a service frequency of no less than 30 minute peak, 60 minute off-peak would require a
combined employment/population density of approximately 8,200/square mile.
High Capacity Transit Service in a corridor, defined as having a service span of 18+ hours/day and
a service frequency of no less than 10 minute peak, 30 minute off-peak would require a combined
employment/population density of approximately 12,000/square mile.
Existing densities in some of the high-capacity transit corridors from the MARC plan are shown in
Table 6.1.
Of note is the relatively low density of the SMP corridor as it relates to higher transit investment. This
illustrates the need to focus on development and redevelopment opportunities in this corridor and the
other identified corridors that will serve to increase density and establish a basis for moving forward
with the implementation of these high capacity transit investments. This will lead ultimately to the
development of a truly regional transit network serving the entire region. The redevelopment scenarios
that are described in the plan help illustrate what land use patterns will support increased transit
investment.
TABLE 6.1 - SURROUNDING DENSITIES
FIGURE 6.1 - SIGNIFICANT CORRIDORS
FIGURE 6.2 - EXISTING TRANSIT STOP
TROOST MAX 14,310
INDEPENDENCE AVENUE
METCALF AVENUE
STATE AVENUE
NORTH OAK
SMP (EAST OF METCALF)
SMP (WEST OF METCALF)
11,544
10,402
7,195
7,619
9,593
5,171
STUDY AREA
I-35
METCALF AVE
I-435
SHAWNEE MISSION PARKWAY
MTC HUB(MISSION TRANSIT CENTER)
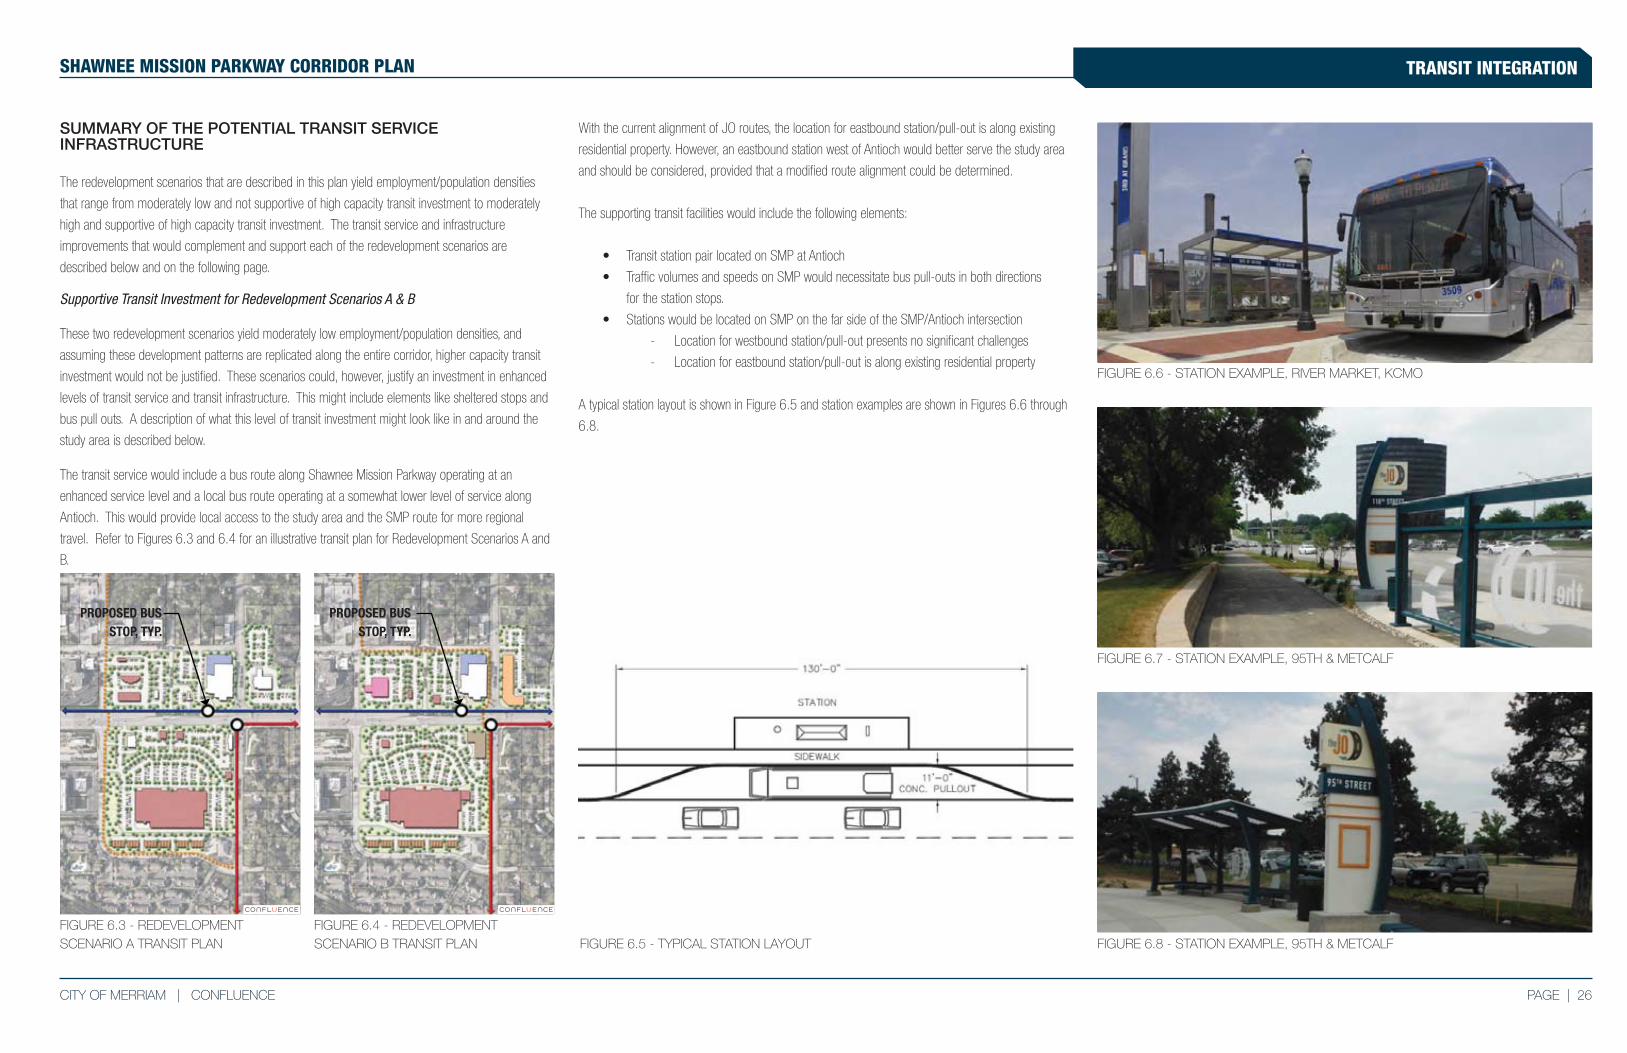
PAGE | 26CITY OF MERRIAM | CONFLUENCE
TRANSIT INTEGRATIONSHAWNEE MISSION PARKWAY CORRIDOR PLAN
SUMMARY OF THE POTENTIAL TRANSIT SERVICE INFRASTRUCTURE
The redevelopment scenarios that are described in this plan yield employment/population densities
that range from moderately low and not supportive of high capacity transit investment to moderately
high and supportive of high capacity transit investment. The transit service and infrastructure
improvements that would complement and support each of the redevelopment scenarios are
described below and on the following page.
Supportive Transit Investment for Redevelopment Scenarios A & B
These two redevelopment scenarios yield moderately low employment/population densities, and
assuming these development patterns are replicated along the entire corridor, higher capacity transit
investment would not be justified. These scenarios could, however, justify an investment in enhanced
levels of transit service and transit infrastructure. This might include elements like sheltered stops and
bus pull outs. A description of what this level of transit investment might look like in and around the
study area is described below.
The transit service would include a bus route along Shawnee Mission Parkway operating at an
enhanced service level and a local bus route operating at a somewhat lower level of service along
Antioch. This would provide local access to the study area and the SMP route for more regional
travel. Refer to Figures 6.3 and 6.4 for an illustrative transit plan for Redevelopment Scenarios A and
B.
With the current alignment of JO routes, the location for eastbound station/pull-out is along existing
residential property. However, an eastbound station west of Antioch would better serve the study area
and should be considered, provided that a modified route alignment could be determined.
The supporting transit facilities would include the following elements:
• Transit station pair located on SMP at Antioch
• Traffic volumes and speeds on SMP would necessitate bus pull-outs in both directions
for the station stops.
• Stations would be located on SMP on the far side of the SMP/Antioch intersection
- Location for westbound station/pull-out presents no significant challenges
- Location for eastbound station/pull-out is along existing residential property
A typical station layout is shown in Figure 6.5 and station examples are shown in Figures 6.6 through
6.8.
FIGURE 6.3 - REDEVELOPMENT SCENARIO A TRANSIT PLAN FIGURE 6.5 - TYPICAL STATION LAYOUT FIGURE 6.8 - STATION EXAMPLE, 95TH & METCALF
FIGURE 6.6 - STATION EXAMPLE, RIVER MARKET, KCMO
FIGURE 6.7 - STATION EXAMPLE, 95TH & METCALF
FIGURE 6.4 - REDEVELOPMENT SCENARIO B TRANSIT PLAN
PROPOSED BUS STOP, TYP.
PROPOSED BUS STOP, TYP.
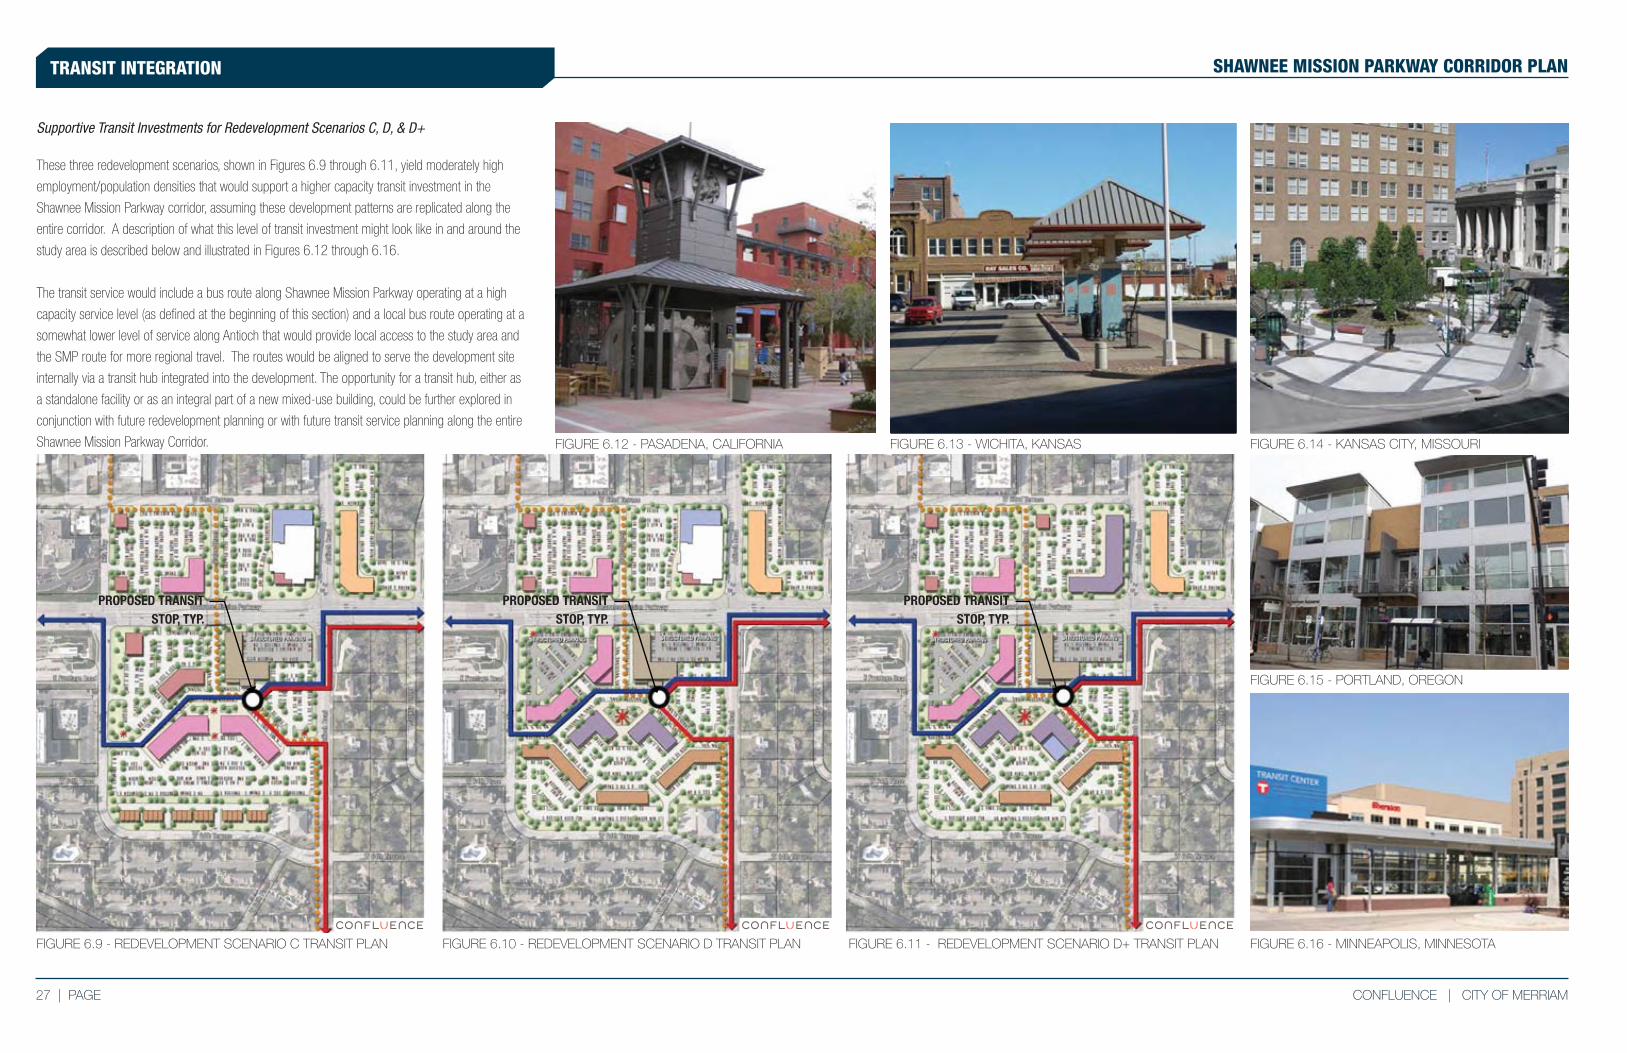
27 | PAGE CONFLUENCE | CITY OF MERRIAM
TRANSIT INTEGRATION SHAWNEE MISSION PARKWAY CORRIDOR PLAN
Supportive Transit Investments for Redevelopment Scenarios C, D, & D+
These three redevelopment scenarios, shown in Figures 6.9 through 6.11, yield moderately high
employment/population densities that would support a higher capacity transit investment in the
Shawnee Mission Parkway corridor, assuming these development patterns are replicated along the
entire corridor. A description of what this level of transit investment might look like in and around the
study area is described below and illustrated in Figures 6.12 through 6.16.
The transit service would include a bus route along Shawnee Mission Parkway operating at a high
capacity service level (as defined at the beginning of this section) and a local bus route operating at a
somewhat lower level of service along Antioch that would provide local access to the study area and
the SMP route for more regional travel. The routes would be aligned to serve the development site
internally via a transit hub integrated into the development. The opportunity for a transit hub, either as
a standalone facility or as an integral part of a new mixed-use building, could be further explored in
conjunction with future redevelopment planning or with future transit service planning along the entire
Shawnee Mission Parkway Corridor.
FIGURE 6.9 - REDEVELOPMENT SCENARIO C TRANSIT PLAN FIGURE 6.10 - REDEVELOPMENT SCENARIO D TRANSIT PLAN FIGURE 6.11 - REDEVELOPMENT SCENARIO D+ TRANSIT PLAN
FIGURE 6.12 - PASADENA, CALIFORNIA FIGURE 6.13 - WICHITA, KANSAS FIGURE 6.14 - KANSAS CITY, MISSOURI
FIGURE 6.15 - PORTLAND, OREGON
FIGURE 6.16 - MINNEAPOLIS, MINNESOTA
PROPOSED TRANSIT STOP, TYP.
PROPOSED TRANSIT STOP, TYP.
PROPOSED TRANSIT STOP, TYP.

SHAWNEE MISSION PARKWAY CORRIDOR PLAN
FINANCIAL ANALYSIS SECTION 7
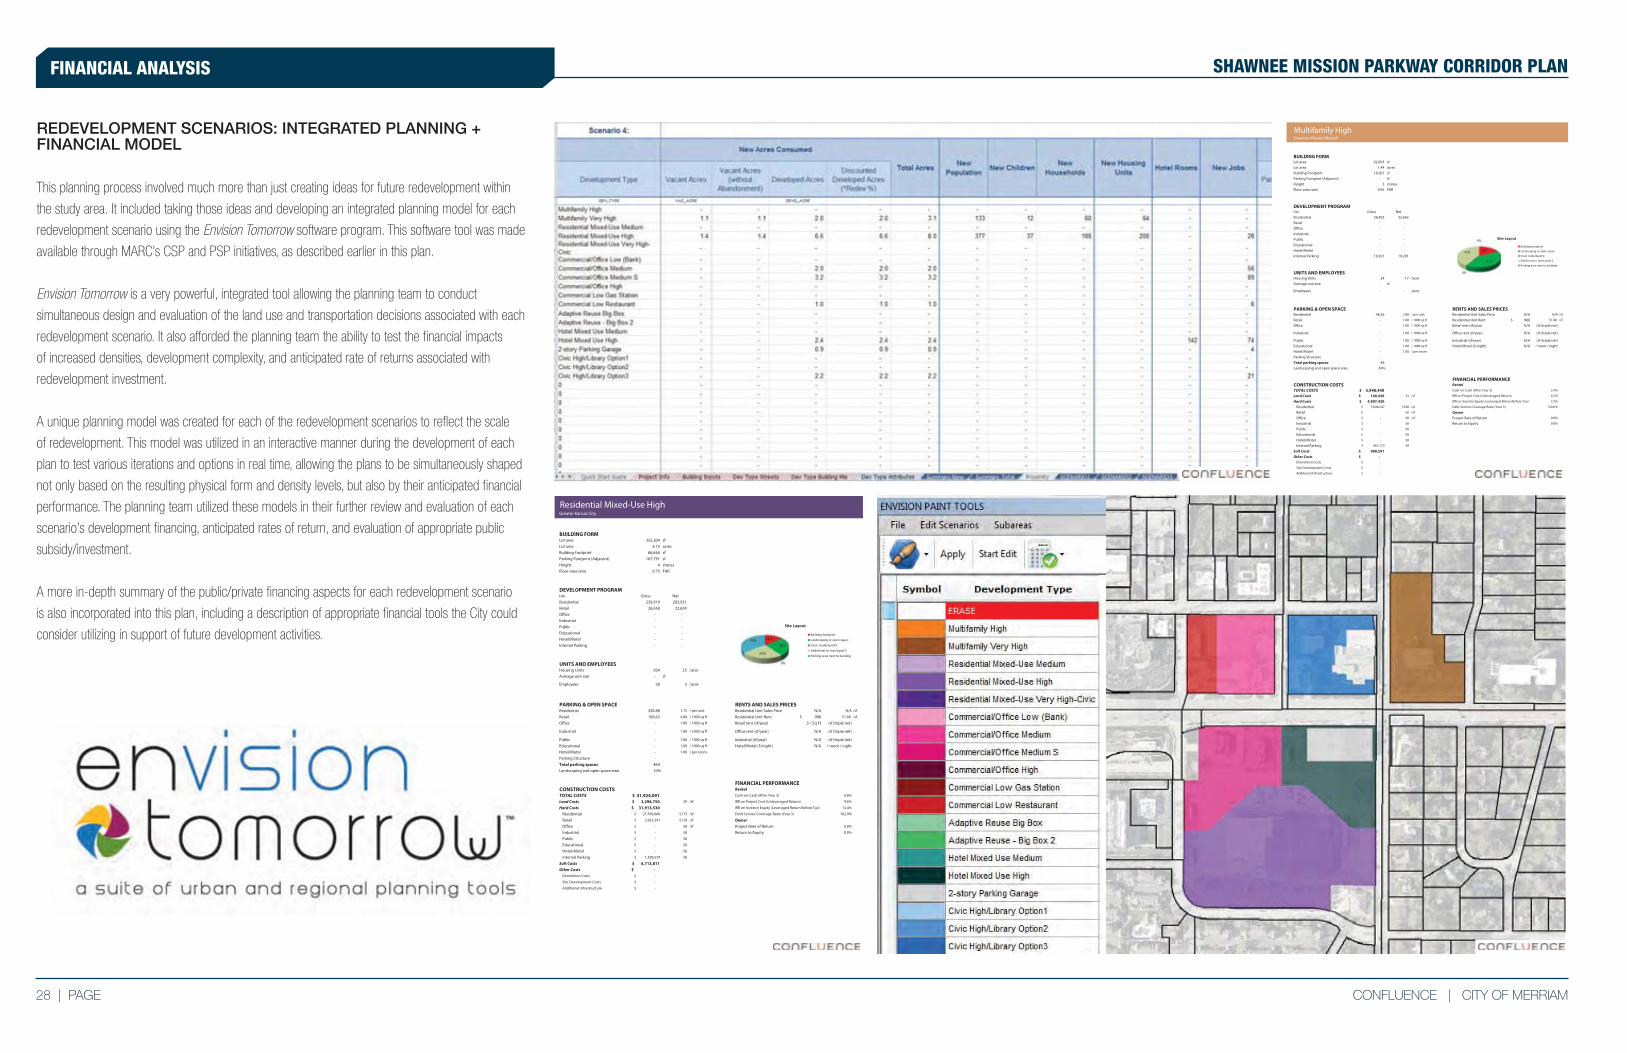
28 | PAGE CONFLUENCE | CITY OF MERRIAM
FINANCIAL ANALYSIS SHAWNEE MISSION PARKWAY CORRIDOR PLAN
REDEVELOPMENT SCENARIOS: INTEGRATED PLANNING + FINANCIAL MODEL
This planning process involved much more than just creating ideas for future redevelopment within
the study area. It included taking those ideas and developing an integrated planning model for each
redevelopment scenario using the Envision Tomorrow software program. This software tool was made
available through MARC’s CSP and PSP initiatives, as described earlier in this plan.
Envision Tomorrow is a very powerful, integrated tool allowing the planning team to conduct
simultaneous design and evaluation of the land use and transportation decisions associated with each
redevelopment scenario. It also afforded the planning team the ability to test the financial impacts
of increased densities, development complexity, and anticipated rate of returns associated with
redevelopment investment.
A unique planning model was created for each of the redevelopment scenarios to reflect the scale
of redevelopment. This model was utilized in an interactive manner during the development of each
plan to test various iterations and options in real time, allowing the plans to be simultaneously shaped
not only based on the resulting physical form and density levels, but also by their anticipated financial
performance. The planning team utilized these models in their further review and evaluation of each
scenario’s development financing, anticipated rates of return, and evaluation of appropriate public
subsidy/investment.
A more in-depth summary of the public/private financing aspects for each redevelopment scenario
is also incorporated into this plan, including a description of appropriate financial tools the City could
consider utilizing in support of future development activities.
Residential Mixed-Use HighGreater Kansas City
BUILDING FORMLot area 355,204 sf
Lot area 8.15 acres
Building Footprint 66,644 sf
Parking Footprint (Adjacent) 167,791 sf
Height 4 stories
Floor-area ratio 0.75 FAR
DEVELOPMENT PROGRAMUse Gross Net
Residential 239,919 203,931
Retail 26,658 22,659
Office - -
Industrial - -
Public - -
Educational - -
Hotel/Motel - -
Internal Parking - -
UNITS AND EMPLOYEESHousing Units 204 25 /acre
Average unit size - sf
Employees 28 3 /acre
PARKING & OPEN SPACE RENTS AND SALES PRICESResidential 356.88 1.75 / per unit Residential Unit Sales Price N/A N/A /sf
Retail 106.63 4.00 / 1000 sq ft Residential Unit Rent 900$ $1.80 /sf
Office - 1.00 / 1000 sq ft Retail rent (sf/year) $ / Sq Ft /sf (triple net)
Industrial - 1.00 / 1000 sq ft Office rent (sf/year) N/A /sf (triple net)
Public - 1.00 / 1000 sq ft Industrial (sf/year) N/A /sf (triple net)
Educational - 1.00 / 1000 sq ft Hotel/Motel ($/night) N/A / room / night
Hotel/Motel - 1.00 / per room
Parking Structure -
Total parking spaces 464
Landscaping and open space area 34%
FINANCIAL PERFORMANCECONSTRUCTION COSTS RentalTOTAL COSTS 41,924,091$ Cash-on-Cash (After Year 3) 6.8%
Land Costs 3,296,750$ $9 /sf IRR on Project Cost (Unleveraged Return) 9.6%
Hard Costs 31,913,530$ IRR on Investor Equity (Leveraged Return Before Tax) 13.4%
Residential 27,590,660$ $115 /sf Debt Service Coverage Ratio (Year 3) 162.9%
Retail 2,932,341$ $110 /sf OwnerOffice -$ $0 /sf Project Rate of Return 0.0%
Industrial -$ $0 Return to Equity 0.0%
Public -$ $0
Educational -$ $0
Hotel/Motel -$ $0
Internal Parking 1,390,529$ $0
Soft Costs 6,713,811$ Other Costs -$
Demolition Costs -$
Site Development Costs -$
Additional Infrastructure -$
14%
26%
0%
25%
35%Building footprintLandscaping or open spaceFrom UnderbuildAdditional to reach goalParking area next to building
14%
26%
0%
25%
35%Building footprintLandscaping or open spaceFrom UnderbuildAdditional to reach goalParking area next to building
Multifamily HighShawnee Mission/Metcalf
BUILDING FORMLot area 62,893 sf
Lot area 1.44 acres
Building Footprint 19,201 sf
Parking Footprint (Adjacent) - sf
Height 3 stories
Floor-area ratio 0.92 FAR
DEVELOPMENT PROGRAMUse Gross Net
Residential 38,402 32,642
Retail - -
Office - -
Industrial - -
Public - -
Educational - -
Hotel/Motel - -
Internal Parking 19,201 19,201
UNITS AND EMPLOYEESHousing Units 24 17 /acre
Average unit size - sf
Employees - - /acre
PARKING & OPEN SPACE RENTS AND SALES PRICESResidential 48.36 2.00 / per unit Residential Unit Sales Price N/A N/A /sf
Retail - 1.00 / 1000 sq ft Residential Unit Rent 900$ $1.80 /sf
Office - 1.00 / 1000 sq ft Retail rent (sf/year) N/A /sf (triple net)
Industrial - 1.00 / 1000 sq ft Office rent (sf/year) N/A /sf (triple net)
Public - 1.00 / 1000 sq ft Industrial (sf/year) N/A /sf (triple net)
Educational - 1.00 / 1000 sq ft Hotel/Motel ($/night) N/A / room / night
Hotel/Motel - 1.00 / per room
Parking Structure -
Total parking spaces 48
Landscaping and open space area 69%
FINANCIAL PERFORMANCECONSTRUCTION COSTS RentalTOTAL COSTS 5,948,440$ Cash-on-Cash (After Year 3) 3.4%
Land Costs 160,430$ $3 /sf IRR on Project Cost (Unleveraged Return) 6.5%
Hard Costs 4,807,420$ IRR on Investor Equity (Leveraged Return Before Tax) 7.2%
Residential 3,840,247$ $100 /sf Debt Service Coverage Ratio (Year 3) 134.6%
Retail -$ $0 /sf OwnerOffice -$ $0 /sf Project Rate of Return 0.0%
Industrial -$ $0 Return to Equity 0.0%
Public -$ $0
Educational -$ $0
Hotel/Motel -$ $0
Internal Parking 967,173$ $0
Soft Costs 980,591$ Other Costs -$
Demolition Costs -$
Site Development Costs -$
Additional Infrastructure -$
18%
41%
0%
41%
0%
Building footprintLandscaping or open spaceFrom UnderbuildAdditional to reach goalParking area next to building
18%
41%
0%
41%
0%
Building footprintLandscaping or open spaceFrom UnderbuildAdditional to reach goalParking area next to building
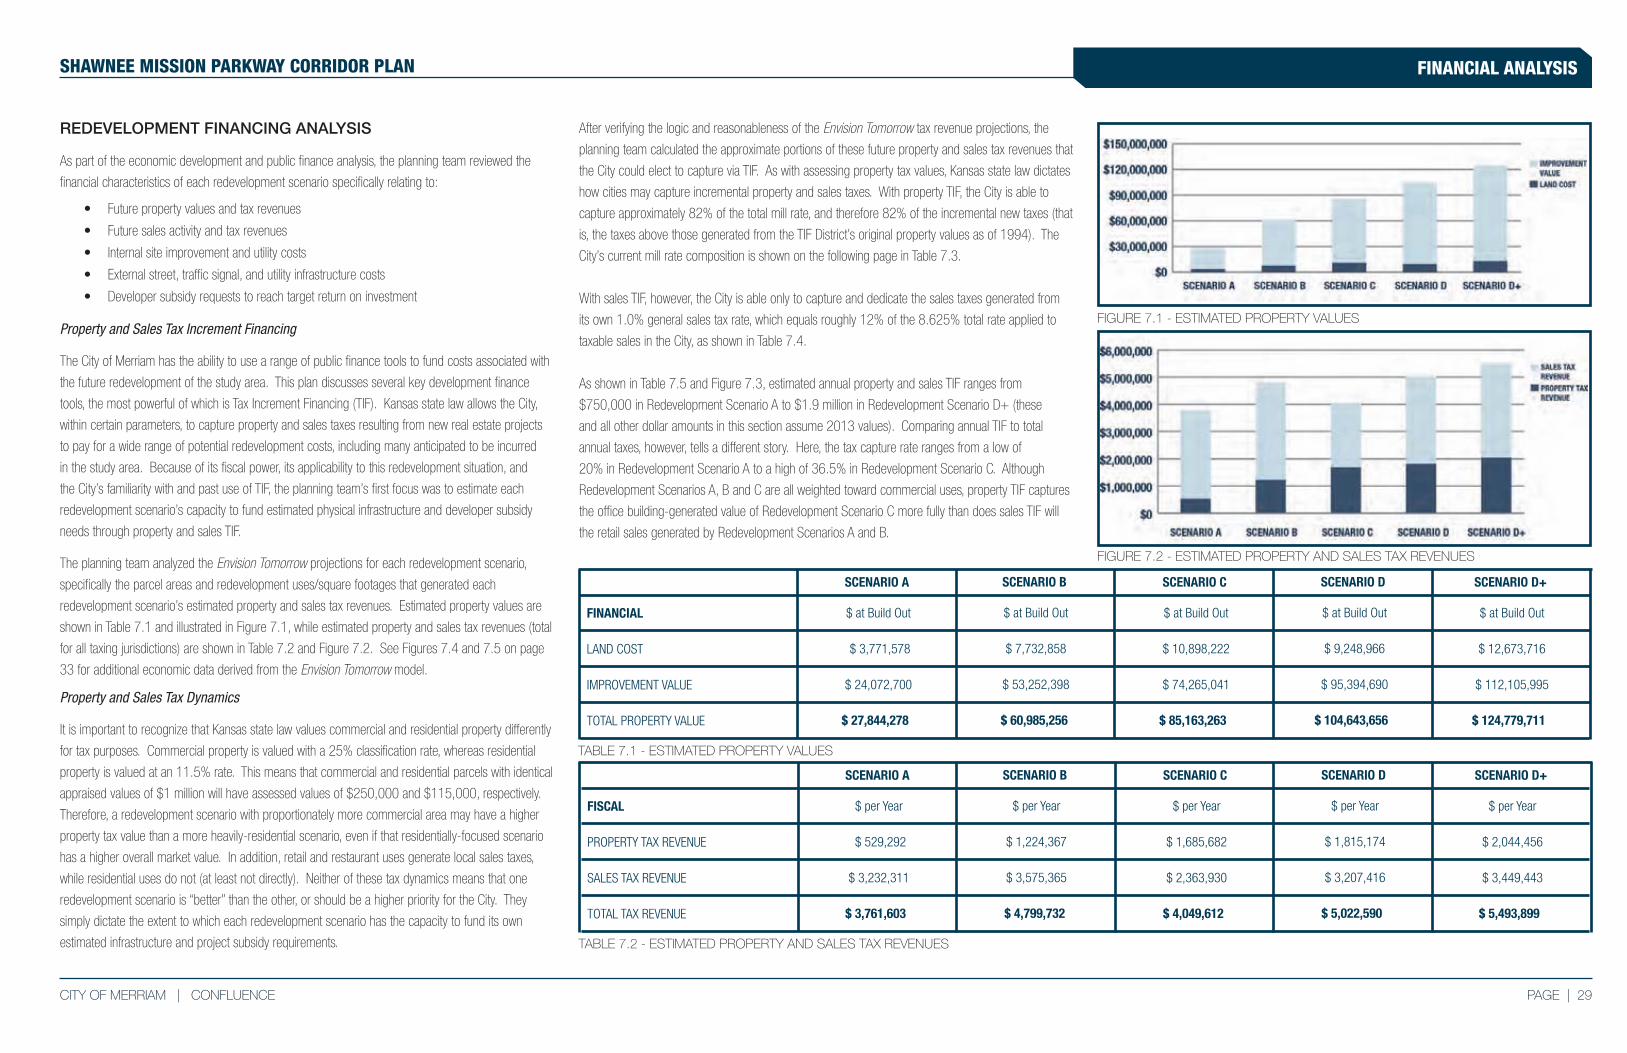
PAGE | 29CITY OF MERRIAM | CONFLUENCE
FINANCIAL ANALYSISSHAWNEE MISSION PARKWAY CORRIDOR PLAN
REDEVELOPMENT FINANCING ANALYSIS
As part of the economic development and public finance analysis, the planning team reviewed the
financial characteristics of each redevelopment scenario specifically relating to:
• Future property values and tax revenues
• Future sales activity and tax revenues
• Internal site improvement and utility costs
• External street, traffic signal, and utility infrastructure costs
• Developer subsidy requests to reach target return on investment
Property and Sales Tax Increment Financing
The City of Merriam has the ability to use a range of public finance tools to fund costs associated with
the future redevelopment of the study area. This plan discusses several key development finance
tools, the most powerful of which is Tax Increment Financing (TIF). Kansas state law allows the City,
within certain parameters, to capture property and sales taxes resulting from new real estate projects
to pay for a wide range of potential redevelopment costs, including many anticipated to be incurred
in the study area. Because of its fiscal power, its applicability to this redevelopment situation, and
the City’s familiarity with and past use of TIF, the planning team’s first focus was to estimate each
redevelopment scenario’s capacity to fund estimated physical infrastructure and developer subsidy
needs through property and sales TIF.
The planning team analyzed the Envision Tomorrow projections for each redevelopment scenario,
specifically the parcel areas and redevelopment uses/square footages that generated each
redevelopment scenario’s estimated property and sales tax revenues. Estimated property values are
shown in Table 7.1 and illustrated in Figure 7.1, while estimated property and sales tax revenues (total
for all taxing jurisdictions) are shown in Table 7.2 and Figure 7.2. See Figures 7.4 and 7.5 on page
33 for additional economic data derived from the Envision Tomorrow model.
Property and Sales Tax Dynamics
It is important to recognize that Kansas state law values commercial and residential property differently
for tax purposes. Commercial property is valued with a 25% classification rate, whereas residential
property is valued at an 11.5% rate. This means that commercial and residential parcels with identical
appraised values of $1 million will have assessed values of $250,000 and $115,000, respectively.
Therefore, a redevelopment scenario with proportionately more commercial area may have a higher
property tax value than a more heavily-residential scenario, even if that residentially-focused scenario
has a higher overall market value. In addition, retail and restaurant uses generate local sales taxes,
while residential uses do not (at least not directly). Neither of these tax dynamics means that one
redevelopment scenario is “better” than the other, or should be a higher priority for the City. They
simply dictate the extent to which each redevelopment scenario has the capacity to fund its own
estimated infrastructure and project subsidy requirements.
After verifying the logic and reasonableness of the Envision Tomorrow tax revenue projections, the
planning team calculated the approximate portions of these future property and sales tax revenues that
the City could elect to capture via TIF. As with assessing property tax values, Kansas state law dictates
how cities may capture incremental property and sales taxes. With property TIF, the City is able to
capture approximately 82% of the total mill rate, and therefore 82% of the incremental new taxes (that
is, the taxes above those generated from the TIF District’s original property values as of 1994). The
City’s current mill rate composition is shown on the following page in Table 7.3.
With sales TIF, however, the City is able only to capture and dedicate the sales taxes generated from
its own 1.0% general sales tax rate, which equals roughly 12% of the 8.625% total rate applied to
taxable sales in the City, as shown in Table 7.4.
As shown in Table 7.5 and Figure 7.3, estimated annual property and sales TIF ranges from
$750,000 in Redevelopment Scenario A to $1.9 million in Redevelopment Scenario D+ (these
and all other dollar amounts in this section assume 2013 values). Comparing annual TIF to total
annual taxes, however, tells a different story. Here, the tax capture rate ranges from a low of
20% in Redevelopment Scenario A to a high of 36.5% in Redevelopment Scenario C. Although
Redevelopment Scenarios A, B and C are all weighted toward commercial uses, property TIF captures
the office building-generated value of Redevelopment Scenario C more fully than does sales TIF will
the retail sales generated by Redevelopment Scenarios A and B.
FIGURE 7.1 - ESTIMATED PROPERTY VALUES
SCENARIO D+
LAND COST
$ at Build Out
$ 12,673,716
$ 112,105,995
$ 124,779,711
SCENARIO D
$ at Build Out
$ 9,248,966
$ 95,394,690
$ 104,643,656
SCENARIO C
$ at Build Out
$ 10,898,222
$ 74,265,041
$ 85,163,263
SCENARIO B
$ at Build Out
$ 7,732,858
$ 53,252,398
$ 60,985,256
SCENARIO A
$ at Build Out
$ 3,771,578
$ 24,072,700
$ 27,844,278
FINANCIAL
IMPROVEMENT VALUE
TOTAL PROPERTY VALUE
TABLE 7.1 - ESTIMATED PROPERTY VALUES
SCENARIO D+
PROPERTY TAX REVENUE
$ per Year
$ 2,044,456
$ 3,449,443
$ 5,493,899
SCENARIO D
$ per Year
$ 1,815,174
$ 3,207,416
$ 5,022,590
SCENARIO C
$ per Year
$ 1,685,682
$ 2,363,930
$ 4,049,612
SCENARIO B
$ per Year
$ 1,224,367
$ 3,575,365
$ 4,799,732
SCENARIO A
$ per Year
$ 529,292
$ 3,232,311
$ 3,761,603
FISCAL
SALES TAX REVENUE
TOTAL TAX REVENUE
TABLE 7.2 - ESTIMATED PROPERTY AND SALES TAX REVENUES
FIGURE 7.2 - ESTIMATED PROPERTY AND SALES TAX REVENUES
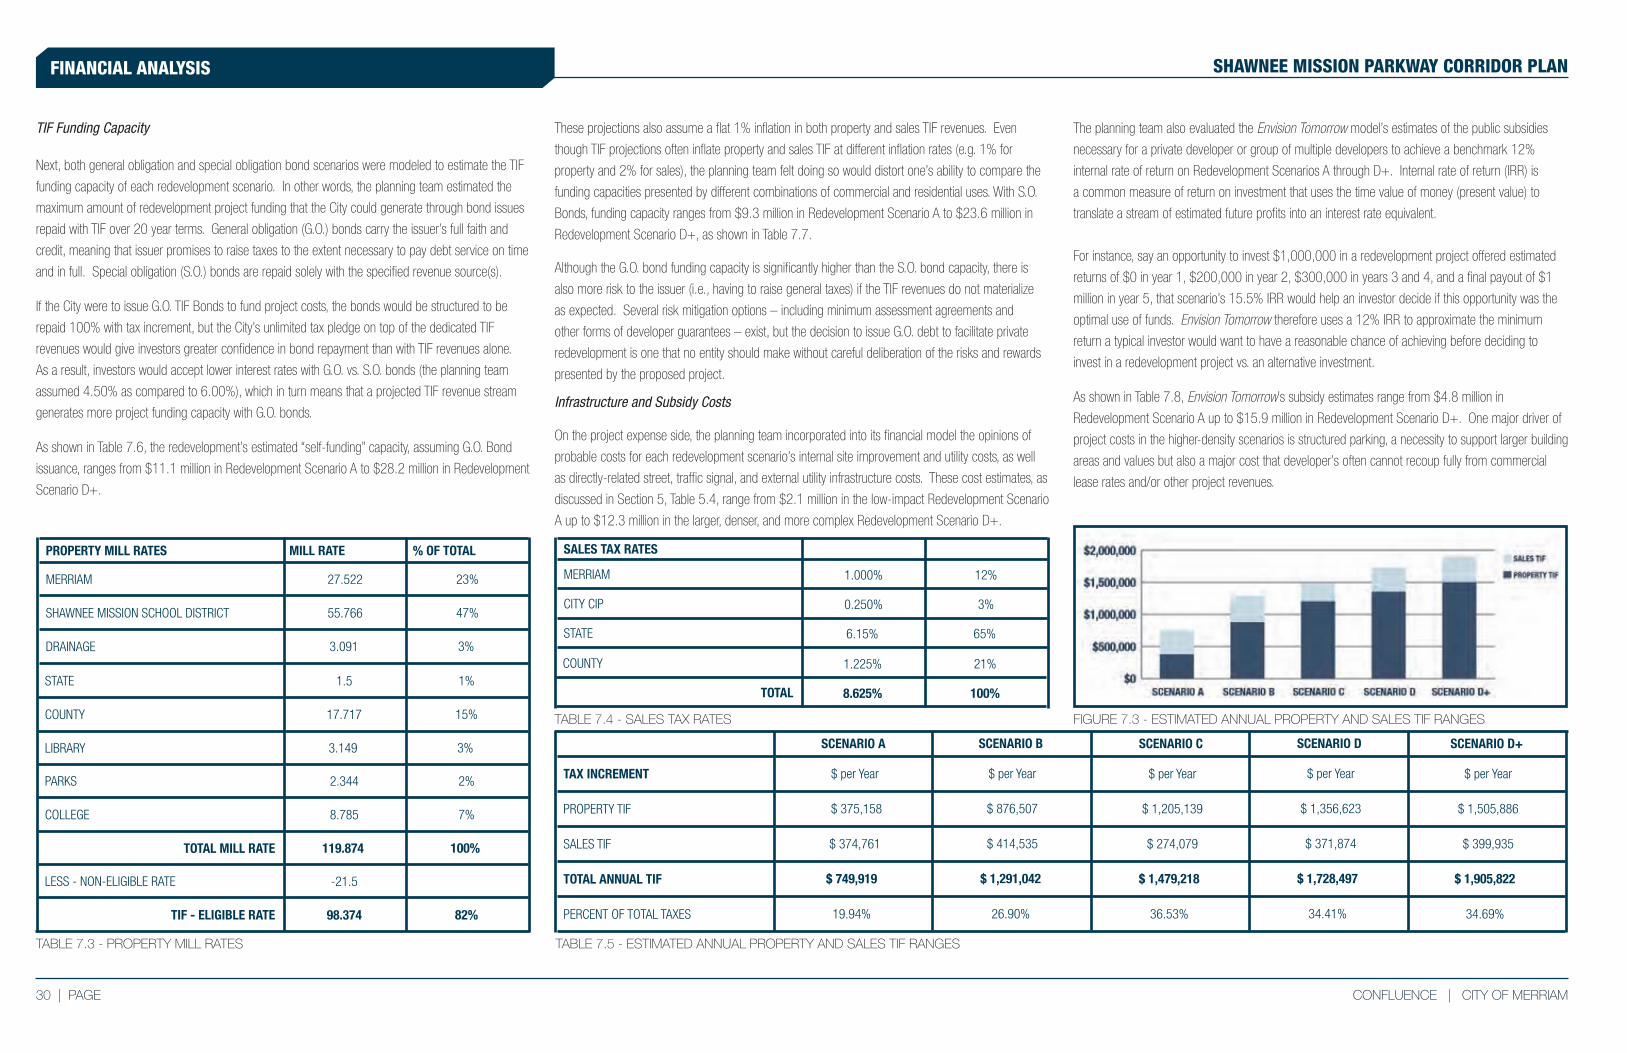
30 | PAGE CONFLUENCE | CITY OF MERRIAM
FINANCIAL ANALYSIS SHAWNEE MISSION PARKWAY CORRIDOR PLAN
TIF Funding Capacity
Next, both general obligation and special obligation bond scenarios were modeled to estimate the TIF
funding capacity of each redevelopment scenario. In other words, the planning team estimated the
maximum amount of redevelopment project funding that the City could generate through bond issues
repaid with TIF over 20 year terms. General obligation (G.O.) bonds carry the issuer’s full faith and
credit, meaning that issuer promises to raise taxes to the extent necessary to pay debt service on time
and in full. Special obligation (S.O.) bonds are repaid solely with the specified revenue source(s).
If the City were to issue G.O. TIF Bonds to fund project costs, the bonds would be structured to be
repaid 100% with tax increment, but the City’s unlimited tax pledge on top of the dedicated TIF
revenues would give investors greater confidence in bond repayment than with TIF revenues alone.
As a result, investors would accept lower interest rates with G.O. vs. S.O. bonds (the planning team
assumed 4.50% as compared to 6.00%), which in turn means that a projected TIF revenue stream
generates more project funding capacity with G.O. bonds.
As shown in Table 7.6, the redevelopment’s estimated “self-funding” capacity, assuming G.O. Bond
issuance, ranges from $11.1 million in Redevelopment Scenario A to $28.2 million in Redevelopment
Scenario D+.
These projections also assume a flat 1% inflation in both property and sales TIF revenues. Even
though TIF projections often inflate property and sales TIF at different inflation rates (e.g. 1% for
property and 2% for sales), the planning team felt doing so would distort one’s ability to compare the
funding capacities presented by different combinations of commercial and residential uses. With S.O.
Bonds, funding capacity ranges from $9.3 million in Redevelopment Scenario A to $23.6 million in
Redevelopment Scenario D+, as shown in Table 7.7.
Although the G.O. bond funding capacity is significantly higher than the S.O. bond capacity, there is
also more risk to the issuer (i.e., having to raise general taxes) if the TIF revenues do not materialize
as expected. Several risk mitigation options – including minimum assessment agreements and
other forms of developer guarantees – exist, but the decision to issue G.O. debt to facilitate private
redevelopment is one that no entity should make without careful deliberation of the risks and rewards
presented by the proposed project.
Infrastructure and Subsidy Costs
On the project expense side, the planning team incorporated into its financial model the opinions of
probable costs for each redevelopment scenario’s internal site improvement and utility costs, as well
as directly-related street, traffic signal, and external utility infrastructure costs. These cost estimates, as
discussed in Section 5, Table 5.4, range from $2.1 million in the low-impact Redevelopment Scenario
A up to $12.3 million in the larger, denser, and more complex Redevelopment Scenario D+.
The planning team also evaluated the Envision Tomorrow model’s estimates of the public subsidies
necessary for a private developer or group of multiple developers to achieve a benchmark 12%
internal rate of return on Redevelopment Scenarios A through D+. Internal rate of return (IRR) is
a common measure of return on investment that uses the time value of money (present value) to
translate a stream of estimated future profits into an interest rate equivalent.
For instance, say an opportunity to invest $1,000,000 in a redevelopment project offered estimated
returns of $0 in year 1, $200,000 in year 2, $300,000 in years 3 and 4, and a final payout of $1
million in year 5, that scenario’s 15.5% IRR would help an investor decide if this opportunity was the
optimal use of funds. Envision Tomorrow therefore uses a 12% IRR to approximate the minimum
return a typical investor would want to have a reasonable chance of achieving before deciding to
invest in a redevelopment project vs. an alternative investment.
As shown in Table 7.8, Envision Tomorrow’s subsidy estimates range from $4.8 million in
Redevelopment Scenario A up to $15.9 million in Redevelopment Scenario D+. One major driver of
project costs in the higher-density scenarios is structured parking, a necessity to support larger building
areas and values but also a major cost that developer’s often cannot recoup fully from commercial
lease rates and/or other project revenues.
FIGURE 7.3 - ESTIMATED ANNUAL PROPERTY AND SALES TIF RANGES
TABLE 7.3 - PROPERTY MILL RATES TABLE 7.5 - ESTIMATED ANNUAL PROPERTY AND SALES TIF RANGES
SCENARIO D+
PROPERTY TIF
$ per Year
$ 1,505,886
$ 399,935
$ 1,905,822
SCENARIO D
$ per Year
$ 1,356,623
$ 371,874
$ 1,728,497
SCENARIO C
$ per Year
$ 1,205,139
$ 274,079
$ 1,479,218
SCENARIO B
$ per Year
$ 876,507
$ 414,535
$ 1,291,042
SCENARIO A
$ per Year
$ 375,158
$ 374,761
$ 749,919
TAX INCREMENT
SALES TIF
TOTAL ANNUAL TIF
34.69%34.41%36.53% 26.90%19.94%PERCENT OF TOTAL TAXES
MERRIAM 1.000%
0.250%
6.15%
SALES TAX RATES
CITY CIP
STATE
12%
3%
65%
COUNTY 1.225%
8.625%TOTAL
21%
100%
TABLE 7.4 - SALES TAX RATES
23%
47%
3%
1%
15%
3%
2%
7%
100%
82%
MERRIAM 27.522
55.766
3.091
PROPERTY MILL RATES
SHAWNEE MISSION SCHOOL DISTRICT
DRAINAGE
STATE 1.5
17.717
3.149
COUNTY
LIBRARY
PARKS 2.344
8.785
119.874
COLLEGE
TOTAL MILL RATE
LESS - NON-ELIGIBLE RATE -21.5
98.374TIF - ELIGIBLE RATE
MILL RATE % OF TOTAL
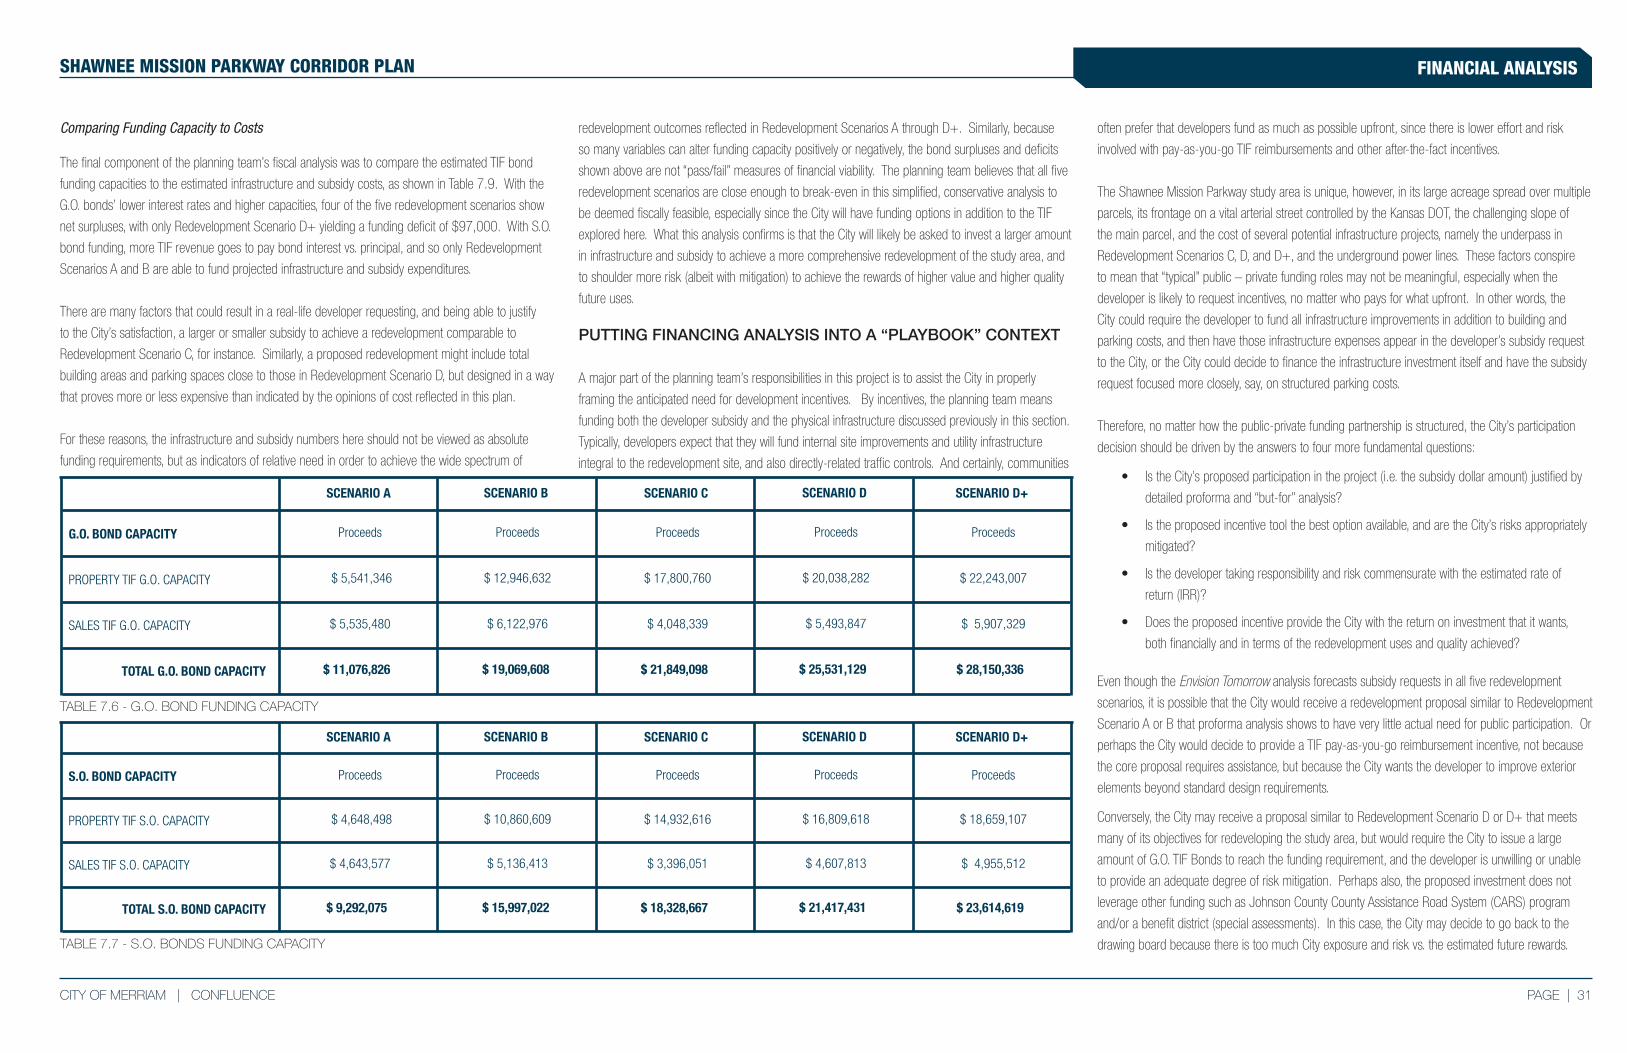
PAGE | 31CITY OF MERRIAM | CONFLUENCE
FINANCIAL ANALYSISSHAWNEE MISSION PARKWAY CORRIDOR PLAN
Comparing Funding Capacity to Costs
The final component of the planning team’s fiscal analysis was to compare the estimated TIF bond
funding capacities to the estimated infrastructure and subsidy costs, as shown in Table 7.9. With the
G.O. bonds’ lower interest rates and higher capacities, four of the five redevelopment scenarios show
net surpluses, with only Redevelopment Scenario D+ yielding a funding deficit of $97,000. With S.O.
bond funding, more TIF revenue goes to pay bond interest vs. principal, and so only Redevelopment
Scenarios A and B are able to fund projected infrastructure and subsidy expenditures.
There are many factors that could result in a real-life developer requesting, and being able to justify
to the City’s satisfaction, a larger or smaller subsidy to achieve a redevelopment comparable to
Redevelopment Scenario C, for instance. Similarly, a proposed redevelopment might include total
building areas and parking spaces close to those in Redevelopment Scenario D, but designed in a way
that proves more or less expensive than indicated by the opinions of cost reflected in this plan.
For these reasons, the infrastructure and subsidy numbers here should not be viewed as absolute
funding requirements, but as indicators of relative need in order to achieve the wide spectrum of
redevelopment outcomes reflected in Redevelopment Scenarios A through D+. Similarly, because
so many variables can alter funding capacity positively or negatively, the bond surpluses and deficits
shown above are not “pass/fail” measures of financial viability. The planning team believes that all five
redevelopment scenarios are close enough to break-even in this simplified, conservative analysis to
be deemed fiscally feasible, especially since the City will have funding options in addition to the TIF
explored here. What this analysis confirms is that the City will likely be asked to invest a larger amount
in infrastructure and subsidy to achieve a more comprehensive redevelopment of the study area, and
to shoulder more risk (albeit with mitigation) to achieve the rewards of higher value and higher quality
future uses.
PUTTING FINANCING ANALYSIS INTO A “PLAYBOOK” CONTEXT
A major part of the planning team’s responsibilities in this project is to assist the City in properly
framing the anticipated need for development incentives. By incentives, the planning team means
funding both the developer subsidy and the physical infrastructure discussed previously in this section.
Typically, developers expect that they will fund internal site improvements and utility infrastructure
integral to the redevelopment site, and also directly-related traffic controls. And certainly, communities
often prefer that developers fund as much as possible upfront, since there is lower effort and risk
involved with pay-as-you-go TIF reimbursements and other after-the-fact incentives.
The Shawnee Mission Parkway study area is unique, however, in its large acreage spread over multiple
parcels, its frontage on a vital arterial street controlled by the Kansas DOT, the challenging slope of
the main parcel, and the cost of several potential infrastructure projects, namely the underpass in
Redevelopment Scenarios C, D, and D+, and the underground power lines. These factors conspire
to mean that “typical” public – private funding roles may not be meaningful, especially when the
developer is likely to request incentives, no matter who pays for what upfront. In other words, the
City could require the developer to fund all infrastructure improvements in addition to building and
parking costs, and then have those infrastructure expenses appear in the developer’s subsidy request
to the City, or the City could decide to finance the infrastructure investment itself and have the subsidy
request focused more closely, say, on structured parking costs.
Therefore, no matter how the public-private funding partnership is structured, the City’s participation
decision should be driven by the answers to four more fundamental questions:
• Is the City’s proposed participation in the project (i.e. the subsidy dollar amount) justified by
detailed proforma and “but-for” analysis?
• Is the proposed incentive tool the best option available, and are the City’s risks appropriately
mitigated?
• Is the developer taking responsibility and risk commensurate with the estimated rate of
return (IRR)?
• Does the proposed incentive provide the City with the return on investment that it wants,
both financially and in terms of the redevelopment uses and quality achieved?
Even though the Envision Tomorrow analysis forecasts subsidy requests in all five redevelopment
scenarios, it is possible that the City would receive a redevelopment proposal similar to Redevelopment
Scenario A or B that proforma analysis shows to have very little actual need for public participation. Or
perhaps the City would decide to provide a TIF pay-as-you-go reimbursement incentive, not because
the core proposal requires assistance, but because the City wants the developer to improve exterior
elements beyond standard design requirements.
Conversely, the City may receive a proposal similar to Redevelopment Scenario D or D+ that meets
many of its objectives for redeveloping the study area, but would require the City to issue a large
amount of G.O. TIF Bonds to reach the funding requirement, and the developer is unwilling or unable
to provide an adequate degree of risk mitigation. Perhaps also, the proposed investment does not
leverage other funding such as Johnson County County Assistance Road System (CARS) program
and/or a benefit district (special assessments). In this case, the City may decide to go back to the
drawing board because there is too much City exposure and risk vs. the estimated future rewards.TABLE 7.7 - S.O. BONDS FUNDING CAPACITY
SCENARIO D+
PROPERTY TIF G.O. CAPACITY
Proceeds
$ 22,243,007
$ 5,907,329
$ 28,150,336
SCENARIO D
Proceeds
$ 20,038,282
$ 5,493,847
$ 25,531,129
SCENARIO C
Proceeds
$ 17,800,760
$ 4,048,339
$ 21,849,098
SCENARIO B
Proceeds
$ 12,946,632
$ 6,122,976
$ 19,069,608
SCENARIO A
Proceeds
$ 5,541,346
$ 5,535,480
$ 11,076,826
G.O. BOND CAPACITY
SALES TIF G.O. CAPACITY
TOTAL G.O. BOND CAPACITY
SCENARIO D+
PROPERTY TIF S.O. CAPACITY
Proceeds
$ 18,659,107
$ 4,955,512
$ 23,614,619
SCENARIO D
Proceeds
$ 16,809,618
$ 4,607,813
$ 21,417,431
SCENARIO C
Proceeds
$ 14,932,616
$ 3,396,051
$ 18,328,667
SCENARIO B
Proceeds
$ 10,860,609
$ 5,136,413
$ 15,997,022
SCENARIO A
Proceeds
$ 4,648,498
$ 4,643,577
$ 9,292,075
S.O. BOND CAPACITY
SALES TIF S.O. CAPACITY
TOTAL S.O. BOND CAPACITY
TABLE 7.6 - G.O. BOND FUNDING CAPACITY
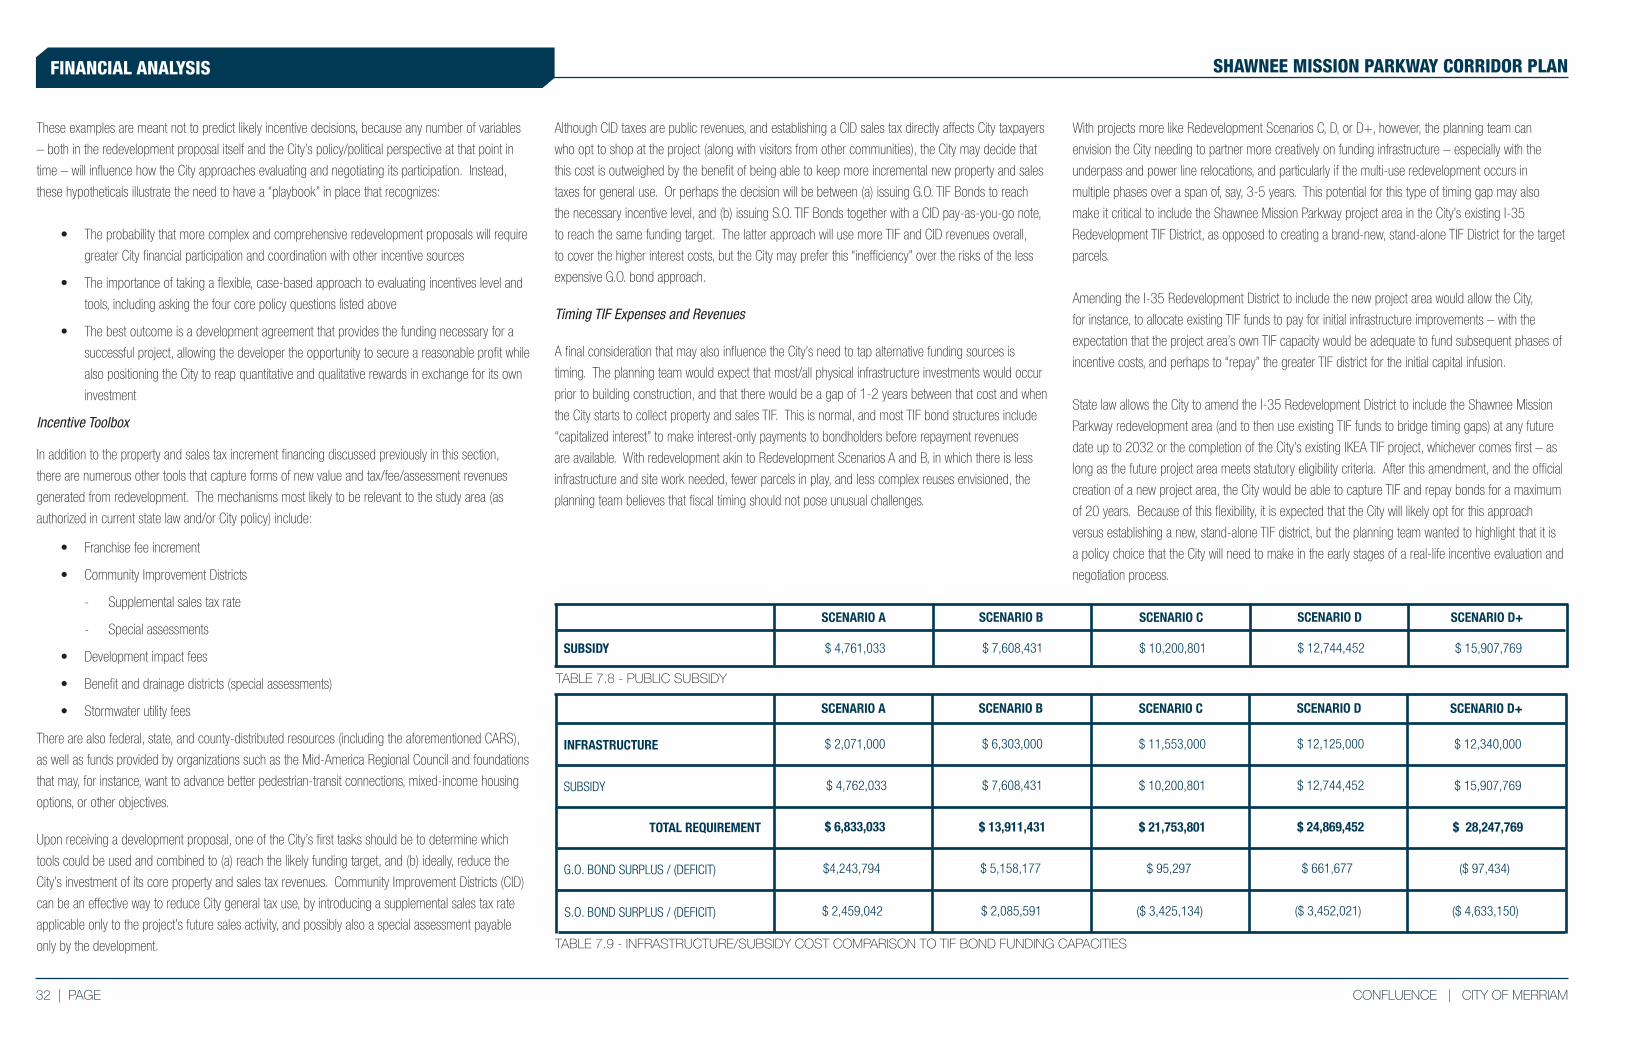
32 | PAGE CONFLUENCE | CITY OF MERRIAM
FINANCIAL ANALYSIS SHAWNEE MISSION PARKWAY CORRIDOR PLAN
These examples are meant not to predict likely incentive decisions, because any number of variables
– both in the redevelopment proposal itself and the City’s policy/political perspective at that point in
time – will influence how the City approaches evaluating and negotiating its participation. Instead,
these hypotheticals illustrate the need to have a “playbook” in place that recognizes:
• The probability that more complex and comprehensive redevelopment proposals will require
greater City financial participation and coordination with other incentive sources
• The importance of taking a flexible, case-based approach to evaluating incentives level and
tools, including asking the four core policy questions listed above
• The best outcome is a development agreement that provides the funding necessary for a
successful project, allowing the developer the opportunity to secure a reasonable profit while
also positioning the City to reap quantitative and qualitative rewards in exchange for its own
investment
Incentive Toolbox
In addition to the property and sales tax increment financing discussed previously in this section,
there are numerous other tools that capture forms of new value and tax/fee/assessment revenues
generated from redevelopment. The mechanisms most likely to be relevant to the study area (as
authorized in current state law and/or City policy) include:
• Franchise fee increment
• Community Improvement Districts
- Supplemental sales tax rate
- Special assessments
• Development impact fees
• Benefit and drainage districts (special assessments)
• Stormwater utility fees
There are also federal, state, and county-distributed resources (including the aforementioned CARS),
as well as funds provided by organizations such as the Mid-America Regional Council and foundations
that may, for instance, want to advance better pedestrian-transit connections, mixed-income housing
options, or other objectives.
Upon receiving a development proposal, one of the City’s first tasks should be to determine which
tools could be used and combined to (a) reach the likely funding target, and (b) ideally, reduce the
City’s investment of its core property and sales tax revenues. Community Improvement Districts (CID)
can be an effective way to reduce City general tax use, by introducing a supplemental sales tax rate
applicable only to the project’s future sales activity, and possibly also a special assessment payable
only by the development.
Although CID taxes are public revenues, and establishing a CID sales tax directly affects City taxpayers
who opt to shop at the project (along with visitors from other communities), the City may decide that
this cost is outweighed by the benefit of being able to keep more incremental new property and sales
taxes for general use. Or perhaps the decision will be between (a) issuing G.O. TIF Bonds to reach
the necessary incentive level, and (b) issuing S.O. TIF Bonds together with a CID pay-as-you-go note,
to reach the same funding target. The latter approach will use more TIF and CID revenues overall,
to cover the higher interest costs, but the City may prefer this “inefficiency” over the risks of the less
expensive G.O. bond approach.
Timing TIF Expenses and Revenues
A final consideration that may also influence the City’s need to tap alternative funding sources is
timing. The planning team would expect that most/all physical infrastructure investments would occur
prior to building construction, and that there would be a gap of 1-2 years between that cost and when
the City starts to collect property and sales TIF. This is normal, and most TIF bond structures include
“capitalized interest” to make interest-only payments to bondholders before repayment revenues
are available. With redevelopment akin to Redevelopment Scenarios A and B, in which there is less
infrastructure and site work needed, fewer parcels in play, and less complex reuses envisioned, the
planning team believes that fiscal timing should not pose unusual challenges.
With projects more like Redevelopment Scenarios C, D, or D+, however, the planning team can
envision the City needing to partner more creatively on funding infrastructure – especially with the
underpass and power line relocations, and particularly if the multi-use redevelopment occurs in
multiple phases over a span of, say, 3-5 years. This potential for this type of timing gap may also
make it critical to include the Shawnee Mission Parkway project area in the City’s existing I-35
Redevelopment TIF District, as opposed to creating a brand-new, stand-alone TIF District for the target
parcels.
Amending the I-35 Redevelopment District to include the new project area would allow the City,
for instance, to allocate existing TIF funds to pay for initial infrastructure improvements – with the
expectation that the project area’s own TIF capacity would be adequate to fund subsequent phases of
incentive costs, and perhaps to “repay” the greater TIF district for the initial capital infusion.
State law allows the City to amend the I-35 Redevelopment District to include the Shawnee Mission
Parkway redevelopment area (and to then use existing TIF funds to bridge timing gaps) at any future
date up to 2032 or the completion of the City’s existing IKEA TIF project, whichever comes first – as
long as the future project area meets statutory eligibility criteria. After this amendment, and the official
creation of a new project area, the City would be able to capture TIF and repay bonds for a maximum
of 20 years. Because of this flexibility, it is expected that the City will likely opt for this approach
versus establishing a new, stand-alone TIF district, but the planning team wanted to highlight that it is
a policy choice that the City will need to make in the early stages of a real-life incentive evaluation and
negotiation process.
SCENARIO D+
SUBSIDY
$ 12,340,000
$ 15,907,769
$ 28,247,769
($ 97,434)
SCENARIO D
$ 12,125,000
$ 12,744,452
$ 24,869,452
$ 661,677
SCENARIO C
$ 11,553,000
$ 10,200,801
$ 21,753,801
$ 95,297
SCENARIO B
$ 6,303,000
$ 7,608,431
$ 13,911,431
$ 5,158,177
SCENARIO A
$ 2,071,000
$ 4,762,033
$ 6,833,033
$4,243,794
INFRASTRUCTURE
TOTAL REQUIREMENT
G.O. BOND SURPLUS / (DEFICIT)
($ 4,633,150)($ 3,452,021)($ 3,425,134) $ 2,085,591$ 2,459,042S.O. BOND SURPLUS / (DEFICIT)
TABLE 7.9 - INFRASTRUCTURE/SUBSIDY COST COMPARISON TO TIF BOND FUNDING CAPACITIES
SCENARIO D+
$ 15,907,769
SCENARIO D
$ 12,744,452
SCENARIO C
$ 10,200,801
SCENARIO B
$ 7,608,431
SCENARIO A
$ 4,761,033SUBSIDY
TABLE 7.8 - PUBLIC SUBSIDY
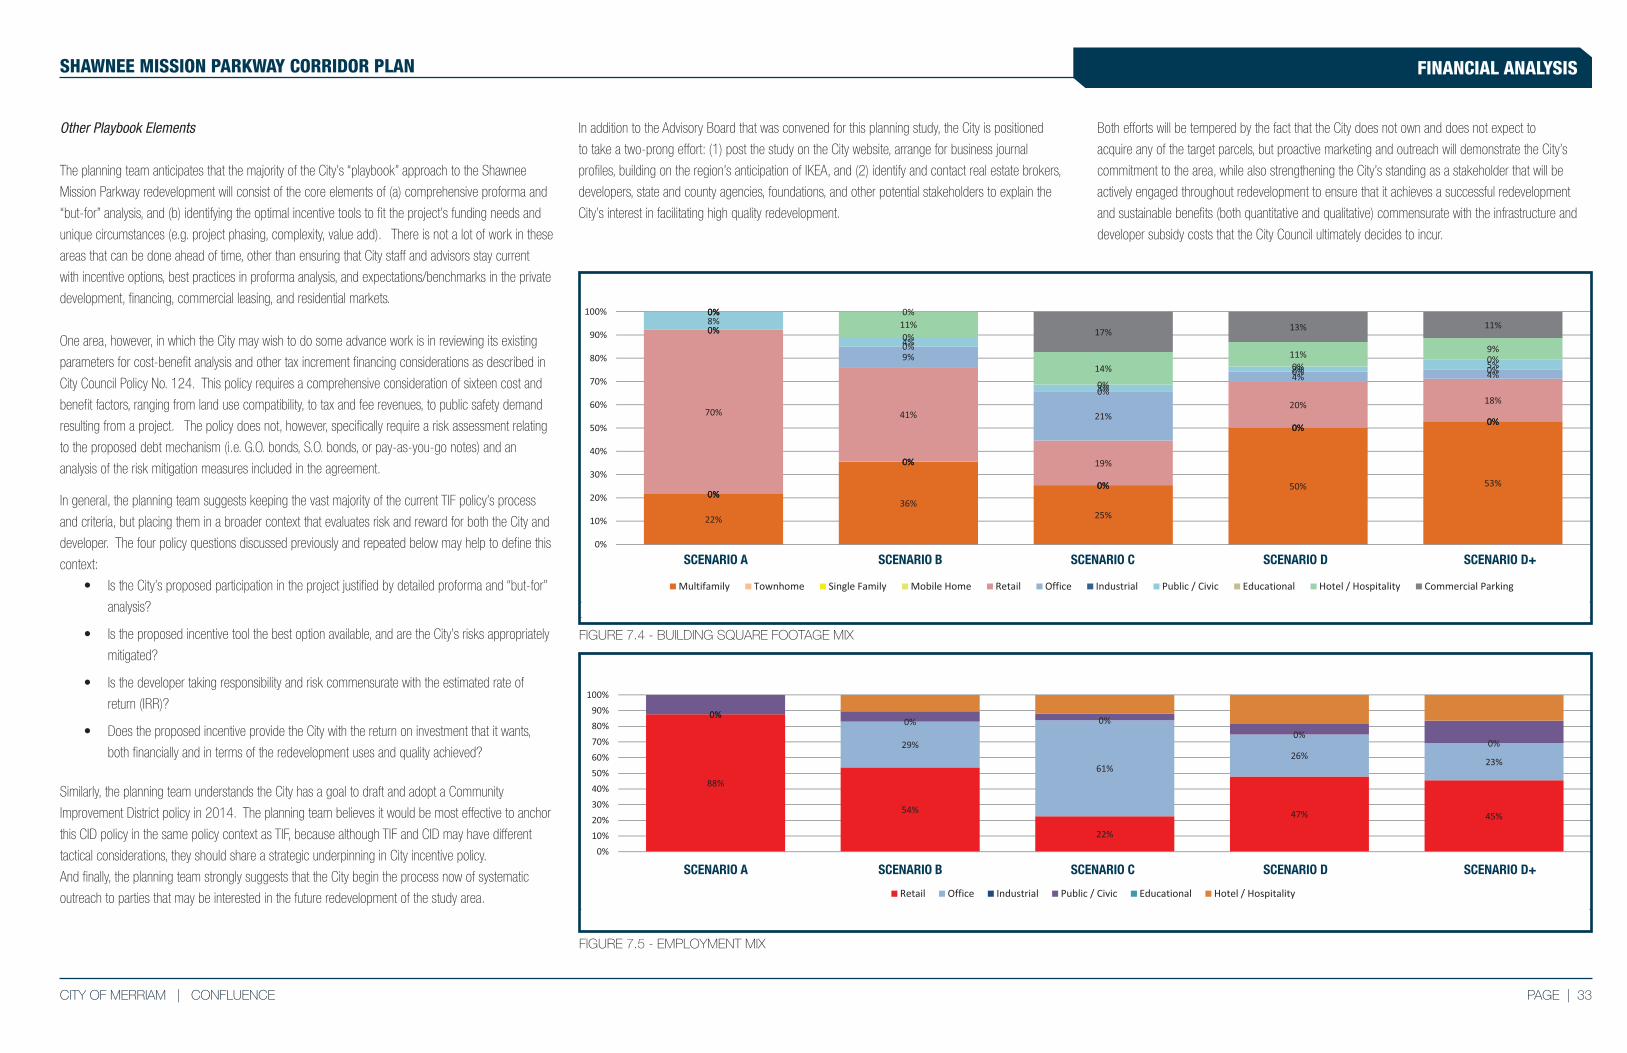
PAGE | 33CITY OF MERRIAM | CONFLUENCE
FINANCIAL ANALYSISSHAWNEE MISSION PARKWAY CORRIDOR PLAN
In addition to the Advisory Board that was convened for this planning study, the City is positioned
to take a two-prong effort: (1) post the study on the City website, arrange for business journal
profiles, building on the region’s anticipation of IKEA, and (2) identify and contact real estate brokers,
developers, state and county agencies, foundations, and other potential stakeholders to explain the
City’s interest in facilitating high quality redevelopment.
Other Playbook Elements
The planning team anticipates that the majority of the City’s “playbook” approach to the Shawnee
Mission Parkway redevelopment will consist of the core elements of (a) comprehensive proforma and
“but-for” analysis, and (b) identifying the optimal incentive tools to fit the project’s funding needs and
unique circumstances (e.g. project phasing, complexity, value add). There is not a lot of work in these
areas that can be done ahead of time, other than ensuring that City staff and advisors stay current
with incentive options, best practices in proforma analysis, and expectations/benchmarks in the private
development, financing, commercial leasing, and residential markets.
One area, however, in which the City may wish to do some advance work is in reviewing its existing
parameters for cost-benefit analysis and other tax increment financing considerations as described in
City Council Policy No. 124. This policy requires a comprehensive consideration of sixteen cost and
benefit factors, ranging from land use compatibility, to tax and fee revenues, to public safety demand
resulting from a project. The policy does not, however, specifically require a risk assessment relating
to the proposed debt mechanism (i.e. G.O. bonds, S.O. bonds, or pay-as-you-go notes) and an
analysis of the risk mitigation measures included in the agreement.
In general, the planning team suggests keeping the vast majority of the current TIF policy’s process
and criteria, but placing them in a broader context that evaluates risk and reward for both the City and
developer. The four policy questions discussed previously and repeated below may help to define this
context:
• Is the City’s proposed participation in the project justified by detailed proforma and “but-for”
analysis?
• Is the proposed incentive tool the best option available, and are the City’s risks appropriately
mitigated?
• Is the developer taking responsibility and risk commensurate with the estimated rate of
return (IRR)?
• Does the proposed incentive provide the City with the return on investment that it wants,
both financially and in terms of the redevelopment uses and quality achieved?
Similarly, the planning team understands the City has a goal to draft and adopt a Community
Improvement District policy in 2014. The planning team believes it would be most effective to anchor
this CID policy in the same policy context as TIF, because although TIF and CID may have different
tactical considerations, they should share a strategic underpinning in City incentive policy.
And finally, the planning team strongly suggests that the City begin the process now of systematic
outreach to parties that may be interested in the future redevelopment of the study area.
Both efforts will be tempered by the fact that the City does not own and does not expect to
acquire any of the target parcels, but proactive marketing and outreach will demonstrate the City’s
commitment to the area, while also strengthening the City’s standing as a stakeholder that will be
actively engaged throughout redevelopment to ensure that it achieves a successful redevelopment
and sustainable benefits (both quantitative and qualitative) commensurate with the infrastructure and
developer subsidy costs that the City Council ultimately decides to incur.
FIGURE 7.4 - BUILDING SQUARE FOOTAGE MIX
FIGURE 7.5 - EMPLOYMENT MIX
SCENARIO A SCENARIO B SCENARIO C SCENARIO D SCENARIO D+
SCENARIO A SCENARIO B SCENARIO C SCENARIO D SCENARIO D+


SHAWNEE MISSION PARKWAY CORRIDOR PLAN
URBAN DESIGN GUIDELINES SECTION 8
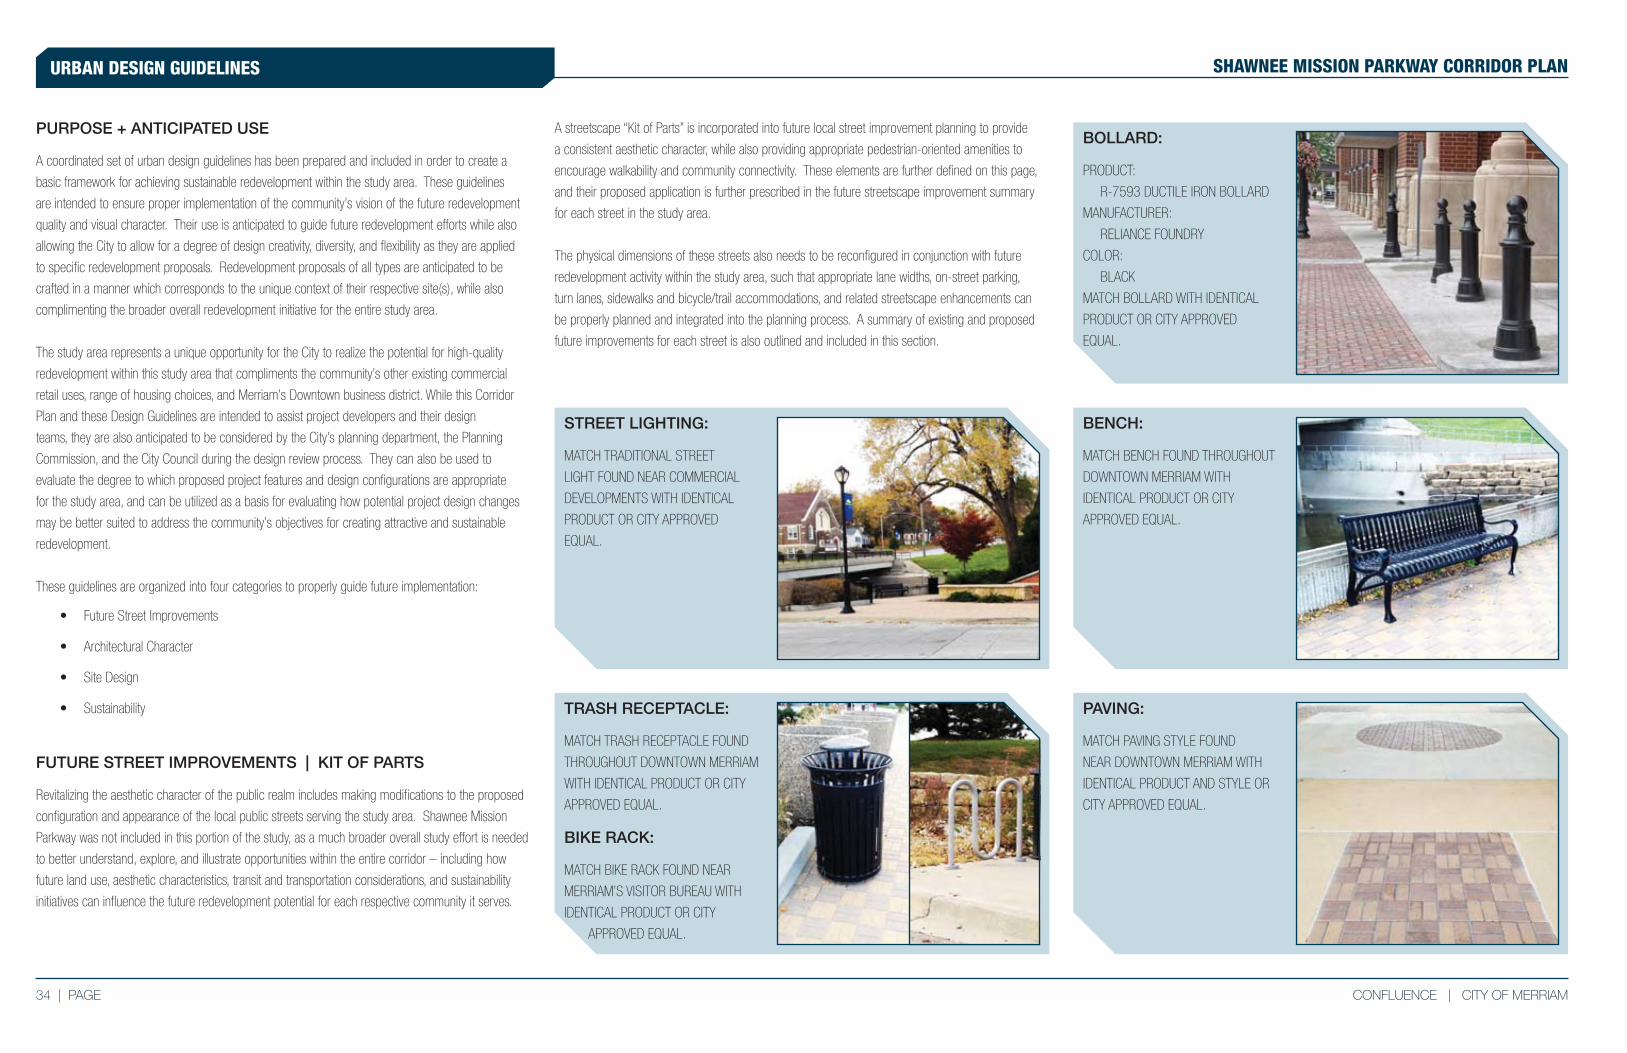
34 | PAGE CONFLUENCE | CITY OF MERRIAM
URBAN DESIGN GUIDELINES SHAWNEE MISSION PARKWAY CORRIDOR PLAN
PURPOSE + ANTICIPATED USE
A coordinated set of urban design guidelines has been prepared and included in order to create a
basic framework for achieving sustainable redevelopment within the study area. These guidelines
are intended to ensure proper implementation of the community’s vision of the future redevelopment
quality and visual character. Their use is anticipated to guide future redevelopment efforts while also
allowing the City to allow for a degree of design creativity, diversity, and flexibility as they are applied
to specific redevelopment proposals. Redevelopment proposals of all types are anticipated to be
crafted in a manner which corresponds to the unique context of their respective site(s), while also
complimenting the broader overall redevelopment initiative for the entire study area.
The study area represents a unique opportunity for the City to realize the potential for high-quality
redevelopment within this study area that compliments the community’s other existing commercial
retail uses, range of housing choices, and Merriam’s Downtown business district. While this Corridor
Plan and these Design Guidelines are intended to assist project developers and their design
teams, they are also anticipated to be considered by the City’s planning department, the Planning
Commission, and the City Council during the design review process. They can also be used to
evaluate the degree to which proposed project features and design configurations are appropriate
for the study area, and can be utilized as a basis for evaluating how potential project design changes
may be better suited to address the community’s objectives for creating attractive and sustainable
redevelopment.
These guidelines are organized into four categories to properly guide future implementation:
• Future Street Improvements
• Architectural Character
• Site Design
• Sustainability
FUTURE STREET IMPROVEMENTS | KIT OF PARTS
Revitalizing the aesthetic character of the public realm includes making modifications to the proposed
configuration and appearance of the local public streets serving the study area. Shawnee Mission
Parkway was not included in this portion of the study, as a much broader overall study effort is needed
to better understand, explore, and illustrate opportunities within the entire corridor – including how
future land use, aesthetic characteristics, transit and transportation considerations, and sustainability
initiatives can influence the future redevelopment potential for each respective community it serves.
BENCH:
MATCH BENCH FOUND THROUGHOUT
DOWNTOWN MERRIAM WITH
IDENTICAL PRODUCT OR CITY
APPROVED EQUAL.
PAVING:
MATCH PAVING STYLE FOUND
NEAR DOWNTOWN MERRIAM WITH
IDENTICAL PRODUCT AND STYLE OR
CITY APPROVED EQUAL.
STREET LIGHTING:
MATCH TRADITIONAL STREET
LIGHT FOUND NEAR COMMERCIAL
DEVELOPMENTS WITH IDENTICAL
PRODUCT OR CITY APPROVED
EQUAL.
BOLLARD:
PRODUCT:
R-7593 DUCTILE IRON BOLLARD
MANUFACTURER:
RELIANCE FOUNDRY
COLOR:
BLACK
MATCH BOLLARD WITH IDENTICAL
PRODUCT OR CITY APPROVED
EQUAL.
A streetscape “Kit of Parts” is incorporated into future local street improvement planning to provide
a consistent aesthetic character, while also providing appropriate pedestrian-oriented amenities to
encourage walkability and community connectivity. These elements are further defined on this page,
and their proposed application is further prescribed in the future streetscape improvement summary
for each street in the study area.
The physical dimensions of these streets also needs to be reconfigured in conjunction with future
redevelopment activity within the study area, such that appropriate lane widths, on-street parking,
turn lanes, sidewalks and bicycle/trail accommodations, and related streetscape enhancements can
be properly planned and integrated into the planning process. A summary of existing and proposed
future improvements for each street is also outlined and included in this section.
TRASH RECEPTACLE:
MATCH TRASH RECEPTACLE FOUND
THROUGHOUT DOWNTOWN MERRIAM
WITH IDENTICAL PRODUCT OR CITY
APPROVED EQUAL.
BIKE RACK:
MATCH BIKE RACK FOUND NEAR
MERRIAM’S VISITOR BUREAU WITH
IDENTICAL PRODUCT OR CITY
APPROVED EQUAL.
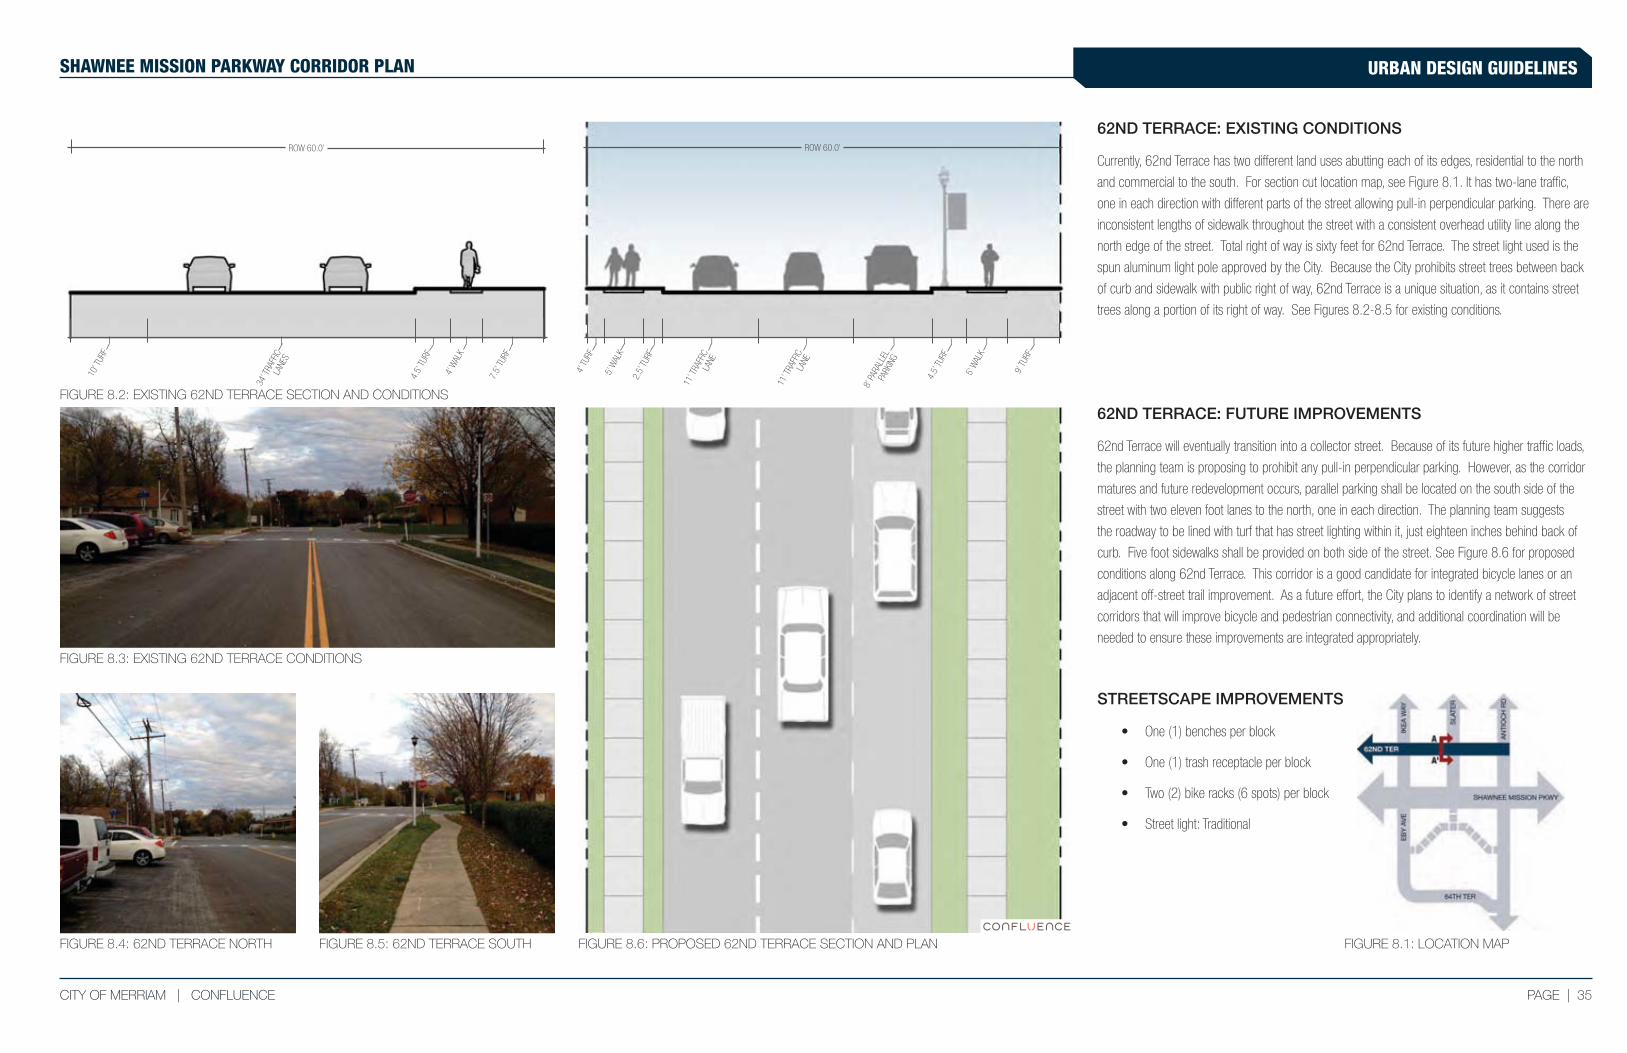
PAGE | 35CITY OF MERRIAM | CONFLUENCE
URBAN DESIGN GUIDELINESSHAWNEE MISSION PARKWAY CORRIDOR PLAN10
’ TUR
F
34’ T
RAFF
IC
LANE
S
4.5’
TUR
F
4’ W
ALK
7.5’
TUR
F
FIGURE 8.3: EXISTING 62ND TERRACE CONDITIONS
FIGURE 8.5: 62ND TERRACE SOUTHFIGURE 8.4: 62ND TERRACE NORTH
2.5’
TUR
F
5’ W
ALK
4’ T
URF
11’ T
RAFF
IC
LANE
4.5’
TUR
F
5’ W
ALK
9’ T
URF
11’ T
RAFF
IC
LANE
8’ P
ARAL
LEL
PARK
ING
62ND TERRACE: EXISTING CONDITIONS
Currently, 62nd Terrace has two different land uses abutting each of its edges, residential to the north
and commercial to the south. For section cut location map, see Figure 8.1. It has two-lane traffic,
one in each direction with different parts of the street allowing pull-in perpendicular parking. There are
inconsistent lengths of sidewalk throughout the street with a consistent overhead utility line along the
north edge of the street. Total right of way is sixty feet for 62nd Terrace. The street light used is the
spun aluminum light pole approved by the City. Because the City prohibits street trees between back
of curb and sidewalk with public right of way, 62nd Terrace is a unique situation, as it contains street
trees along a portion of its right of way. See Figures 8.2-8.5 for existing conditions.
FIGURE 8.2: EXISTING 62ND TERRACE SECTION AND CONDITIONS
FIGURE 8.6: PROPOSED 62ND TERRACE SECTION AND PLAN
62ND TERRACE: FUTURE IMPROVEMENTS
62nd Terrace will eventually transition into a collector street. Because of its future higher traffic loads,
the planning team is proposing to prohibit any pull-in perpendicular parking. However, as the corridor
matures and future redevelopment occurs, parallel parking shall be located on the south side of the
street with two eleven foot lanes to the north, one in each direction. The planning team suggests
the roadway to be lined with turf that has street lighting within it, just eighteen inches behind back of
curb. Five foot sidewalks shall be provided on both side of the street. See Figure 8.6 for proposed
conditions along 62nd Terrace. This corridor is a good candidate for integrated bicycle lanes or an
adjacent off-street trail improvement. As a future effort, the City plans to identify a network of street
corridors that will improve bicycle and pedestrian connectivity, and additional coordination will be
needed to ensure these improvements are integrated appropriately.
FIGURE 8.1: LOCATION MAP
STREETSCAPE IMPROVEMENTS
• One (1) benches per block
• One (1) trash receptacle per block
• Two (2) bike racks (6 spots) per block
• Street light: Traditional
ROW 60.0’ROW 60.0’
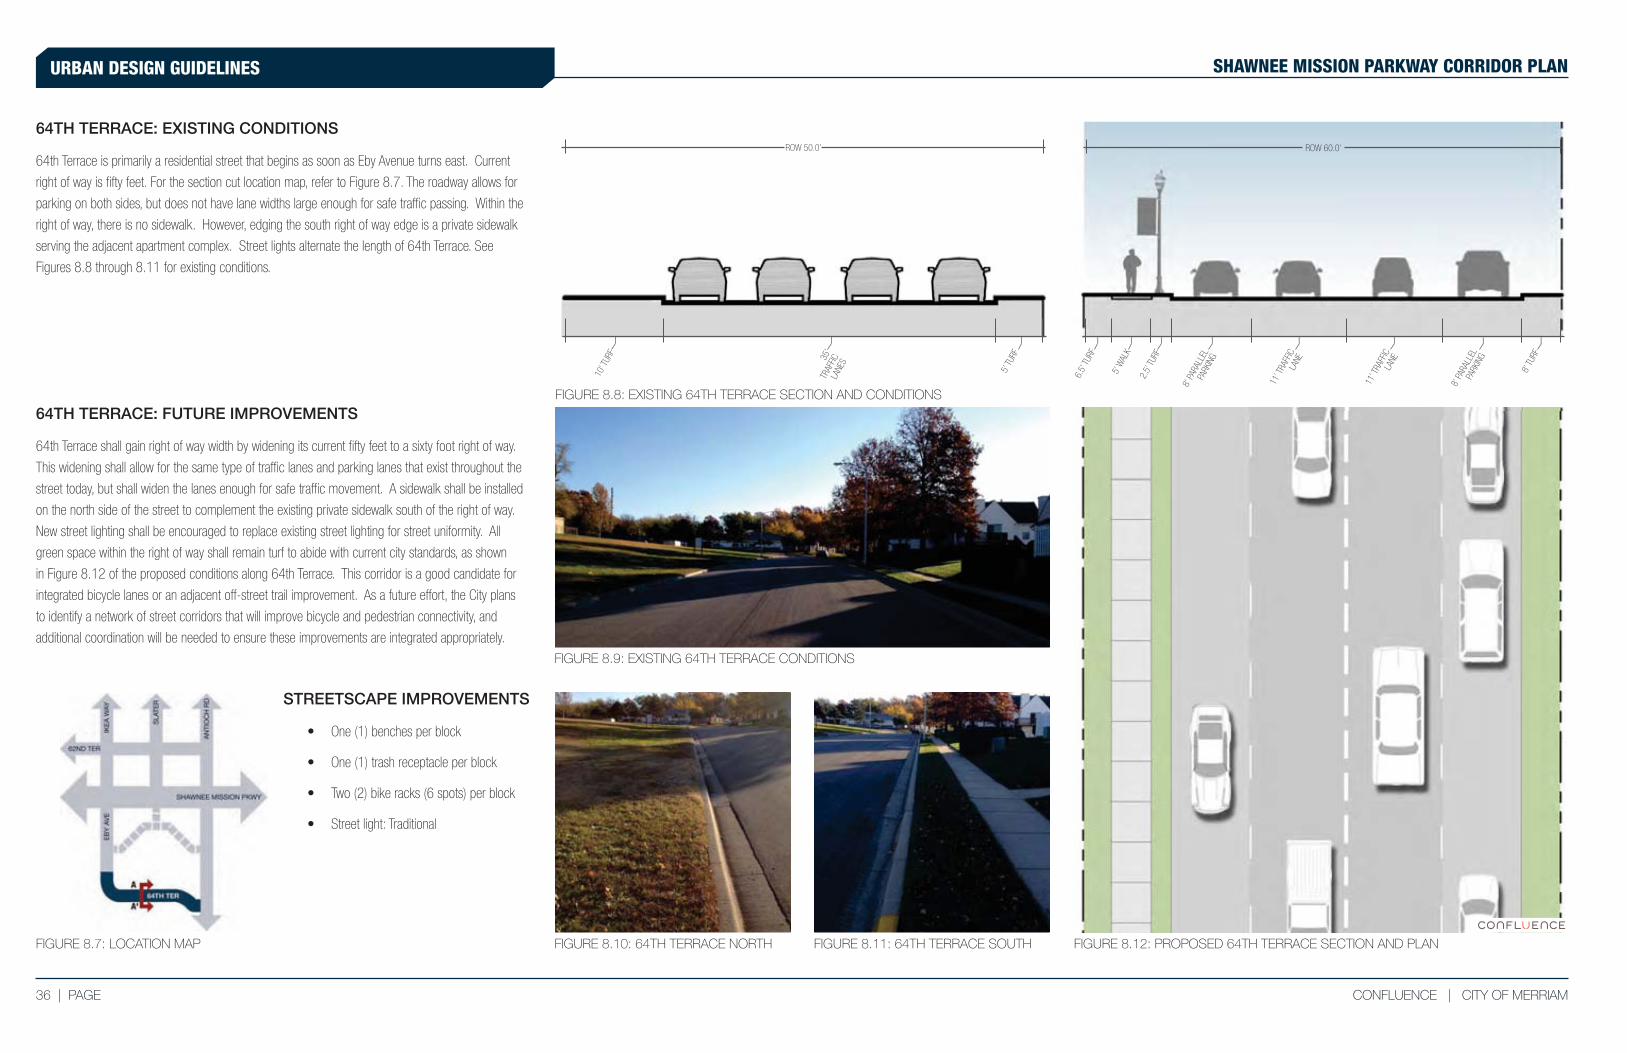
36 | PAGE CONFLUENCE | CITY OF MERRIAM
URBAN DESIGN GUIDELINES SHAWNEE MISSION PARKWAY CORRIDOR PLAN
10’ T
URF
35’
TRAF
FIC
LANE
S
5’ T
URF
FIGURE 8.9: EXISTING 64TH TERRACE CONDITIONS
FIGURE 8.10: 64TH TERRACE NORTH FIGURE 8.11: 64TH TERRACE SOUTH
2.5’
TUR
F
5’ W
ALK
6.5’
TUR
F
8’ P
ARAL
LEL
PARK
ING
8’ T
URF
11’ T
RAFF
IC
LANE
11’ T
RAFF
IC
LANE
8’ P
ARAL
LEL
PARK
ING
FIGURE 8.8: EXISTING 64TH TERRACE SECTION AND CONDITIONS
FIGURE 8.12: PROPOSED 64TH TERRACE SECTION AND PLAN
64TH TERRACE: EXISTING CONDITIONS
64th Terrace is primarily a residential street that begins as soon as Eby Avenue turns east. Current
right of way is fifty feet. For the section cut location map, refer to Figure 8.7. The roadway allows for
parking on both sides, but does not have lane widths large enough for safe traffic passing. Within the
right of way, there is no sidewalk. However, edging the south right of way edge is a private sidewalk
serving the adjacent apartment complex. Street lights alternate the length of 64th Terrace. See
Figures 8.8 through 8.11 for existing conditions.
FIGURE 8.7: LOCATION MAP
64TH TERRACE: FUTURE IMPROVEMENTS
64th Terrace shall gain right of way width by widening its current fifty feet to a sixty foot right of way.
This widening shall allow for the same type of traffic lanes and parking lanes that exist throughout the
street today, but shall widen the lanes enough for safe traffic movement. A sidewalk shall be installed
on the north side of the street to complement the existing private sidewalk south of the right of way.
New street lighting shall be encouraged to replace existing street lighting for street uniformity. All
green space within the right of way shall remain turf to abide with current city standards, as shown
in Figure 8.12 of the proposed conditions along 64th Terrace. This corridor is a good candidate for
integrated bicycle lanes or an adjacent off-street trail improvement. As a future effort, the City plans
to identify a network of street corridors that will improve bicycle and pedestrian connectivity, and
additional coordination will be needed to ensure these improvements are integrated appropriately.
STREETSCAPE IMPROVEMENTS
• One (1) benches per block
• One (1) trash receptacle per block
• Two (2) bike racks (6 spots) per block
• Street light: Traditional
ROW 60.0’ROW 50.0’
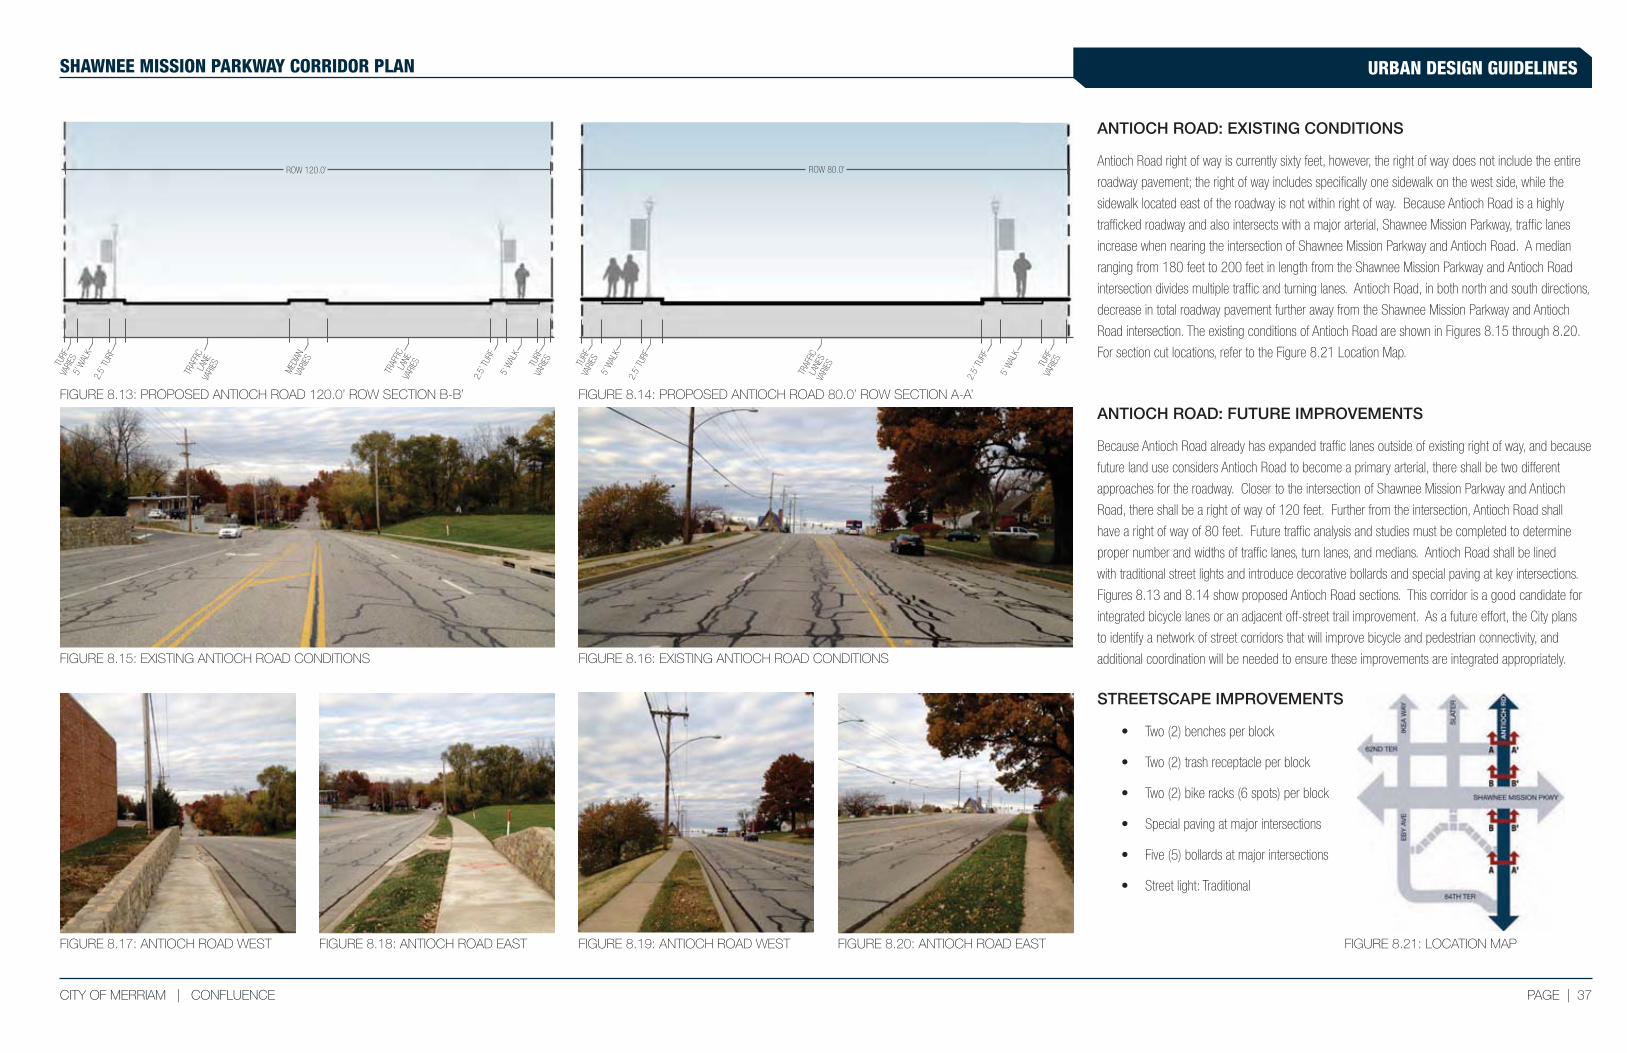
PAGE | 37CITY OF MERRIAM | CONFLUENCE
URBAN DESIGN GUIDELINESSHAWNEE MISSION PARKWAY CORRIDOR PLAN
FIGURE 8.15: EXISTING ANTIOCH ROAD CONDITIONS
FIGURE 8.18: ANTIOCH ROAD EASTFIGURE 8.17: ANTIOCH ROAD WEST
FIGURE 8.16: EXISTING ANTIOCH ROAD CONDITIONS
FIGURE 8.20: ANTIOCH ROAD EASTFIGURE 8.19: ANTIOCH ROAD WEST
2.5’
TUR
F
TURF
VA
RIES
TRAF
FIC
LANE
VARI
ES
2.5’
TUR
F
5’ W
ALK
TURF
VA
RIES
MED
IAN
VARI
ES
2.5’
TUR
F
5’ W
ALK
TURF
VA
RIES
2.5’
TUR
F
5’ W
ALK
TURF
VA
RIES
TRAF
FIC
LANE
S VA
RIES
TRAF
FIC
LANE
VARI
ES
5’ W
ALK
FIGURE 8.14: PROPOSED ANTIOCH ROAD 80.0’ ROW SECTION A-A’FIGURE 8.13: PROPOSED ANTIOCH ROAD 120.0’ ROW SECTION B-B’
ANTIOCH ROAD: EXISTING CONDITIONS
Antioch Road right of way is currently sixty feet, however, the right of way does not include the entire
roadway pavement; the right of way includes specifically one sidewalk on the west side, while the
sidewalk located east of the roadway is not within right of way. Because Antioch Road is a highly
trafficked roadway and also intersects with a major arterial, Shawnee Mission Parkway, traffic lanes
increase when nearing the intersection of Shawnee Mission Parkway and Antioch Road. A median
ranging from 180 feet to 200 feet in length from the Shawnee Mission Parkway and Antioch Road
intersection divides multiple traffic and turning lanes. Antioch Road, in both north and south directions,
decrease in total roadway pavement further away from the Shawnee Mission Parkway and Antioch
Road intersection. The existing conditions of Antioch Road are shown in Figures 8.15 through 8.20.
For section cut locations, refer to the Figure 8.21 Location Map.
FIGURE 8.21: LOCATION MAP
ANTIOCH ROAD: FUTURE IMPROVEMENTS
Because Antioch Road already has expanded traffic lanes outside of existing right of way, and because
future land use considers Antioch Road to become a primary arterial, there shall be two different
approaches for the roadway. Closer to the intersection of Shawnee Mission Parkway and Antioch
Road, there shall be a right of way of 120 feet. Further from the intersection, Antioch Road shall
have a right of way of 80 feet. Future traffic analysis and studies must be completed to determine
proper number and widths of traffic lanes, turn lanes, and medians. Antioch Road shall be lined
with traditional street lights and introduce decorative bollards and special paving at key intersections.
Figures 8.13 and 8.14 show proposed Antioch Road sections. This corridor is a good candidate for
integrated bicycle lanes or an adjacent off-street trail improvement. As a future effort, the City plans
to identify a network of street corridors that will improve bicycle and pedestrian connectivity, and
additional coordination will be needed to ensure these improvements are integrated appropriately.
STREETSCAPE IMPROVEMENTS
• Two (2) benches per block
• Two (2) trash receptacle per block
• Two (2) bike racks (6 spots) per block
• Special paving at major intersections
• Five (5) bollards at major intersections
• Street light: Traditional
ROW 80.0’ROW 120.0’
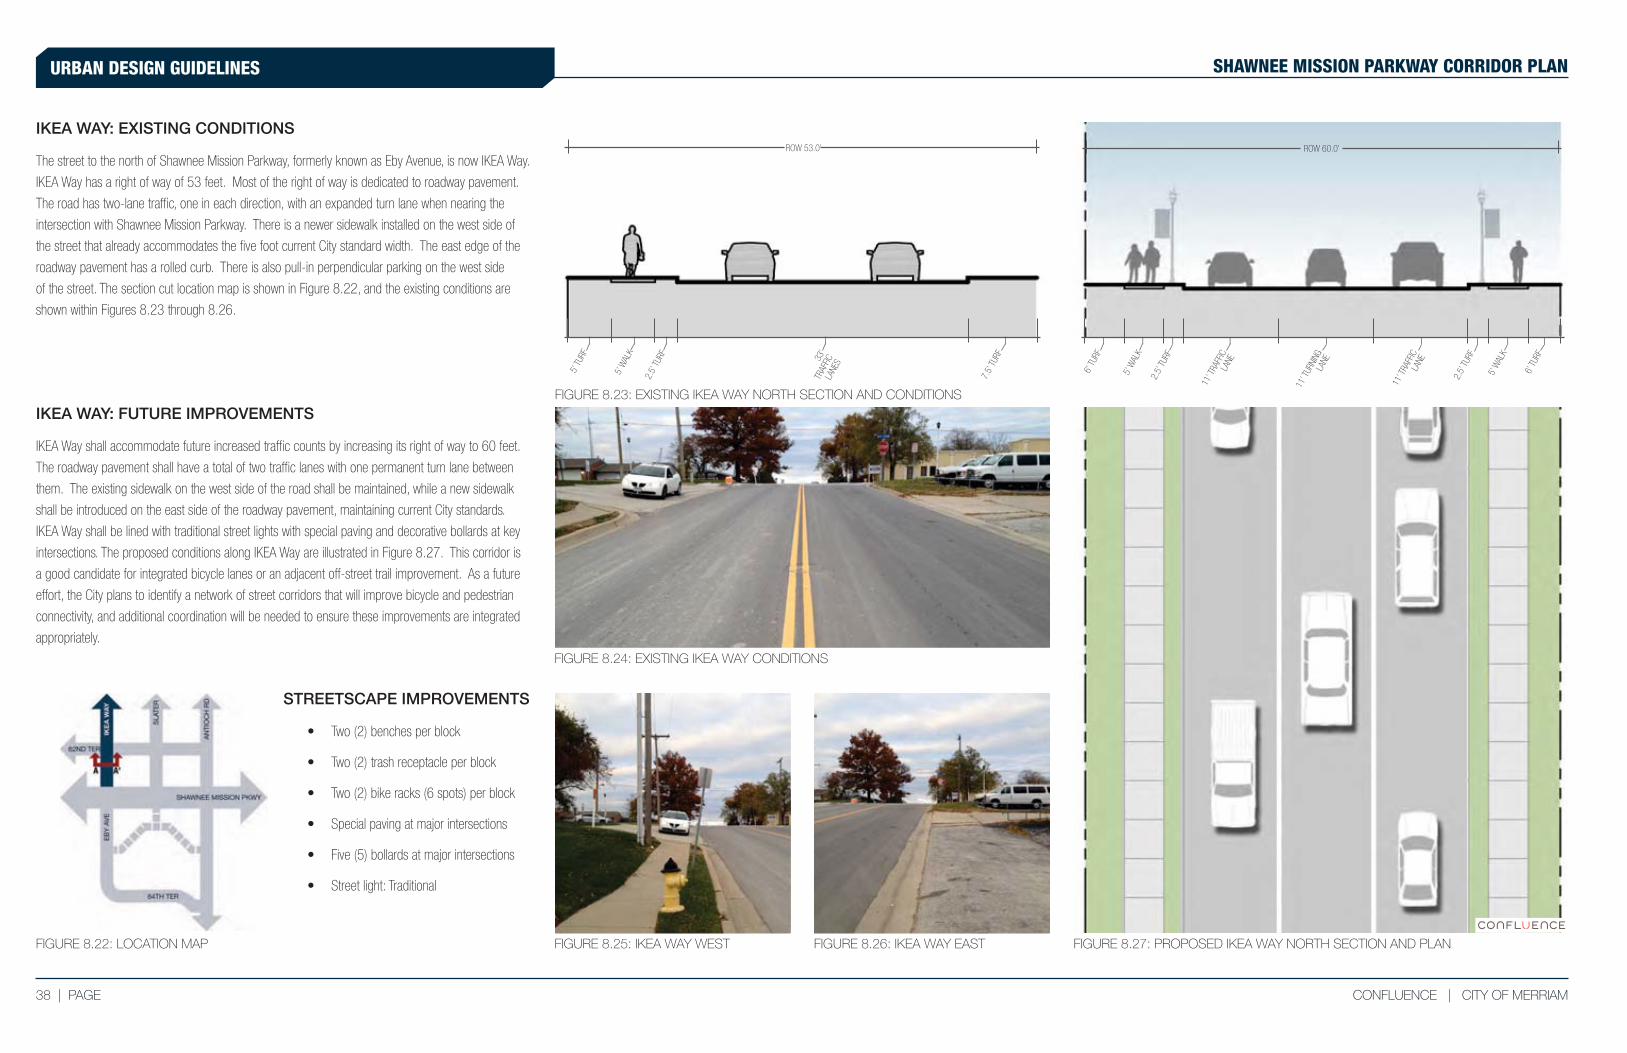
38 | PAGE CONFLUENCE | CITY OF MERRIAM
URBAN DESIGN GUIDELINES SHAWNEE MISSION PARKWAY CORRIDOR PLAN
2.5’
TUR
F
5’ W
ALK
5’ T
URF
33’
TRAF
FIC
LANE
S
7.5’
TUR
F
FIGURE 8.24: EXISTING IKEA WAY CONDITIONS
FIGURE 8.25: IKEA WAY WEST FIGURE 8.26: IKEA WAY EAST
2.5’
TUR
F
5’ W
ALK
6’ T
URF
11’ T
RAFF
IC
LANE
2.5’
TUR
F
5’ W
ALK
6’ T
URF
11’ T
URNI
NG
LANE
11’ T
RAFF
IC
LANE
FIGURE 8.23: EXISTING IKEA WAY NORTH SECTION AND CONDITIONS
FIGURE 8.27: PROPOSED IKEA WAY NORTH SECTION AND PLAN
IKEA WAY: EXISTING CONDITIONS
The street to the north of Shawnee Mission Parkway, formerly known as Eby Avenue, is now IKEA Way.
IKEA Way has a right of way of 53 feet. Most of the right of way is dedicated to roadway pavement.
The road has two-lane traffic, one in each direction, with an expanded turn lane when nearing the
intersection with Shawnee Mission Parkway. There is a newer sidewalk installed on the west side of
the street that already accommodates the five foot current City standard width. The east edge of the
roadway pavement has a rolled curb. There is also pull-in perpendicular parking on the west side
of the street. The section cut location map is shown in Figure 8.22, and the existing conditions are
shown within Figures 8.23 through 8.26.
IKEA WAY: FUTURE IMPROVEMENTS
IKEA Way shall accommodate future increased traffic counts by increasing its right of way to 60 feet.
The roadway pavement shall have a total of two traffic lanes with one permanent turn lane between
them. The existing sidewalk on the west side of the road shall be maintained, while a new sidewalk
shall be introduced on the east side of the roadway pavement, maintaining current City standards.
IKEA Way shall be lined with traditional street lights with special paving and decorative bollards at key
intersections. The proposed conditions along IKEA Way are illustrated in Figure 8.27. This corridor is
a good candidate for integrated bicycle lanes or an adjacent off-street trail improvement. As a future
effort, the City plans to identify a network of street corridors that will improve bicycle and pedestrian
connectivity, and additional coordination will be needed to ensure these improvements are integrated
appropriately.
FIGURE 8.22: LOCATION MAP
STREETSCAPE IMPROVEMENTS
• Two (2) benches per block
• Two (2) trash receptacle per block
• Two (2) bike racks (6 spots) per block
• Special paving at major intersections
• Five (5) bollards at major intersections
• Street light: Traditional
ROW 60.0’ROW 53.0’
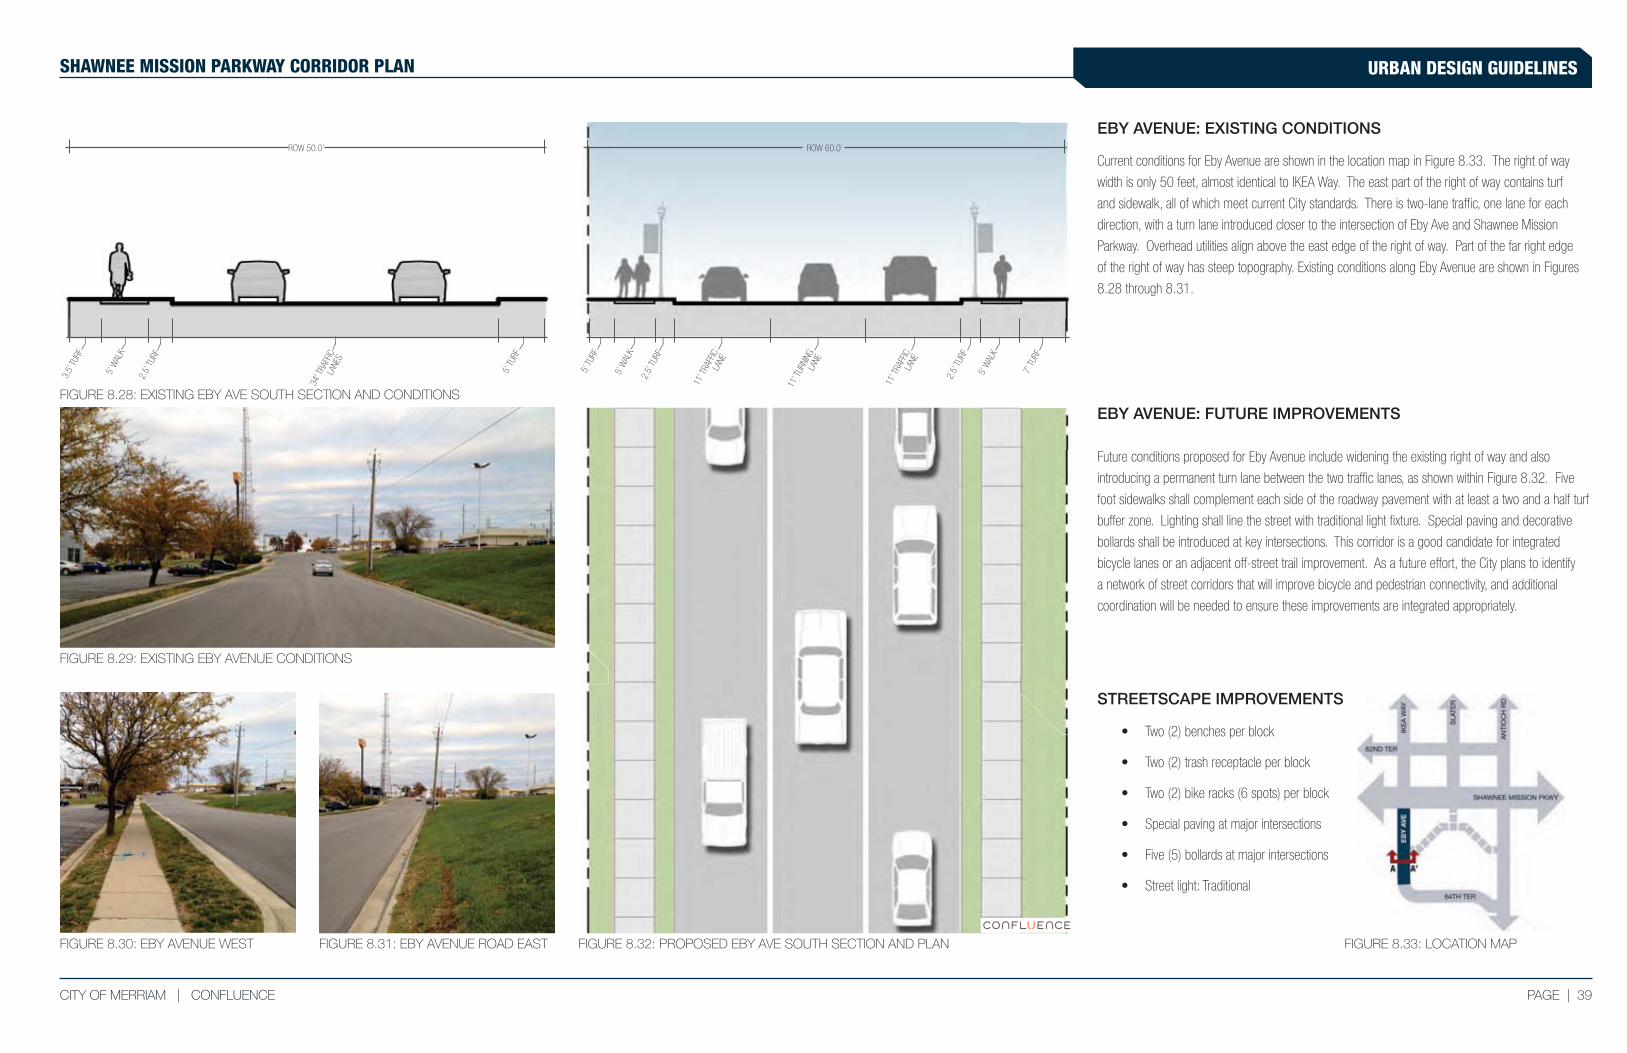
PAGE | 39CITY OF MERRIAM | CONFLUENCE
URBAN DESIGN GUIDELINESSHAWNEE MISSION PARKWAY CORRIDOR PLAN
2.5’
TUR
F
5’ W
ALK
3.5’
TUR
F
34’ T
RAFF
ICLA
NES
5’ T
URF
FIGURE 8.29: EXISTING EBY AVENUE CONDITIONS
FIGURE 8.31: EBY AVENUE ROAD EASTFIGURE 8.30: EBY AVENUE WEST
2.5’
TUR
F
5’ W
ALK
5’ T
URF
11’ T
RAFF
IC
LANE
2.5’
TUR
F
5’ W
ALK
7’ T
URF
11’ T
URNI
NG
LANE
11’ T
RAFF
IC
LANE
EBY AVENUE: EXISTING CONDITIONS
Current conditions for Eby Avenue are shown in the location map in Figure 8.33. The right of way
width is only 50 feet, almost identical to IKEA Way. The east part of the right of way contains turf
and sidewalk, all of which meet current City standards. There is two-lane traffic, one lane for each
direction, with a turn lane introduced closer to the intersection of Eby Ave and Shawnee Mission
Parkway. Overhead utilities align above the east edge of the right of way. Part of the far right edge
of the right of way has steep topography. Existing conditions along Eby Avenue are shown in Figures
8.28 through 8.31.
EBY AVENUE: FUTURE IMPROVEMENTS
Future conditions proposed for Eby Avenue include widening the existing right of way and also
introducing a permanent turn lane between the two traffic lanes, as shown within Figure 8.32. Five
foot sidewalks shall complement each side of the roadway pavement with at least a two and a half turf
buffer zone. Lighting shall line the street with traditional light fixture. Special paving and decorative
bollards shall be introduced at key intersections. This corridor is a good candidate for integrated
bicycle lanes or an adjacent off-street trail improvement. As a future effort, the City plans to identify
a network of street corridors that will improve bicycle and pedestrian connectivity, and additional
coordination will be needed to ensure these improvements are integrated appropriately.
FIGURE 8.28: EXISTING EBY AVE SOUTH SECTION AND CONDITIONS
FIGURE 8.32: PROPOSED EBY AVE SOUTH SECTION AND PLAN FIGURE 8.33: LOCATION MAP
STREETSCAPE IMPROVEMENTS
• Two (2) benches per block
• Two (2) trash receptacle per block
• Two (2) bike racks (6 spots) per block
• Special paving at major intersections
• Five (5) bollards at major intersections
• Street light: Traditional
ROW 60.0’ROW 50.0’
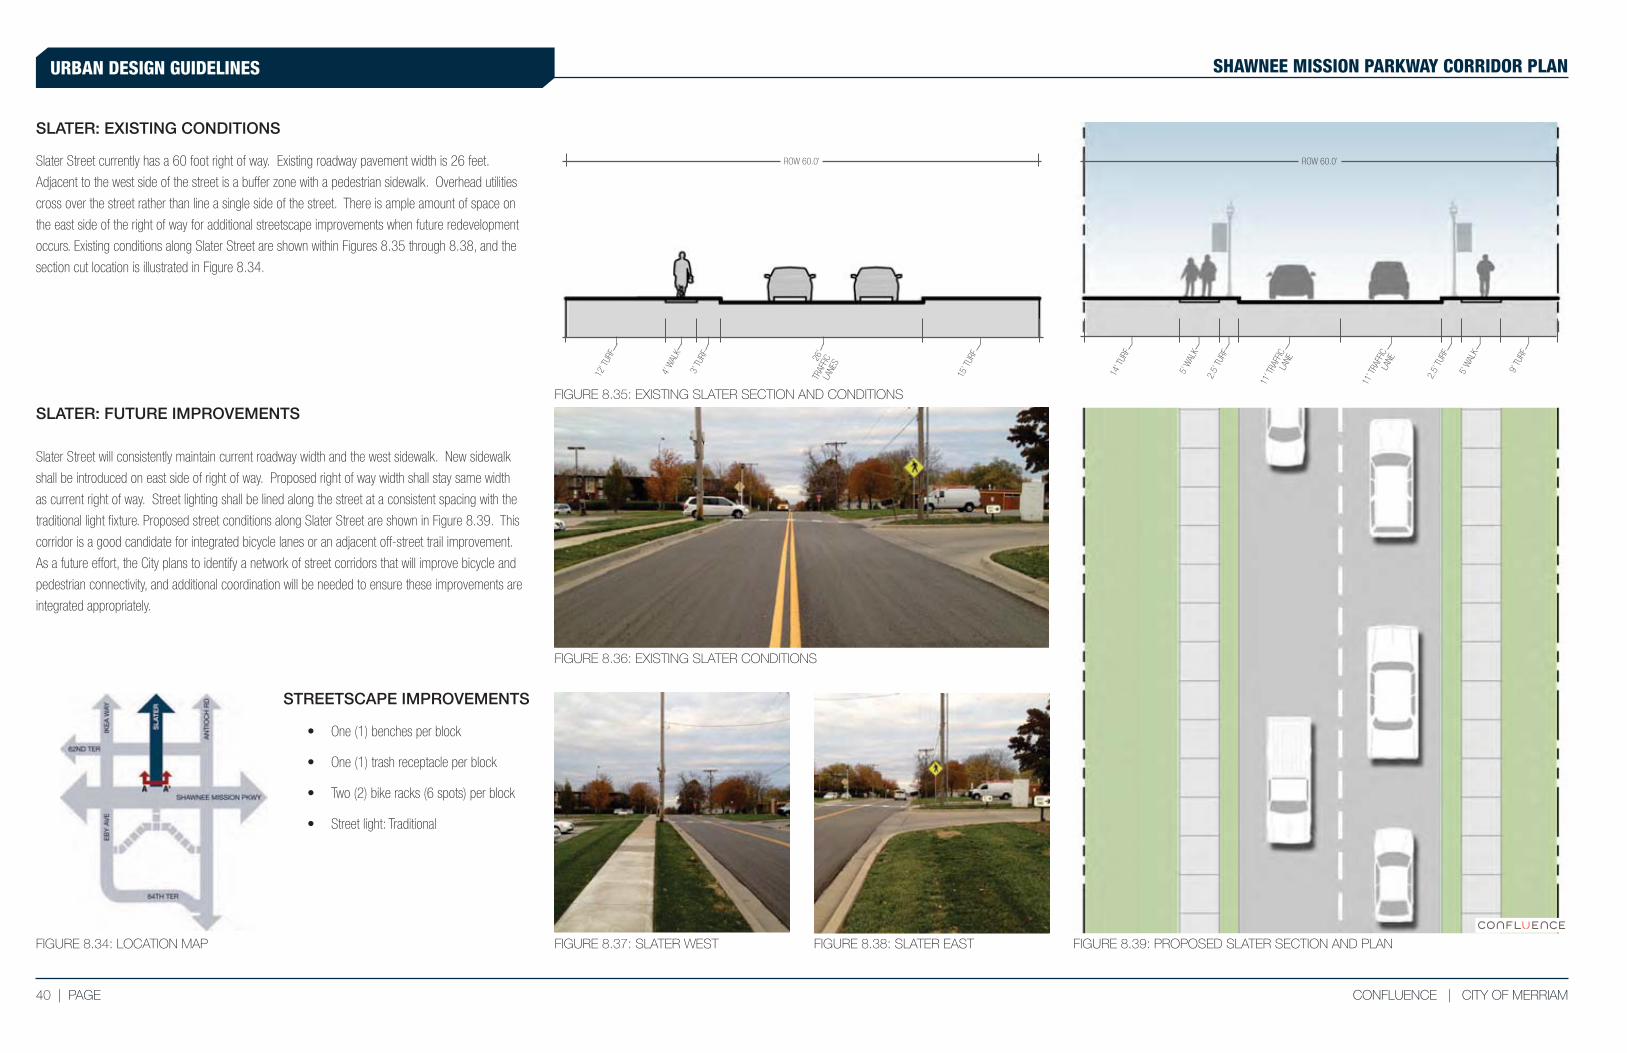
40 | PAGE CONFLUENCE | CITY OF MERRIAM
URBAN DESIGN GUIDELINES SHAWNEE MISSION PARKWAY CORRIDOR PLAN
3’ T
URF
4’ W
ALK
12’ T
URF
26’
TRA
FFIC
LA
NES
15’ T
URF
FIGURE 8.36: EXISTING SLATER CONDITIONS
FIGURE 8.37: SLATER WEST FIGURE 8.38: SLATER EAST
2.5’
TUR
F
5’ W
ALK
14’ T
URF
2.5’
TUR
F
5’ W
ALK
9’ T
URF
11’ T
RAFF
IC
LANE
11’ T
RAFF
IC
LANE
FIGURE 8.35: EXISTING SLATER SECTION AND CONDITIONS
FIGURE 8.39: PROPOSED SLATER SECTION AND PLAN
SLATER: EXISTING CONDITIONS
Slater Street currently has a 60 foot right of way. Existing roadway pavement width is 26 feet.
Adjacent to the west side of the street is a buffer zone with a pedestrian sidewalk. Overhead utilities
cross over the street rather than line a single side of the street. There is ample amount of space on
the east side of the right of way for additional streetscape improvements when future redevelopment
occurs. Existing conditions along Slater Street are shown within Figures 8.35 through 8.38, and the
section cut location is illustrated in Figure 8.34.
SLATER: FUTURE IMPROVEMENTS
Slater Street will consistently maintain current roadway width and the west sidewalk. New sidewalk
shall be introduced on east side of right of way. Proposed right of way width shall stay same width
as current right of way. Street lighting shall be lined along the street at a consistent spacing with the
traditional light fixture. Proposed street conditions along Slater Street are shown in Figure 8.39. This
corridor is a good candidate for integrated bicycle lanes or an adjacent off-street trail improvement.
As a future effort, the City plans to identify a network of street corridors that will improve bicycle and
pedestrian connectivity, and additional coordination will be needed to ensure these improvements are
integrated appropriately.
FIGURE 8.34: LOCATION MAP
STREETSCAPE IMPROVEMENTS
• One (1) benches per block
• One (1) trash receptacle per block
• Two (2) bike racks (6 spots) per block
• Street light: Traditional
ROW 60.0’ROW 60.0’
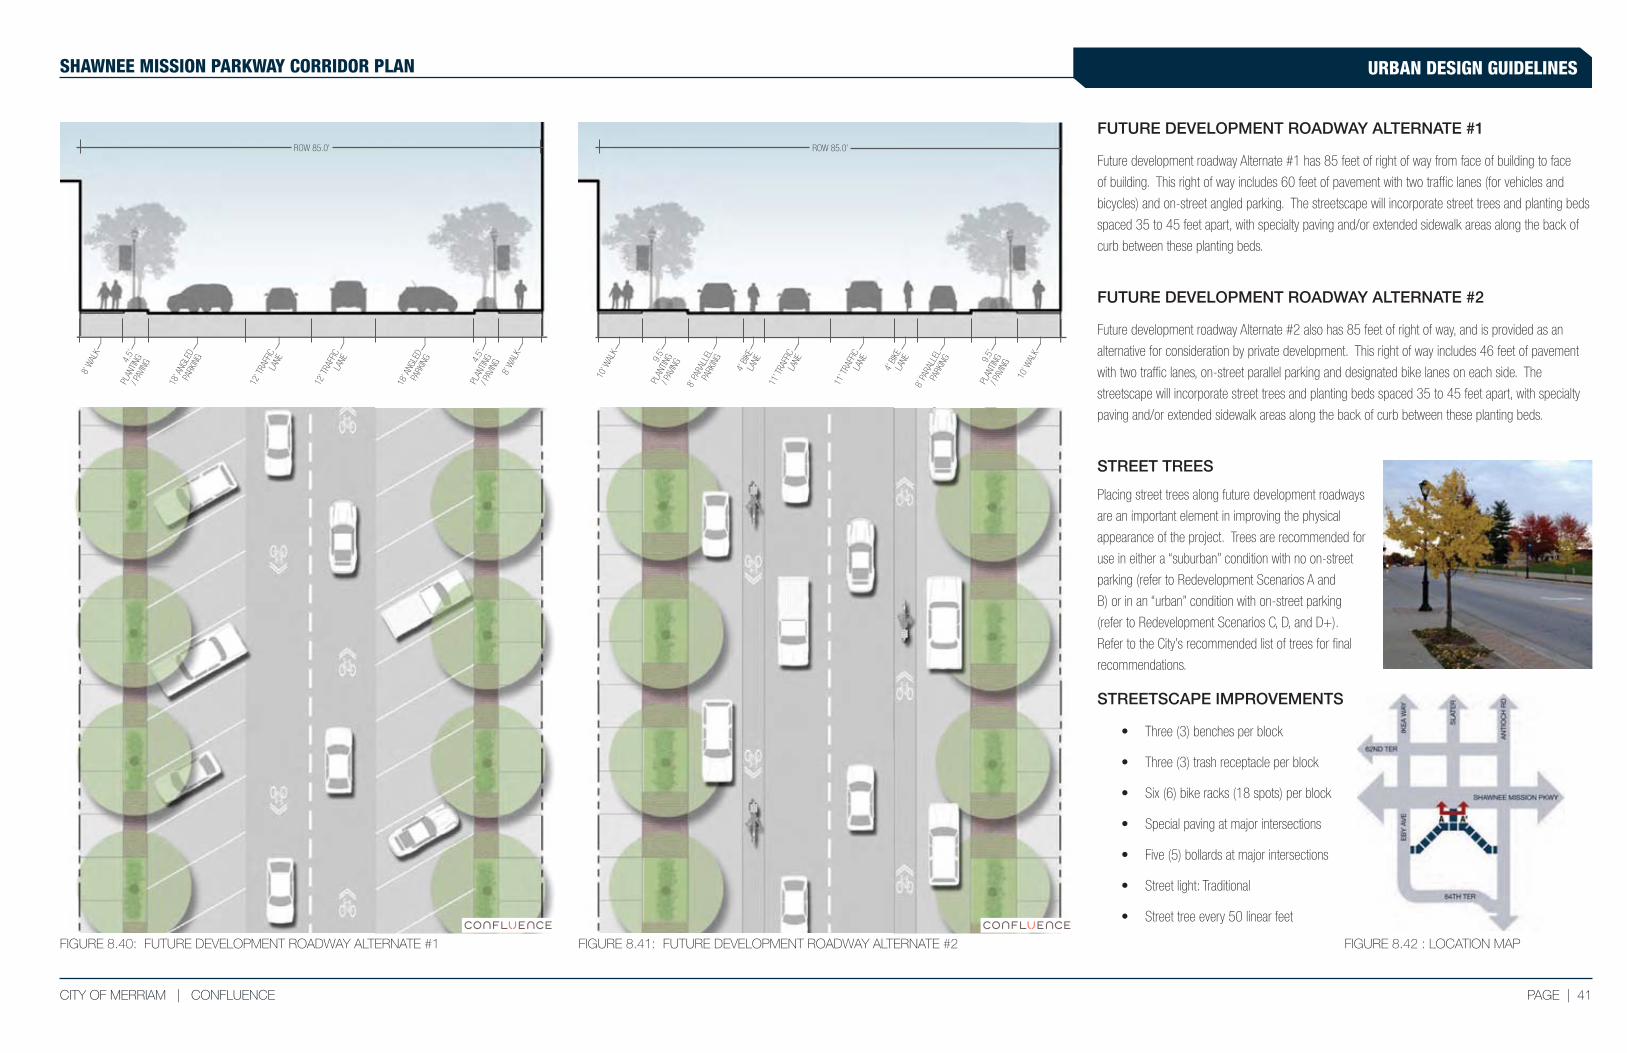
PAGE | 41CITY OF MERRIAM | CONFLUENCE
URBAN DESIGN GUIDELINESSHAWNEE MISSION PARKWAY CORRIDOR PLAN
4.5’
PL
ANTI
NG/ P
AVIN
G
8’ W
ALK
18’ A
NGLE
D PA
RKIN
G
18’ A
NGLE
D PA
RKIN
G 4.5’
PL
ANTI
NG/ P
AVIN
G8’
WAL
K
12’ T
RAFF
IC
LANE
12’ T
RAFF
IC
LANE
4’ B
IKE
LANE9.
5’
PLAN
TING
/ P
AVIN
G
10’ W
ALK
8’ P
ARAL
LEL
PARK
ING
8’ P
ARAL
LEL
PARK
ING 9.5’
PL
ANTI
NG
/ PAV
ING
10’ W
ALK
11’ T
RAFF
IC
LANE
4’ B
IKE
LANE
11’ T
RAFF
IC
LANE
FIGURE 8.40: FUTURE DEVELOPMENT ROADWAY ALTERNATE #1 FIGURE 8.41: FUTURE DEVELOPMENT ROADWAY ALTERNATE #2
FUTURE DEVELOPMENT ROADWAY ALTERNATE #1
Future development roadway Alternate #1 has 85 feet of right of way from face of building to face
of building. This right of way includes 60 feet of pavement with two traffic lanes (for vehicles and
bicycles) and on-street angled parking. The streetscape will incorporate street trees and planting beds
spaced 35 to 45 feet apart, with specialty paving and/or extended sidewalk areas along the back of
curb between these planting beds.
FUTURE DEVELOPMENT ROADWAY ALTERNATE #2
Future development roadway Alternate #2 also has 85 feet of right of way, and is provided as an
alternative for consideration by private development. This right of way includes 46 feet of pavement
with two traffic lanes, on-street parallel parking and designated bike lanes on each side. The
streetscape will incorporate street trees and planting beds spaced 35 to 45 feet apart, with specialty
paving and/or extended sidewalk areas along the back of curb between these planting beds.
FIGURE 8.42 : LOCATION MAP
STREETSCAPE IMPROVEMENTS
• Three (3) benches per block
• Three (3) trash receptacle per block
• Six (6) bike racks (18 spots) per block
• Special paving at major intersections
• Five (5) bollards at major intersections
• Street light: Traditional
• Street tree every 50 linear feet
STREET TREES
Placing street trees along future development roadways
are an important element in improving the physical
appearance of the project. Trees are recommended for
use in either a “suburban” condition with no on-street
parking (refer to Redevelopment Scenarios A and
B) or in an “urban” condition with on-street parking
(refer to Redevelopment Scenarios C, D, and D+).
Refer to the City’s recommended list of trees for final
recommendations.
ROW 85.0’ ROW 85.0’
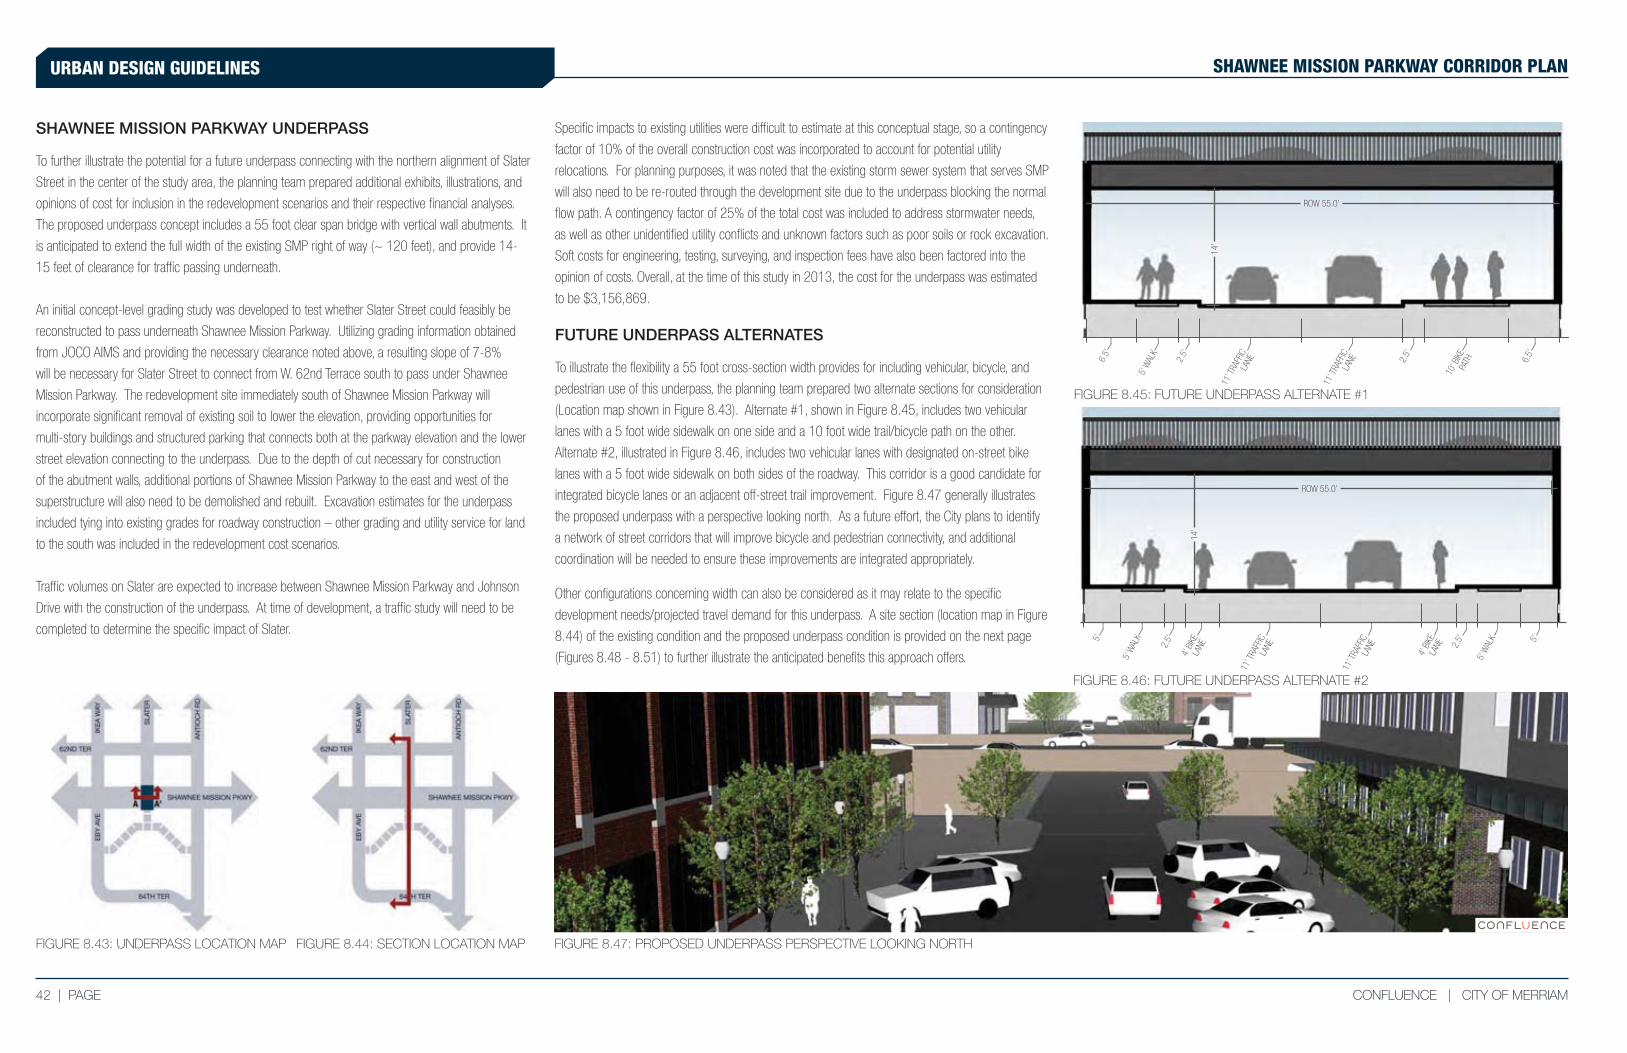
42 | PAGE CONFLUENCE | CITY OF MERRIAM
URBAN DESIGN GUIDELINES SHAWNEE MISSION PARKWAY CORRIDOR PLAN
5’ W
ALK
6.5’
2.5’
2.5’
10’ B
IKE
PATH 6.
5’
11’ T
RAFF
IC
LANE
11’ T
RAFF
IC
LANE
2.5’
5’ W
ALK5’
4’ B
IKE
LANE 2.
5’
5’ W
ALK 5’
11’ T
RAFF
IC
LANE
11’ T
RAFF
IC
LANE
4’ B
IKE
LANE
FIGURE 8.45: FUTURE UNDERPASS ALTERNATE #1
SHAWNEE MISSION PARKWAY UNDERPASS
To further illustrate the potential for a future underpass connecting with the northern alignment of Slater
Street in the center of the study area, the planning team prepared additional exhibits, illustrations, and
opinions of cost for inclusion in the redevelopment scenarios and their respective financial analyses.
The proposed underpass concept includes a 55 foot clear span bridge with vertical wall abutments. It
is anticipated to extend the full width of the existing SMP right of way (~ 120 feet), and provide 14-
15 feet of clearance for traffic passing underneath.
An initial concept-level grading study was developed to test whether Slater Street could feasibly be
reconstructed to pass underneath Shawnee Mission Parkway. Utilizing grading information obtained
from JOCO AIMS and providing the necessary clearance noted above, a resulting slope of 7-8%
will be necessary for Slater Street to connect from W. 62nd Terrace south to pass under Shawnee
Mission Parkway. The redevelopment site immediately south of Shawnee Mission Parkway will
incorporate significant removal of existing soil to lower the elevation, providing opportunities for
multi-story buildings and structured parking that connects both at the parkway elevation and the lower
street elevation connecting to the underpass. Due to the depth of cut necessary for construction
of the abutment walls, additional portions of Shawnee Mission Parkway to the east and west of the
superstructure will also need to be demolished and rebuilt. Excavation estimates for the underpass
included tying into existing grades for roadway construction – other grading and utility service for land
to the south was included in the redevelopment cost scenarios.
Traffic volumes on Slater are expected to increase between Shawnee Mission Parkway and Johnson
Drive with the construction of the underpass. At time of development, a traffic study will need to be
completed to determine the specific impact of Slater.
FIGURE 8.43: UNDERPASS LOCATION MAP
FIGURE 8.46: FUTURE UNDERPASS ALTERNATE #2
FIGURE 8.44: SECTION LOCATION MAP FIGURE 8.47: PROPOSED UNDERPASS PERSPECTIVE LOOKING NORTH
Specific impacts to existing utilities were difficult to estimate at this conceptual stage, so a contingency
factor of 10% of the overall construction cost was incorporated to account for potential utility
relocations. For planning purposes, it was noted that the existing storm sewer system that serves SMP
will also need to be re-routed through the development site due to the underpass blocking the normal
flow path. A contingency factor of 25% of the total cost was included to address stormwater needs,
as well as other unidentified utility conflicts and unknown factors such as poor soils or rock excavation.
Soft costs for engineering, testing, surveying, and inspection fees have also been factored into the
opinion of costs. Overall, at the time of this study in 2013, the cost for the underpass was estimated
to be $3,156,869.
FUTURE UNDERPASS ALTERNATES
To illustrate the flexibility a 55 foot cross-section width provides for including vehicular, bicycle, and
pedestrian use of this underpass, the planning team prepared two alternate sections for consideration
(Location map shown in Figure 8.43). Alternate #1, shown in Figure 8.45, includes two vehicular
lanes with a 5 foot wide sidewalk on one side and a 10 foot wide trail/bicycle path on the other.
Alternate #2, illustrated in Figure 8.46, includes two vehicular lanes with designated on-street bike
lanes with a 5 foot wide sidewalk on both sides of the roadway. This corridor is a good candidate for
integrated bicycle lanes or an adjacent off-street trail improvement. Figure 8.47 generally illustrates
the proposed underpass with a perspective looking north. As a future effort, the City plans to identify
a network of street corridors that will improve bicycle and pedestrian connectivity, and additional
coordination will be needed to ensure these improvements are integrated appropriately.
Other configurations concerning width can also be considered as it may relate to the specific
development needs/projected travel demand for this underpass. A site section (location map in Figure
8.44) of the existing condition and the proposed underpass condition is provided on the next page
(Figures 8.48 - 8.51) to further illustrate the anticipated benefits this approach offers.
ROW 55.0’
ROW 55.0’
14’
14’
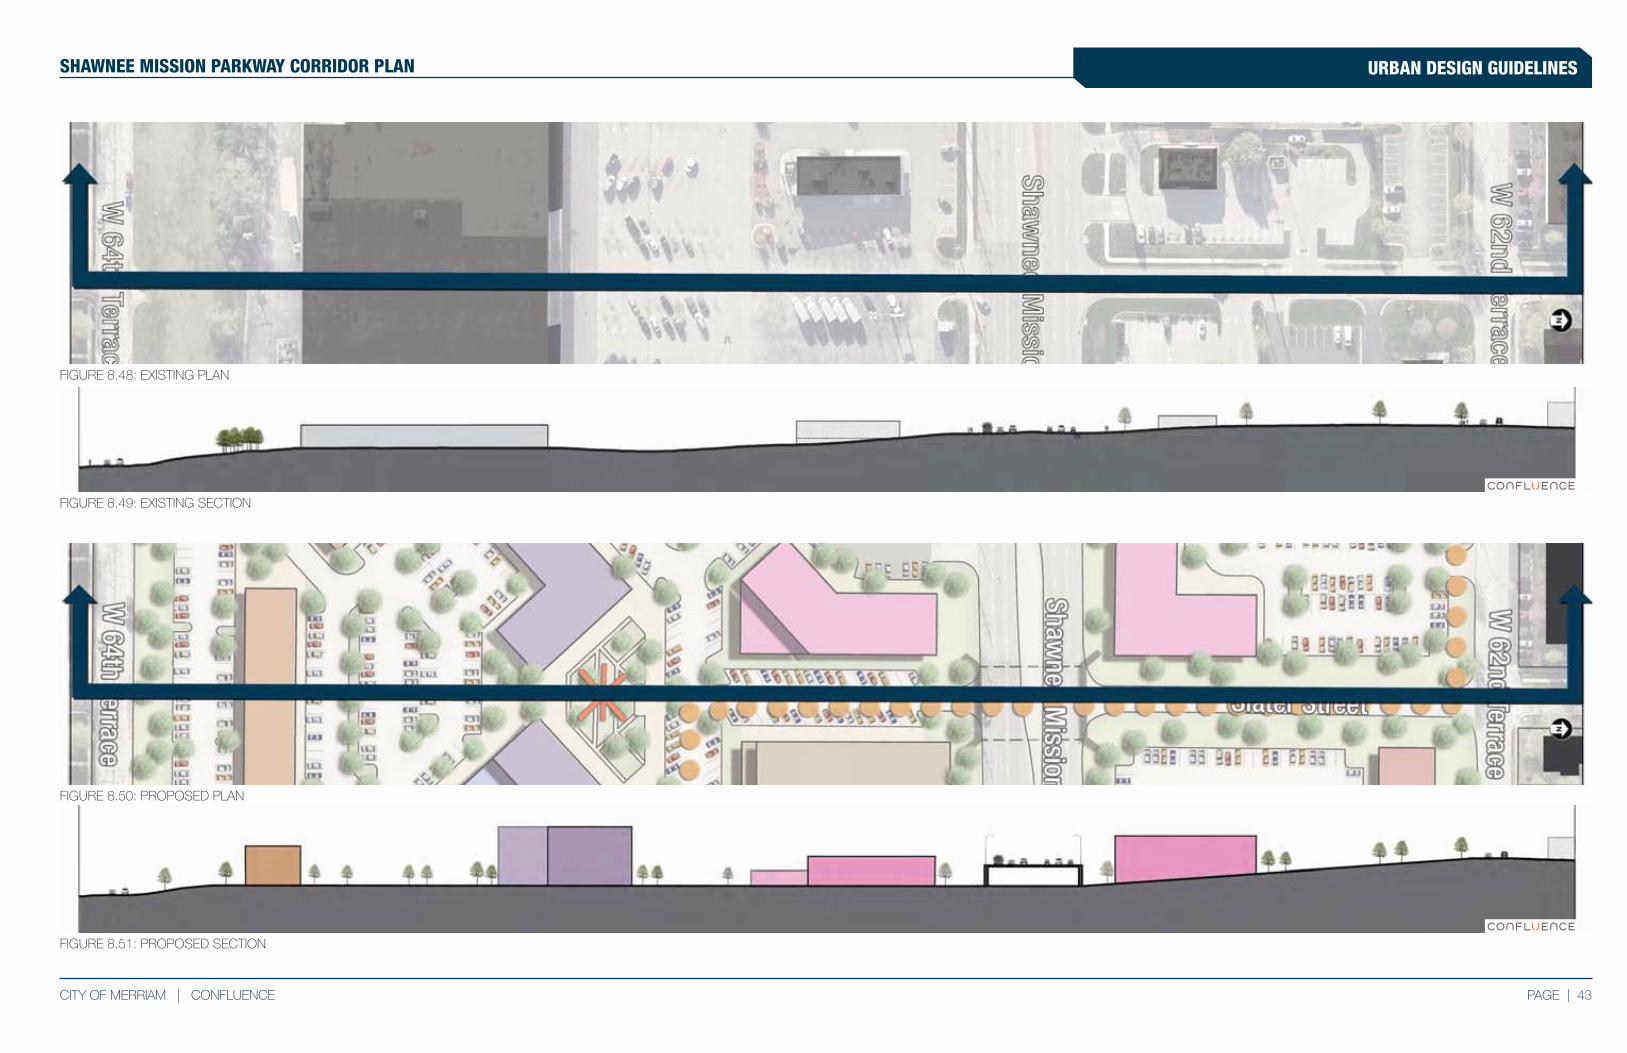
PAGE | 43CITY OF MERRIAM | CONFLUENCE
URBAN DESIGN GUIDELINESSHAWNEE MISSION PARKWAY CORRIDOR PLAN
FIGURE 8.48: EXISTING PLAN
FIGURE 8.50: PROPOSED PLAN
FIGURE 8.51: PROPOSED SECTION
FIGURE 8.49: EXISTING SECTION
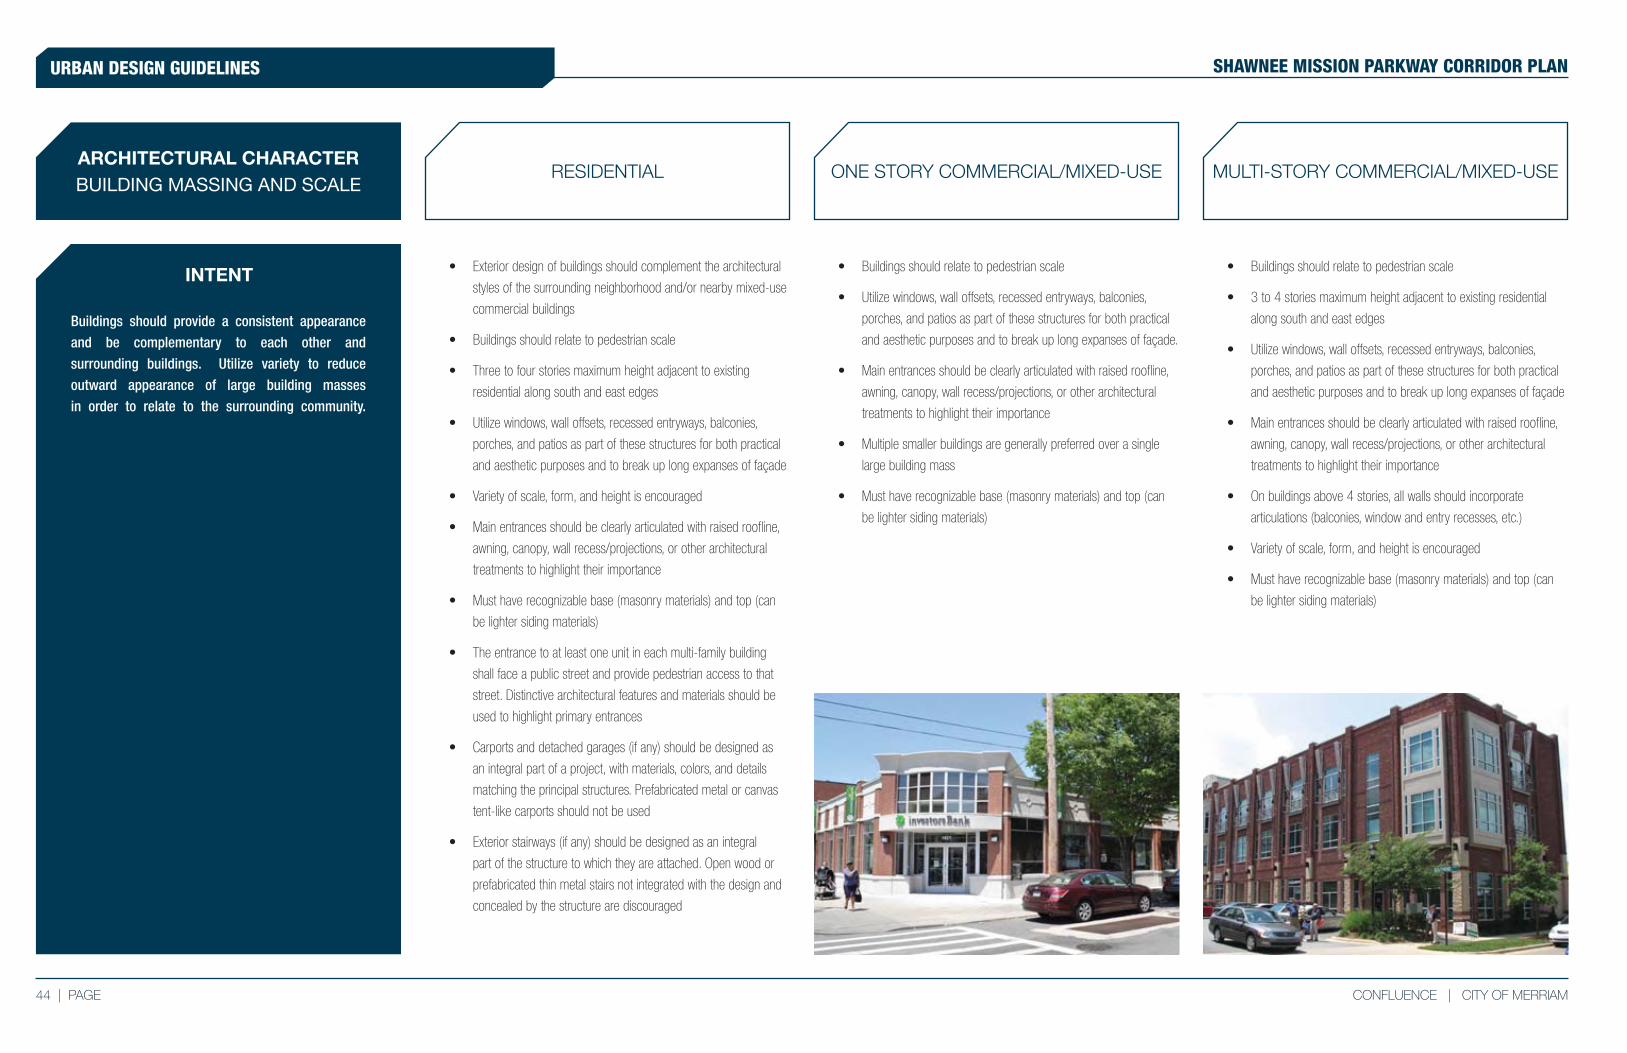
44 | PAGE CONFLUENCE | CITY OF MERRIAM
SHAWNEE MISSION PARKWAY CORRIDOR PLANURBAN DESIGN GUIDELINES
INTENT
ARCHITECTURAL CHARACTERBUILDING MASSING AND SCALE
Buildings should provide a consistent appearance
and be complementary to each other and
surrounding buildings. Utilize variety to reduce
outward appearance of large building masses
in order to relate to the surrounding community.
• Buildings should relate to pedestrian scale
• 3 to 4 stories maximum height adjacent to existing residential
along south and east edges
• Utilize windows, wall offsets, recessed entryways, balconies,
porches, and patios as part of these structures for both practical
and aesthetic purposes and to break up long expanses of façade
• Main entrances should be clearly articulated with raised roofline,
awning, canopy, wall recess/projections, or other architectural
treatments to highlight their importance
• On buildings above 4 stories, all walls should incorporate
articulations (balconies, window and entry recesses, etc.)
• Variety of scale, form, and height is encouraged
• Must have recognizable base (masonry materials) and top (can
be lighter siding materials)
MULTI-STORY COMMERCIAL/MIXED-USEONE STORY COMMERCIAL/MIXED-USERESIDENTIAL
• Buildings should relate to pedestrian scale
• Utilize windows, wall offsets, recessed entryways, balconies,
porches, and patios as part of these structures for both practical
and aesthetic purposes and to break up long expanses of façade.
• Main entrances should be clearly articulated with raised roofline,
awning, canopy, wall recess/projections, or other architectural
treatments to highlight their importance
• Multiple smaller buildings are generally preferred over a single
large building mass
• Must have recognizable base (masonry materials) and top (can
be lighter siding materials)
• Exterior design of buildings should complement the architectural
styles of the surrounding neighborhood and/or nearby mixed-use
commercial buildings
• Buildings should relate to pedestrian scale
• Three to four stories maximum height adjacent to existing
residential along south and east edges
• Utilize windows, wall offsets, recessed entryways, balconies,
porches, and patios as part of these structures for both practical
and aesthetic purposes and to break up long expanses of façade
• Variety of scale, form, and height is encouraged
• Main entrances should be clearly articulated with raised roofline,
awning, canopy, wall recess/projections, or other architectural
treatments to highlight their importance
• Must have recognizable base (masonry materials) and top (can
be lighter siding materials)
• The entrance to at least one unit in each multi-family building
shall face a public street and provide pedestrian access to that
street. Distinctive architectural features and materials should be
used to highlight primary entrances
• Carports and detached garages (if any) should be designed as
an integral part of a project, with materials, colors, and details
matching the principal structures. Prefabricated metal or canvas
tent-like carports should not be used
• Exterior stairways (if any) should be designed as an integral
part of the structure to which they are attached. Open wood or
prefabricated thin metal stairs not integrated with the design and
concealed by the structure are discouraged
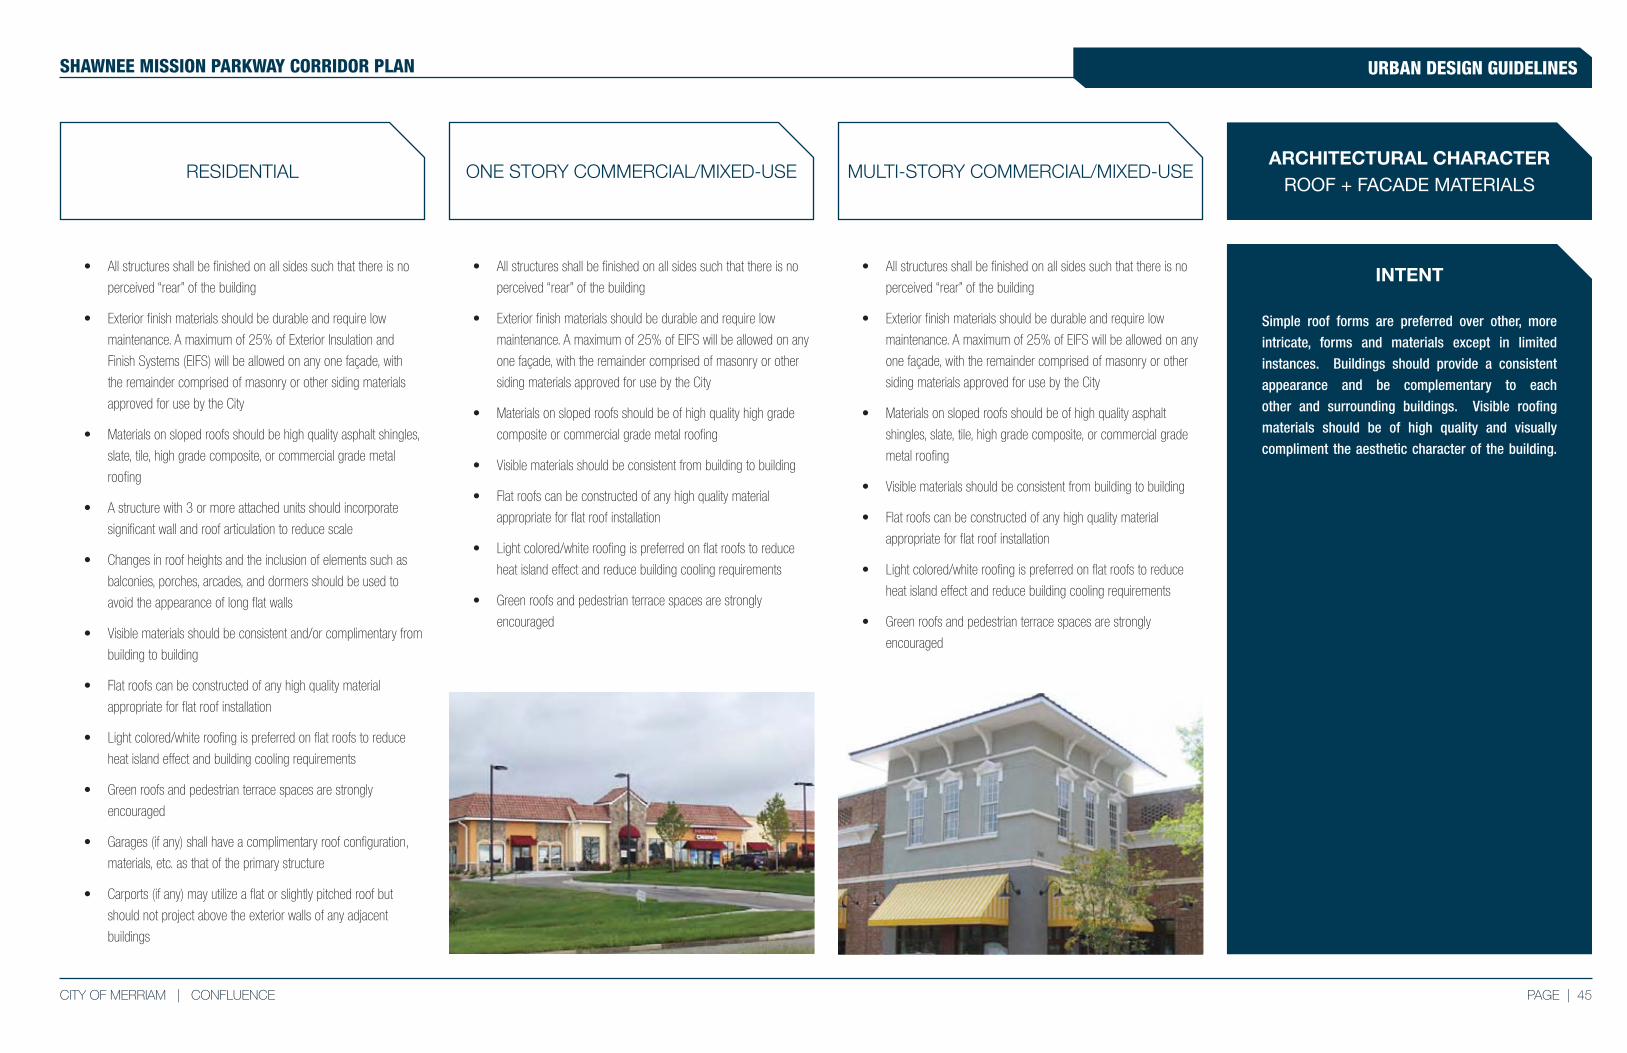
PAGE | 45CITY OF MERRIAM | CONFLUENCE
SHAWNEE MISSION PARKWAY CORRIDOR PLAN URBAN DESIGN GUIDELINES
INTENT
MULTI-STORY COMMERCIAL/MIXED-USEONE STORY COMMERCIAL/MIXED-USERESIDENTIAL
• All structures shall be finished on all sides such that there is no
perceived “rear” of the building
• Exterior finish materials should be durable and require low
maintenance. A maximum of 25% of EIFS will be allowed on any
one façade, with the remainder comprised of masonry or other
siding materials approved for use by the City
• Materials on sloped roofs should be of high quality asphalt
shingles, slate, tile, high grade composite, or commercial grade
metal roofing
• Visible materials should be consistent from building to building
• Flat roofs can be constructed of any high quality material
appropriate for flat roof installation
• Light colored/white roofing is preferred on flat roofs to reduce
heat island effect and reduce building cooling requirements
• Green roofs and pedestrian terrace spaces are strongly
encouraged
• All structures shall be finished on all sides such that there is no
perceived “rear” of the building
• Exterior finish materials should be durable and require low
maintenance. A maximum of 25% of EIFS will be allowed on any
one façade, with the remainder comprised of masonry or other
siding materials approved for use by the City
• Materials on sloped roofs should be of high quality high grade
composite or commercial grade metal roofing
• Visible materials should be consistent from building to building
• Flat roofs can be constructed of any high quality material
appropriate for flat roof installation
• Light colored/white roofing is preferred on flat roofs to reduce
heat island effect and reduce building cooling requirements
• Green roofs and pedestrian terrace spaces are strongly
encouraged
Simple roof forms are preferred over other, more
intricate, forms and materials except in limited
instances. Buildings should provide a consistent
appearance and be complementary to each
other and surrounding buildings. Visible roofing
materials should be of high quality and visually
compliment the aesthetic character of the building.
ARCHITECTURAL CHARACTERROOF + FACADE MATERIALS
• All structures shall be finished on all sides such that there is no
perceived “rear” of the building
• Exterior finish materials should be durable and require low
maintenance. A maximum of 25% of Exterior Insulation and
Finish Systems (EIFS) will be allowed on any one façade, with
the remainder comprised of masonry or other siding materials
approved for use by the City
• Materials on sloped roofs should be high quality asphalt shingles,
slate, tile, high grade composite, or commercial grade metal
roofing
• A structure with 3 or more attached units should incorporate
significant wall and roof articulation to reduce scale
• Changes in roof heights and the inclusion of elements such as
balconies, porches, arcades, and dormers should be used to
avoid the appearance of long flat walls
• Visible materials should be consistent and/or complimentary from
building to building
• Flat roofs can be constructed of any high quality material
appropriate for flat roof installation
• Light colored/white roofing is preferred on flat roofs to reduce
heat island effect and building cooling requirements
• Green roofs and pedestrian terrace spaces are strongly
encouraged
• Garages (if any) shall have a complimentary roof configuration,
materials, etc. as that of the primary structure
• Carports (if any) may utilize a flat or slightly pitched roof but
should not project above the exterior walls of any adjacent
buildings
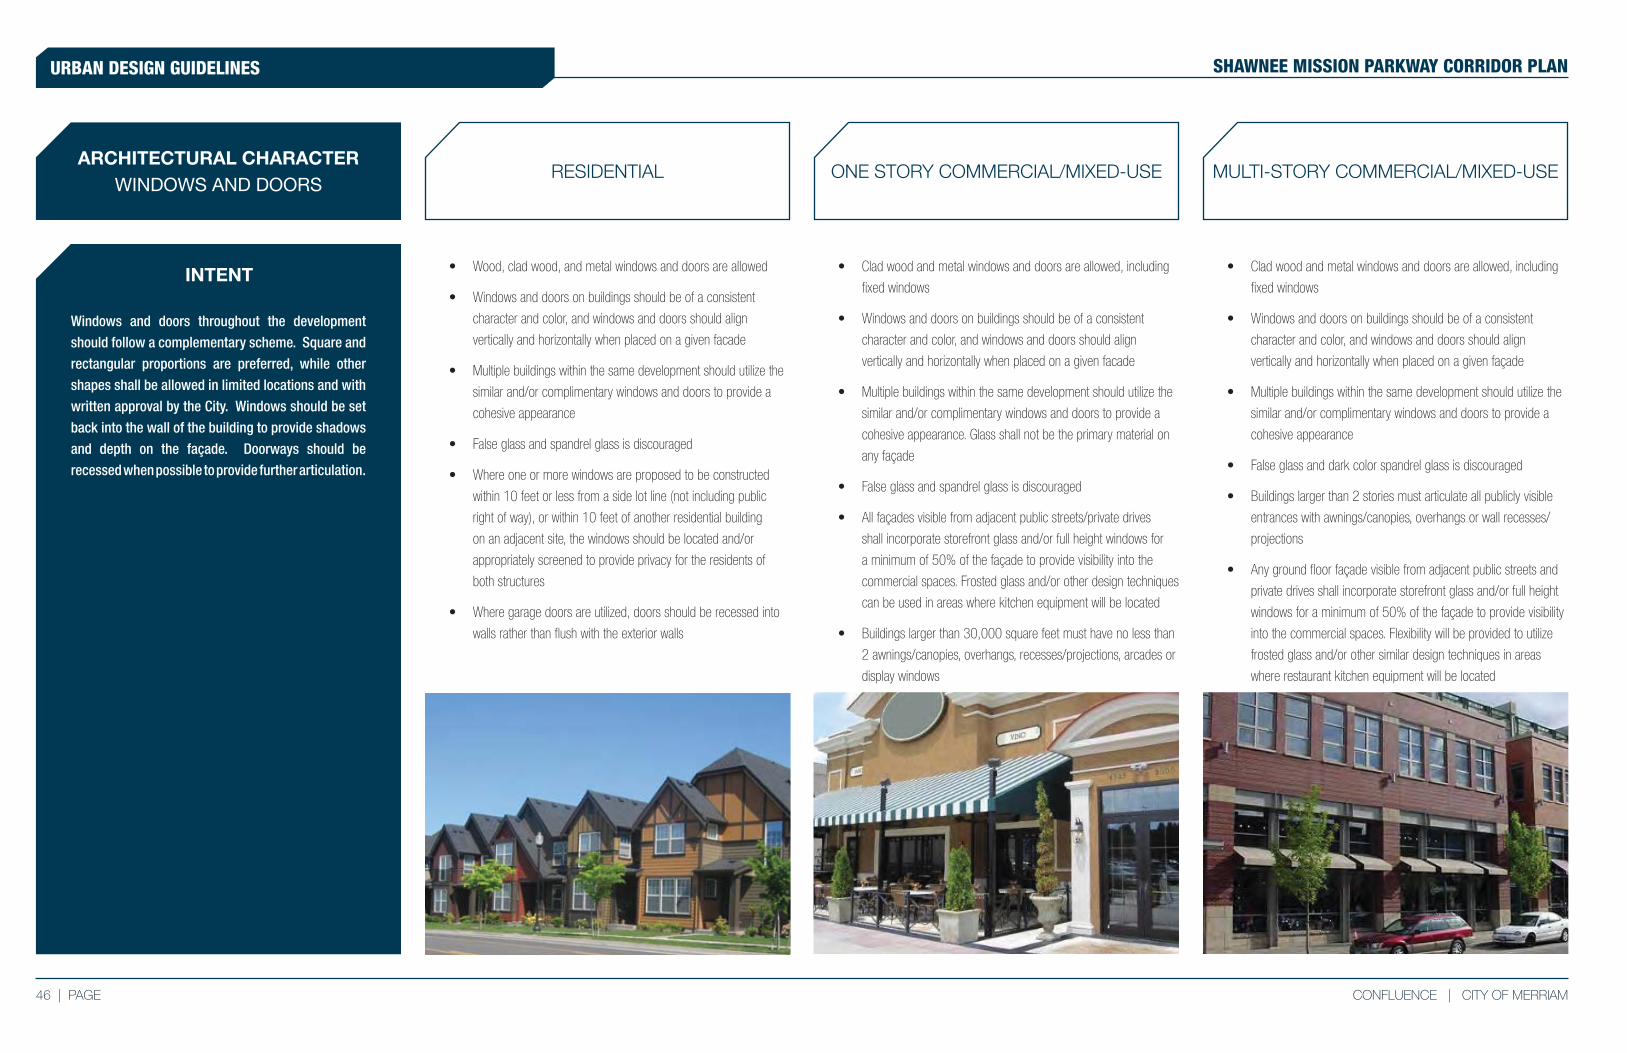
46 | PAGE CONFLUENCE | CITY OF MERRIAM
SHAWNEE MISSION PARKWAY CORRIDOR PLANURBAN DESIGN GUIDELINES
INTENT
RESIDENTIAL
• Wood, clad wood, and metal windows and doors are allowed
• Windows and doors on buildings should be of a consistent
character and color, and windows and doors should align
vertically and horizontally when placed on a given facade
• Multiple buildings within the same development should utilize the
similar and/or complimentary windows and doors to provide a
cohesive appearance
• False glass and spandrel glass is discouraged
• Where one or more windows are proposed to be constructed
within 10 feet or less from a side lot line (not including public
right of way), or within 10 feet of another residential building
on an adjacent site, the windows should be located and/or
appropriately screened to provide privacy for the residents of
both structures
• Where garage doors are utilized, doors should be recessed into
walls rather than flush with the exterior walls
MULTI-STORY COMMERCIAL/MIXED-USEONE STORY COMMERCIAL/MIXED-USEARCHITECTURAL CHARACTER
WINDOWS AND DOORS
Windows and doors throughout the development
should follow a complementary scheme. Square and
rectangular proportions are preferred, while other
shapes shall be allowed in limited locations and with
written approval by the City. Windows should be set
back into the wall of the building to provide shadows
and depth on the façade. Doorways should be
recessed when possible to provide further articulation.
• Clad wood and metal windows and doors are allowed, including
fixed windows
• Windows and doors on buildings should be of a consistent
character and color, and windows and doors should align
vertically and horizontally when placed on a given facade
• Multiple buildings within the same development should utilize the
similar and/or complimentary windows and doors to provide a
cohesive appearance. Glass shall not be the primary material on
any façade
• False glass and spandrel glass is discouraged
• All façades visible from adjacent public streets/private drives
shall incorporate storefront glass and/or full height windows for
a minimum of 50% of the façade to provide visibility into the
commercial spaces. Frosted glass and/or other design techniques
can be used in areas where kitchen equipment will be located
• Buildings larger than 30,000 square feet must have no less than
2 awnings/canopies, overhangs, recesses/projections, arcades or
display windows
• Clad wood and metal windows and doors are allowed, including
fixed windows
• Windows and doors on buildings should be of a consistent
character and color, and windows and doors should align
vertically and horizontally when placed on a given façade
• Multiple buildings within the same development should utilize the
similar and/or complimentary windows and doors to provide a
cohesive appearance
• False glass and dark color spandrel glass is discouraged
• Buildings larger than 2 stories must articulate all publicly visible
entrances with awnings/canopies, overhangs or wall recesses/
projections
• Any ground floor façade visible from adjacent public streets and
private drives shall incorporate storefront glass and/or full height
windows for a minimum of 50% of the façade to provide visibility
into the commercial spaces. Flexibility will be provided to utilize
frosted glass and/or other similar design techniques in areas
where restaurant kitchen equipment will be located
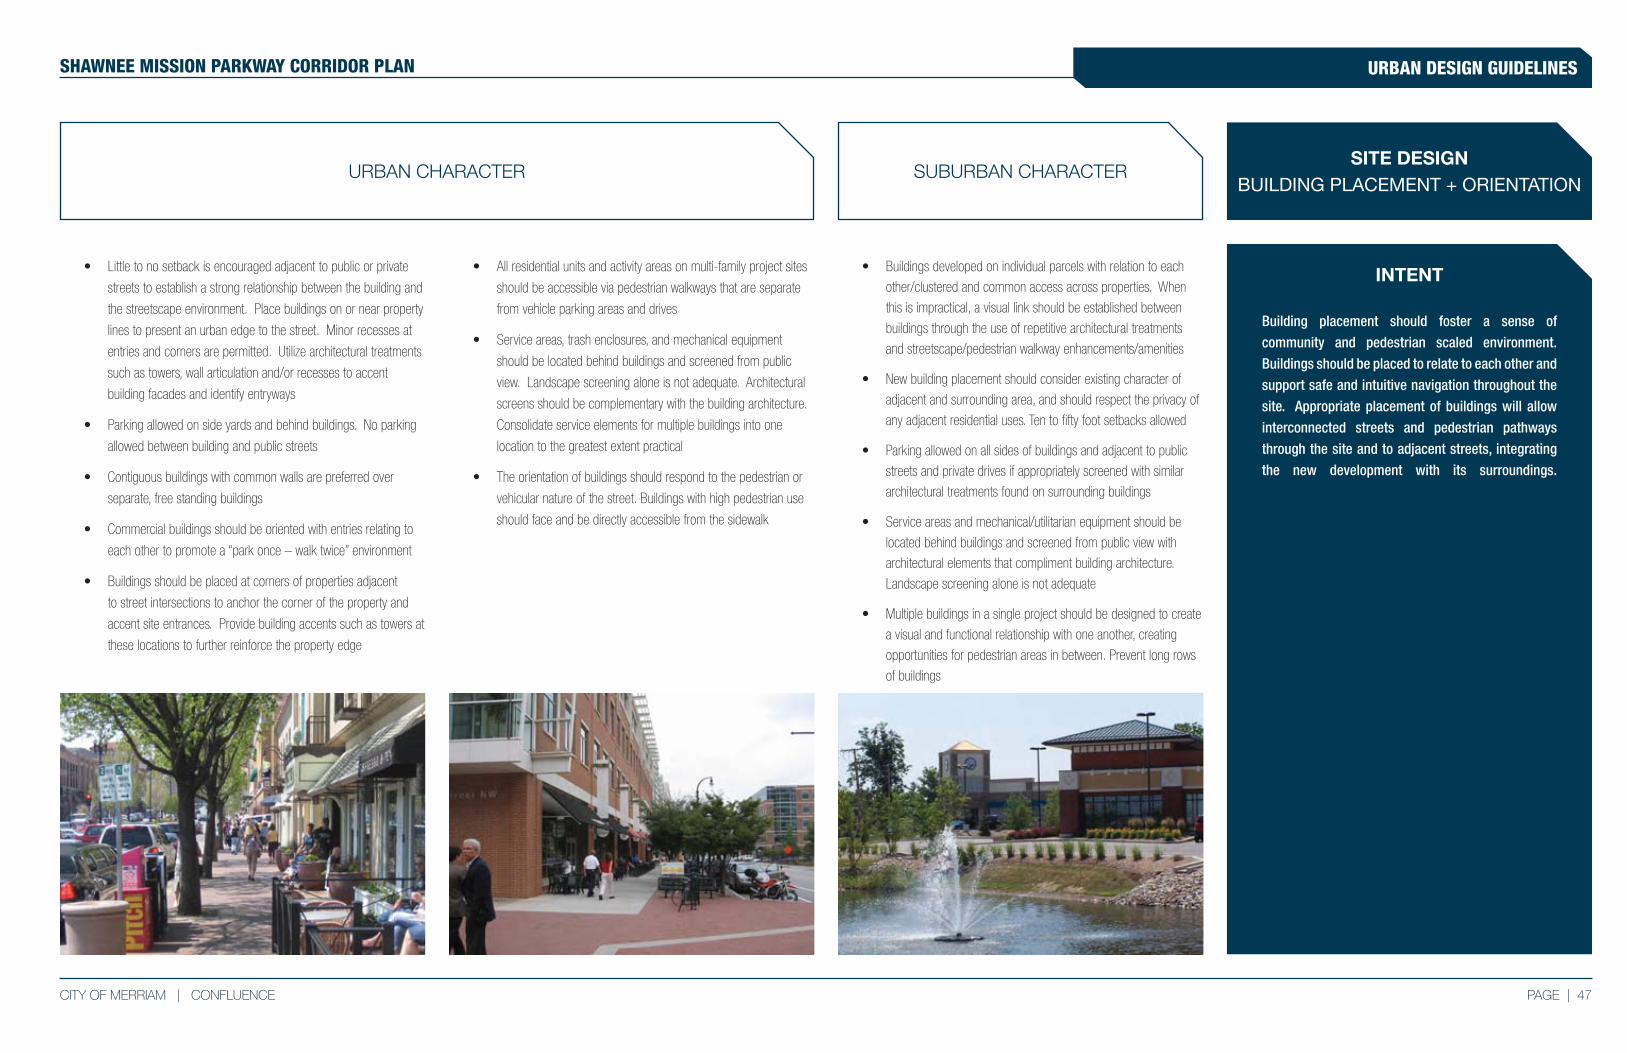
PAGE | 47CITY OF MERRIAM | CONFLUENCE
SHAWNEE MISSION PARKWAY CORRIDOR PLAN URBAN DESIGN GUIDELINES
INTENT
SUBURBAN CHARACTERURBAN CHARACTER
• Little to no setback is encouraged adjacent to public or private
streets to establish a strong relationship between the building and
the streetscape environment. Place buildings on or near property
lines to present an urban edge to the street. Minor recesses at
entries and corners are permitted. Utilize architectural treatments
such as towers, wall articulation and/or recesses to accent
building facades and identify entryways
• Parking allowed on side yards and behind buildings. No parking
allowed between building and public streets
• Contiguous buildings with common walls are preferred over
separate, free standing buildings
• Commercial buildings should be oriented with entries relating to
each other to promote a “park once – walk twice” environment
• Buildings should be placed at corners of properties adjacent
to street intersections to anchor the corner of the property and
accent site entrances. Provide building accents such as towers at
these locations to further reinforce the property edge
SITE DESIGNBUILDING PLACEMENT + ORIENTATION
Building placement should foster a sense of
community and pedestrian scaled environment.
Buildings should be placed to relate to each other and
support safe and intuitive navigation throughout the
site. Appropriate placement of buildings will allow
interconnected streets and pedestrian pathways
through the site and to adjacent streets, integrating
the new development with its surroundings.
• Buildings developed on individual parcels with relation to each
other/clustered and common access across properties. When
this is impractical, a visual link should be established between
buildings through the use of repetitive architectural treatments
and streetscape/pedestrian walkway enhancements/amenities
• New building placement should consider existing character of
adjacent and surrounding area, and should respect the privacy of
any adjacent residential uses. Ten to fifty foot setbacks allowed
• Parking allowed on all sides of buildings and adjacent to public
streets and private drives if appropriately screened with similar
architectural treatments found on surrounding buildings
• Service areas and mechanical/utilitarian equipment should be
located behind buildings and screened from public view with
architectural elements that compliment building architecture.
Landscape screening alone is not adequate
• Multiple buildings in a single project should be designed to create
a visual and functional relationship with one another, creating
opportunities for pedestrian areas in between. Prevent long rows
of buildings
• All residential units and activity areas on multi-family project sites
should be accessible via pedestrian walkways that are separate
from vehicle parking areas and drives
• Service areas, trash enclosures, and mechanical equipment
should be located behind buildings and screened from public
view. Landscape screening alone is not adequate. Architectural
screens should be complementary with the building architecture.
Consolidate service elements for multiple buildings into one
location to the greatest extent practical
• The orientation of buildings should respond to the pedestrian or
vehicular nature of the street. Buildings with high pedestrian use
should face and be directly accessible from the sidewalk
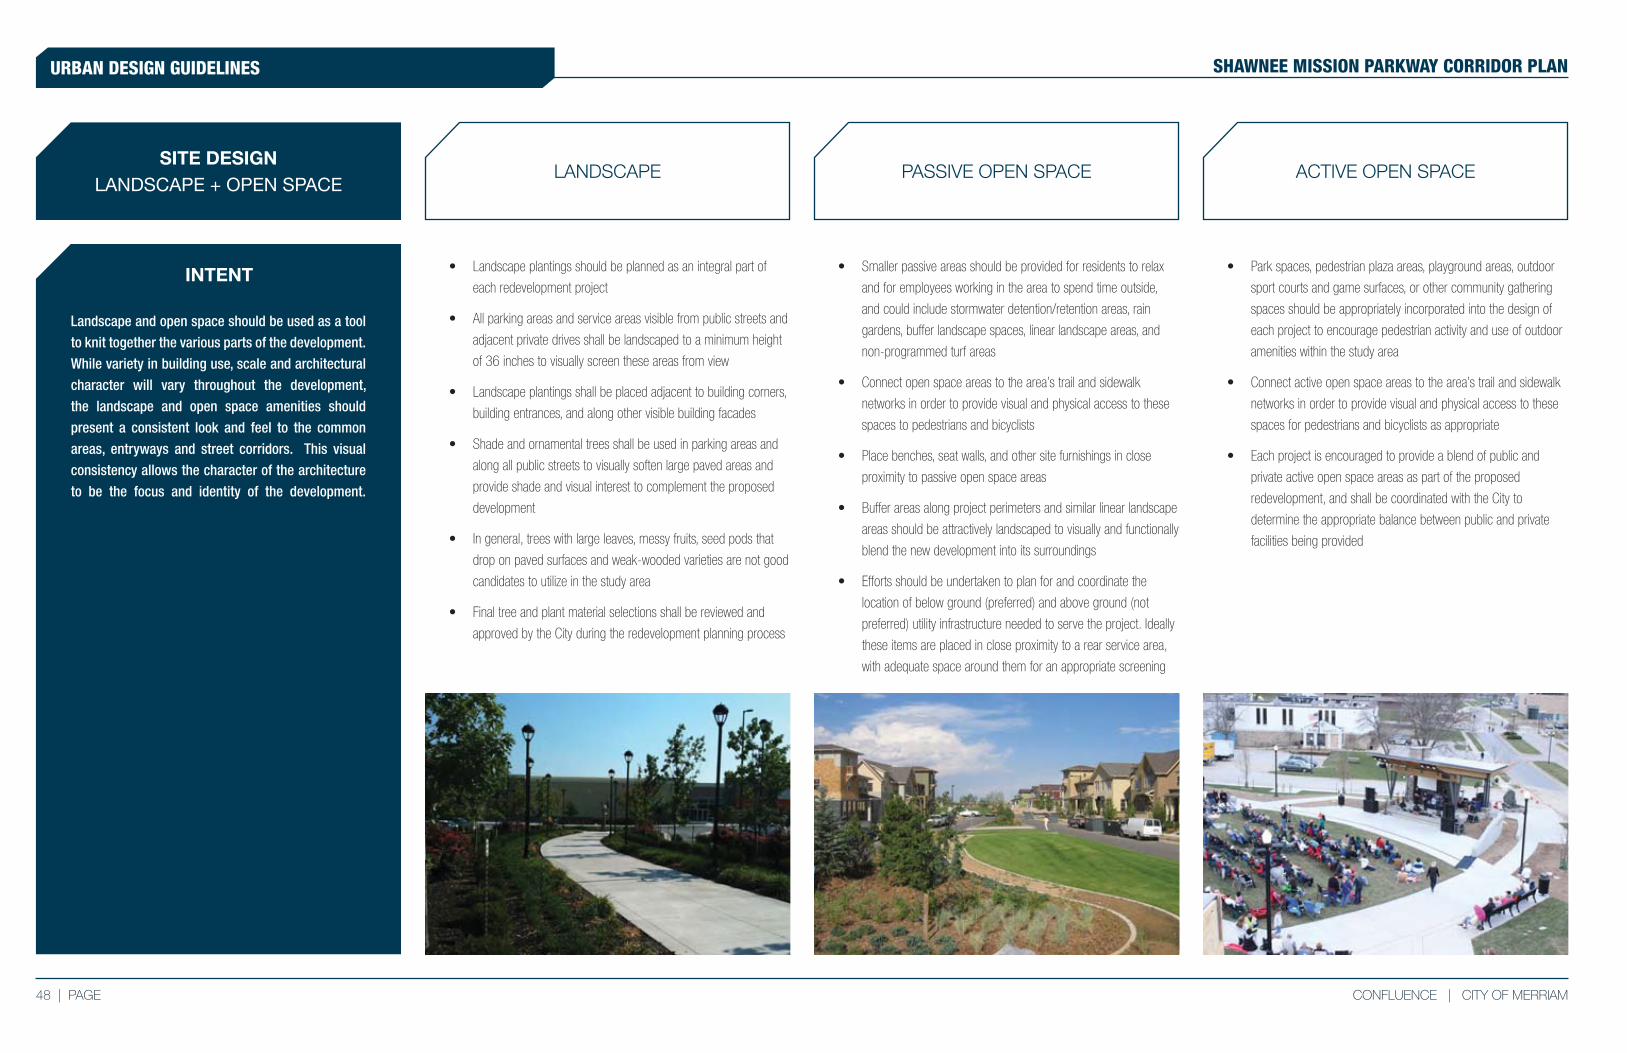
48 | PAGE CONFLUENCE | CITY OF MERRIAM
SHAWNEE MISSION PARKWAY CORRIDOR PLANURBAN DESIGN GUIDELINES
INTENT
ACTIVE OPEN SPACEPASSIVE OPEN SPACELANDSCAPE
• Park spaces, pedestrian plaza areas, playground areas, outdoor
sport courts and game surfaces, or other community gathering
spaces should be appropriately incorporated into the design of
each project to encourage pedestrian activity and use of outdoor
amenities within the study area
• Connect active open space areas to the area’s trail and sidewalk
networks in order to provide visual and physical access to these
spaces for pedestrians and bicyclists as appropriate
• Each project is encouraged to provide a blend of public and
private active open space areas as part of the proposed
redevelopment, and shall be coordinated with the City to
determine the appropriate balance between public and private
facilities being provided
• Smaller passive areas should be provided for residents to relax
and for employees working in the area to spend time outside,
and could include stormwater detention/retention areas, rain
gardens, buffer landscape spaces, linear landscape areas, and
non-programmed turf areas
• Connect open space areas to the area’s trail and sidewalk
networks in order to provide visual and physical access to these
spaces to pedestrians and bicyclists
• Place benches, seat walls, and other site furnishings in close
proximity to passive open space areas
• Buffer areas along project perimeters and similar linear landscape
areas should be attractively landscaped to visually and functionally
blend the new development into its surroundings
• Efforts should be undertaken to plan for and coordinate the
location of below ground (preferred) and above ground (not
preferred) utility infrastructure needed to serve the project. Ideally
these items are placed in close proximity to a rear service area,
with adequate space around them for an appropriate screening
• Landscape plantings should be planned as an integral part of
each redevelopment project
• All parking areas and service areas visible from public streets and
adjacent private drives shall be landscaped to a minimum height
of 36 inches to visually screen these areas from view
• Landscape plantings shall be placed adjacent to building corners,
building entrances, and along other visible building facades
• Shade and ornamental trees shall be used in parking areas and
along all public streets to visually soften large paved areas and
provide shade and visual interest to complement the proposed
development
• In general, trees with large leaves, messy fruits, seed pods that
drop on paved surfaces and weak-wooded varieties are not good
candidates to utilize in the study area
• Final tree and plant material selections shall be reviewed and
approved by the City during the redevelopment planning process
SITE DESIGNLANDSCAPE + OPEN SPACE
Landscape and open space should be used as a tool
to knit together the various parts of the development.
While variety in building use, scale and architectural
character will vary throughout the development,
the landscape and open space amenities should
present a consistent look and feel to the common
areas, entryways and street corridors. This visual
consistency allows the character of the architecture
to be the focus and identity of the development.
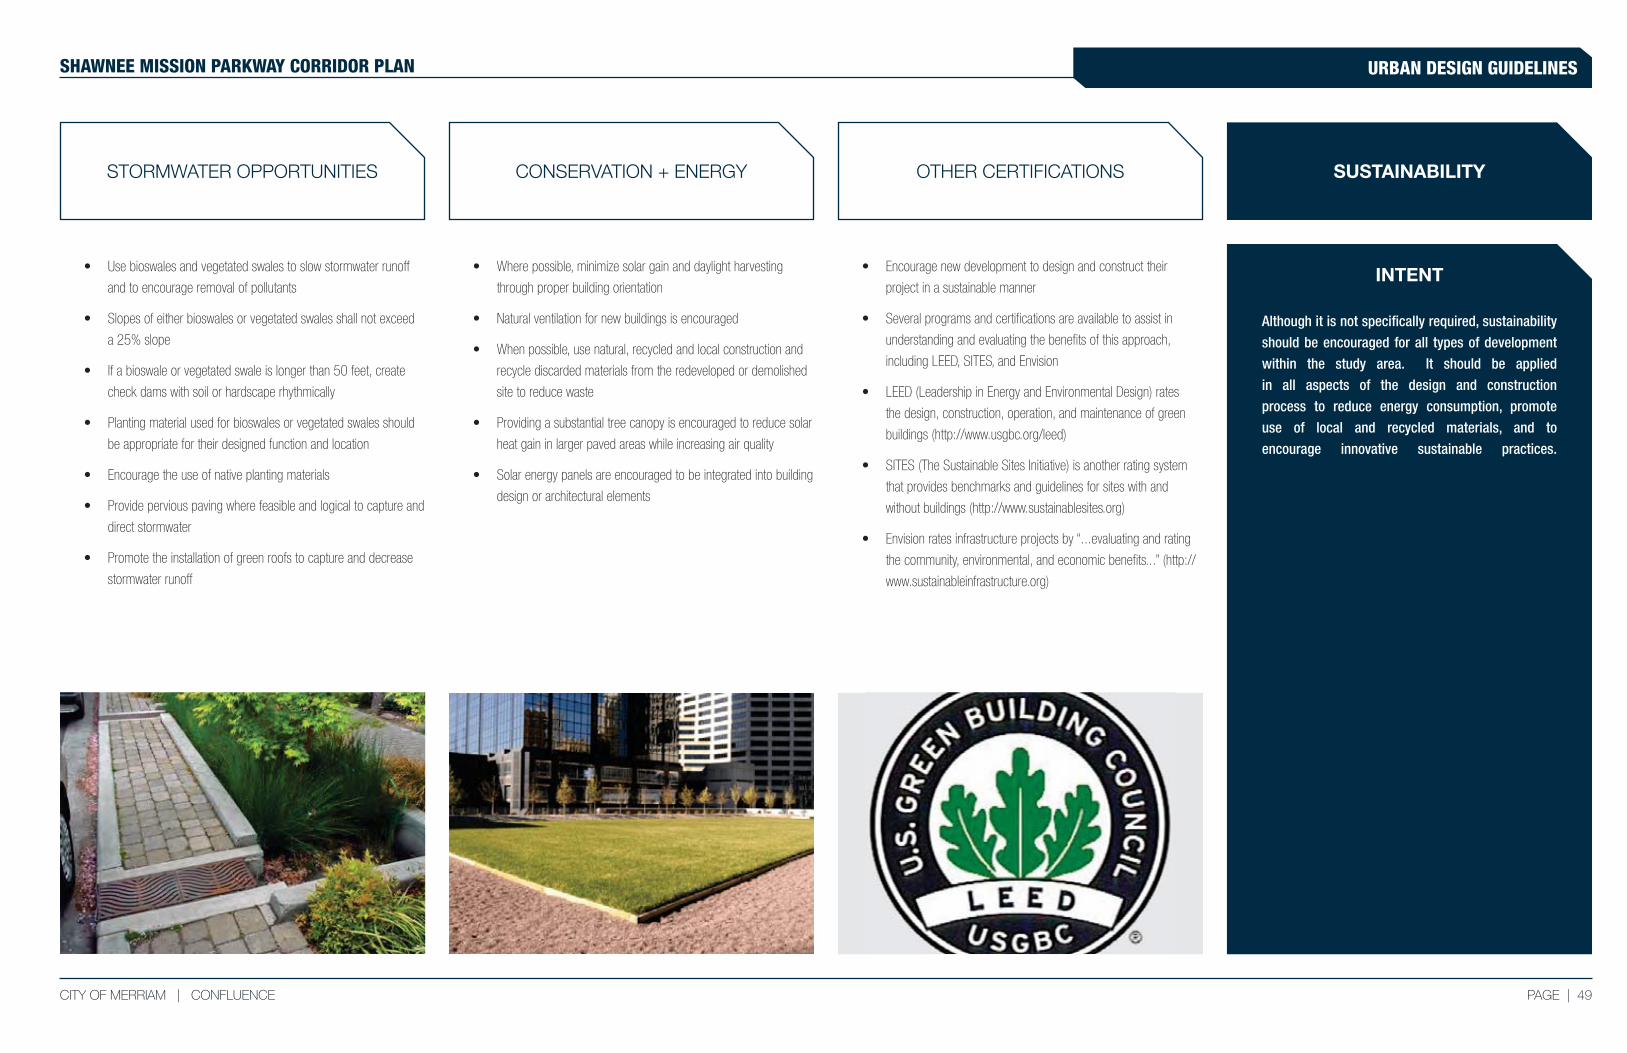
PAGE | 49CITY OF MERRIAM | CONFLUENCE
SHAWNEE MISSION PARKWAY CORRIDOR PLAN URBAN DESIGN GUIDELINES
INTENT
OTHER CERTIFICATIONSCONSERVATION + ENERGYSTORMWATER OPPORTUNITIES
• Encourage new development to design and construct their
project in a sustainable manner
• Several programs and certifications are available to assist in
understanding and evaluating the benefits of this approach,
including LEED, SITES, and Envision
• LEED (Leadership in Energy and Environmental Design) rates
the design, construction, operation, and maintenance of green
buildings (http://www.usgbc.org/leed)
• SITES (The Sustainable Sites Initiative) is another rating system
that provides benchmarks and guidelines for sites with and
without buildings (http://www.sustainablesites.org)
• Envision rates infrastructure projects by “...evaluating and rating
the community, environmental, and economic benefits...” (http://
www.sustainableinfrastructure.org)
• Where possible, minimize solar gain and daylight harvesting
through proper building orientation
• Natural ventilation for new buildings is encouraged
• When possible, use natural, recycled and local construction and
recycle discarded materials from the redeveloped or demolished
site to reduce waste
• Providing a substantial tree canopy is encouraged to reduce solar
heat gain in larger paved areas while increasing air quality
• Solar energy panels are encouraged to be integrated into building
design or architectural elements
• Use bioswales and vegetated swales to slow stormwater runoff
and to encourage removal of pollutants
• Slopes of either bioswales or vegetated swales shall not exceed
a 25% slope
• If a bioswale or vegetated swale is longer than 50 feet, create
check dams with soil or hardscape rhythmically
• Planting material used for bioswales or vegetated swales should
be appropriate for their designed function and location
• Encourage the use of native planting materials
• Provide pervious paving where feasible and logical to capture and
direct stormwater
• Promote the installation of green roofs to capture and decrease
stormwater runoff
Although it is not specifically required, sustainability
should be encouraged for all types of development
within the study area. It should be applied
in all aspects of the design and construction
process to reduce energy consumption, promote
use of local and recycled materials, and to
encourage innovative sustainable practices.
SUSTAINABILITY


SHAWNEE MISSION PARKWAY CORRIDOR PLAN
APPENDIX SECTION 9
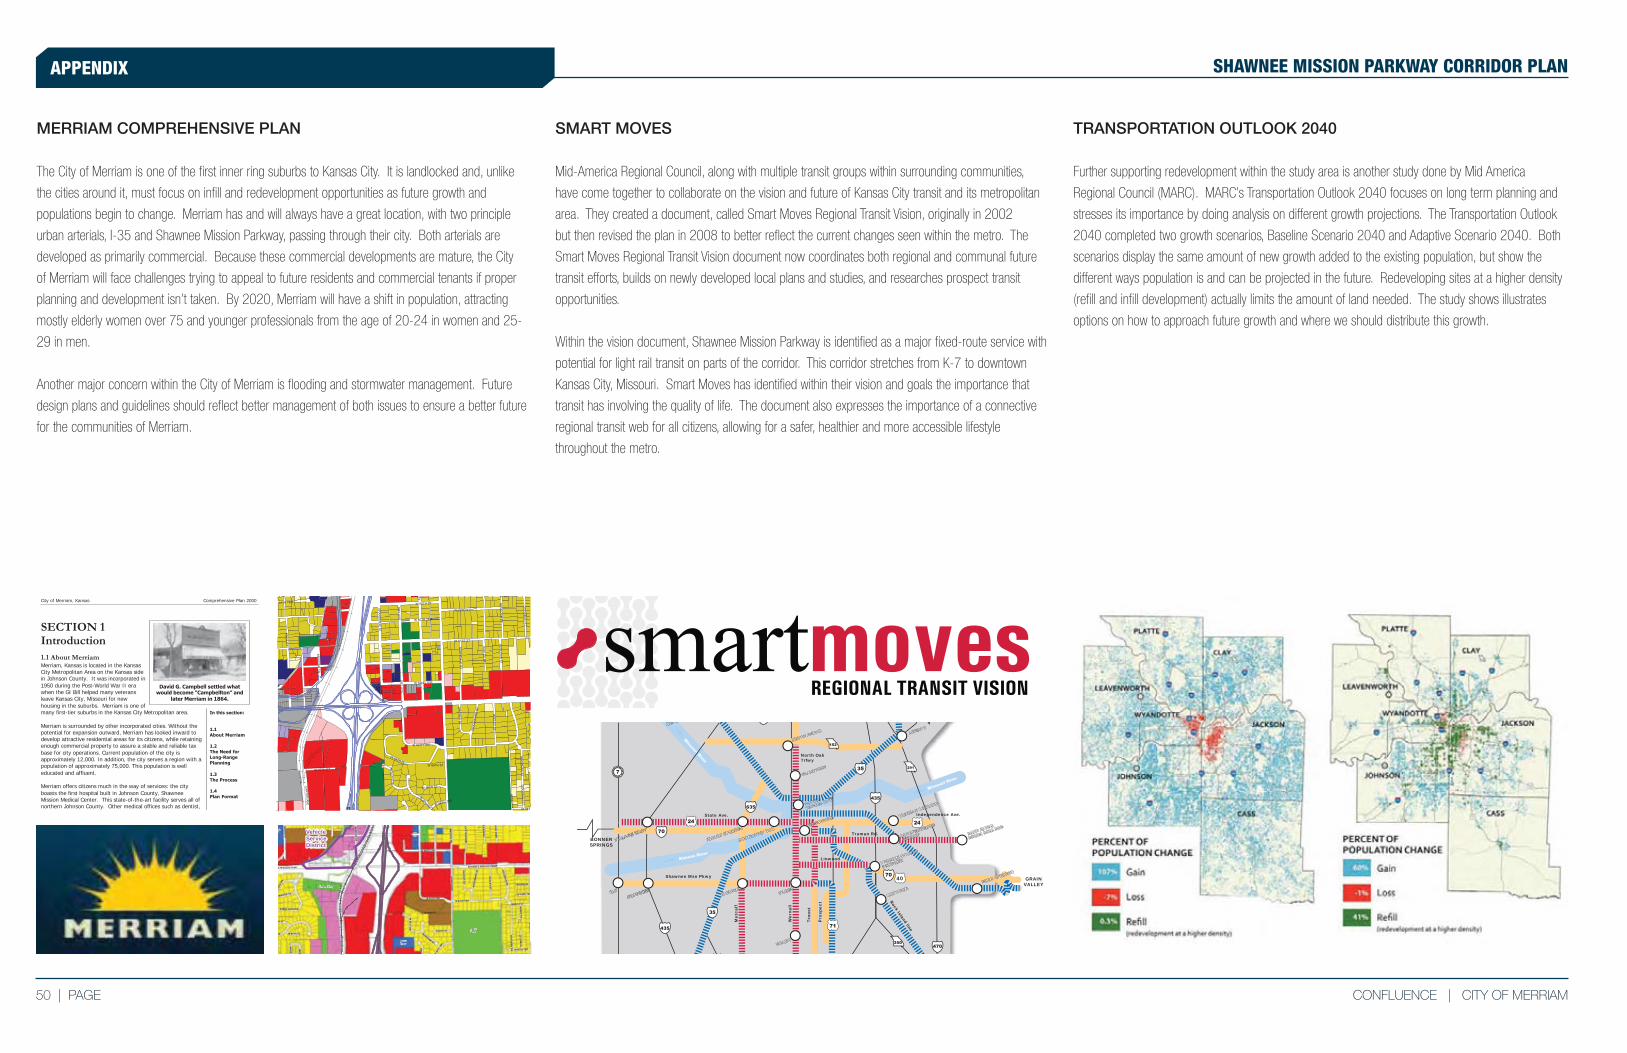
50 | PAGE CONFLUENCE | CITY OF MERRIAM
APPENDIX SHAWNEE MISSION PARKWAY CORRIDOR PLAN
MERRIAM COMPREHENSIVE PLAN
The City of Merriam is one of the first inner ring suburbs to Kansas City. It is landlocked and, unlike
the cities around it, must focus on infill and redevelopment opportunities as future growth and
populations begin to change. Merriam has and will always have a great location, with two principle
urban arterials, I-35 and Shawnee Mission Parkway, passing through their city. Both arterials are
developed as primarily commercial. Because these commercial developments are mature, the City
of Merriam will face challenges trying to appeal to future residents and commercial tenants if proper
planning and development isn’t taken. By 2020, Merriam will have a shift in population, attracting
mostly elderly women over 75 and younger professionals from the age of 20-24 in women and 25-
29 in men.
Another major concern within the City of Merriam is flooding and stormwater management. Future
design plans and guidelines should reflect better management of both issues to ensure a better future
for the communities of Merriam.
SMART MOVES
Mid-America Regional Council, along with multiple transit groups within surrounding communities,
have come together to collaborate on the vision and future of Kansas City transit and its metropolitan
area. They created a document, called Smart Moves Regional Transit Vision, originally in 2002
but then revised the plan in 2008 to better reflect the current changes seen within the metro. The
Smart Moves Regional Transit Vision document now coordinates both regional and communal future
transit efforts, builds on newly developed local plans and studies, and researches prospect transit
opportunities.
Within the vision document, Shawnee Mission Parkway is identified as a major fixed-route service with
potential for light rail transit on parts of the corridor. This corridor stretches from K-7 to downtown
Kansas City, Missouri. Smart Moves has identified within their vision and goals the importance that
transit has involving the quality of life. The document also expresses the importance of a connective
regional transit web for all citizens, allowing for a safer, healthier and more accessible lifestyle
throughout the metro.
TRANSPORTATION OUTLOOK 2040
Further supporting redevelopment within the study area is another study done by Mid America
Regional Council (MARC). MARC’s Transportation Outlook 2040 focuses on long term planning and
stresses its importance by doing analysis on different growth projections. The Transportation Outlook
2040 completed two growth scenarios, Baseline Scenario 2040 and Adaptive Scenario 2040. Both
scenarios display the same amount of new growth added to the existing population, but show the
different ways population is and can be projected in the future. Redeveloping sites at a higher density
(refill and infill development) actually limits the amount of land needed. The study shows illustrates
options on how to approach future growth and where we should distribute this growth.
40
North OakTrfwy
Independence Ave.
Truman Rd.
Shawnee Msn Pkwy
Wor
nall
Rock Island line
Pro
spec
tState Ave.
Troo
st
Linwood
Met
calf
GRAINVALLEY
BONNERSPRINGS
TRUMAN SPORTS
COMPLEX
METRO NORTH
GLADSTONE
LIBERTYKCI A
VILLAGE WEST
NORTH
KANSAS CITY
DOWNTOWN KCK
INDIAN SPRINGS
PLAZA
SHAWNEEK-7MISSION
WALDO
DOWNTOWN TRUMAN LIBRARY
INDEPENDENCE
SQUARE BLUE RIVER
COMM COLLEGE
BLUE SPRINGS
RAYTOWN
HEM
LOC
K S
HA
DLE
Y S
TER
RYD
ALE
ST
W 62ND TER
AN
TIOC
H R
D
SHAWNEE MISSION PKWY
MA
STIN ST
MER
RIA
M LN
EE MISSION PKWY
HOO
D DR
ERWOOD LN
ROBIN HOOD DR
CA
RTE
R A
VE
W 64TH TER
W 64TH PL
TH ST
DR W 65TH PL
WED
WED
D P
W 65TH
DR
BURNHAM ST
W 66TH ST
EBY P
W 6
6TH T
ER
AN
TIOC
H R
D
W 64TH TER
WO
OD
WA
RD
STM
AC
KEY ST
HA
DLEY ST
GO
OD
MA
N D
R
GO
OD
MA
N D
R W 66TH TER
HA
RD
Y ST
HA
RD
Y ST
CR
AIG
RD
W 64TH ST
W 64TH TER
W 65TH ST
arky
AntiochPark
WaterTower
VehicleServiceDistrict
Chatlain Park
CityHall
City of Merriam, Kansas Comprehensive Plan 2000
In this section: 1.1 About Merriam 1.2 The Need for Long-Range Planning 1.3 The Process 1.4 Plan Format
SECTION 1 Introduction1.1 About Merriam Merriam, Kansas is located in the Kansas City Metropolitan Area on the Kansas side in Johnson County. It was incorporated in 1950 during the Post-World War II era when the GI Bill helped many veterans leave Kansas City, Missouri for new housing in the suburbs. Merriam is one of many first-tier suburbs in the Kansas City Metropolitan area.
Merriam is surrounded by other incorporated cities. Without the potential for expansion outward, Merriam has looked inward to develop attractive residential areas for its citizens, while retaining enough commercial property to assure a stable and reliable tax base for city operations. Current population of the city is approximately 12,000. In addition, the city serves a region with a population of approximately 75,000. This population is well educated and affluent. Merriam offers citizens much in the way of services: the city boasts the first hospital built in Johnson County, Shawnee Mission Medical Center. This state-of-the-art facility serves all of northern Johnson County. Other medical offices such as dentist,
David G. Campbell settled what would become “Campbellton” and
later Merriam in 1864.